ionizing radiation in earth's atmosphere and in … · ionizing radiation in earth's...
TRANSCRIPT

Wallace Friedberg Kyle Copeland
Civil Aerospace Medical InstituteFederal Aviation AdministrationOklahoma City, OK 73125
May 2011
Final Report
Ionizing Radiation in Earth’sAtmosphere and in Space Near Earth
DOT/FAA/AM-11/9Office of Aerospace MedicineWashington, DC 20591
OK-11-0024-JAH
Federal AviationAdministration

NOTICE
This document is disseminated under the sponsorship of the U.S. Department of Transportation in the interest
of information exchange. The United States Government assumes no liability for the contents thereof.
___________
This publication and all Office of Aerospace Medicine technical reports are available in full-text from the Civil Aerospace Medical Institute’s publications Web site:
www.faa.gov/library/reports/medical/oamtechreports

i
Technical Report Documentation Page
1. Report No. 2. Government Accession No. 3. Recipient's Catalog No.
DOT/FAA/AM-11/9 4. Title and Subtitle 5. Report Date
May 2011 Ionizing Radiation in Earth's Atmosphere and in Space Near Earth 6. Performing Organization Code
7. Author(s) 8. Performing Organization Report No. Friedberg W, Copeland K
9. Performing Organization Name and Address 10. Work Unit No. (TRAIS) FAA Civil Aerospace Medical Institute P.O. Box 25082 11. Contract or Grant No. Oklahoma City, OK 73125
12. Sponsoring Agency name and Address 13. Type of Report and Period Covered Office of Aerospace Medicine Federal Aviation Administration 800 Independence Ave., S.W. Washington, DC 20591
14. Sponsoring Agency Code
15. Supplemental Notes 16. Abstract The Civil Aerospace Medical Institute of the FAA is charged with identifying health hazards in air travel and in commercial human space travel. This report addresses one of these hazards – ionizing radiation. Ionizing radiation is a subatomic particle of matter or packet of energy (photon) with sufficient energy to eject an orbital electron from an atom. Charged subatomic particles from exploding stars (supernovae) are a constant source of ionizing radiation in the atmosphere and in space. In space another constant source of ionizing radiation is the solar wind from the Sun. The solar wind consists mostly of electrons and protons with energies between 10 and 100 keV. The Sun undergoes an approximately 11-year cycle of rise and decline in activity and during its active phase there is an increased emission of the solar wind and occasional eruptions of high-energy particles (coronal mass ejections). Other sources of ionizing radiation during air travel include radioactive cargo, radioactive substances released into the atmosphere as a result of a nuclear reactor accident or terrorist activity, lightning, and terrestrial gamma-ray flashes. A health effect following exposure to ionizing radiation for which the severity is radiation dose related is called a deterministic effect (non-stochastic effect, tissue reaction). Deterministic effects may occur soon after radiation exposure. For example, nausea and vomiting might be experienced by a space traveler a few hours after receiving a large dose of ionizing radiation while outside a space vehicle during a coronal mass ejection. If the probability (risk) of a health effect after exposure to ionizing radiation is dose related, it is called a stochastic effect. Such effects seldom occur until years after the radiation exposure. Examples of stochastic effects are cancer and genetic disorders. If one or both parents are irradiated prior to conceiving a child, there is a risk of genetic disorders in the child and in its progeny. The report can be used as a source book for instruction on ionizing radiation exposure of air and space travelers.
17. Key Words 18. Distribution Statement
Ionizing Radiation, Cosmic Radiation, Radioactive Contamination, Space Weather, Geoomagnetism, Radiation Exposure Limits, Flight Doses, Radiation Health Risks
Document is available to the public through the Defense Technical Information Center, Ft. Belvoir, VA 22060; and the National Technical Information Service, Springfield, VA 22161
19. Security Classif. (of this report) 20. Security Classif. (of this page) 21. No. of Pages 22. Price Unclassified Unclassified 28
Form DOT F 1700.7 (8-72) Reproduction of completed page authorized


iii
ACKNOWLEDGMENTS
For help in preparing this report we thank: Katherine Wade, Roni G. Anderson, Michael E. Wayda, Dr.
William S. Irving Jr., and Frances E. Duke of the Civil Aerospace Medical Institute; Herbert H. Sauer of the
National Geophysical Data Center, National Oceanic and Atmospheric Administration; Dr. Donald E. Parker
(Professor Emeritus) of the University of Oklahoma Health Sciences Center; Dr. Edgar B. Darden Jr. (retired)
of the Oak Ridge Associated Universities; Daniel Friedberg, Jacqueline Bist, and Anielia M. Bist.

v
CONTENTS
INTRODUCTION . . . . . . . . . . . . . . . . . . . . . . . . . . . . . . . . . . . . . . . . . . . . . . . . . . . . . . . . . . . . . 1IONIZING RADIATION DOSE TERMINOLOGY. . . . . . . . . . . . . . . . . . . . . . . . . . . . . . . . . . . 2 Linear Energy Transfer . . . . . . . . . . . . . . . . . . . . . . . . . . . . . . . . . . . . . . . . . . . . . . . . . . . . . . . 2 Relative Biological Effectiveness . . . . . . . . . . . . . . . . . . . . . . . . . . . . . . . . . . . . . . . . . . . . . . . . 3 Gray . . . . . . . . . . . . . . . . . . . . . . . . . . . . . . . . . . . . . . . . . . . . . . . . . . . . . . . . . . . . . . . . . . . . 3 Gray Equivalent . . . . . . . . . . . . . . . . . . . . . . . . . . . . . . . . . . . . . . . . . . . . . . . . . . . . . . . . . . . . 3 Organ Equivalent Dose (Equivalent Dose) . . . . . . . . . . . . . . . . . . . . . . . . . . . . . . . . . . . . . . . . 3 Dose Equivalent . . . . . . . . . . . . . . . . . . . . . . . . . . . . . . . . . . . . . . . . . . . . . . . . . . . . . . . . . . . 3 Effective Dose . . . . . . . . . . . . . . . . . . . . . . . . . . . . . . . . . . . . . . . . . . . . . . . . . . . . . . . . . . . . . . 4 Effective Dose Equivalent . . . . . . . . . . . . . . . . . . . . . . . . . . . . . . . . . . . . . . . . . . . . . . . . . . . . . 4 Sievert . . . . . . . . . . . . . . . . . . . . . . . . . . . . . . . . . . . . . . . . . . . . . . . . . . . . . . . . . . . . . . . . . . . 4EARTH’S ATMOSPHERE . . . . . . . . . . . . . . . . . . . . . . . . . . . . . . . . . . . . . . . . . . . . . . . . . . . . . . . 5 Atmospheric Layers . . . . . . . . . . . . . . . . . . . . . . . . . . . . . . . . . . . . . . . . . . . . . . . . . . . . . . . . . 5EARTH’S MAGNETIC FIELD . . . . . . . . . . . . . . . . . . . . . . . . . . . . . . . . . . . . . . . . . . . . . . . . . . . 5GALACTIC COSMIC RADIATION . . . . . . . . . . . . . . . . . . . . . . . . . . . . . . . . . . . . . . . . . . . . . . . 7 Composition and Sources . . . . . . . . . . . . . . . . . . . . . . . . . . . . . . . . . . . . . . . . . . . . . . . . . . . . . 7 Galactic Cosmic Radiation in Earth’s Atmosphere . . . . . . . . . . . . . . . . . . . . . . . . . . . . . . . . . . 8THE SUN AND ITS EMISSIONS . . . . . . . . . . . . . . . . . . . . . . . . . . . . . . . . . . . . . . . . . . . . . . . . 10 Layers of the Sun’s Atmosphere . . . . . . . . . . . . . . . . . . . . . . . . . . . . . . . . . . . . . . . . . . . . . . . . 10 Sunspots . . . . . . . . . . . . . . . . . . . . . . . . . . . . . . . . . . . . . . . . . . . . . . . . . . . . . . . . . . . . . . . . . 10 Solar Wind . . . . . . . . . . . . . . . . . . . . . . . . . . . . . . . . . . . . . . . . . . . . . . . . . . . . . . . . . . . . . . 10 Coronal Mass Ejection and Solar Flare . . . . . . . . . . . . . . . . . . . . . . . . . . . . . . . . . . . . . . . . . . 10 Solar Proton Event . . . . . . . . . . . . . . . . . . . . . . . . . . . . . . . . . . . . . . . . . . . . . . . . . . . . . . . . . 10RECOMMENDED IONIZING RADIATION DOSE LIMITS . . . . . . . . . . . . . . . . . . . . . . . . . 10 U.S. Federal Aviation Administration . . . . . . . . . . . . . . . . . . . . . . . . . . . . . . . . . . . . . . . . . . . 10 International Commission on Radiological Protection . . . . . . . . . . . . . . . . . . . . . . . . . . . . . . 11 National Council on Radiation Protection and Measurements . . . . . . . . . . . . . . . . . . . . . . . . 11 European Union . . . . . . . . . . . . . . . . . . . . . . . . . . . . . . . . . . . . . . . . . . . . . . . . . . . . . . . . . . . 11IONIZING RADIATION EXPOSURE DURING AIR AND SPACE TRAVEL . . . . . . . . . . . . . 12 Radiation Doses Received During Air Travel . . . . . . . . . . . . . . . . . . . . . . . . . . . . . . . . . . . . . 12 Radiation Doses Received During Space Travel . . . . . . . . . . . . . . . . . . . . . . . . . . . . . . . . . . . . 15HEALTH EFFECTS OF IONIZING RADIATION . . . . . . . . . . . . . . . . . . . . . . . . . . . . . . . . . . 15 Deterministic Effects (Non-Stochastic Effects, Tissue Reactions) . . . . . . . . . . . . . . . . . . . . . . 15 Stochastic Effects . . . . . . . . . . . . . . . . . . . . . . . . . . . . . . . . . . . . . . . . . . . . . . . . . . . . . . . . . . 17 Prenatal Irradiation . . . . . . . . . . . . . . . . . . . . . . . . . . . . . . . . . . . . . . . . . . . . . . . . . . . . . . . . . 17RADIOACTIVE CONTAMINATION IN EARTH’S ATMOSPHERE . . . . . . . . . . . . . . . . . . . 17LIGHTNING AND TERRESTRIAL GAMMA-RAY FLASHES . . . . . . . . . . . . . . . . . . . . . . . . . 21CONCLUDING REMARKS . . . . . . . . . . . . . . . . . . . . . . . . . . . . . . . . . . . . . . . . . . . . . . . . . . . . 21REFERENCES . . . . . . . . . . . . . . . . . . . . . . . . . . . . . . . . . . . . . . . . . . . . . . . . . . . . . . . . . . . . . . . 21


1
IonIzIng RadIatIon In EaRth’s atmosphERE and In spacE nEaR EaRth
INTRODUCTION
The U.S. Federal Aviation Administration’s (FAA’s) Civil Aerospace Medical Institute (CAMI) is charged with identifying health hazards in air travel and in com-mercial human space travel. This report addresses one of these hazards – ionizing radiation.
Air and space travelers are constantly exposed to galactic cosmic radiation (GCR), which is ionizing radiation from exploding stars (supernovae). They are also exposed to solar cosmic radiation (SCR), which is ionizing radiation from the Sun. Other sources of ionizing radiation include: radioactive air cargo, radioactive substances released into the atmosphere from a detonated nuclear weapon or from a nuclear reactor as the result of an accident or terrorist attack, lightning, and terrestrial gamma-ray flashes (TGFs).
Radiation is energy in transit. The energy travels as (a) subatomic particles of matter (e.g., electrons, neutrons, protons, alpha particles, pions, muons), and (b) photons, which are packets of electromagnetic energy (e.g., visible light, ultraviolet [UV] light, radio waves, microwaves, gamma radiation, X-radiation).
Ionizing radiation is a subatomic particle or photon suf-ficiently energetic to directly or indirectly eject an orbital electron from an atom. Photons and electrically-charged particles ionize directly by means of electromagnetism. Neutrons cannot ionize directly, but they can ionize indirectly. On impacting the nucleus of an atom (e.g., atmospheric nitrogen or oxygen), a neutron can (a) in-duce emission of a gamma-radiation photon by nuclear excitation, or (b) break apart the nucleus and release protons (which can ionize directly), neutrons (which can decay into protons and electrons), and pions (which can undergo decay processes shown in Table 1).
Muons are the main contributor to dose at low altitudes. Neutral pions decay so rapidly that they are unlikely to impact
an atom before decaying. Neutrinos and antineutrinos pass through matter with almost no effect, and usually they are not considered in dose calculations.
Wilhelm Conrad Roentgen in 1895 discovered ionizing radiation while experimenting with a Crookes tube (a primi-tive vacuum tube) (2). Working in a dark room with the tube in a carton, Roentgen found that a paper plate coated with barium platinocyanide (a chemical that fluoresces when ex-posed to UV light from the Sun), which was outside the carton and 9 feet away from the tube, emitted a fluorescent light when the tube was supplied with electric current. Roentgen concluded that an invisible radiation from the tube, which he called X-rays, penetrated the wall of the carton and trav-eled to the barium platinocyanide. He could not deflect the radiation with a magnetic field, and he found that objects in the path of the radiation showed variable transparency. With a photographic plate, Roentgen used the device to make a picture of the skeleton of his wife’s hand (3).
Antoine-Henri Becquerel in 1896 discovered a natural source of ionizing radiation while investigating phospho-rescence (4). He observed that a photographic plate covered with an opaque paper was fogged when placed near uranyl potassium sulfate (a uranium salt). Becquerel demonstrated that unlike X-rays, the radiation from uranium could be deflected by a magnetic field and therefore consisted of charged particles.
Theodore Wulf measured ionizing radiation levels with an electroscope at the bottom and at the top of the Eiffel Tower (300 m high) and found that radiation levels at the top of the tower were higher than at ground level (5). In 1912, Victor F. Hess measured ionization rates with an electroscope during balloon flights (6). He found that at an altitude of 5 km the ionization rate was several times the rate at ground level. Hess concluded that a highly penetrating radiation enters the atmosphere from above. The radiation is now called cosmic radiation. Listed in
Table 1. Decay of pions and of their muon decay products (1). Particle
Decay Products
Half-life (seconds)
positive pion 1 positive muon + 1 muon-neutrino 1.8 x 10⁻⁸
negative pion 1 negative muon + 1 muon-antineutrino 1.8 x 10⁻⁸
neutral pion 2 gamma-radiation photons 6 x 10-17
* * * * positive muon 1 positron (positive electron) + 1 electron-neutrino + 1 muon-antineutrino 1.5 x 10⁻⁶
negative muon 1 electron + 1 electron-antineutrino + 1 muon-neutrino 1.5 x 10⁻⁶

2
Table 2 are radiation levels received by humans on Earth from natural sources.
Living material consists of molecules composed of atoms held together by electron bonds. Ejection of orbital electrons can break the bonds that combine atoms as molecules. Particularly harmful to a biological system is the breakup of molecules of deoxyribonucleic acid (DNA). DNA carries information required for the function and reproduction of an organism. Improper repair of DNA damaged by ionizing radiation or by free radicals pro-duced by ionizing radiation may lead to cancer (8). Free radicals are also believed to have a role in the etiology of atherosclerosis, rheumatoid arthritis, and other diseases. A free radical is an electrically neutral atom or molecule containing one or more unpaired electrons in the valence shell, and this makes it very reactive. Ionizing radiation particles produce free radicals when they react with the water in cells and with some cellular components.
Visible light, UV light, radio waves, and microwaves are non-ionizing radiations. A photon of non-ionizing radiation or a subatomic particle insufficiently energetic to eject an orbital electron may interact with an atom by electron excitation. This process forces an orbital elec-tron to a higher energy level. An electron so affected is in an unstable energy level and soon falls back to a more stable level, releasing energy in the form of non-ionizing photons. The photons released include thermal photons and light photons of different wavelengths. The aurora borealis (northern polar lights) and the aurora australis (southern polar lights) result from the excitation of atmospheric atoms by charged particles from the Sun (solar wind). Auroras are commonly centered over the magnetic poles of the Earth, between 60o and 70o north and south geographic latitudes. Occasionally, during
high solar activity they are seen at lower latitudes. Also during high solar activity, some particles from the inner Van Allen radiation belt (described in the section entitled Earth’s Magnetic Field) may enter the atmosphere and contribute to the aurora display.
IONIZING RADIATION DOSE TERMINOLOGY
Radiation dose is the amount of energy absorbed by a medium. The medium could be the human body or a particular tissue or organ in the body. Various terms are used to quantify the absorbed dose and its biological impact.
Linear Energy TransferLinear energy transfer (LET, Table 3) is the average
amount of energy per unit track length imparted to a medium by ionizing radiation of a specified energy, when penetrating a short distance. The energy imparted to the medium includes energy from any secondary radiation,
Table 2. Typical worldwide annual doses of ionizing radiation to an adult human at ground level, from natural sources (7).
Effective dose (mSv a) galactic cosmic radiation 0.39 terrestrial gamma radiation b 0.46 radionuclides in the body (except radon) c 0.23 radon and its decay products d 1.3 Total 2.38 a Described in the section entitled Ionizing Radiation Terminology. b Sources include uranium-238, radium-226, thorium-232, potassium-40, and cesium-137. c Potassium-40 and carbon-14. d Radon-222 is a decay product of radium-226, which is a decay product of uranium-238. Some areas have high concentrations of uranium-238 in the soil. Radon-222, a gas, leaks into homes from the ground underneath. Inhaled radon travels through the bronchial tubes to the lungs and decays into polonium-210, a solid.
Table 3. Typical LET values of various radiations.
Type of radiation LET (keV/µm)
cobalt-60 gamma-radiation 0.3 250 kVp X-radiation 2. 10 MeV protons 4.7 150 MeV protons 0.5 recoil protons from fission neutrons 45. 14 MeV neutrons 12. 2.5 MeV alpha particles 166. 2 GeV Fe nuclei 1000.

3
such as nuclear particles released from a nucleus impacted by a high-energy neutron. LET is usually expressed in units of keV/μm (thousand electron volts per microm-eter). A radiation with an LET <10 keV/μm is generally considered low LET.
Relative Biological EffectivenessRelative biological effectiveness (RBE) is the ratio of
absorbed dose of a reference radiation (usually 250 kVp X-radiation or cobalt-60 gamma-radiation) to absorbed dose of the radiation in question, in producing the same magnitude of the same effect in a particular experimental organism or tissue.
The RBE is influenced by the biological endpoint and the LET of the radiation. With killing human cells as the endpoint, the RBE increases with an increase in LET to about 100 keV/μm and then decreases with further increase in LET. At LET 100 keV/μm, the average separation between ionizing events is close to the diameter of the DNA double helix. Therefore, a radiation with LET 100 keV/μm can most efficiently produce a double-strand break in a DNA molecule by a single LET track (9). Double-strand breaks in DNA molecules are the main cause of biological effects.
Gray Gray (Gy) is the International System (SI) unit of
absorbed dose of ionizing radiation. One Gy is 1 joule (J) of radiation energy absorbed per kilogram (kg) of matter. The rad (radiation absorbed dose) is an older unit of absorbed dose of ionizing radiation (1 Gy = 100 rads). The roentgen (R) is another older unit of ionizing radiation. One R is the amount of X-radiation or gamma radiation that creates 1 electrostatic unit (esu) of ions in 1 milliliter (ml) of air at 00 C and 760 torr (760 mm mercury, 1 atm). The effect of 1 R and 1 rad on dry air is about the same.
Gray Equivalent Gray equivalent (Gy-Eq) is a measure of the capacity of
ionizing radiation to cause deterministic effects (described in the section entitled Health Effects of Ionizing Radiation).
Gy-Eq is Gy multiplied by a recommended RBE (Table 4). The RBE takes into account that ionizing radiation of different types and energies affects living organisms differently.
Organ Equivalent Dose (Equivalent Dose)Organ equivalent dose is the total absorbed dose to a
specific tissue or to a conceptus, after the absorbed dose from each radiation incident on the tissue or conceptus is multiplied by a radiation weighting factor (w
R, Table 5).
For multiple radiations, the organ equivalent dose is the sum of the individual organ equivalent doses. w
R takes
into account the effectiveness of the primary radiation (or radiations) and all secondary radiations. w
R is an RBE
for stochastic effects.
Dose Equivalent Dose equivalent is the total absorbed dose to a specific
tissue or a conceptus, after the absorbed dose from each radiation incident on the tissue or conceptus is multiplied
Table 4. Gy x RBE = Gy-Eq (10).
Type and energy of the radiation RBE
low-LET radiations (e.g., photons, electrons) 1.0 protons >2 MeV 1.5 heavy ions (e.g., helium, carbon, neon, argon) 2.5 neutrons <5 MeV 6.0 5 MeV 5.0 >5 MeV 3.5 Example Calculation of Gy-Eq: A whole-body dose consisting of 4 Gy of 50 MeV protons and 2 Gy of 50 MeV neutrons, (4 Gy x RBE 1.5) + (2 Gy x RBE 3.5) = 13 Gy-Eq.
Table 5. Radiation weighting factor(wR); takes into account the type and energy of the radiation (11).
Type and energy of the radiation wR
low-LET radiation: photons, electrons, muons 1 protons,a charged pions 2 alpha particles,b fission fragments, heavy ions 20 neutrons (energy, En): En <1 MeV 2.5 + 18.2 x exp[-(ln(En))2 /6] 1 < En ≤50 MeV 5.0 + 17.0 x exp[-(ln(2En))2 /6] En >50 MeV 2.5 + 3.25 x exp[-(ln(0.04En))2 /6] a Hydrogen-2 (deuterons) and hydrogen-3 (tritons) have the same LET and track structure as protons, therefore the same radiation weighting factor (wR = 2) seems appropriate. b Helium-3 (helions) has nearly the same LET and track structure as alpha particles, therefore the same radiation weighting factor (wR = 20) seems appropriate.

4
by a radiation quality factor (Q, Table 6). For multiple radiations, the dose equivalent is the sum of the individual dose equivalents. Q relates the LET of the radiation to its RBE. Dose equivalent is no longer used by the Interna-tional Commission on Radiological Protection (ICRP) but is still used by the National Council on Radiation Protection and Measurements (NCRP) and the National Aeronautics and Space Administration (NASA). Dose equivalent is used by NASA as a surrogate for organ equivalent dose in space radiation applications.
Effective DoseEffective dose is the total sex-averaged, whole-body
absorbed dose, after the absorbed dose to each tissue from each radiation incident on the body and/or from each internal radiation emitter is multiplied by a radiation weighting factor (w
R, Table 5) and by a tissue weighting
factor (wT, Table 7). w
T takes into account the risk of
stochastic effects from irradiation of a particular tissue.
Effective Dose EquivalentEffective dose equivalent is the total sex-averaged,
whole-body absorbed dose, after the absorbed dose to each tissue or organ from each radiation incident on the body and/or from each internal radiation emitter is multiplied by a radiation quality factor (Q, Table 6) and by a w
T (Table 7). NCRP considers effective dose
equivalent as an acceptable approximation of effective dose, and they use it as a surrogate for effective dose in space radiation applications.
Sievert Sievert (Sv) is the SI unit of organ equivalent dose,
dose equivalent, effective dose, and effective dose equivalent. It is a measure of harm to the body from stochastic effects of ionizing radiation (described in the section entitled Health Effects of Ionizing Radiation). The roentgen equivalent man (rem) is an older measure of harm (1 Sv = 100 rem).
Table 6. Quality factor (Q); takes into account the LET of the radiation (12).
LET (keV/µm) Q a <10 1 10-100 0.32 x LET - 2.2 >100 300 x LET -1/2 a Q should be rounded to the nearest whole number.
Table 7. Tissue weighting factor (wT); takes into account where radiation energy is deposited (11).
Where radiation energy deposited wT Σ wT
remainder tissues,a red bone-marrow, breast, colon, lung, stomach 0.12 0.72 gonads 0.08 0.08 bladder, esophagus, liver, thyroid 0.04 0.16 bone surface, brain, salivary glands, skin 0.01 0.04
Total 1.00 a Remainder tissues (males 13, females 13): adrenals, extrathoracic region, gall bladder, heart, kidneys, lymph nodes, muscle, oral mucosa, pancreas, prostate, small intestine, spleen, thymus, uterus/cervix. For each remainder tissue wT = 0.12/13 = 0.00923. (females do not have a prostate and males do not have a uterus/cervix). Example Estimate effective dose to a Reference Person (adult) from external isotropic exposure to
heavy ions: (1) Estimate absorbed dose in each tissue of an adult female and of an adult male, using a Monte
Carlo transport code such as MCNPX (from Radiation Safety Information Computing Center at Oak Ridge National Laboratory, Oak Ridge, TN), and mathematical models of the bodies, such as the ICRP Reference Phantoms (13).
(2) For each tissue, multiply absorbed dose by the appropriate wR (Table 5). Tissues that received only trivial amounts of radiation may be excluded from dose calculations.
(3) For each tissue, average wR-adjusted absorbed doses to the female and the male. (4) For each tissue, multiply sex-averaged wR-adjusted absorbed dose by the appropriate wT
(Table 7). (5) Effective dose to the Reference Person is the sum of sex-averaged wR-adjusted and wT-adjusted
absorbed doses to tissues.

5
EARTH’S ATMOSPHERE
Gravity retains Earth’s atmosphere. The content (per-cent by volume) of the atmosphere (dry air) is about 78% nitrogen, 21% oxygen, 0.93% argon, 0.034% (average) carbon dioxide, and trace amounts of other gases (14). A variable amount, 0.001-7%, of water vapor is also present (14). For aviation, the boundary between the atmosphere and outer space is 100 km (328 kft) above Earth’s surface.
Atmospheric LayersAtmospheric layers, from lower to higher, are: tro-
posphere, stratosphere, mesosphere, thermosphere, and exosphere. With increase in altitude, temperatures decrease in the troposphere, increase in the stratosphere, decrease in the mesosphere, and increase in the thermosphere (14).
Troposphere: extends from Earth’s surface to between 8-10 km near the poles and 16-18 km in tropical regions, with some variation due to weather conditions (14). It contains about 80% of the atmosphere’s mass, and it is where most daily weather occurs that is observed from the ground (15). Traditional subsonic jetliners fly at altitudes of 6-12 km (20-40 kft). The Concorde SST cruised at 14-18 km (45-60 kft).
Tropopause: the boundary between the troposphere and the stratosphere (14). The tropopause is where air ceases to cool with height, and it is almost completely dry (14).
Stratosphere: extends from the troposphere to about 50 km (14, 15). The ozone and oxygen in the stratosphere absorb much of the UV radiation from the Sun (15). UV radiation can be very harmful to living tissues.
Stratopause: is the level of transition between the stratosphere and the mesosphere (14).
Mesosphere: extends from 50 km to 80-85 km (15). Most meteors become visible between about 65 and 120 km above the Earth and disintegrate at altitudes of 50-95 km (16). Millions enter Earth’s atmosphere every day.
Mesopause: the level of transition between the meso-sphere and the thermosphere (14).
Thermosphere: extends from 80-85 km to more than 500 km (15). The International Space Station (ISS) orbits Earth at an altitude of 330-400 km, in the thermosphere (17).
Exosphere: the highest atmospheric layer. It is where Earth’s atmosphere merges with interplanetary space (14). In this region the probability of interatomic collisions is so low that some atoms traveling upward have enough velocity to escape Earth’s gravity (15).
Ionosphere: contains both ions and neutral molecules and extends from about 80 km to 480 km (14). The ionosphere typically overlaps the thermosphere and exo-sphere, and it is the inner edge of the magnetosphere. The
magnetosphere is the region around Earth influenced by Earth’s magnetic field (geomagnetic field) (18). This region is used to reflect radio signals over long distances and it is where auroral displays occur (14). On rare occasions, known as Polar Cap Absorption (PCA) events, the solar radiation increases ionization and enhances absorption of radio signals passing through the region, enough to absorb most (if not all) transpolar high-frequency radio transmissions (19). In extreme cases, PCA events can last several days, but they usually last less than one day (19).
EARTH’S MAGNETIC FIELD
According to the dynamo theory, most of the geomag-netic field is generated by the rotation of liquid iron in Earth’s outer core (20). Other sources include the ring current (discussed later in this section) and magnetism in Earth’s rocks. At Earth’s surface, the geomagnetic field is predominantly an axial dipole (like a bar magnet), with magnetic field lines radiating between its north and south magnetic poles. Magnetic field lines are used to indicate the strength and direction of a magnetic field. On a map of geomagnetic field lines, the strength of the field is represented by the density of the field lines. The denser the field lines, the stronger the magnetic field. Thus, the field is strongest where the field lines are closest together. The direction of the geomagnetic field is the same as the field lines. It is usually indicated by arrows drawn on the field lines, which run from the north magnetic pole (near the south geographic pole) to the south magnetic pole (near the north geographic pole).
The geomagnetic field is not uniformly produced, and the coordinates of the magnetic poles change frequently. The polarity has reversed at irregular intervals of about one million years, and the field is becoming weaker at such a rate that it will disappear in about 2,000 years. However, this may only be a temporary trend (18). If the magnetic field does disappear, the radiation belts (described below) would disappear and worldwide GCR levels would increase to what they are in the polar regions.
The direction of the magnetic force on a moving charged particle is at right angles (perpendicular) to both the particle’s direction of motion (v) and direction of the magnetic field lines (B). The magnitude of the magnetic force (F) is proportional to the particle’s electric charge (q), the particle’s speed (v), the strength of the magnetic field (B), and the sine of the angle between the particle’s direction of motion and the direction of the magnetic field (∠ v B):
F = q v B sin (∠ v B)Thus, a charged particle moving parallel to the magnetic
field (i.e., entering the geomagnetic field at a magnetic pole) experiences no deflection from its direction of

6
motion (sin[∠ v B = 0o] = 0), whereas a particle moving at a right angle to the magnetic field (i.e., entering the geomagnetic field at the magnetic equator) experiences a maximum in the magnitude of the force deflecting it from its direction of motion (sin[∠ v B= 90o] = 1).
At the geomagnetic equator where geomagnetic field lines are parallel to Earth’s surface, only particles ≥100 MeV can reach Earth’s atmosphere (21). Mov-ing from the geomagnetic equator towards a magnetic pole, the field lines gradually become perpendicular to the Earth’s surface and therefore more parallel to the trajectories of the incoming ions, and more ions enter the atmosphere. At the magnetic poles, field lines are perpendicular to Earth’s surface and ions of any energy can reach Earth’s atmosphere.
Figure 1 shows the effective dose rate at 20o E lon-gitude, as related to geographic latitude. Dose rates in the figure are calculated for mean solar activity in the period January 1958 through December 2008. The calculations were made with CARI-6P (23) using NCRP Report 116 recommendations (24). If one were to fly an aircraft at a constant altitude from the geomagnetic equator towards the north or south magnetic pole, the dose rate would increase with distance from the equator. At high latitudes, shielding by the geomagnetic field is minimal. The primary radiation shielding of the aircraft would be the atmosphere, with some shield-ing by magnetic fields carried by the solar wind (the
interplanetary magnetic field) even when the Sun is quiet. The North Atlantic Air Route, which is among the busiest in the world, is mostly at high latitudes.
The geomagnetic field traps charged particles in two toroidal (donut-shaped) overlapping radiation belts. The belts encircle the planet and are confined to an area from about 65o N to 65o S of the geographic equator (14). The radiation belts are called Van Allen radiation belts in honor of Dr. James A. Van Allen, who reported the inner belt in 1958 (21).
The inner radiation belt (nearest Earth) extends above Earth’s surface, from about 200 km to 11, 000 km above the geomagnetic equator and is centered at about 3,000 km (18). It consists mostly of electrons and 10-100 MeV protons. Protons are the most important contributor to the dose (10). The flux of high-energy protons is relatively constant (14). Protons >50 MeV are believed to originate from the decay of free neutrons backscattered into the inner belt after being dislodged from atmospheric atoms by GCR particles (14). The half-life of a free neutron is 10.2 minutes (mean life 885.3 seconds [25]), and some decay into a proton and an electron while in the inner belt. At the geomagnetic equator, protons form a continuous distribution, with peak fluences of 400 MeV protons at 2,000 km, 4 MeV protons at 6,000 km, and 0.3 MeV protons at 13,000 km (10).
Figure 1. Effective dose rate from GCR, as related to geographic latitude at selected altitudes at 20o E longitude. Dose rates are for the mean solar activity from January 1958 through December 2008. The heliocentric potential used in estimating dose rates is based on the average Deep River equivalent count rate for the 51-year period reported (22).

7
The dipole axis of Earth’s magnetic field is tilted 11.1o from the rotation axis and offset 515 km from the rotation axis (10). As a consequence, the lower boundary of the inner radiation belt dips closest to Earth in a region off the coast of Brazil called the South Atlantic Anomaly, which extends from about 0o to 60o W longitude and 20o to 50o S latitude (geographic coordinates). The daily dose of ionizing radiation to occupants of the ISS is usually about 0.5-1.2 mSv, with approximately 25% of the dose coming from protons encountered when passing through the South Atlantic Anomaly and the rest from GCR (26).
The outer radiation belt, the belt furthest from Earth, consists mostly of electrons (10). It extends from about 11,000 km to 70,000 km in altitude (27). The center of the belt is at about 22,000 km at solar maximum and 26,000 km at solar minimum (10). The most energetic electrons have energies >1.0 MeV and are centered at about 19,000-25,000 km (18). The electron flux in the outer belt varies considerably during a geomagnetic storm because of the fluctuating intensity of the solar wind. The main radiation hazard to space travelers in the outer belt is soft X-rays, produced when electrons decelerate in the shell of the space vehicle (28).
Individual particles in the radiation belts move to-wards a magnetic pole in spiral paths along geomagnetic field lines (21). As they approach a pole, the particles are reflected back towards the opposite pole. As they spiral back and forth between the magnetic poles, many low-energy protons are lost from the inner belt by interacting with atmospheric constituents (10). The proton spectrum decreases sharply at energies >500 MeV, because high-energy particles are not easily held by the magnetic field. The flux of trapped particles is highest over the geomagnetic equator, and there are relatively few trapped particles over the geomagnetic poles (21).
As they spiral back and forth between the magnetic poles, positive particles drift westward and electrons drift eastward. This creates a westward-flowing electric current called ring current, which overlaps the outer radiation-belt at altitudes of 13,000-25,000 km at the geomagnetic equator (18). The magnetic field produced by the ring current opposes the equatorial geomag-netic field at Earth’s surface (14). During geomagnetic storms, charged particles injected into the Van Allen radiation belts from the outer magnetosphere cause a sharp increase in the ring current, with a corresponding decrease in Earth’s equatorial magnetic field (18). The injected particles precipitate out of the magnetosphere into the upper atmosphere at high latitudes, causing auroral activity and interference with electromagnetic communications.
GALACTIC COSMIC RADIATION
Composition and SourcesEarth is continuously irradiated from all directions by
high-energy charged particles of GCR. GCR particles lose kinetic energy principally by ejecting orbital electrons from the atoms with which they interact. The particle intensity in free space varies from 1.5 particles/(cm2 · second) near sunspot maximum to about 4 particles/(cm2 · second) near sunspot minimum. All the natural elements in the periodic table are present in GCR. Outside the geomagnetic field, the composition of the GCR is 98% hydrogen nuclei (protons) plus heavier nuclei stripped of orbital electrons and 2% electrons and positrons (10). The nuclei component of the radiation, in the energy range 100 MeV to 10 GeV per nucleon (where intensity is highest), consists of 87% protons, 12% helium nuclei (alpha particles), and 1% nuclei with an atomic number (Z) higher than helium. GCR nuclei with a Z higher than helium are called HZE particles (high Z and high energy) (27). Iron-56 is an important HZE particle because of its significant contribution to the GCR dose and its high LET (described in the section entitled Expressing Amounts of Ionizing Radiation) (27). HZE particles are a concern for space travelers because the particles can injure the central nervous system (26). HZE particles are not a concern at airline flight altitudes; they are broken apart at higher altitudes in the atmosphere.
The principle source of GCR in our galaxy is stellar material and surrounding interstellar gas, accelerated by exploding stars (supernovae).
Star formation is initiated by the gravitational attrac-tion of particles from a molecular cloud, which is a dense concentration of cold gas (mostly hydrogen) and dust in space. As the mass of the core of a future star (protostar) increases, the increased pressure fuses hydrogen into helium, releasing thermal energy. The thermal energy increases the temperature of the gases, and they expand and create an outward pressure that balances the gravi-tational forces. After the hydrogen is exhausted the star begins to contract. What happens next depends on the mass of the star. There are two ways a star can become a supernova.
A star at least 8 times the mass of the Sun can evolve di-rectly into a supernova by the following procedure. As the star contracts, the pressure in its core created by gravitational forces increases. When the pressure becomes great enough, fusion of helium to carbon occurs and thermal energy is released. This raises the temperature of the gases, temporarily halting the collapse of the star. When the helium runs out, the star begins to collapse again, and increasingly heavier elements are fused but with progressively less thermal energy produced. Fusion processes culminate with production of nickel-56, which

8
produces iron-56 by radioactive decay. Iron and elements of higher atomic weight do not emit heat on formation. When nuclear sources are almost exhausted and outward pressure by the gases is not sufficient to balance gravitational forces, the core of the star suddenly collapses. This is followed by collapse of the outer layers of the star, and the star explodes as a supernova.
A supernova can also evolve from a white dwarf, which is what remains of a low-mass star after fusion has stopped and the star has begun to cool. If the white dwarf and another star orbit each other and the white dwarf accretes enough matter from the other star to start uncontrolled fusion of carbon and oxygen, it will explode as a super-nova. A white dwarf may also accumulate enough mass and explode as a supernova by colliding with another star.
A supernova shines for weeks to months. The star’s luminocity increases by as much as 20 magnitudes. Li, Chornock, Leaman, et al. (29) estimated that there are about 2.8 supernovae in the Milky Way galaxy every hundred years. This estimate is based on a telescopic survey of more than 1,000 supernovae in nearby galax-ies. Shock waves of a supernova surge out through space, occasionally initiating new star formations. These shock waves are thought to be the primary accelerators of most GCR particles. However, supernovae are not thought to be powerful enough to generate the highest-energy GCR particles. Such particles are believed to come from nearby galaxies with central black holes. The black holes eject jets of plasma (a gas with a portion of its components ionized) into intergalactic space (30).
Hydrogen and helium were probably the most abun-dant elements in the early universe, with most of the rest made inside stars and during supernovae explosions.
Galactic Cosmic Radiation in Earth’s AtmosphereGCR levels in Earth’s atmosphere vary with latitude
(because of Earth’s magnetic properties), with altitude (because of Earth’s atmosphere), and with solar activity. Figure 2 (calculated with CARI-6P [23]) shows effective dose rates in the atmosphere during solar activity cycles from January 1958 through December 2008, at several altitudes at geographic coordinates 0o N, 20o E (where geographic and geomagnetic equators overlap), and at 80o N, 20o E.
At the high-latitude location, cyclic variation in the radiation level is evident at 30 kft, which indicates that low-energy GCR particles reach Earth’s atmosphere and penetrate down to this altitude. At the equator, the geomagnetic field repels most low-energy GCR particles that might otherwise enter the atmosphere during low solar activity. Consequently, there is little variation in dose rate at equatorial altitudes.
With increasing depth in the atmosphere, the dose rate from particles that enter the atmosphere (primary particles) decreases, whereas the dose rate from particles created in the atmosphere (secondary particles) increases. This complex situation results in a maximum dose rate at the so-called Pfotzer maximum, discovered in the mid-1930s by the German scientist for whom it is named. From the altitude of the Pfotzer maximum to the Earth’s
Figure 2. Effective dose rates from GCR in the atmosphere during several solar activity cycles.

9
surface, the dose rate decreases continuously. Using ef-fective dose rates calculated by LUINNCRP (31): at the equator, during both the July 1989 solar maximum and the May 1996 solar minimum, the Pfotzer maximum was at 56 kft; at the high-latitude location, the altitude of the Pfotzer maximum varied with solar activity and was 68 kft during the July 1989 solar maximum and 77 kft during the May 1996 solar minimum.
The next two figures (calculated with CARI-6P [23]) show the proportional contribution to the mean effective dose rate of each of the principle types of cosmic radiation
particles as related to altitude, at the geographic equator (Figure 3) and at the high-latitude location (Figure 4), from January 1958 through December 2008.
The equatorial and high-latitude data both show that at 20-40 kft, where subsonic air carrier aircraft commonly cruise, 88-97% of the mean effective dose rate was from neutrons, protons, and electromagnetic showers (electrons, positrons, and photons). At sea level, at the equator, and at the high latitude, more than 67% of the mean effective dose rate was from muons.
Figure 3. At the geographic equator (0o, 20o E), contribution of the principal GCR particles to the mean effective dose rate as related to altitude.
Figure 4. At a high geographic latitude (80o N, 20o E), contribution of the principal GCR particles to the mean effective dose rate as related to altitude.

10
THE SUN AND ITS EMISSIONS
Layers of the Sun’s AtmosphereThe photosphere is the Sun’s atmospheric layer visible
in white light. Above the photosphere is the chromosphere, a major source of UV radiation. Above the chromosphere is the corona, a region of very hot gas.
SunspotsA sunspot is an area on the photosphere that is seen
as a dark spot in contrast with its surroundings. Sun-spots appear dark because the area is cooler than the surrounding photosphere.
Sunspots occur where areas of the Sun’s magnetic field loop up from the surface of the Sun and disrupt convec-tion of hot gases from below. The sunspot number is an index of solar activity which is based on the number of sunspots and groups of sunspots visible on the Sun (19). For the last 280 years, the sunspot cycle has been about 11 years, with solar activity increasing for about 4.8 years and decreasing for about 6.2 years (19).
The Sun initiates disturbances in the geomagnetic field, and disturbances are more common and more intense when sunspots can be seen. However, intense geomagnetic disturbances have occurred when no sun-spots were observed, and high sunspot numbers have accompanied a low level of geomagnetic disturbances (32).
Solar Wind The solar wind boils continuously off the Sun,
producing an interplanetary magnetic field. The mass of the solar wind is about 80% protons, 18% alpha particles, and traces of heavier charged particles (33). Discontinuities in the magnetic field carried by the solar wind (called scattering centers) deflect away from Earth some low-energy GCR particles that might otherwise enter the atmosphere (21). During the active phase of the Sun’s activity cycle, the solar wind is at its most intense, and this reduces GCR in Earth’s atmosphere to its lowest levels. At its highest intensity, the solar wind can adversely affect telecommunication systems, but particle energies are too low to increase radiation levels at aircraft flight altitudes (34). Any environmental effect from increased intensity of charged particles from the Sun is called space weather.
Coronal Mass Ejection and Solar Flare Occasionally a magnetic disturbance in the Sun results
in an explosive ejection of huge amounts of matter and embedded magnetic fields from the solar corona, and this is called a coronal mass ejection (CME). A CME usu-ally originates in a magnetically active region around a
visible sunspot group. A large CME can blast billions of tons of charged particles into space at speeds of 1,700 km per second (33). When a fast CME plows through the slower moving solar wind, it produces interplanetary shock waves, which are responsible for showers of high-energy particles impacting Earth’s atmosphere (19). These particles impact the atmosphere from all directions (flying at night is no benefit), and they interact with air atoms in the same way as GCR particles.
The term solar flare refers to the electromagnetic energy and particles released suddenly from a relatively small volume of the Sun (19). CMEs and solar flares have often been associated (19), but the relationship between them, if any, is not known. The amount of energy and matter released during a solar flare is relatively small, compared to the amount released during a CME. Most CMEs and solar flares are not directed at the Earth (33). Particles associated with a solar flare may not have enough energy to increase radiation levels in Earth’s atmosphere. Photons from a solar flare begin arriving about 8 minutes after departing the Sun. The most energetic charged particles from a CME or from a solar flare reach Earth in 15-20 minutes. The difference in arrival time between photons and charged particles is due to the longer path the particles must follow to reach Earth.
Solar Proton EventA surge of subatomic particles from the Sun is de-
fined as a solar proton event (SPE) by the Space Weather Prediction Center of the U.S. National Oceanic and Atmospheric Administration (NOAA) if instruments on a Geosynchronous Operational Environmental Satellite (GOES) measure in three consecutive 5-minute periods an average solar proton flux ≥10 particles/(cm2 · stera-dian · second) with all proton energies >10 MeV (35). A particle surge that meets these characteristics is most likely the result of a CME.
RECOMMENDED IONIZING RADIATION DOSE LIMITS
U.S. Federal Aviation AdministrationThe FAA accepts the most recent recommendations
of the American Conference of Government Industrial Hygienists (ACGIH) (36, 37). For a non-pregnant air carrier crewmember, the FAA-recommended limit for exposure to ionizing radiation is a 5-year average of 20 mSv per year, with no more than 50 mSv in a single year. For a pregnant air carrier crewmember, starting when she reports her pregnancy to management, the FAA-recommended ionizing radiation exposure limits for the conceptus are 0.5 mSv in any month and 1 mSv during the remainder of the pregnancy.
11
Radiation exposure as part of a medical or dental pro-cedure is not subject to recommended limits. However, any radiation exposure of a pregnant woman should consider the conceptus.
International Commission on Radiological Protection
For a non-pregnant, occupationally exposed person, the ICRP 2007-recommended limit for exposure to ionizing radiation is a 5-year average of 20 mSv per year (100 mSv in 5 years), with no more than 50 mSv in a single year. Annual equivalent dose limits are recommended for the lens of the eye, 150 mSv; for skin, 500 mSv (averaged over a 1 cm2 area); each hand, 500 mSv; and each foot, 500 mSv (11).
For a pregnant worker, starting when she reports her pregnancy to management, the working conditions should be such that the additional dose to the conceptus would not exceed about 1 mSv during the remainder of the pregnancy (11).
Radiation exposure as part of a medical procedure is not subject to recommended limits. However, before any pregnant woman is irradiated, the exposure of the conceptus should be considered.
National Council on Radiation Protection and Measurements
For a non-pregnant, occupationally exposed person, the NCRP-recommended limit for exposure to ionizing radiation is 50 mSv per year, with no more than 10 times the person’s age in mSv cumulative dose. Annual equivalent dose limits are recommended for the lens of the eye, 150 mSv; for skin, 500 mSv (averaged over a 1 cm2 area); for each hand, 500 mSv; and for each foot, 500 mSv (24).
For a pregnant worker, starting when she reports her pregnancy to management, the working conditions should be such that the dose to the conceptus does not exceed 0.5 mSv per month during the remainder of the pregnancy (24).
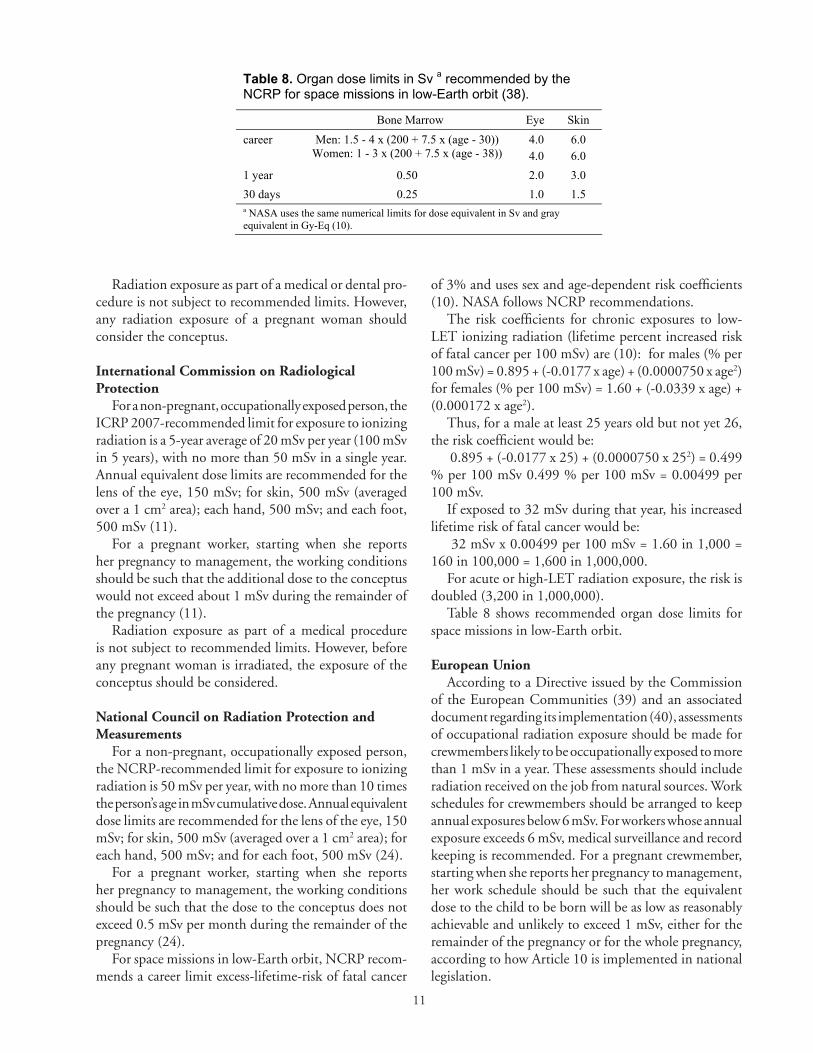
For space missions in low-Earth orbit, NCRP recom-mends a career limit excess-lifetime-risk of fatal cancer
of 3% and uses sex and age-dependent risk coefficients (10). NASA follows NCRP recommendations.
The risk coefficients for chronic exposures to low-LET ionizing radiation (lifetime percent increased risk of fatal cancer per 100 mSv) are (10): for males (% per 100 mSv) = 0.895 + (-0.0177 x age) + (0.0000750 x age2) for females (% per 100 mSv) = 1.60 + (-0.0339 x age) + (0.000172 x age2).
Thus, for a male at least 25 years old but not yet 26, the risk coefficient would be:
0.895 + (-0.0177 x 25) + (0.0000750 x 252) = 0.499 % per 100 mSv 0.499 % per 100 mSv = 0.00499 per 100 mSv.
If exposed to 32 mSv during that year, his increased lifetime risk of fatal cancer would be:
32 mSv x 0.00499 per 100 mSv = 1.60 in 1,000 = 160 in 100,000 = 1,600 in 1,000,000.
For acute or high-LET radiation exposure, the risk is doubled (3,200 in 1,000,000).
Table 8 shows recommended organ dose limits for space missions in low-Earth orbit.
European UnionAccording to a Directive issued by the Commission
of the European Communities (39) and an associated document regarding its implementation (40), assessments of occupational radiation exposure should be made for crewmembers likely to be occupationally exposed to more than 1 mSv in a year. These assessments should include radiation received on the job from natural sources. Work schedules for crewmembers should be arranged to keep annual exposures below 6 mSv. For workers whose annual exposure exceeds 6 mSv, medical surveillance and record keeping is recommended. For a pregnant crewmember, starting when she reports her pregnancy to management, her work schedule should be such that the equivalent dose to the child to be born will be as low as reasonably achievable and unlikely to exceed 1 mSv, either for the remainder of the pregnancy or for the whole pregnancy, according to how Article 10 is implemented in national legislation.
Table 8. Organ dose limits in Sv a recommended by the NCRP for space missions in low-Earth orbit (38).
Bone Marrow Eye Skin
career Men: 1.5 - 4 x (200 + 7.5 x (age - 30)) Women: 1 - 3 x (200 + 7.5 x (age - 38))
4.0 4.0
6.0 6.0
1 year 0.50 2.0 3.0 30 days 0.25 1.0 1.5 a NASA uses the same numerical limits for dose equivalent in Sv and gray equivalent in Gy-Eq (10).

12
IONIZING RADIATION EXPOSURE DURING AIR AND SPACE TRAVEL
Radiation Doses Received During Air TravelThe effective dose of GCR to an adult on an aircraft
flight at altitudes <60 kft can be estimated using a com-puter program such as CARI-6, which can be run on the Internet (jag.cami.jccbi.gov/cariprofile.asp). Two DOS versions of CARI-6 (CARI-6 and CARI-6M) may be downloaded from the FAA’s Radiobiology Research Team Web pages (www.faa.gov/data_research/research/med_humanfacs/aeromedical/radiobiology/). CARI-6P and CARI-6PM are research-oriented versions available on request from the authors. CARI-6 and CARI-6P assume a geodesic flight path; CARI-6M and CARI-6PM follow user-entered waypoints. The “P” designation indicates that in the output, the doses from the most important particles are listed individually, and the effective dose is reported two ways for protons, using w
R = 2 (current
ICRP and NCRP recommendation) (10, 11) and w R = 5
(old ICRP recommendation) (12). Information required for CARI-6 and CARI-6P:
(1) Date of flight; (2) ICAO code of origin airport;(3) ICAO code of destination airport; (4) Number of en route altitudes; (5) Minutes climbing to first en route altitude; (6) First en route altitude, in feet; (7) Minutes cruising at first en route altitude; (8) Additional en route altitudes (if any), in feet; (9) For each en route altitude (if any) after the first:
Minutes changing to the en route altitude plus minutes cruising at the en route altitude;
(10) Minutes descending to destination airport.
Table 9 shows the effective dose (sieverts) from GCR received on single nonstop one-way air carrier flights calculated with CARI-6P, using w
R(protons) = 2. Data
in Table 9 and risk coefficients in Tables 10-12 can be used to estimate cancer risk and genetic effects from GCR exposure during a career of flying.
From 1 January 1986 through 1 January 2008, there were 170 solar proton events. During 169 of these events, Copeland, Sauer, Duke, et al. (22) estimated doses of SCR and GCR received on simulated high-latitude aircraft flights. To estimate SCR, they used GOES measure-ments, near sea-level neutron-monitor data, and Monte Carlo calculations. For GCR, they used CARI-6P, with w
R(protons) = 2. For each event, they calculated the highest combined
GCR + mean SCR dose received by an adult and the highest received by a <3-month-old conceptus, in 1, 3, 5, and 10 hours, at altitudes of 30, 40, 50, and 60 kft. Thus, for each of the 169 events, there were 16 adult categories and 16 conceptus categories. The highest value for each of the 32 categories (shown in Table 13) occurred either during the 29 September 1989 event or the 16 January 2005 event.
The GCR + mean SCR dose to an adult was always less than 20 mSv, the annual occupational limit (5-year average) recommended by the ICRP (12) and the FAA (36). During 10 of the 169 events, in one or more of the 16 categories for the conceptus, the GCR + mean SCR dose exceeded the 0.5 mSv monthly limit recommended by the NCRP (24) and the FAA (36).
The most severe solar proton event for which a record is available occurred in 1859 (44). Magnetic compasses went haywire, telegraph systems failed, and auroras were seen as far south as the Caribbean in the Americas. In the current high-technology environment, the high levels of SCR could have damaged electronics on spacecraft, disabled radio communications, and caused widespread electrical blackouts. Intense solar activity can heat the atmosphere, causing it to heat and expand. For a satellite in low-Earth orbit, such an atmospheric change would increase the drag on the satellite, causing it to slow down and change its orbit to lower altitudes. However, even during the 1859 event, the radiation dose to space travelers in low-Earth orbit would probably not have been life-threatening (44).

13
Table 9. Flight data and effective dose from low-LET radiation and from high-LET radiation (calculated with CARI-6Pa) on single nonstop one-way air carrier flights.
1 2 3 4 5 6 Highest In-air Block b Effective dose (mSv)
Origin – Destination alt.(kft) hours hours low-LET high-LET
Solar Minimum (May 1996)
Houston TX – Austin TX 20 0.5 0.6 0.000058 0.0001
Miami FL – Tampa FL 24 0.6 0.8 0.00012 0.00024
St. Louis MO – Tulsa OK 35 0.9 1.1 0.0005 0.0012
London UK – Los Angeles CA 39 10.5 11. 0.017 0.046
Chicago IL – London UK 37 7.3 7.7 0.012 0.032
London UK – Chicago IL 39 7.8 8.3 0.013 0.036
Athens Greece – New York NY 41 9.4 9.7 0.019 0.041
Average Solar Activity in 51 years (1958-2008)
Houston TX – Austin TX 20 0.5 0.6 0.000055 0.000094
Miami FL – Tampa FL 24 0.6 0.8 0.00012 0.00023
St. Louis MO – Tulsa OK 35 0.9 1.1 0.00047 0.001
London UK – Los Angeles CA 39 10.5 11. 0.016 0.039
Chicago IL – London UK 37 7.3 7.7 0.011 0.027
London UK – Chicago IL 39 7.8 8.3 0.012 0.030
Athens Greece – New York NY 41 9.4 9.7 0.017 0.036
Solar Maximum (July 1989)
Houston TX – Austin TX 20 0.5 0.6 0.000053 0.000088
Miami FL – Tampa FL 24 0.6 0.8 0.00011 0.00021
St. Louis MO – Tulsa OK 35 0.9 1.1 0.00044 0.00091
London UK – Los Angeles CA 39 10.5 11. 0.015 0.032
Chicago IL – London UK 37 7.3 7.7 0.010 0.022
London UK – Chicago IL 39 7.8 8.3 0.011 0.025
Athens Greece – New York NY 41 9.4 9.7 0.016 0.031 a CARI-6P output is the effective dose from muons, electromagnetic showers (photons, electrons, and positrons), protons, pions, and neutrons. For risk estimates, protons, charged pions, and neutrons were considered high-LET radiation; muons and electromagnetic showers were considered low-LET radiation. Protons, usually considered low-LET radiation, are more damaging than other low-LET radiation, causing damage similar to that produced by heavy ions (41). Therefore, we included protons with high-LET radiation, which may overestimate risk. b Block hours start before takeoff from the origin airport, after the aircraft door is closed and the brake is released. Block hours end after landing at the destination airport, the last time the brake is set before the aircraft door is opened.

14
Table 9 continued Example 1 A crewmember worked 700 block hours per year for 25 years flying between Athens, Greece and New York, NY (block hours defined in footnote b). Assuming average solar activity for each flight, what is the crewmember's increased lifetime risk of fatal cancer? Flight data are in Table 9. Risk coefficients for fatal cancer are in Table 10. Risk from low-LET radiation (doses in column 5): 700 block hours per year x 25 years = 17,500 block hours in 25 years 0.017 mSv per flight / 9.7 block hours per flight = 0.00175258 mSv per block hour 0.00175258 mSv per block hour x 17,500 block hours in 25 years = 30.67015 mSv in 25 years fatal cancer risk = 3.1 in 100,000 per mSv x 30.67015 mSv in 25 years = 95.077465 in 100,000 = 95.08 in 100,000 Risk from high-LET radiation (doses in column 6): 0.036 mSv per flight / 9.7 block hours per flight = 0.00371134 mSv per block hour 0.00371134 mSv per block hour x 17,500 block hours in 25 years = 64.94845 mSv in 25 years fatal cancer risk = 6.3 in 100,000 per mSv x 64.94845 mSv = 409.175235 in 100,000 = 409.18 in 100,000 Risk from low-LET radiation + high-LET radiation = 95.08 in 100,000 + 409.18 in 100,000 = 504.28 in 100,000 = 5 in 1,000
**** Example 2 Before conceiving children, one parent worked 700 block hours a year for 5 years flying between Athens, Greece, and New York, NY, and the other parent did not fly. Assuming average solar activity for each flight, what is the risk of genetic defects in the first two successive generations? Flight data are in Table 9. Risk coefficients for genetic defects are in Table 11. Risk from low-LET radiation (doses in column 5): 700 block hours per year x 5 years = 3,500 block hours 0.017 mSv per flight / 9.7 block hours per flight = 0.00175 mSv per block hour 0.00175 mSv per block hour x 3,500 block hours in 5 years = 6.125 mSv in 5 years genetic risk = 1.2 in 1,000,000 per mSv x 6.125 mSv in 5 years = 7.35 in 1,000,000 Risk from high-LET radiation (doses in column 6): 0.036 mSv per flight / 9.7 block hours per flight = 0.0037 mSv per block hour 0.0037 mSv per block hour x 3,500 block hours in 5 years = 12.95 mSv in 5 years genetic risk = 2.4 in 1,000,000 per mSv x 12.95 mSv = 31.08 in 1,000,000 Risk from low-LET radiation + high-LET radiation = 7.35 + 31.08 = 38.43 in 1,000,000 = 4 in 100,000
Table 10. Increased lifetime risk of fatal cancer from ionizing radiation (11). Whole population a Age group 18-64 years
---- 8.0 in 100,000 per mSv 6.3 in 100,000 per mSv DDREF = 2 4.0 in 100,000 per mSv 3.1 in 100,000 per mSv a In the U.S in 1998, cancer caused 23.2% of deaths among persons of all ages and 10.6% of deaths among children ages 1-14 years (42).
Table 11. Increased risk of genetic effects in first two successive generations (children and grandchildren), from ionizing radiation exposure prior to conception (11).a
Whole population a Age group 18-64 years
---- 0.4 in 100,000 per mSv 2.4 in 1,000,000 per mSv DDREF = 2 0.2 in 100,000 per mSv 1.2 in 1,000,000 per mSv a In the general population, 2-3% of live-born children have harmful abnormalities at birth (43).

15
Table 12. Increased lifetime risk of cancer (non-fatal or fatal) from ionizing radiation (11).
Whole population a Age group 18-64 years
---- 34 in 100,000 per mSv 23 in 100,000 per mSv DDREF = 2 17 in 100,000 per mSv 12 in 100,000 per mSv
Table 13. Highest GCR + mean SCR effective doses to an adult and highest GCR + mean SCR equivalent doses to a <3-month-old conceptus, on simulated high-latitude aircraft flights during 169 solar proton events.
Effective dose to an adult (Equivalent dose to a conceptus) (mSv) Altitude (kft) 1 h a 3 h 5 h 10 h
29 September 1989 event 30 --- 0.098 (0.11) 0.14 (0.16) 0.20 (0.22) 40 --- 0.27 (0.30) 0.39 (0.43) 0.57 (0.63) 50 --- --- 0.84 (0.90) 1.3 (1.4) 60 --- --- --- 2.6 (2.4)
16 January 2005 event 30 0.048 (0.050) --- --- --- 40 0.16 (0.17) --- --- --- 50 0.42 (0.44) 0.68 (0.72) --- --- 60 0.90 (0.83) 1.5 (1.4) 1.8 (1.7) ---
a 1, 3, 5, or 10 hours of continuous exposure
Radiation Doses Received During Space TravelCommercial space flights, in the next decade or so,
are expected to be limited to suborbital flights and trips to the ISS, with suborbital flights the more common. Travelers on suborbital flights are exposed to trapped radiation, GCR, and SCR.
It is expected that the suborbital flights will be pri-marily like that of SpaceShipOne, a rocket carried aloft and launched at high altitude from a carrier aircraft, or else something like the early ballistic flights of the Mer-cury program. These kinds of flights usually spend ≤15 minutes at high altitudes and in space. GCR should be the primary source of ionizing radiation exposure. The flight path can be chosen to avoid the trapped radiation of the South Atlantic Anomaly and the timing selected to avoid SCR hazards. Doses to vehicle occupants are expected to be quite low during the rocket-powered and freefall portions of the flight. For example, the effective dose (calculated with LUINNCRP [31] from the flight profile) to Alan Shepard on the Mercury 3 mission was 0.00031 mSv.
For tourists going to the ISS, the trip is typically 7-10 days, and doses will be considerably higher than on suborbital flights. The trapped radiation of the South
Atlantic Anomaly cannot be avoided. Also, the orbit of the ISS is at a high inclination, so for part of each orbit, it is outside latitudes well-protected by Earth’s magnetic field, and ISS occupants receive little protection from GCR. While of low probability, SCR is also a possible radiation hazard.
An example of a trip to the ISS orbit is STS-91, a 9.8-day space shuttle mission, during which the effec-tive dose equivalent to the astronauts, based on in-flight measurements, was 4.1 mSv (45).
HEALTH EFFECTS OF IONIZING RADIATION
Deterministic Effects (Non-Stochastic Effects, Tissue Reactions)
Most tissues of the body can lose a substantial number of cells without an observable decrease in tissue or organ function. However, if the number of cells lost is sufficiently large, harm will be observed. Harm from ionizing radiation is called deterministic if the harm increases with radiation dose above a threshold dose (12). The threshold dose is the dose below which no harm is observed, or the harm is not clinically significant. For most deterministic effects

16
from low-LET radiation, the threshold dose is higher if the exposure time required to reach the dose is more than a few hours (46). Deterministic effects can occur soon (sometimes minutes) after radiation exposure if the dose is sufficiently high and delivered at a high rate.
The effect of radiation on the hematopoietic system is largely dependent on damage to the bone marrow. The bone marrow contains three cell renewal systems: erythropoietic, myelopoietic, and thrombopoietic. Nor-mally, a steady-state condition exists between production of new cells by the bone marrow and the number of mature, functional cells in the circulating blood. The erythropoietic system produces mature erythrocytes (red blood cells) with a lifespan of approximately 120 days. Red blood cells carry oxygen from the lungs to the rest of the body and carry away some of the carbon dioxide. The myelopoietic system produces mature leukocytes (white blood cells) with a lifespan of approximately 8 days. White blood cells are important in combating infection. The thrombopoietic system produces platelets with a lifespan of 8-9 days. If the endothelial lining of a blood vessel is traumatized, platelets are stimulated to go to the site of injury and form a plug, which helps reduce blood loss. Platelet deficiency causes one to bruise easily and even hemorrhage.
The intestines are highly vulnerable to radiation damage. The mucosal layer that lines the intestines is completely renovated every 72 hours. Injury of the mi-crovasculature of the mucosa and submucosa, together
with epithelial-cell denudation, results in hemorrhage and marked loss of fluids and electrolytes. These events normally occur within 1-2 weeks after irradiation.
Early deterministic effects of ionizing radiation are called Acute Radiation Syndrome (ARS). Symptoms during the first stage of this illness (nausea, fatigue, vomiting, and diarrhea) occur within minutes to days after expo-sure; they may come and go for several days, unless the dose is totally incapacitating or lethal before then. The irradiated individual usually looks and feels healthy for short periods of time. During the next stage, there may be a loss of appetite, nausea, fatigue, vomiting, diarrhea, fever, seizures, and coma. This seriously-ill stage may last from a few hours to several months and end with death from infection and/or internal bleeding. The symptoms and time to onset of symptoms, and their severity and duration, generally depend on the absorbed dose. There are significant differences among individuals. The cause of death is usually from infections and internal bleeding because of bone marrow damage. Some late deterministic effects are cataracts and a decrease in germ cells.
To date, cataract formation is the only deterministic effect associated with exposure to ionizing radiation in space (26). Excess cataracts have been seen in former astronauts who received <2 Gy of high-LET radiation (47). Table 14 lists deterministic effects in young adults from an acute whole-body dose of ionizing radiation. Survivors of deterministic effects are at risk of stochastic effects (48).
Table 14. Deterministic effects in young adults from a whole-body Gy-Eq a of ionizing radiation received in <1 day.
Gy-Eq Effects
0.15 Threshold dose for temporary sterility in males (46). 0.35 Within a few hours, some suffer nausea, weakness, and loss of appetite. Symptoms disappear a few hours after
appearing (46). 1-2 After 2-3 hours, nausea and vomiting in 33-50% (48). 1.5 Threshold dose for mortality (27). 2 Permanent sterility in premenopausal females (9). Minimum cataract dose (10).
2-4 Mild headache in about 50%. Almost constant nausea and vomiting in 70-90% (49). There may be initial granulocytosis, with pancytopenia 20-30 days after irradiation. Possible later effects are infections, hemorrhage, and impaired healing (49). The latent period for cataracts is normally about 8 years, after 2.5-6.5 Gy (9).
3.5-6 Threshold dose for permanent sterility in males (11). 4 About 50% die within 60 days from hematopoetic failure (11). It has been reported for adult males, that shielding
10% of the active (red) bone marrow will result in almost 100% survival (48). Locations and percent of total bone marrow in adults are in Table 15.
5-7 Up to 100% vomit within 2 days (27). Mortality about 90% within 60 days (11). >8 Within minutes, there may be severe nausea, vomiting, and watery diarrhea. After 1-2 hours, there is almost
constant severe headache (49). There may be renal failure and cardiovascular collapse. Mortality 100%, usually within 8-14 days (49).
>20 Often, burning sensation within minutes. Nausea and vomiting within 1 hour, followed by prostration, ataxia, and confusion (49). Mortality 100%, usually within 24-48 hours (49).
a Described in the section entitled Ionizing Radiation Terminology.

17
Stochastic Effects Harm from ionizing radiation is called a stochastic
effect (expressed in sieverts) if the probability (risk), but not the severity of the effect, is a function of the effective dose. It is believed that there is no threshold dose for stochastic effects (9). Stochastic effects include cancer, genetic disorders in succeeding generations, and loss of life from such effects. The risk is cumulative and persists throughout the life of the exposed person. Thus, indi-viduals exposed to ionizing radiation have an increased lifetime risk of cancer, and their progeny have an increased risk of inheriting genetic disorders.
Radiation-induced cancers cannot be distinguished from cancers of the same type in the unirradiated popu-lation, and it cannot be predicted which individuals in an irradiated group will develop cancer (43). Regardless of age when irradiated, radiation-induced tumors tend to appear when tumors of the same type occur in the unirradiated population (9).
In Tables 10, 11, and 12 are estimates of the increased lifetime risk of cancer and of heritable effects from a whole-body dose of ionizing radiation for a member of the whole population and for a member of the working-age population (18-64 years). If the radiation is low LET (electrons, photons, positrons, or muons) and <200 mSv and/or <100 mSv/hour, then the estimated risk is half that found by linear extrapolation from the high-dose region, and the DDREF = 2 (DDREF is the dose and dose-rate effectiveness factor) (12, 11).
Thus, for a person in age group 18-64 years who re-ceives a single acute dose of whole-body radiation <200 mSv: (a) the increased lifetime risk of fatal cancer from high-LET radiation is 6.3 in 100,000 per mSv (Table 10) and is about 52% of the increased lifetime risk of cancer (non-fatal or fatal) from low-LET radiation, which is 12 in 100,000 per mSv (Table 12); (b) the increased lifetime risk of fatal cancer from low-LET radiation is 3.1 in 100,000 per mSv (Table 10) and is about 26% of
the increased lifetime risk of cancer (non-fatal or fatal), which is 12 in 100,000 per mSv (Table 12).
Commonly occurring cancers, induced as stochastic effects of ionizing radiation, are shown in Table 16.
Prenatal IrradiationExposure to a high dose of ionizing radiation in the
first 3 weeks after conception may kill a conceptus but is not likely to cause deterministic or stochastic effects in a live-born child. However, irradiation in the period from 3 weeks after conception until the end of pregnancy may cause deterministic and stochastic effects in a live-born child (12).
A dose <100 mGy to a conceptus is not considered a justification for terminating a pregnancy (48).
RADIOACTIVE CONTAMINATION IN EARTH’S ATMOSPHERE
Regions of the atmosphere sometimes become con-taminated with radioactive gases and particles released from a nuclear reactor (as the result of an accident or ter-rorist attack) or from a detonated dirty bomb or nuclear weapon. These radioactive contaminants may travel long distances in the wind. Radioiodines are the chief gaseous isotopes of concern after nuclear explosions, and inhala-tion problems with fission products other than iodine are minor (51). In Belarus (formerly part of the Soviet Union), in the 10-year period before the Chernobyl reactor accident, 1,342 adult and 7 childhood thyroid cancers were diagnosed, whereas during the 9-year period after the accident 4,006 adult and 508 childhood thyroid cancers were reported (52).
Potassium iodide (KI) blocks iodine uptake by the thyroid gland. It should be taken daily at the doses recom-mended in Table 17, from the first warning of the possible release of radioactive iodine until the risk of significant inhalation or ingestion of radioactive iodine no longer exists. Potassium iodide protects the thyroid gland for approximately 24 hours. Treatment is most effective if it begins between 2 days before and approximately 8 hours after inhalation or ingestion of radioactive iodine (54). Starting treatment 16 or more hours after radioactive iodine exposure provides little protection (54). It prob-ably should not be taken for more than 10 days. After leaving a contaminated area, potassium iodide should be taken for at least another day to allow the kidneys time to eliminate radioactive iodine that is in the blood.
For persons <20 years of age, the risk of thyroid cancer decreases with increase in age at the time of irradiation. There is little risk of thyroid cancer after age 40 (52). However, if the dose to the thyroid is 200-300 Gy or more, the thyroid parenchyma (functional tissue) will
Table 15. Distribution of active (red) bone marrow in adults (48).
Percent
sternum 3 cervical vertebrae 4 upper limbs 4 skull 7 thoracic vertebrae 10 lumbar vertebrae 11 lower limbs 11 ribs 19 pelvis 30

18
Table 17. Recommended daily dose of potassium iodide, if radioactive iodine has been released into the atmosphere (52).
Persons at risk a
Daily dose of potassium iodide
(mg)
pregnant or breast feeding 130
>18 years 130 >12 years through 18 years and ≥70 kg. 130 >12 years through 18 years and <70 kg 65
>3 years through 12 years 65
>1 month through 3 years 32
birth through 1 month 16 a Protects for approximately 24 hours.
Table 16. Commonly occurring cancers with ionizing radiation as a risk factor (stochastic effects).
Leukemia Shortest latent period of radiation-induced cancers (9). Minimum latent period 2-3 years (46). Peak incidence 5-7 years after irradiation, with most cases in first 15 years (9). Acute leukemia and chronic myeloid (myelocytic) leukemia are the main types in irradiated adults (9). Susceptibility to acute lymphatic leukemia (stem-cell leukemia, leukemia too premature to classify) is highest in childhood and decreases sharply during maturation (9). Chronic lymphocytic leukemia (CLL) is not radiation-induced (9).
Lung cancer Most common cancer worldwide and the major cause of death from cancer (7). With increase in age at exposure, the latent period decreases and the risk increases (10). Dose-fractionation decreases risk (based on low-LET radiation) (10) Radon causes about 10% of lung cancer deaths in the U.S. (9).
Breast cancer Among women world-wide, the most common cancer and one of the leading causes of death from cancer (7). Risk highest if irradiated before age 15 years, with little or no risk if irradiated at age 50 or older (9). Family history is a strong predictor of risk (7). Dose-fractionation data conflicting (10). Risk reduced by ovariectomy (oophorectomy) or pregnancy at an early age (10).
Gastrointestinal-tract cancer (esophagus, stomach, colon, and rectum)
15-20% of benign colorectal tumors become malignant (10). In the general U.S. population, lifetime risk of developing gastrointestinal-tract cancer is 2.5-5%, but is 2-3 times higher in persons with a first-degree relative (father, mother, brother, sister, child) who had colon cancer or an adenomatous polyp (50).
Bone cancer External X-radiation may cause bone cancer, but the numbers are small and the risk estimates are poor (9). Liver cancer Risk from high-LET radiation, but uncertain if risk from low-LET radiation (10). Kidney and bladder cancer
Risk from radiation (10).
Skin cancer Most common cancer in Caucasians in the U.S. Latent period about 25 years. Skin exposed to low-LET radiation and sunlight (presumably from ultraviolet radiation) is at greater risk than skin protected from sunlight by hair, clothing, or pigmentation. Ionizing radiation causes basal-cell and squamous-cell carcinomas, but no unequivocal association has been found for ionizing radiation exposure and melanoma (the most malignant skin cancer). In fair-skinned individuals, radiation from sunlight or sunlamps is a risk factor for melanoma and other skin cancers. Skin cancer can develop in areas not exposed to sunlight. Skin cancer can develop in dark-skinned individuals. Family history is a predictor of risk (27).
Thyroid cancer Risk to a child is significant if dose ≥0.05 Gy. Little or no risk if 30 years or older. Most likely radiation source is radioactive iodine (I-131) released into the atmosphere from a nuclear reactor, as the result of an accident or terrorist attack. Radioactive iodine is also a major constituent of detonated nuclear weapons. Radioactive iodine is incorporated by the thyroid gland and the radiation increases the risk of thyroid cancer (10).

19
be destroyed (48). A person >40 years of age should take potassium iodide only if the predicted dose is >5 Gy, to prevent hypothyroidism (53). The risk to a child is significant if the dose to the thyroid is ≥0.05 Gy (53).
Radioactive iodine easily crosses the placenta (48), and the fetal thyroid begins to accumulate iodine at about 10 weeks of gestational age. After 8 weeks post-conception, giving the mother 60-130 mg of potassium iodide within 12 hours of radioactive iodine intake will reduce uptake of radioactive iodine by the fetal thyroid (48). Health risks from stable iodine, a component of potassium iodide, include sialadenitis (inflammation of the salivary gland), gastrointestinal disturbances, allergic reactions, and minor rashes. Persons with iodine sensitiv-ity should avoid potassium iodide, as should individuals with dermatitis herpetiformis and hypocomplementemic vasculitis (rare conditions associated with increased risk of iodine hypersensitivity) (52).
Because radioactive iodine has a physical half-life of 8.04 days, food affected by radioactive iodine fallout poses very little risk if stored 2 months or longer.
Other possibly important radioactive substances that could be released into the atmosphere from a nuclear reactor, detonated nuclear weapon, or dirty bomb, along with the annual allowable levels of intake (ALIs) for U.S. radiation workers, are listed in Table 18. Some possible therapies are listed in Table 19. The ALI for each isotope is the intake of that isotope that results in a committed effective dose approximately equal to the NRC limit for radiation workers and the FAA recommended limit for any one year (50 mSv) (55).
If possible, flying through radioactively contaminated air space should be avoided. If crewmembers are exposed to multiple isotopes, the ALI for each isotope should be reduced to keep the total committed effective dose at or below the FAA-recommended limit. A pregnant crewmember should avoid any exposure that results in the dose to the conceptus exceeding recommended limits (0.5 mSv in any month and 1 mSv total during her declared pregnancy). The maximum dose rate from radioactive materials on board the aircraft should not exceed 0.02 mSv per hour in any occupied space (57).
Table 18. Nuclear Regulatory Commission Annual Allowable Levels of Intake (ALI)a,b for Selected Radionuclides (55). Ingestion (μCi) Inhalation (μCi)
Isotope <10 d 10-100 d >100 d <10 d 10-100 d >100 d
Americium-241 0.8 0.006 Cesium-137 100 200 Cobalt-60 ---- 500 200 ---- 200 30 Iodine-125 40 60 Iodine-131 30 50 Iridium-192 900 300 400 200 Palladium-103 6000 6000 4000 4000 Phosphorus-32 600 900 400 ---- Plutonium-239 0.8 ---- 0.006 0.02 Radium-226 2 0.6 Strontium-90 30 20 ---- 4 Tritium (hydrogen-3) 80000 80000 Uranium-233 10 1 0.7 0.04 Uranium-234 10 1 0.7 0.04 Uranium-235 10 1 0.8 0.04 Yttrium-90 400 ---- 700 600 a One ALI gives an effective dose of about 50 mSv. The radiation worker is assumed to be doing light labor while wearing no protective gear. b If more than one isotope is involved, the procedure to find whether or not the exposure exceeds the intake limit is to divide each intake by its respective ALI and then sum the resulting fractions. If the sum is >1, the ALI has been exceeded. c The various compounds incorporating these isotopes have different lifetimes in the body. In this table allowable levels of intake for these isotopes are subdivided into 3 groups, based on their retention times in the body: “D” < 10 days; “W” 10-100 days; and “Y” > 100 days. If there is no D, W, or Y, then the allowable level of intake is applicable to all compounds which incorporate that isotope, whatever their lifetime in the body.

20
Table 19. Drugs used to treat persons contaminated with radioactive materials (56). Ammonium chloride
This salt acidifies the patient’s blood, and is useful for the removal of strontium, especially when combined with intravenous calcium gluconate. Ammonium chloride is given orally, 1-2 gm 4 times per day, for up to 6 consecutive days. While best results occur if given quickly after intake, some effect is seen if used up to two weeks afterwards. If used promptly with calcium gluconate, strontium levels can diminish 40-75 %. Nausea, vomiting, and gastric irritation are common. Avoid in patients with severe liver disease.
Calcium (oral) Many oral calcium supplements are available (e.g., Tums®). Generous doses of oral calcium should be beneficial, because calcium can interfere with absorption of the other alkaline earths, such as strontium, barium, and radium, and compete with their deposition in bone.
Ca-DTPA (also Zn-DTPA)
This is a powerful and stable chelating agent, used primarily to remove plutonium and americium. It chelates transuranic (Z>92) metals (plutonium, americium, curium, californium, and neptunium), rare earths (such as cerium, yttrium, lanthanum, promethium, and scandium), and some transition metals (such as zirconium and niobium). In normal, healthy, non-pregnant adults with normal bone marrow and renal function, the dose to use is 1 gm in 250 ml normal saline or 5% dextrose in water, intravenously over 1 hour. 1 dose per day should be used, and the dose should not be fractionated. May use for several days to a week in most cases without toxic effects. Toxicity is due to chelation of needed metals, such as Zn and Mn. Toxic effects include nausea, vomiting, chills, diarrhea, fever, pruritus, muscle cramps, and anosmia. In pregnant patients or after a couple of doses, the less toxic Zn-DTPA should be used instead, with the same dose and dose schedule. These agents are best used as quickly as possible after internal contamination. They are effective if given later, but therapy may continue for months or years. These agents are only effective if the metals one wishes to chelate are in ionic form. They are useless for highly insoluble compounds.
Calcium gluconate
Intravenous calcium gluconate is indicated for Sr-90 contamination, and probably Ra-226 contamination as well. Five ampoules, each containing approximately 500 mg calcium, may be administered in 0.5 liter 5% dextrose solution over a 4 hour period daily for 6 consecutive days. It is contraindicated in patients who have a very slow heart rate and those on digoxin preparations or quinidine.
Dimercaprol (British antilewisite, BAL)
This agent effectively chelates mercury, lead, arsenic, gold, bismuth, chromium, and nickel. It is toxic, and about 50% of patients given 6 mg/kg intramuscular injections develop reactions. These include systolic and diastolic hypertension, tachycardia, nausea, vomiting, chest pain, headache, and sterile abscess at the injection site. The dose to use is 2.5 mg/kg (or less) every 4 hours for 2 days, then twice daily for 1 day, and then every day for days 5-10. It is available as 300 mg/vial for deep intramuscular injection use (suspension in peanut oil).
D-Penicillamine This drug chelates copper, iron, mercury, lead, gold, and possibly other heavy metals. The chelated metals are excreted in the urine. While this drug is relatively non-toxic, it probably has only limited usefulness for radionuclide decorporation, preventing perhaps only 1/3 of the total radiation absorbed dose that would have occurred without treatment. The adult dose is 250 mg orally daily between meals and at bedtime. May increase to 4 or 5 g daily in divided doses. Use caution if patient has a penicillin allergy
Potassium iodide Useful for blocking radioiodine uptake by the thyroid, but needs to be administered within 8 hours of intake for best effectiveness. See Table 17 for dosing information.
Potassium phosphate (and sodium phosphate)
Used to block uptake of radioactive phosphate. K-Phos® Neutral contains 250 mg phosphorus per tablet. Usual adult dose is 1-2 tabs orally 4 times per day, with full glass of water each time, with meals and at bedtime. Pediatric patients over 4y, 1 tab 4 times per day. Contraindicated in hyperphosphatemia, renal insufficiency, and infected phosphate stones.
Propylthiouracil This drug is useful to decrease the thyroid’s retention of radioiodine, and may be considered if it is too late for KI to be effective. The adult dose is 50 mg tabs, 2 orally 3 times per day for 8 days.
Prussian blue This drug is indicated for decorporation of cesium, thallium, and rubidium, and has been shown to be highly effective for Cs-137 contamination. It is benign, with the exception of occasional constipation. Stool turns blue. Usual dose starts at 0.5 g capsule, 2 caps orally 3 times per day for up to 3 weeks or longer as required. Doses up to 10-12 g/day for significantly contaminated adults may be used.
Sodium alginate Oral alginates efficiently bind strontium in the gastrointestinal tract, preventing absorption. The dose is 10 gm powder in a 30 cc vial, add water and drink.
Sodium bicarbonate
Used to protect kidneys from uranium deposition after uranium intake. Oral or intravenous, take as needed to maintain alkaline urine. The intravenous formulation is 8.9%, 100 or 200 cc vials.
Sodium phosphate
See potassium phosphate. Also used for radioactive phosphate decorporation.
Zn-DTPA See Ca-DTPA.

21
When an aircraft is contaminated or suspected of con-tamination with radioactive materials, it must be removed from service and not returned to service until the dose rate from radioactive contaminants at every accessible surface is <0.005 mSv per hour (58).
LIGHTNING AND TERRESTRIAL GAMMA-RAY FLASHES
Dwyer, Smith, Uman, et al. (59) recently reviewed the subject of ionizing radiation emitted from thunder-storms, citing 66 references. The following is a summary of the article.
X-rays and gamma rays are emitted by thunderclouds and are associated with lightning. On average, each com-mercial aircraft is struck by lightning about once every 3,000 flight hours. Also, large bursts of gamma rays ema-nating from our atmosphere, called terrestrial gamma-ray flashes (TGFs), have been observed by spacecraft since 1994. In both lightning and TGFs, the high-energy emissions are believed to occur when electrons in air traveling at very close to the speed of light collide with the nuclei of air atoms.
There are many unknowns, including the occurrence rate of TGFs relative to lightning, the effect of the aircraft triggering the lightning, and the frequency and lengths of electron acceleration regions in thunderstorms. The estimated dose received by an individual in an aircraft struck by TGF- or lightning-energetic electrons is about 30 mSv. Thus, a significant number of aircraft occupants may receive a large radiation dose. Direct measurements have not been made.
CONCLUDING REMARKS
In a Presidential Document, it is recommended that individuals occupationally exposed to ionizing radiation be instructed on its health risks (60).
The FAA recommends that air-carrier crews be in-formed about their radiation exposure and the associated health risks (61). The FAA mandates that information on risks of space travel be provided to space flight partici-pants prior to their participation on space flights under its jurisdiction (62).
This report can be used as a source book for instruction on ionizing radiation exposure of air and space travelers. It provides information on: (a) its basic characteristics, (b) the types that will be encountered during air and space travel, (c) its natural sources, (d) exposure levels and associated health risks.
REFERENCES
1. Ne’eman Y, Kirsh Y. The particle hunters. 2nd ed. Cam-bridge, U.K.: Cambridge University Press, 1996.
2. X-rays. The Encyclopedia Americana, international edition, volume 29. Danbury, CT: Grolier 1989: 598-600.
3. Nobel Foundation. Nobel lectures, including presen-tation speeches and laureates’ biographies, physics 1901-1921. Amsterdam: Elsevier, 1967.
4. Becquerel AH. Sur les radiations émises par phos-phorescence. Comptes rendus de ľAcadémie des Sciences 1896; 122:420-421.
5. Perricone M. Balloon flight launches cosmic ray educa-tion project. Ferminews 2001 July; 24(12):10-11.
6. Nobel Foundation. Nobel lectures, including presen-tation speeches and laureates’ biographies, physics 1922-1941. Amsterdam: Elsevier, 1965.
7. United Nations Scientific Committee on the Effects of Atomic Radiation. United Nations Scientific Committee on the Effects of Atomic Radiation UNSCEAR 1993 report to the General Assembly, with scientific annexes. New York: United Nations, 1993.
8. National Research Council. Health risks from exposure to low levels of ionizing radiation: BEIR VII, Phase 2. Washington: National Academies Press, 2006.
9. Hall EJ, Giaccia AJ. Radiobiology for the radiolo-gist. 6th ed. Philadelphia: Lippincott Williams & Wilkins, 2006.
10. National Council on Radiation Protection and Measurements. Radiation protection guidance for activities in low-Earth orbit. Bethesda, MD: The Council, 2000. Report no. 132.
11. International Commission on Radiological Protec-tion. The 2007 recommendations of the Interna-tional Commission on Radiological Protection. London: Elsevier, 2007. Report no. 103.
12. International Commission on Radiological Protec-tion. 1990 recommendations of the International Commission on Radiological Protection. Elmsford, NY: Pergamon, 1991. Report no. 60.
13. International Commission on Radiological Protec-tion. Adult reference computational phantoms. London: Elsevier, 2009. Report no. 110.
14. Atmosphere. Encyclopedia Americana, international edition, volume 2. Danbury, CT: Grolier, 1989: 626-629.

22
15. Atmosphere. McGraw-Hill encyclopedia of science and technology, volume 2. 7th ed. Danbury, CT: Grolier, 1992: 199-204.
16. National Aeronautics and Space Administration, “World book at NASA” www.nasa.gov/worldbook/meteor_worldbook.html, accessed 11 August 2010.
17. National Aeronautics and Space Administration, “Space math @ NASA problem 185: The Interna-tional Space Station: follow that graph!” spacemath.gsfc.nasa.gov/weekly/5Page35.pdf, accessed 11 August 2010.
18. Walt M. Introduction to geomagnetically trapped radiation. Cambridge, U.K.: Cambridge University Press, 1994.
19. Smart DF, Shea MA. Solar radiation. In: Encyclopedia of applied physics, vol. 18. New York, NY: VCH Publishers, 1997: 393-429.
20. Demorest P. “Dynamo theory and Earth’s mag-netic field” 2001, setiathome.berkeley.edu/~pauld/etc/210BPaper.pdf, accessed 1 October 2010.
21. Wilson JG. Cosmic rays. London: Wykeham, 1976.
22. Copeland K, Sauer HH, Duke FE, Friedberg W. Cosmic radiation exposure of aircraft occupants on simulated high-latitude flights during solar proton events from 1 January 1986 through 1 January 2008. Advances in Space Research 2008; 42:1008-29.
23. CARI-6P [computer program]. Oklahoma City: Friedberg W, Duke FE, Snyder L, et al.; 2005.
24. National Council on Radiation Protection and Measurements. Limitation of Exposure to Ionizing Radiation. Bethesda, MD: The Council, 1993. Report no. 116.
25. Nakamura K, Hagiwara K, Hikasa K, et al. (Particle Data Group). Baryon summary tables. Journal of Physics G 2010; 37: 075021 (also available at: pdg.lbl.gov/2010/tables/contents_tables_baryons.html, accessed 7 October 2010).
26. National Council on Radiation Protection and Measurements. Information needed to make radioprotection recommendations for space mis-sions beyond low-Earth orbit. Bethesda, MD: The Council, 2006. Report no. 153.
27. National Council on Radiation Protection and Measurements. Guidance on radiation received in space activities. Bethesda, MD: The Council, 1989. Report no. 98.
28. Newell HE, Naugle JE. Radiation environment in space. Science 1960; 132:1465-1472.
29. Li W, Chornock R, Leaman J, et al., “Nearby super-nova rates from the Lick Observatory supernova search. III. The rate-size relation, and the rates as a function of galaxy Hubble type and colour” 2010, en.scientificcommons.org/58335038, accessed 7 September 2010.
30. Pierre Auger Collaboration. Correlation of the highest-energy cosmic rays with nearby extragalactic objects. Science 2007; 318:938-943.
31. LUINNCRP [computer program] Sedona, AZ: O’Brien K; 2002.
32. Parkinson WD. Introduction to geomagnetism. New York: Elsevier, 1983.
33. Burch JL. The fury of space storms. Scientific American 2001; 284(4):86-94.
34. Friedberg W, Snyder L, Faulkner DN, et al. Radiation exposure of air carrier crewmembers II. Washington: Office of Aviation Medicine; 1992: Report no. DOT/FAA/AM-92/2.
35. National Oceanic and Atmospheric Administration, Space Weather Prediction Center. “Solar proton events affecting the Earth environment” 2010, www.swpc.noaa.gov/ftpdir/indices/SPE.txt, ac-cessed 8 October 2010.
36. American Conference of Governmental Industrial Hygienists. TLVs and BEIs: Threshold limit val-ues for chemical substances and physical agents and biological exposure indices. Cincinnati, OH: Signature Publications, 2010.
37. Federal Aviation Administration. Order 3900.19B, chapter 14, part 1406, paragraph ‘a’. Washington, DC: Department of Transportation, Federal Avia-tion Administration, 26 August 2008.
38. Zapp N. “Space radiation—frequently asked ques-tions” 20 August 2010, srag-nt.jsc.nasa.gov/ SpaceRadiation/FAQ/FAQ.cfm, accessed 8 October 2010.
39. Commission of the European Communities. Council Directive 96/29/EURATOM/ of 13 May 1996. Official Journal of EC 29 June 1996; Series L, No. 159, Vol 39.
40. Commission of the European Communities. Recom-mendations for the implementation of Title VII of the European Basic Safety Standards Directive (BSS) concerning significant increase in exposure due to natural radiation sources. Brussels: European Commission Directorate-General Environment, Nuclear Safety and Civil Protection, 1997. Report no. Radiation Protection 88.

23
41. Hada M, Sutherland BM. Spectrum of complex DNA damages depends on the incidence radiation. Radiation Research 2006; 165:223-230.
42. Greenlee RT, Hill-Harmon MB, Murray T, Thun M. Cancer statistics, 2001. CA a Cancer Journal for Clinicians 2001; 51:15-36.
43. National Research Council. Health effects of low levels of ionizing radiation: BEIR V. Washington: National Academy Press, 1990.
44. Odenwald SF, Green JL. Bracing for a solar super-storm. Scientific American 2008; 299(2):80-87.
45. Yasuda H, Badhwar GD, Komiyama T, Fujitaka K. Effective dose equivalent on the ninth Shuttle-Mir mission (STS-91). Radiation Research 2000; 154:705-713.
46. National Council on Radiation Protection and Measurements. Management of terrorist events involving radioactive material. Bethesda, MD: The Council, 2001. Report no. 138.
47. Cucinotta FA, Manuel FK, Jones J, et al. Space radia-tion and cataracts in astronauts. Radiation Research 2001; 156:460-466.
48. Gusev IA, Guskova AK, Mettler FA, eds. Medical management of radiation accidents. 2nd ed. New York: CRC, 2001.
49. Ricks RC, Berger ME, O’Hara FM Jr., eds. The medical basis for radiation-accident preparedness. New York: Parthenon Publishing Group, 2002.
50. Rudy DR, Zdon MJ. Update on colorectal cancer. American Family Physician 2000; 61(6):1759-1770.
51. National Council on Radiation Protection and Mea-surements. Radiological factors affecting decision-making in a nuclear attack. Bethesda, MD: The Council, 1974. Report No.:42.
52. National Council on Radiation Protection and Measurements. Risk to the thyroid from ionizing radiation. Bethesda, MD: The Council, 2008. Report No.:159.
53. U.S. Dept. of Health and Human Services, Food and Drug Administration, Center for Drug Evalu-ation and Research. “Guidance: Potassium iodide as a thyroid blocking agent in radiation emergen-cies” December 2001, www.fda.gov/downloads/drugs/guidancecomplianceregulatoryinformation/ guidances/ucm080542.pdf, accessed 8 October 2010.
54. Zanzanico PB, Becker DV. Effects of time of admin-istration and dietary iodine levels on potassium iodide (KI) blockade of thyroid irradiation by I-131 from radioactive fallout. Health Physics 2000; 78(6):660-667.
55. U.S. Government Printing Office, National Archives and Records Administration, “Code of Federal Regulations: linking to documents” Title 10, Part 20, Subpart O, Appendix B 2011, www.gpoaccess.gov/cfr/link.html, accessed 28 March 2011.
56. Marcus CS. Administration of decorporation drugs to treat internal radionuclide contamination: medical emergency response to radiologic incidents. RSO Magazine, 2004; 9(5):9-15.
57. U.S. Government Printing Office, National Archives and Records Administration, “Code of Federal Regulations: linking to documents” Title 49, Part 173, Subpart I, 173.441 B 2011, www.gpoaccess.gov/cfr/link.html, accessed 28 March 2011.
58. U.S. Government Printing Office, National Archives and Records Administration, “Code of Federal Regulations: linking to documents” Title 49, Part 175, Subpart C, 175.705 2011, www.gpoaccess.gov/cfr/link.html, accessed 28 March 2011.
59. Dwyer JR, Smith DM, Uman MA, et al. Estimation of the fluence of high-energy electron bursts produced by thunderclouds and the resulting radiation doses received in aircraft. Journal of Geophysical Research 2010; 115:D09206 (doi:10.1029/2009JD012039).
60. U.S. Environmental Protection Agency. Radiation Protection Guidance to Federal Agencies for Oc-cupational Exposure: Recommendations approved by the President. Federal Register 1987; 52:2822-2834.
61. Federal Aviation Administration. Crewmember train-ing on in-flight radiation exposure. Washington: The Administration; 19 May 1994. Report No.: Advisory Circular 120-61.
62. U.S. Government Printing Office, National Archives and Records Administration, “Code of Federal Regulations: linking to documents” Title 14, Part 460, Subpart B 2010, www.gpoaccess.gov/cfr/link.html, accessed 13 October 2010.
