iowa manufacturing needs assessment - …€¦ · 3 executive summary ciras conducted a survey of...
TRANSCRIPT
Copyright 2016 Iowa State University, All Rights Reserved
Iowa Manufacturing Needs Assessment 2015–2016
July 18, 2016
2
Contents
Executive Summary ....................................................................................................................................... 3
The State of Iowa Manufacturing ................................................................................................................. 4
Strategy, Barriers, and Actions: A Story of Mismatches ............................................................................. 14
Digital Manufacturing: Gateway to the Future? ......................................................................................... 18
Health, Wellness, and the Bottom Line ...................................................................................................... 20
What Do Companies Really Need? ............................................................................................................. 22
Appendix: Profile of Iowa Manufacturing ................................................................................................... 26
3
Executive Summary CIRAS conducted a survey of Iowa manufacturing leaders during the fall of 2015 to better understand
the needs of Iowa manufacturers. More than 250 manufacturing leaders with representation of the
diversity of Iowa manufacturing provided input on strategy, actions, growth inhibitors, and results.
CIRAS used these results, combined with follow-up analysis, individual conversations, and focus groups
of respondents, partners, and other manufacturing experts to determine the key needs of Iowa
manufacturers to thrive over the long term.
Key findings include the following:
While the majority of manufacturers operate with low margins, approximately one quarter of
respondents reported return on sales of more than 15%.
There is a gap in stated strategy and behaviors of many companies, which may be contributing
to some of the issues that companies are experiencing.
Health care costs are the most significant expected growth inhibitors among Iowa
manufacturers.
Despite continued expression of workforce availability issues, there is little evidence of
widespread use of proven tools to ease those issues, including productivity (such as Lean
manufacturing) and automation.
We identified a potential link between maturity in 3D CAD (computer-aided design) and
advanced engineering tools and reduced concern that labor costs will impact ability to grow,
indicating that digital competency may create significant value for Iowa manufacturers.
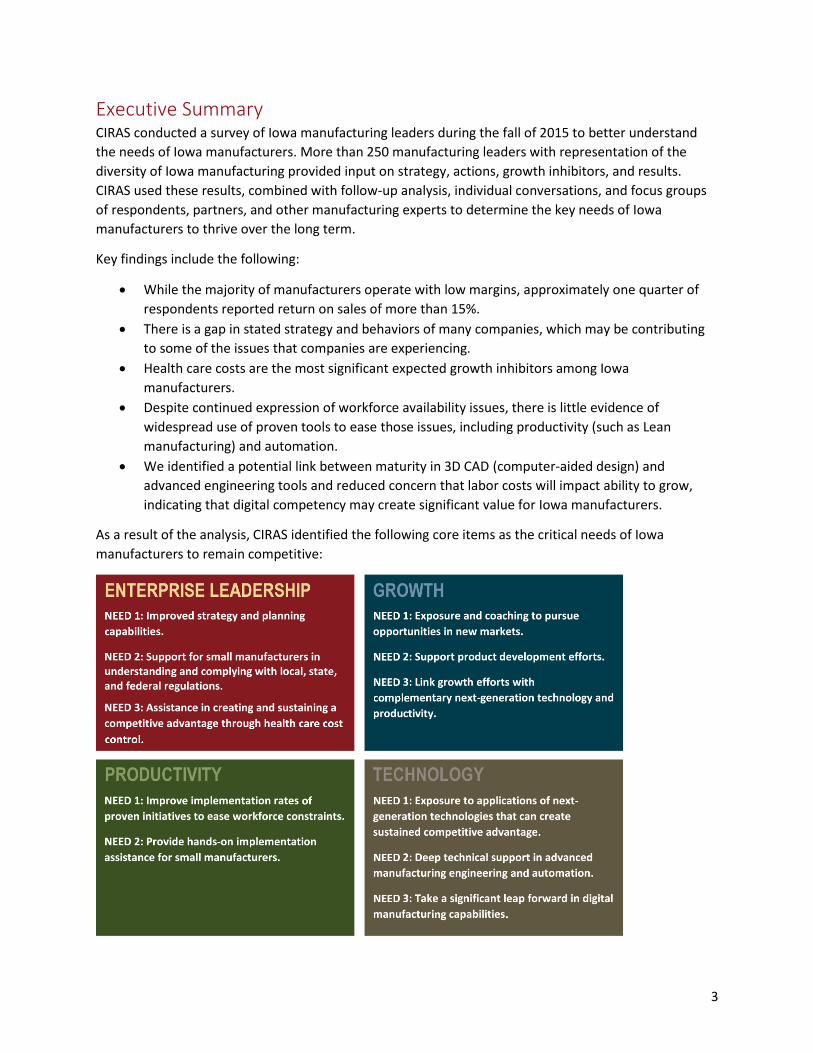
As a result of the analysis, CIRAS identified the following core items as the critical needs of Iowa
manufacturers to remain competitive:

4
The State of Iowa Manufacturing Iowa’s economy is deeply reliant on manufacturing. More than 6,100 manufacturers contribute in
excess of $31 billion to Iowa’s economy, making it the second-largest sector in Iowa. Beyond pure
economic size, manufacturing delivers an unmatched combination of employment (fourth in the state),
wages (second in the state), and geographic distribution. For detailed economic data on manufacturing
in Iowa, please see the CIRAS 2015 Manufacturing in Iowa report.1
Economic data, however, can only tell part of the story of Iowa manufacturing. In order to better
understand the underlying issues, risks, and opportunities that will define the future of manufacturing,
CIRAS undertook a detailed survey of Iowa manufacturers. A total of 256 manufacturers of all shapes
and sizes responded to an in-depth survey regarding their companies, limitations to growth, actions, and
results. In addition, focus groups of manufacturers, stakeholders, and other experts were held to better
interpret the meaning of the data found. For detailed responses and statistics, please see the final
section of this report, “Profile of Iowa Manufacturing.”
This section of the report provides the key findings and conclusions on the well-being of Iowa
manufacturers and subdivisions within manufacturing. The next section, “Strategy, Barriers, and Actions:
A Story of Mismatches,” summarizes crucial issues impacting the long-term sustainability of
manufacturing in Iowa. The following sections then focus on translating key aspects of the data to
understand the true needs of manufacturers across the state.
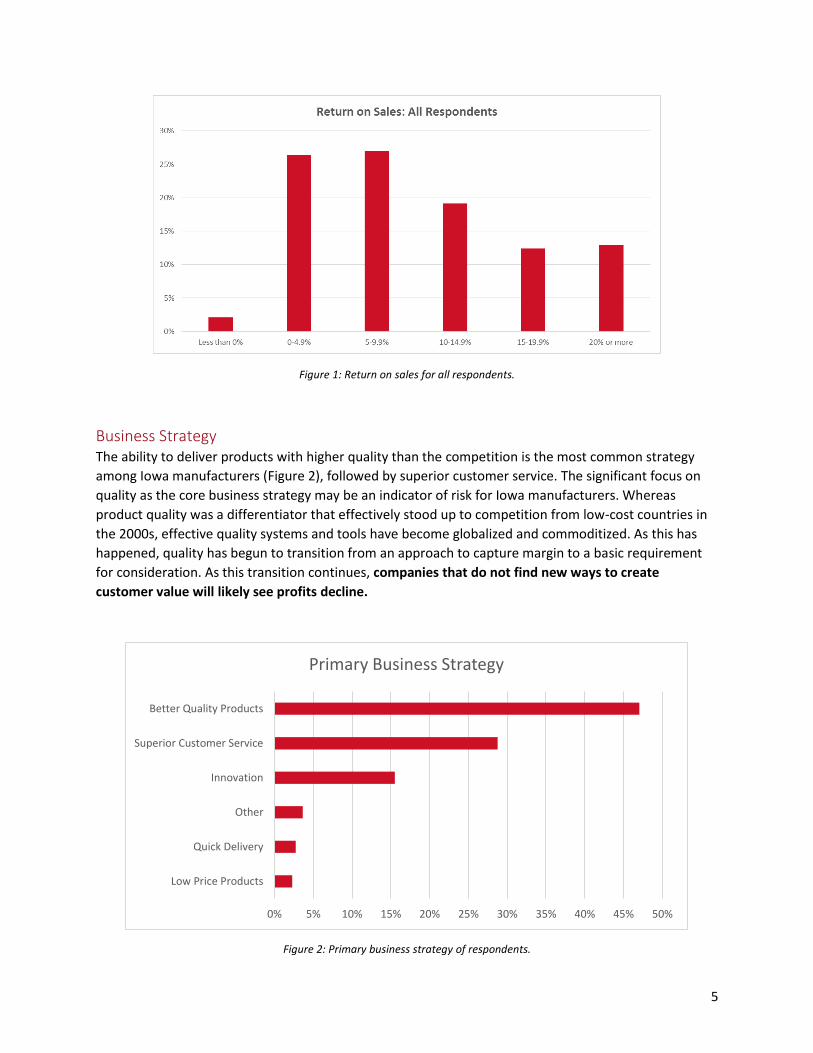
Profitability The majority (55%) of respondents to the survey report a return on sales (ROS) of less than 10%,
furthering the notion of Iowa as a low-margin manufacturing state (Figure 1). There is a sizeable
minority of manufacturers in Iowa, however, reporting an ROS of 20% or higher, demonstrating that
there is a significant group of manufacturers that create and sell high-value products.
A notable finding in this part of the analysis is the general lack of statistically significant variation in ROS
by a number of factors. Although the respondents in Food Manufacturing showed slightly lower ROS
results, and respondents in Miscellaneous Manufacturing showed slightly higher, the difference was not
significant. Company size also did not show any statistically significant impact on ROS. Finally, company
strategy did not show a statistically significant impact on ROS. Other studies, such as a similar survey in
Georgia,2 have indicated higher ROS results for companies with strategies focused on innovation. This
gap will be discussed later in this report.
1 http://www.ciras.iastate.edu/Manufacturing_In_Iowa_2015.pdf 2 http://www.gms-ei2.org/2014/02/2014-survey/
5
Figure 1: Return on sales for all respondents.
Business Strategy The ability to deliver products with higher quality than the competition is the most common strategy
among Iowa manufacturers (Figure 2), followed by superior customer service. The significant focus on
quality as the core business strategy may be an indicator of risk for Iowa manufacturers. Whereas
product quality was a differentiator that effectively stood up to competition from low-cost countries in
the 2000s, effective quality systems and tools have become globalized and commoditized. As this has
happened, quality has begun to transition from an approach to capture margin to a basic requirement
for consideration. As this transition continues, companies that do not find new ways to create
customer value will likely see profits decline.
Figure 2: Primary business strategy of respondents.
0% 5% 10% 15% 20% 25% 30% 35% 40% 45% 50%
Low Price Products
Quick Delivery
Other
Innovation
Superior Customer Service
Better Quality Products
Primary Business Strategy
6
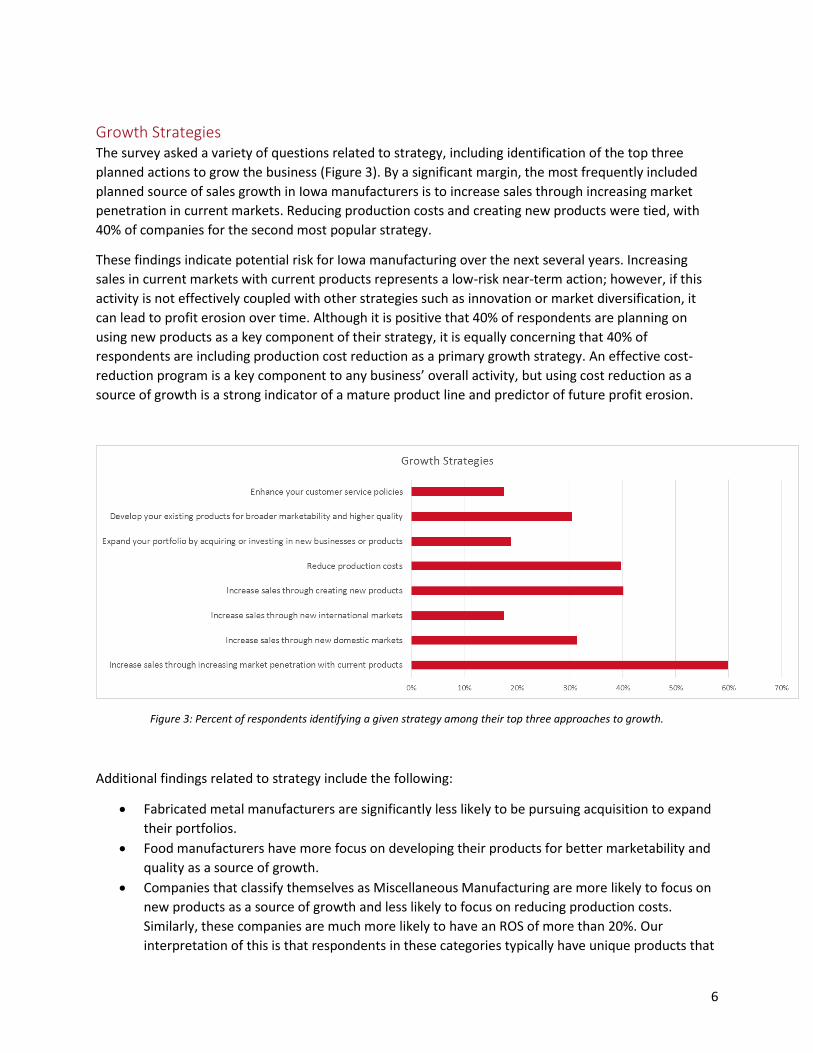
Growth Strategies The survey asked a variety of questions related to strategy, including identification of the top three
planned actions to grow the business (Figure 3). By a significant margin, the most frequently included
planned source of sales growth in Iowa manufacturers is to increase sales through increasing market
penetration in current markets. Reducing production costs and creating new products were tied, with
40% of companies for the second most popular strategy.
These findings indicate potential risk for Iowa manufacturing over the next several years. Increasing
sales in current markets with current products represents a low-risk near-term action; however, if this
activity is not effectively coupled with other strategies such as innovation or market diversification, it
can lead to profit erosion over time. Although it is positive that 40% of respondents are planning on
using new products as a key component of their strategy, it is equally concerning that 40% of
respondents are including production cost reduction as a primary growth strategy. An effective cost-
reduction program is a key component to any business’ overall activity, but using cost reduction as a
source of growth is a strong indicator of a mature product line and predictor of future profit erosion.
Figure 3: Percent of respondents identifying a given strategy among their top three approaches to growth.
Additional findings related to strategy include the following:
Fabricated metal manufacturers are significantly less likely to be pursuing acquisition to expand
their portfolios.
Food manufacturers have more focus on developing their products for better marketability and
quality as a source of growth.
Companies that classify themselves as Miscellaneous Manufacturing are more likely to focus on
new products as a source of growth and less likely to focus on reducing production costs.
Similarly, these companies are much more likely to have an ROS of more than 20%. Our
interpretation of this is that respondents in these categories typically have unique products that

7
cannot be easily classified into commodity groups, which typically translates into higher-profit
products with less competition.
Companies with less than 10 employees are much less likely to include cost reduction as a top
growth strategy.
Companies with 100–499 employees are much more likely to include cost reduction as a source
of growth.
Companies with a strategy of innovation are more likely to include new products and new
international markets as a source of growth.
Companies with a strategy of customer service are less likely to include new product
development or international markets as a source of growth.
There is no statistically significant relationship between historical ROS and planned growth
strategy. Although certain strategies may introduce different types of risk, they are not related
to the profitability of companies that responded to this survey.
Developing New Products One key factor in the long-term success of a manufacturing business is the ability to develop new
products and services on a regular basis. This survey found that there are pockets of active product
development throughout the state, but that the majority of product and service development is “new to
the business” rather than “new to the market and not produced by competitors” (Figure 4). Although
77% of respondents released new products and/or services in the past year, only 31% of respondents
released products that were new to the market.
Figure 4: Portion of companies releasing new products and services in the past year.
Additional analysis produced several other findings:
There was no statistically significant variation in the portion of companies releasing new
products and services among the top industries.
Companies with a strategy of innovation partially lived up to their promise: 91% released new
products and/or services, and 56% of them were new to the market. This is significantly above
New Products & Services in the Past Year
None
New to your business
Other
New to the market and not produced by competitors

8
Iowa averages, but 35% of companies who stated their strategy is innovation released “me too”
products to the market, a possible indicator of why companies with this stated strategy do not
exhibit evidence of higher profitability.
Although release of new products and services by company size showed some variation, it was
not statistically significant.
Inhibitors of Growth In order to best determine the needs of Iowa manufacturers, an understanding of what items business
leaders perceive as the major impediments to growth is required. Respondents to the survey provided
clear insights into what they were most concerned about (Figure 5).
Figure 5: Company-reported inhibitors of growth.
The rising cost of health care clearly stands out as the most significant expected impediment to
growth for Iowa manufacturers over the next five years. Of special interest is its universal impact: size,
strategy, profitability, and industry do not significantly impact the fact that leaders consider this to have
a significant impact on their ability to grow. Respondents from the food industry were the only
population to rank any issue higher than health care, placing rising labor, raw material, and energy costs
slightly higher.
In addition, three often-discussed inhibitors to growth were generally dismissed by respondents:
(1) access to capital; (2) transportation infrastructure; and (3) availability of local services. Certain
subgroups did identify these as more moderate issues, but overall they were the bottom three
responses.
Issues did vary significantly when considering various sectors within Iowa manufacturing. Figure 6 breaks
down top issues by a variety of factors.
Strongly Agree Agree Disagree Strongly Disagree Neutral

9
Figure 6: Top and bottom three inhibitors of growth by industry, strategy, and company size.
Top 3 Issues Bottom 3 Issues
Fabricated Metal Product Manufacturing
Rising health care costs
Inadequate availability of hourly workforce
Domestic competitive pressures
Inadequate transportation infrastructure
Availability of local specialty service firms
Inadequate access to capital/financing
Food Manufacturing
Rising labor costs
Raw material costs
Energy costs
Foreign government regulations
Off-shoring
Re-shoring
Machinery Manufacturing
Rising health care costs
Inadequate availability of salaried technical
workforce
Inadequate availability of hourly workforce
Re-shoring
Inadequate access to capital/financing
Inadequate transportation infrastructure
Miscellaneous Manufacturing
Rising health care costs
U.S. government regulations
Raw material costs / Rising labor costs (tie)
Availability of local specialty service firms
Inadequate transportation infrastructure
Re-shoring
Plastics and Rubber Products
Manufacturing
Rising health care costs
Inadequate availability of hourly workforce
Rising labor costs
Inadequate transportation infrastructure
Availability of local specialty service firms
Inadequate access to capital/financing
Better Quality Products
Rising health care costs
Rising labor costs
Inadequate availability of hourly workforce
Re-shoring
Availability of local specialty service firms
Inadequate transportation infrastructure
Innovation
Rising health care costs
U.S. government regulations
Rising labor costs
Inadequate transportation infrastructure
Customer-driven certifications
Availability of local specialty service firms
Superior Customer Service
Rising health care costs
U.S. government regulations
Inadequate availability of hourly workforce
Availability of local specialty service firms
Inadequate transportation infrastructure
Inadequate access to capital/financing
1-4
Rising health care costs
State government regulations
U.S. government regulations
Inadequate availability of salaried technical
workforce
Availability of local specialty service firms
Inadequate transportation infrastructure
5-9
Rising health care costs
U.S. government regulations
Raw material costs
Inadequate access to capital/financing
Inadequate transportation infrastructure
Foreign government regulations
10-19
Rising health care costs
U.S. government regulations
Rising labor costs
Inadequate transportation infrastructure
Re-shoring
Availability of local specialty service firms
20-99
Rising health care costs
Inadequate availability of hourly workforce
U.S. government regulations
Availability of local specialty service firms
Inadequate transportation infrastructure
Inadequate access to capital/financing
100-499
Rising health care costs
Inadequate availability of hourly workforce
Inadequate availability of salaried technical
workforce
Inadequate access to capital/financing
Availability of local specialty service firms
Foreign government regulations
500+
Rising health care costs
Energy costs
Foreign competitive pressures
Availability of local specialty service firms
Customer-driven certifications
Inadequate availability of salaried nontechnical
workforce
Ind
ust
rySt
rate
gy#
of
Emp
loye
es

10
In addition to asking questions regarding the key issues potentially inhibiting growth, the survey asked
companies whether or not they felt they had the internal resources to adequately address issues in each
of the potential areas. For the most part, responses were neutral. The top three areas of confidence are
the ability to address ownership or leadership transition, consumer-driven sustainability demands, and
technological changes. The bottom three areas (least likely to have resources) are rising health care
costs, U.S. government regulations, and rising labor costs. While most manufacturers were relatively
concerned about resources to respond to regulatory issues, food manufacturers were relatively
confident in their ability to respond, likely because the industry has been highly regulated for so long.
Actions and Results This survey asked two key questions regarding strategic initiative actions and results. First, for a list of 18
initiatives, the survey asked the extent to which the company has implemented each item (5 = Fully
implemented, 4 = Full Implementation in Progress, 3 = Partial Implementation, 2 = Considered but Not
Implemented, 1 = Not Considered). Then, for the same list, the survey asked the perceived benefits for
the initiatives companies have implemented (5 = Significantly Above Expectations, 4 = Above
Expectations, 3 = Met Expectations, 2 = Below Expectations, 1 = Significantly Below Expectations).
Pairing these two questions provides insight into implementation levels among Iowa manufacturers and
potential benefits compared to expectations. Figure 7 compares the results from both questions. Of
note is the generally low level of implementation of initiatives despite positive results.
11
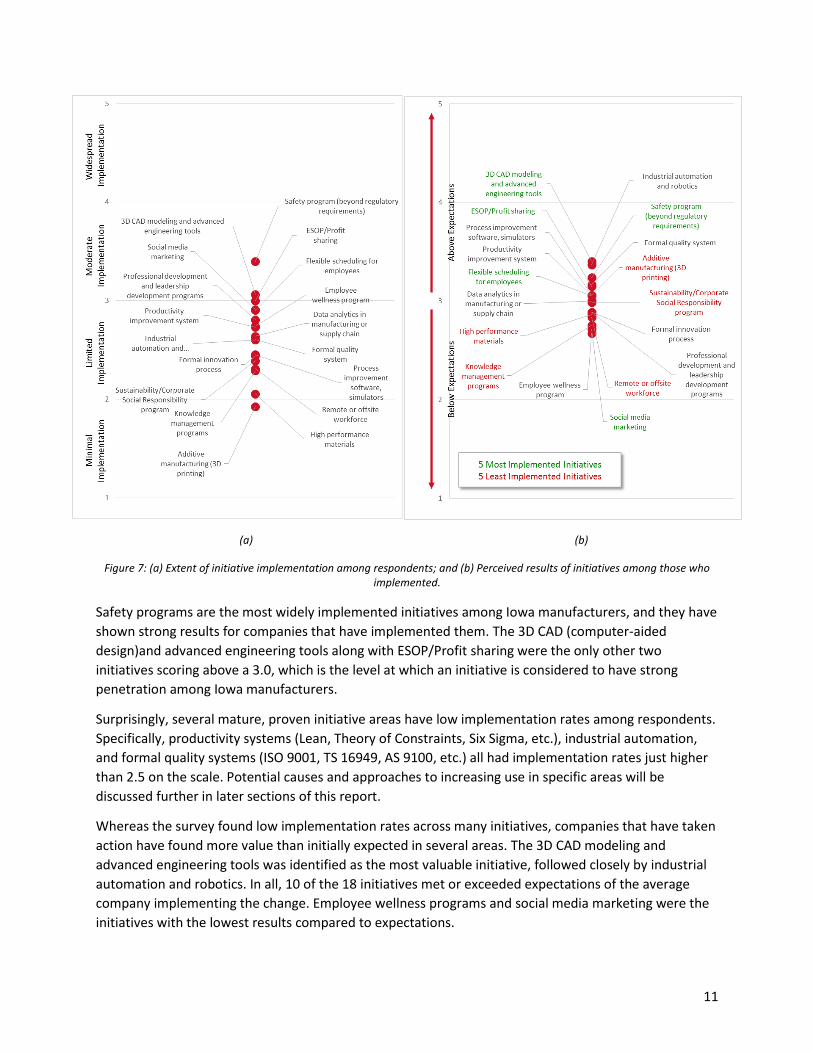
(a) (b)
Figure 7: (a) Extent of initiative implementation among respondents; and (b) Perceived results of initiatives among those who implemented.
Safety programs are the most widely implemented initiatives among Iowa manufacturers, and they have
shown strong results for companies that have implemented them. The 3D CAD (computer-aided
design)and advanced engineering tools along with ESOP/Profit sharing were the only other two
initiatives scoring above a 3.0, which is the level at which an initiative is considered to have strong
penetration among Iowa manufacturers.
Surprisingly, several mature, proven initiative areas have low implementation rates among respondents.
Specifically, productivity systems (Lean, Theory of Constraints, Six Sigma, etc.), industrial automation,
and formal quality systems (ISO 9001, TS 16949, AS 9100, etc.) all had implementation rates just higher
than 2.5 on the scale. Potential causes and approaches to increasing use in specific areas will be
discussed further in later sections of this report.
Whereas the survey found low implementation rates across many initiatives, companies that have taken
action have found more value than initially expected in several areas. The 3D CAD modeling and
advanced engineering tools was identified as the most valuable initiative, followed closely by industrial
automation and robotics. In all, 10 of the 18 initiatives met or exceeded expectations of the average
company implementing the change. Employee wellness programs and social media marketing were the
initiatives with the lowest results compared to expectations.

12
Implementation rates and benefits were generally consistent across industries, with expected
exceptions such as low 3D CAD implementation in the food industry. There was variation of
implementation rates by strategy, which will be discussed in the section “Strategy, Barriers, and Actions:
A Story of Mismatches.” Implementation rates showed significant variation by company size, as shown
in Figure 8. The perceived value of initiatives, however, showed very little variation by size (Figure 9),
indicating significant potential value by helping smaller companies implement proven initiatives.
Figure 8: Initiative implementation rate by company size.
Figure 9: Initiative results by company size.
1
2
3
4
5
1-4 5-9 10-19 20-99 100-499 500+
# of Employees
Extent of Implementation by Size
Average implementation rate Implementation rate of individual initiatives
1
2
3
4
5
1-4 5-9 10-19 20-99 100-499 500+
# of Employees
Initiative Result by Company Size
Average implementation rate Implementation rate of individual initiatives
13
Rural vs. Urban Performance A key discussion topic when analyzing the needs of Iowa manufacturers is the variation in needs
between rural and urban manufacturers. Rural-urban commuting area (RUCA)3 codes were used to
categorize all respondents as either metropolitan (urbanized area of more than 50,000 people),
micropolitan (urbanized area of 10,000–49,999 people), or rural (nonurban or urbanized area of less
than 10,000 people). This analysis identified no significant variation among issues, initiative
implementation, strategy, or profitability when controlling for level of urbanization. Although rural and
urban regions of the state may face different long-term challenges and opportunities, there is no
evidence to suggest that rural manufacturers in Iowa are facing a significantly different landscape than
urban manufacturers.
3 http://www.ers.usda.gov/data-products/rural-urban-commuting-area-codes.aspx

14
Strategy, Barriers, and Actions: A Story of Mismatches Perhaps the most significant finding of the needs assessment was an apparent disconnect between
stated strategies, barriers to growth, and implementation of key initiatives. These insights may prove to
be significant in that they can help better translate what companies are saying to specific actions in
order to help Iowa manufacturers take a leap to the future.
The first gap was between the stated primary business strategy of respondents and the initiatives that
they have taken as a business. For example, for companies with a strategy to provide quality products,
you would expect certain initiatives to be more prevalent than others, such as implementation of a
quality system. Surprisingly, this is not always the case. Figure 10 shows the extent of implementation of
initiatives by strategy.
Companies with a strategy of superior customer service showed indications that they were generally
likely to implement initiatives that are closely related to customer-focused strategies. This includes
quality systems, knowledge management systems, etc. They were also slightly more likely to implement
several people-focused initiatives, including professional development programs, wellness programs,
and safety. Overall, companies with this strategy were more action oriented.
Although companies with an innovation focus were more likely to implement innovation-oriented
initiatives, the level of action is considerably lower than you would expect for companies with this
strategy. As discussed previously, 35% of respondents with a strategy of innovation only released “me
too” products or services in the past year. Also, only 50% of companies with an innovation strategy have
a formal innovation process and only 62% have implemented 3D CAD and advanced engineering tools.
This data suggests that whereas there are certainly innovative companies with strong alignment
between strategy and actions, there is a subset of companies that want to be innovative but are not
showing systematic alignment with this stated strategy.
The most frequently identified primary strategy among respondents was superior quality, and this set of
respondents showed the least alignment of initiatives with strategy. Among all respondents, the average
implementation rate of formal quality systems was 2.6, which was surprisingly low on its own. Among
respondents with a strategy of superior quality, the average implementation rate of formal quality
systems was only 2.5. Although this drop is not statistically significant, one would expect companies with
a strategy of superior quality to implement formal quality systems at a rate that is significantly higher
than other strategies. There are no initiatives that companies with a stated strategy of superior quality
implemented at a higher rate than other strategies. This indicates that the strategy of “quality” may
consist of two types of companies—those with a strategy of quality, and those with no concrete
strategy.
The gap between stated strategy and implementing initiatives that support that strategy provides
lessons in terms of key needs of Iowa manufacturers. Based on this data, it is likely that manufacturers
of all sizes need assistance in better understanding their competitive advantage, annunciating this
advantage as a strategy, and/or developing and implementing achievable plans to enact that strategy.

15
Figure 10: Extent of implementation of strategic initiatives by stated strategy.
Analysis was completed to investigate linkages between self-identified barriers to growth,
implementation of strategic initiatives to attack those barriers, and results in implementing those
1 2 3 4 5
Safety program (beyond regulatory requirements)
3D CAD modeling and advanced engineering tools
ESOP/Profit sharing
Social media marketing
Flexible scheduling for employees
Professional development and leadership developmentprograms
Employee wellness program
Productivity improvement system (Lean, Theory ofConstraints, Six Sigma etc.)
Data analytics in manufacturing or supply chain
Formal quality system (ISO 9000, TS 16949, AS 9100 etc.)
Industrial automation and robotics
Process improvement software, simulators
Formal innovation process
Sustainability/Corporate Social Responsibility program
Remote or offsite workforce
Knowledge management programs
High performance materials (metals, synthetic polymers,ceramics etc.)
Additive manufacturing (3D printing)
Extent of Implementation: Strategy
Average Innovation Superior Customer Service Better Quality Products

16
related initiatives. First and foremost, there seems to be little evidence that companies have identified
and/or implemented best practices in health care/wellness to combat fears of health care costs
hindering growth. Health care is discussed separately in the section “Health, Wellness, and the Bottom
Line.”
The need for more qualified middle-skill employees across Iowa is well documented and discussed.
Given the level of discussion statewide, identification of rising labor costs, inadequate availability of
hourly workforce, and inadequate availability of salaried technical workforce as three of the top eight
growth inhibitors was not surprising. What was surprising, however, was the low level of
implementation of proven strategic initiatives that can provide long-term relief given workforce
availability in Iowa. Figure 11 shows the implementation and benefit chart repurposed to identify
programs that can have a significant impact on a business’s ability to attract and retain workforce and to
expand without adding additional workforce.
Figure 11: Initiative implementation and perceived results, including only workforce-related initiatives.
Review of this data identifies two core groups of initiatives: (1) high-value tools with relatively low
implementation rates (industrial automation and robotics, productivity improvement systems, process

17
improvement software, etc.); and (2) high-potential tools with poor implementation results. The lone
standout is ESOP/Profit sharing, which enjoys moderate implementation throughout the state and
better-than-expected results. There are outstanding, necessary efforts under way to attract people of all
ages to manufacturing and to train employees in critical middle-skill programs, led by Elevate.4 This
data, however, indicates that complementary investments in implementing proven productivity and
technical tools are needed to ease workforce demands.
An analysis has been performed comparing the extent to which companies implemented initiatives and
their concern over issues preventing growth. In the vast majority of cases, there was no statistically
significant correlation between implementing initiatives and response to growth issues. There was,
however, a statistically significant relationship between 3D CAD and advanced engineering tools, and
the belief that rising labor costs will limit growth in the next five years (Figure 12). The extent to which
companies have implemented 3D CAD and advanced engineering tools correlates with a lower
concern that rising labor costs will limit growth. Implementation of 3D CAD and other advanced
engineering tools may be an indicator of an organization that can both control costs and maintain
market relevancy better than other organizations.
Figure 12: Link between implementation of 3D CAD and concern over rising labor costs.
4 http://www.elevateiowa.com/
1 2 3 4 5
# o
f R
esp
on
den
ts b
y an
swer
Exte
nt
of
Imp
lem
enta
tio
n
I believe that rising labor costs will limit growth in the next 5 years
Grand Total 3D CAD Modeling & Advanced Engineering Tools
Full
Partial
NoneStrongly Agree Agree Neutral Disagree Strongly Disagree
18
Digital Manufacturing: Gateway to the Future?
While you read these words, the future of American manufacturing is being written at nine specially
linked institutes created by $2.1 billion in investment from the U.S. government, research universities,
and hundreds of American companies.
It’s called the National Network for Manufacturing Innovation, or NNMI. If you aren’t familiar with it,
you should start educating yourself as soon as possible. Your ability to compete could change
dramatically depending on the work they do and how quickly you’re willing and/or able to embrace it.
The NNMI is a network of public-private partnerships designed to combine resources and expertise so
that technology moves rapidly from research to real solutions. This is happening primarily through
“project calls,” where member-driven groups identify key needs in a given technology area and decide
which projects to fund. The goal is simple: do something real and do it fast.
One key aspect of all nine institutes is that they are designed to let everybody get involved—from the
biggest corporations to the smallest companies. You can become a member of some institutes for as
little as $500/year, giving you access to technology roadmaps, input into long-term direction of
technologies, and in some cases, the ability to be involved in pilot projects.
As of this writing, 14 Iowa manufacturers have joined at least one institute. The smallest Iowa-based
member has just a handful of employees; the largest has thousands.
CIRAS has a simple request: look at the NNMIs, decide if one of them is most relevant to your business,
and engage with them now.
Why This Matters
Change is coming, and Iowans need to embrace it if they don’t want to be left behind.
Perhaps the most important NNMI for Iowa manufacturers is the Digital Manufacturing and Design
Innovation Institute (DMDII) in Chicago. It also is the most difficult to explain. While other NNMIs focus
on particular technology areas, such as composites or flexible
hybrid electronics, the DMDII focuses on a cross-cutting suite of
technologies that enable the “digital thread.” There are three
“thrust areas” in the DMDII: (1) Advanced Analysis;
(2) Intelligent Machines; and (3) Advanced Manufacturing
Enterprise.
The main theme connecting it all is a desire to make
information flow more easily inside and between industrial
businesses—much as Facebook, Amazon, and Uber have helped
consumers discover new ways to find and share what they
want.
In the DMDII’s case, 172 companies—including GE, Microsoft, and Siemens—have partnered with 39
universities and the Department of Defense to rapidly move these connecting technologies from
research to industry. Early results indicate the pace of change is about to accelerate.
Digital manufacturing (n.)—The
ability to connect different parts
of the manufacturing life cycle
through data, and to utilize that
information to make smarter,
more efficient business
decisions.
Source: DMDII
19
For companies, however, change will not come as easily as deciding to shop at Amazon instead of
driving to a store. Would-be digital manufacturers will have to master the basics before they will be able
to leap into “Industry 4.0.” Want to optimize your supply chain? You’ll need a real-time accurate
enterprise resource planning (ERP) system. Want to apply intelligent machining tools to optimize
design? Your entire business (and your suppliers) better have 3D CAD models that reflect what is being
built today.
Of course, there will be interim steps along the way in which companies with “digital maturity” will be
able to see real value from technologies as they absorb them. For example, CIRAS’ research shows that
3D CAD and advanced engineering tool maturity correlates with reduced worries about labor costs, and
our experience shows that manufacturers receive return on investment when implementing most other
digital tools. The DMDII is developing an assessment to help manufacturers understand how ready they
are and what comes next.
If you need another reason to embrace digitally integrated manufacturing, consider this: your customers
will soon require it. Iowa’s manufacturing landscape is dominated by key suppliers in machinery,
transportation, and aerospace. Given the potential benefits, those industries are at the front of the
digital manufacturing push, and getting results requires a supply chain that can play at the same digital
level as the original equipment manufacturers (OEMs). At this point, it’s not clear what anything will
look like. But it is likely that the digital maturity assessment from the DMDII will be a key facet in what
those OEMs expect.
The shift to digital manufacturing also will create many localized opportunities. Digital tools will allow
your company to better link design, manufacturing, and supply-chain operations, potentially creating
significant new efficiencies. Companies on the front of this wave stand to gain significant market share.
Those who aren’t may get left behind.
Iowa is well positioned to be a leader in adopting digital manufacturing and capitalizing on this
opportunity. CIRAS’ 2015–2016 manufacturing needs assessment shows that 3D CAD and advanced
engineering tools are among the most-implemented initiatives in the state. Iowa has the capacity to
handle these tools. Our survey shows, however, that only 27% of companies have fully implemented
them across the organization. Room exists for growth. Any needed help, in terms of digital
manufacturing expertise, is already here—as evidenced by the fact that Iowa State University was the
lead organization on three of the seven winning teams nationally in the most recent round of projects
funded by the DMDII.
Today, CIRAS is issuing a challenge: Let’s make Iowa the most digitally capable state in the country. Let’s
create opportunities for companies, improve the quality of life through higher-paying jobs, and start to
define the future of manufacturing for ourselves. Please call us if you’d like to help chart the path.

20
Health, Wellness, and the Bottom Line Iowa manufacturers have successfully navigated a complex set of changes over the past two decades.
Many have thrived through globalization, generation change, technological shifts, and other changes.
Today, manufacturing leaders continue to face increased competition, an aging workforce that they’re
increasingly less certain they’ll be able to replace, and countless other issues.
So, given all this, what’s an Iowa manufacturer’s largest single fear?
Health insurance.
And Iowa experts say the worry is well placed.
“If you are a private employer in Iowa, you have reason to be concerned,” said Mark Becker, an
employer benefits consultant based in Urbandale. “Because there are far more questions than answers
right now.
“The bigger you are, the more it follows you,” Becker said. “On large insurance, there’s really no place to
run.”
Becker and other Iowa experts paint a scary picture of the next few years for employers attempting to
manage health insurance for their employees. Under current rules, the last remaining sections of the
U.S. Patient Protection and Affordable Care Act—the law that brought us the term “Obamacare”—will
take effect in 2017 and require every business with 50 or more employees to provide health insurance
to its workers.
This survey identified the cost of employee health care as the single largest, most threatening issue
facing their businesses—by far outstripping concerns related to technology, competition, or the future
availability of a skilled workforce.
“I think the biggest thing is that they’re not getting good information” about looming federal
requirements, said Ruth Litchfield, an associate professor in Iowa State University’s Department of Food
Science and Human Nutrition. “There are a lot of things in there that I think business owners have heard
about, but they don’t know the details. I think the unknown of it all has them in a panic.”
David P. Lind, a former consultant who puts out an annual survey of Iowa employee benefit trends, said
Iowa health care costs for employers have been growing at 7 or 8% in recent years—roughly half the
size of increases that were common at the beginning of this century, but still more than twice the rate of
inflation. Lind said it looks as if 2017 might be a return to the larger increases—largely because, while
America has tackled a myriad of insurance issues, our society really hasn’t found a way to lower the
underlying price of health care.
“Until we can figure out where the waste is and cut that out and change lifestyles so people eat and live
healthier,…until that happens, I think we’re going to see what we’ve been seeing,” Lind said. “There
really isn’t a simple answer to this, because there’s a big conglomeration of what goes into the costs.”
New standards imposed by the Affordable Care Act require insurance companies to set rates based on
health care costs tied to a particular community. The change makes it harder for smaller employers to
control costs, because even major changes in the health of their workers might not cause an impact on
the costs that trigger insurance rates.

21
“Wellness programs work in that they make you healthier, but they’re not necessarily making you less
expensive,” said Becker. “Employers are really stuck, because there’s only so much you can do.”
Mike Teachout, co-owner of Focus OneSource—a West Des Moines-based business that handles payroll,
insurance, and other benefits for companies—said employers really have five choices in the current
environment.
Renew their current insurance (as modified to fit the new federal law).
Shop for other carriers (although this probably won’t matter, since companies increasingly
are quoting similar numbers to provide policies that legally must be roughly the same).
Self-fund (a complicated step that requires more risk for the employer).
Drop below 50 employees to eliminate the requirement for insurance.
Sign on with a professional employer organization such as Teachout’s company, which
groups multiple businesses under one insurance policy in an attempt to jointly control costs.
“There are some options,” Teachout said, “but it’s going to take a new way of thinking by some of these
employee groups.”
Litchfield, the Iowa State professor, urges businesses to remain involved and try to obtain as much
information as possible. Health care is an evolving issue that won’t lessen in importance any time soon.
“Until we get a handle on self-management of chronic diseases, costs will continue to go up,” Litchfield
said. “As a society, we’ve got to create the culture and the environment that make those healthy
lifestyle behaviors an easy choice.”
Lind likewise believes that “over time, things will continue to evolve.”
“But in health care, it’s evolving very slowly,” he said, urging patience. “It’s not a PT boat. It’s an aircraft
carrier, and you can’t turn it around on a dime.”

22
What Do Companies Really Need?
Technology Need 1: Exposure to applications of next-generation technologies that can create sustained
competitive advantage.
In focus group conversations, a common theme emerged: companies do not have sufficient awareness
of how new technologies can be applied to their business to solve problems and create opportunities.
Regardless of performance, size, and strategy, companies struggle to see how emerging technologies
can fit their needs. Additional focus on both exposure to new technology and sharing of industrial
applications of that technology are needed to help Iowa manufacturers continue to remain competitive
in the future.
Need 2: Deep technical support in advanced manufacturing engineering and automation.
The availability and cost of workforce continues to be a key barrier to growth among Iowa
manufacturers. In addition to the numerous workforce initiatives under way, manufacturers in Iowa
need assistance in redesigning and reimagining how their products are manufactured in order to grow in
a labor-constrained market. Manufacturing engineers who understand the full spectrum of
manufacturing technologies, from basic CNC through complex design for manufacturing activities, could
provide Iowa manufacturers with short-term, focused assistance to make leaps in design that would
allow products to be produced in a more efficient manner.
Need 3: Take a significant leap forward in digital manufacturing capabilities.
The term “digital manufacturing” is a broad term meant to encompass technologies including CAD,
computer-aided manufacturing, ERP, and other tools. There are several key strategic factors that make
now a critical time for Iowa manufacturers with respect to digital manufacturing: (1) stand-alone
technologies have matured to the point that cost and expertise barriers are low enough that all
manufacturers can achieve basic digital competency; (2) the ability to integrate individual technologies
in custom applications allows manufacturers to gain a competitive edge through “trade secrets” rather
than off-the-shelf software systems; (3) major OEMs will likely begin to require certain digital
capabilities in the next five years; and (4) the pace of change of digital manufacturing technology is
accelerating, and those companies that aren’t participating in the digital world may be permanently left
behind. This, combined with our findings that CAD and other advanced engineering technologies have
high value but still relatively low implementation rates, supports a larger focus.
The DMDII, a part of the NNMI, provides a much-needed focus on maturing digital tools, their
integration, and digital practices. Several Iowa-based organizations are members of this institute,
including Iowa State University, the Quad Cities Manufacturing Innovation Hub, Eastern Iowa
Community College, Virtual Systems Engineering, Design Mill Inc., ProPlanner, Sivyer Steel, MechDyne,
Pella Corporation, Genesis Systems Group, and Deere. CIRAS proposes the state begin a coordinated
effort to make Iowa the most digitally ready manufacturing state by 2022.

23
Productivity Need 1: Improve implementation rates of proven initiatives to ease workforce constraints.
This survey identified an unexpected gap in workforce-related initiatives: an implementation rate of
productivity and quality systems significantly below expectations. Lean manufacturing training has been
a focused effort throughout Iowa for more than a decade, yet the rate that focused training and projects
have transitioned to systematic adoption is lower than expected. Coupled with significant concerns of
labor availability and cost, improved implementation of Lean manufacturing approaches and other
productivity systems may create significant opportunities for Iowa manufacturers.
Iowa companies that have deployed sustaining Lean systems (such as members of the Iowa Lean
Consortium5), along with leading Lean manufacturing experts (including the University of Kentucky6),
have made a significant shift in focus over the last five years—from tool based to culture based. Leading
experts in Lean systems have begun to understand that “true” Lean is about creating a culture of
engaged employees that are able to identify and solve problems within their area of influence.
Iowa has an opportunity to maintain a leadership position in Lean and other productivity initiatives,
applying the lessons learned by leading Lean enterprises to the Lean deployment process for companies
that do not have existing productivity systems. The Iowa Lean Consortium, CIRAS, and the community
college network are well positioned to work together and develop a world-class approach.
Need 2: Provide hands-on implementation assistance for small manufacturers.
In parallel with revisiting general approaches to implementing Lean and other productivity programs
among manufacturers, special attention needs to be paid to small manufacturers. Data in this study
show that small manufacturers are less likely to have implemented productivity initiatives. When
combined with the knowledge that a more rigorous approach is likely needed, long-term hands-on
assistance from outside resources is likely necessary to ensure that productivity initiatives are
implemented correctly and sustainably. Programs such as the Critical Talent Network, a program of the
Quad Cities Chamber, may be a potential mechanism to provide such support.
5 www.iowalean.org 6 www.lean.uky.edu
24
Enterprise Leadership Need 1: Improved strategy and planning capabilities.
A key item noted throughout the survey was the disconnect between stated strategy, perceived growth
impediments, and action. No strategy is sustainable unless a business’s investments and actions fully
align with that strategy. This will typically lead to decreasing profits over time, which is evident in the
large number of companies reporting an ROS of less than 10%. Improved strategy development within
manufacturers to identify true, long-term competitive advantages and assistance planning changes to
align with that strategy are essential to the future of manufacturing in Iowa.
Need 2: Support for small manufacturers in understanding and complying with local, state, and
federal regulations.
A variety of regulatory issues surfaced as growth inhibitors for small manufacturers, although they were
comparatively of low concern to larger companies. This is simply a matter of scale with respect to
financial, environmental, safety, and other regulations at all levels of the government. In the absence of
significant changes and simplification of thousands of regulations, a resource to break down regulatory
barriers for small manufacturers may free up resources to allow small manufacturing owners to focus on
the key strategic issues needed to grow their businesses.
Need 3: Assistance in creating and sustaining a competitive advantage through health care costs.
Health care is a national issue. Health care costs have grown faster than inflation for 28 of the past 30
years.7 A combination of health care costs reaching a critical level with uncertainty and change
associated with the Affordable Care Act have created an environment in which Iowa manufacturers
consider this the top issue impacting their ability to grow. There is good news, however—Iowa
manufacturers are on the same playing field as all other manufacturers across the country. As a result,
coordinated efforts within the state to help break down barriers, better understand health care costs,
and help businesses control them can create a competitive advantage for Iowa manufacturers.
7 Source: Bureau of Labor Statistics, Consumer Price Index, 1985–2015. 2008 and 2011 were the exceptions.

25
Growth Need 1: Exposure and coaching to pursue opportunities in new markets.
The primary growth strategy of respondents to this survey is to sell more of the same product to the
same customers. Whereas this allows companies to grow with minimal risk and investment and is an
effective component to growth, it typically results in reduced profitability as the product line matures.
There are clear opportunities to help Iowa manufacturers better identify potential growth markets, both
domestic and international. This effort requires much more than simple market research. Companies
need assistance with creating personal connections in supply-chain networks, understanding how their
product performs with respect to market standards, and understanding regulatory issues in reaching
new markets.
Need 2: Support product development efforts.
Even among respondents who state that innovation is their primary strategy, a significant portion of
Iowa manufacturers that release new products and services are not first to market. The first to market
typically is able to capture and hold market share and price premiums better than followers. In addition,
organizations that stated innovation was their primary strategy did not show a statistically significant
difference in profitability, which indicates that many of those companies are not successfully delivering
innovative products and services that create new value. Based on this, there is opportunity for improved
customer understanding and for faster product development cycles. There are numerous proven
approaches for both of these opportunities.
Need 3: Link growth efforts with complementary next-generation technology and productivity.
Iowa’s unemployment rate stands at 3.8% as of April 2016 and has the fifth-highest labor force
participation rate in the nation. One of the key drivers of the workforce issue is that there simply aren’t
more people to take new jobs as they arise, regardless of industry or skill level. In order to effectively
grow, Iowa manufacturers will need to couple market growth efforts with internal efforts to implement
the right productivity and technology solutions to enable them to increase sales while maintaining
employment near current levels. In many cases, current practices to automate and increase productivity
won’t generate the output growth needed, so manufacturers will soon need to aggressively look for new
approaches to grow output.

26
Appendix: Profile of Iowa Manufacturing
Survey Respondents This survey was conducted during July through September 2015. Initial survey outreach was to Iowa
manufacturing leaders through email. In order to reach more small manufacturers, an additional mailing
was sent to a sampling of manufacturers with less than 20 employees.
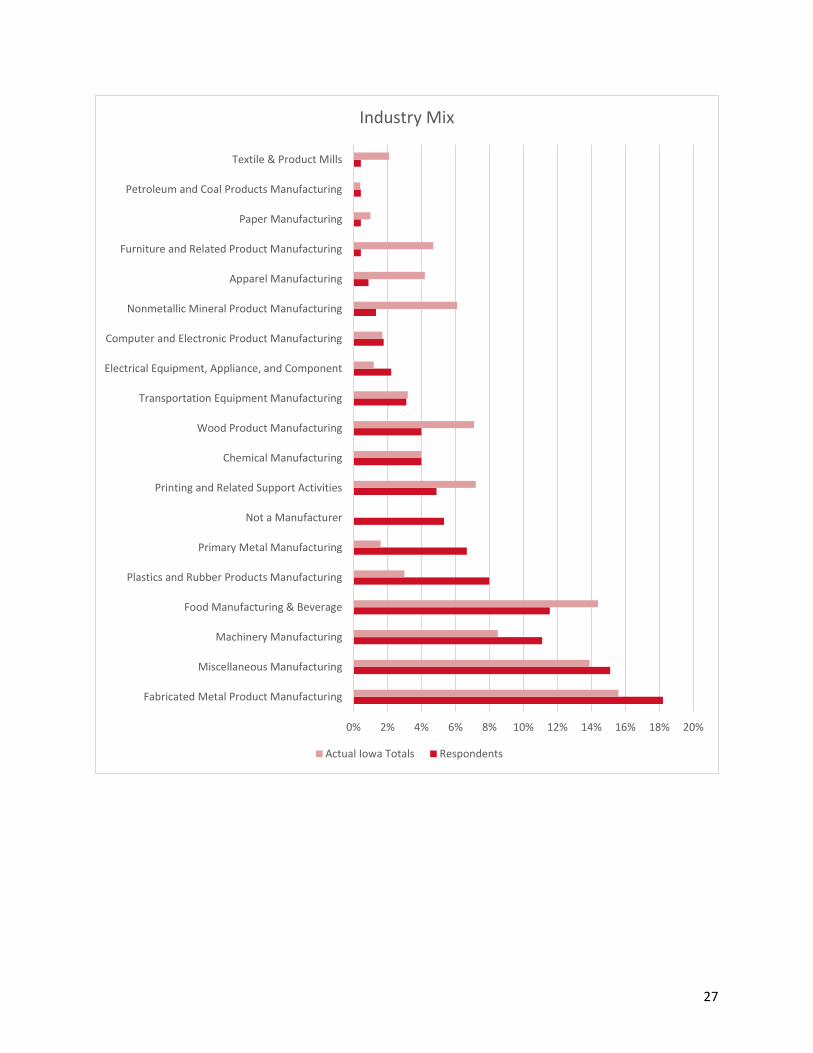
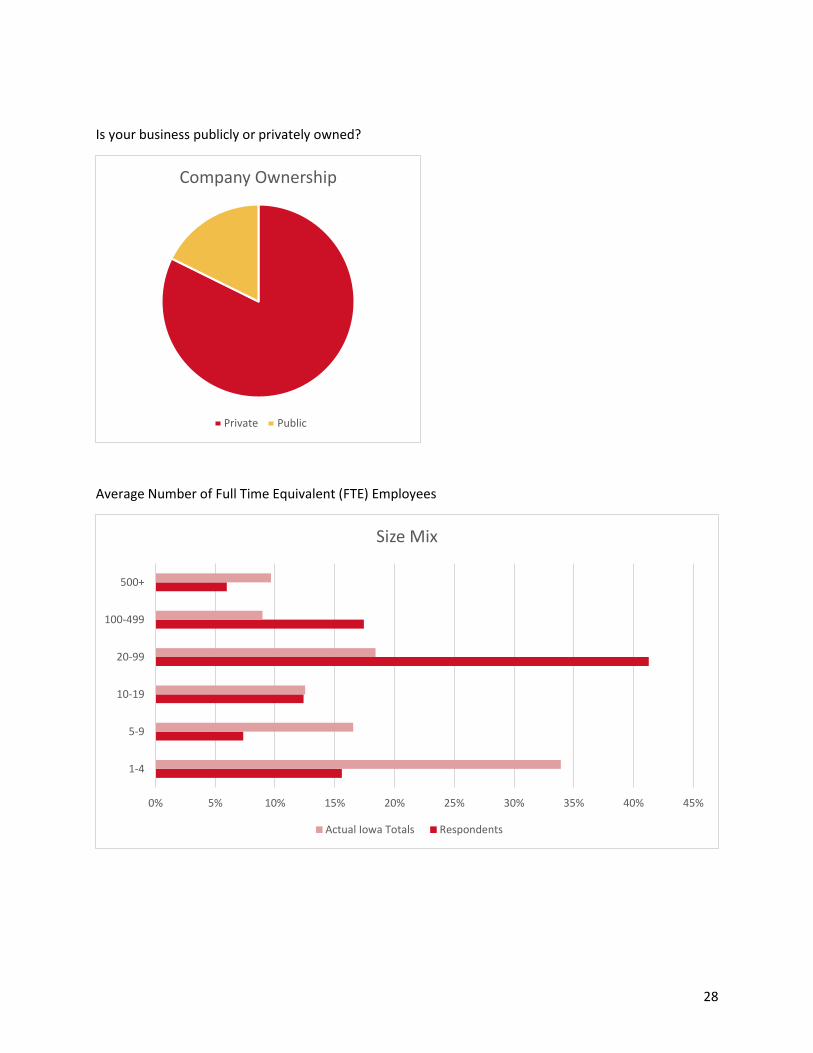
The final response rate was 11.6%, totaling 256 manufacturing leaders representing a broad array of
company types, sizes, industries, and geographical locations. The charts that follow summarize the raw
data received during the survey process. When there were sufficient respondents in a given industry,
strategy, or other relevant grouping, those groupings are also provided.
Company Size and Industry Which category best represents your primary industry?
27
0% 2% 4% 6% 8% 10% 12% 14% 16% 18% 20%
Fabricated Metal Product Manufacturing
Miscellaneous Manufacturing
Machinery Manufacturing
Food Manufacturing & Beverage
Plastics and Rubber Products Manufacturing
Primary Metal Manufacturing
Not a Manufacturer
Printing and Related Support Activities
Chemical Manufacturing
Wood Product Manufacturing
Transportation Equipment Manufacturing
Electrical Equipment, Appliance, and Component
Computer and Electronic Product Manufacturing
Nonmetallic Mineral Product Manufacturing
Apparel Manufacturing
Furniture and Related Product Manufacturing
Paper Manufacturing
Petroleum and Coal Products Manufacturing
Textile & Product Mills
Industry Mix
Actual Iowa Totals Respondents
28
Is your business publicly or privately owned?
Average Number of Full Time Equivalent (FTE) Employees
Company Ownership
Private Public
0% 5% 10% 15% 20% 25% 30% 35% 40% 45%
1-4
5-9
10-19
20-99
100-499
500+
Size Mix
Actual Iowa Totals Respondents

29
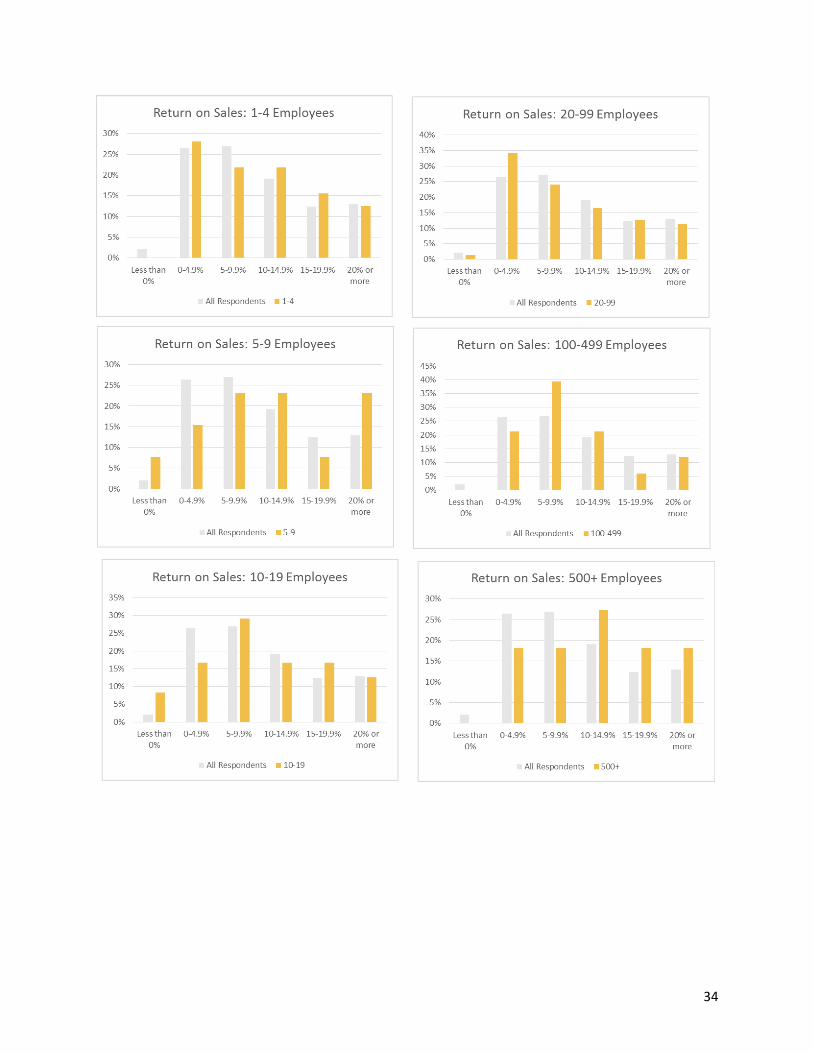
Total Annual Sales (Most recent fiscal year)
Return on Sales (Most recent fiscal year)
0% 5% 10% 15% 20% 25% 30% 35%
Less than $500K
Between $500K and $1.4M
Between $1.5M and $2.9M
Between $3M and 14.9M
Between $15M and 74.9M
Over $75M
Annual Sales
0%
5%
10%
15%
20%
25%
30%
Less than 0% 0-4.9% 5-9.9% 10-14.9% 15-19.9% 20% or more
Return on Sales: All Respondents

30
0%
5%
10%
15%
20%
25%
30%
35%
40%
45%
Less than0%
0-4.9% 5-9.9% 10-14.9% 15-19.9% 20% ormore
Return on Sales: Fabricated Metal Products
All Respondents Fabricated Metal Product Manufacturing
0%
5%
10%
15%
20%
25%
30%
35%
40%
45%
50%
Less than0%
0-4.9% 5-9.9% 10-14.9% 15-19.9% 20% ormore
Return on Sales: Food Manufacturing
All Respondents Food Manufacturing

31
0%
5%
10%
15%
20%
25%
30%
35%
40%
Less than0%
0-4.9% 5-9.9% 10-14.9% 15-19.9% 20% ormore
Return on Sales: Machinery Manufacturing
All Respondents Machinery Manufacturing
0%
5%
10%
15%
20%
25%
30%
35%
Less than0%
0-4.9% 5-9.9% 10-14.9% 15-19.9% 20% ormore
Return on Sales: Miscellaneous Manufacturing
All Respondents Miscellaneous Manufacturing

32
0%
5%
10%
15%
20%
25%
30%
35%
Less than0%
0-4.9% 5-9.9% 10-14.9% 15-19.9% 20% ormore
Return on Sales: Plastics & Rubber Products Manufacturing
All Respondents Plastics and Rubber Products Manufacturing
0%
5%
10%
15%
20%
25%
30%
35%
Less than0%
0-4.9% 5-9.9% 10-14.9% 15-19.9% 20% ormore
Return on Sales: Better Quality Products
All Respondents Better Quality Products

33
0%
5%
10%
15%
20%
25%
30%
35%
40%
Less than0%
0-4.9% 5-9.9% 10-14.9% 15-19.9% 20% ormore
Return on Sales: Innovation
All Respondents Innovation
0%
5%
10%
15%
20%
25%
30%
35%
Less than0%
0-4.9% 5-9.9% 10-14.9% 15-19.9% 20% ormore
Return on Sales: Superior Customer Service
All Respondents Superior Customer Service
34
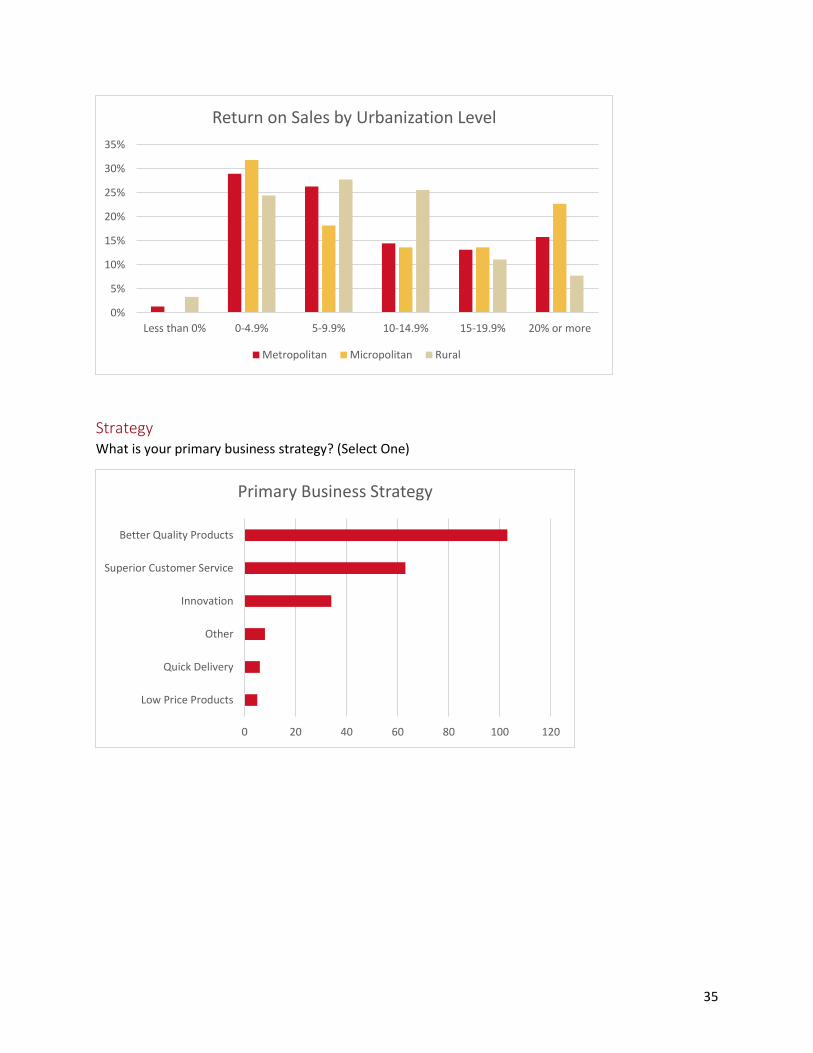
35
Strategy What is your primary business strategy? (Select One)
0%
5%
10%
15%
20%
25%
30%
35%
Less than 0% 0-4.9% 5-9.9% 10-14.9% 15-19.9% 20% or more
Return on Sales by Urbanization Level
Metropolitan Micropolitan Rural
0 20 40 60 80 100 120
Low Price Products
Quick Delivery
Other
Innovation
Superior Customer Service
Better Quality Products
Primary Business Strategy
36
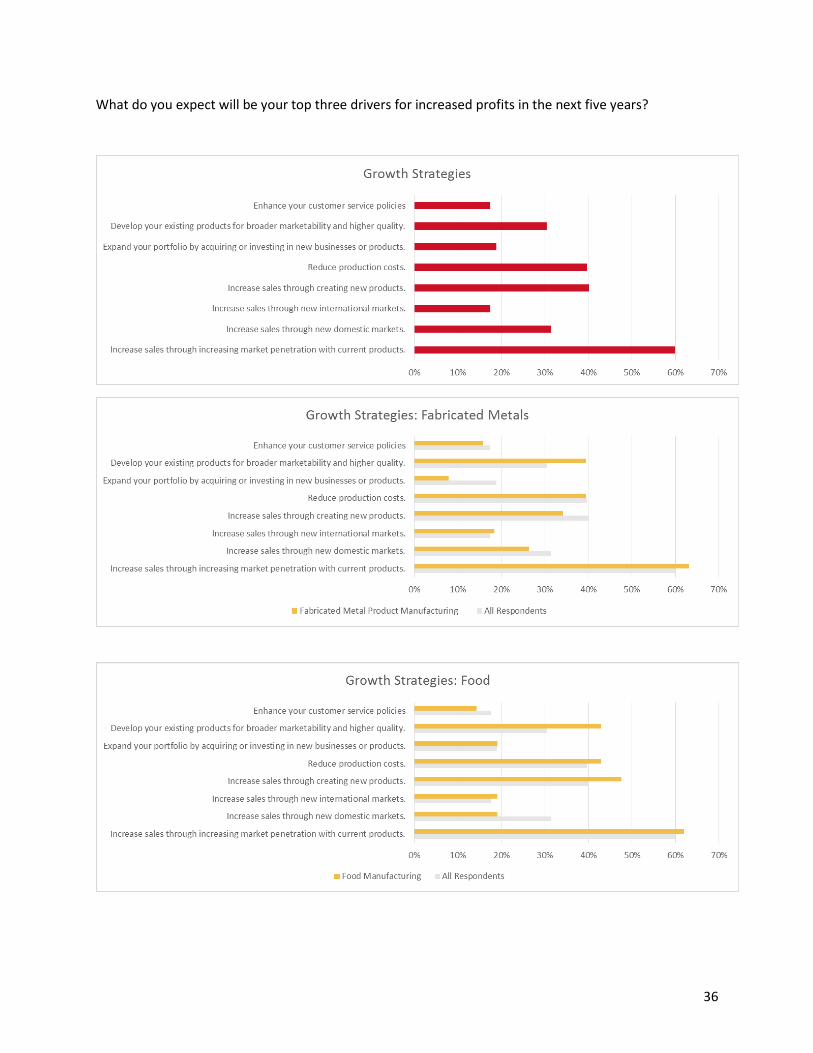
What do you expect will be your top three drivers for increased profits in the next five years?

37

38

39

40
Product Development Has your company introduced new products or services in the last year?
If your company introduced new products or services in the last year, were these
products/services new to the market and not produced similarly by competitors or new to your
business?
New Products & Services in the Past Year
None
New to your business
Other
New to the market and notproduced by competitors
New Products & Services in the Past Year: Fabricated Metal
New Products & Services in the Past Year: Food

41
New Products & Services in the Past Year: Miscellaneous
Manufacturing
New Products & Services in the Past Year: Machinery
New Products & Services in the Past Year: Plastics & Rubber
Manufacturing
New Products & Services in the Past Year: Better Quality
Products

42
New Products & Services in the Past Year: Innovation
New Products & Services in the Past Year: Superior Customer
Service

43
New Products & Services in the Past Year: 1-4 Employees
New Products & Services in the Past Year: 5-9 Employees
New Products & Services in the Past Year: 10-19 Employees
New Products & Services in the Past Year: 20-99 Employees

44
New Products & Services in the Past Year: 100-499 Employees
New Products & Services in the Past Year: 500+ Employees
New Products & Services in the Past Year:
ROS = 0 - 4.9%
New Products & Services in the Past Year:
ROS = 5 - 9.9%

45
New Products & Services in the Past Year:
ROS = 10 - 14%
New Products & Services in the Past Year:
ROS = 15 - 19.9%
New Products & Services in the Past Year:
ROS = 20% or more

46
KEY ISSUES AND ACTIONS I believe that _________ will limit growth in the next five years.
Scale:
Strongly Disagree (1)
Disagree (2)
Neither Agree nor Disagree (3)
Agree (4)
Strongly Agree (5)

47
0 0.5 1 1.5 2 2.5 3 3.5 4 4.5 5
Rising healthcare costs
U.S. government regulations
Rising labor costs
Inadequate availability of hourly workforce
Domestic competitive pressures
Raw material costs
Energy costs
Inadequate availability of salaried technical workforce
State government regulations
Technological changes
Product commoditization
Market demographics changes
Foreign competitive pressures
Consumer-driven sustainability demands
Global trade pattern changes
Off-shoring
Inadequate availability of salaried nontechnicalworkforce
Ownership or leadership transition
Customer-driven certifications (ISO 14001, SQF+ etc.)
Foreign government regulations
Re-shoring
Inadequate access to capital/financing
Inadequate transportation infrastructure
Availability of local specialty service firms(accounting, IT, engineering etc.)
Growth Limiters by Industry
Miscellaneous Manufacturing Machinery Manufacturing
Food Manufacturing Fabricated Metal Product Manufacturing

48
0 0.5 1 1.5 2 2.5 3 3.5 4 4.5 5
Rising healthcare costs
U.S. government regulations
Rising labor costs
Inadequate availability of hourly workforce
Domestic competitive pressures
Raw material costs
Energy costs
Inadequate availability of salaried technical workforce
State government regulations
Technological changes
Product commoditization
Market demographics changes
Foreign competitive pressures
Consumer-driven sustainability demands
Global trade pattern changes
Off-shoring
Inadequate availability of salaried nontechnical workforce
Ownership or leadership transition
Customer-driven certifications (ISO 14001, SQF+ etc.)
Foreign government regulations
Re-shoring
Inadequate access to capital/financing
Inadequate transportation infrastructure
Growth Limiters by Company Size
500+ 100-499 20-99 10-19 5-9 1-4

49
I am confident that I have resources to respond to _________.
Scale:
Strongly Disagree (1)
Disagree (2)
Neither Agree nor Disagree (3)
Agree (4)
Strongly Agree (5)
Rising healthcare costs 2.4
Energy costs 2.8
Foreign government regulations 2.8
Rising labor costs 2.8
U.S. government regulations 2.8
Global trade pattern changes 2.9
Inadequate availability of hourly workforce 2.9
Inadequate availability of salaried technical workforce 2.9
Off-shoring 2.9
Foreign competitive pressures 3.0
Raw material costs 3.0
Re-shoring 3.0
State government regulations 3.0
Inadequate availability of salaried nontechnical workforce
3.1
Inadequate transportation infrastructure 3.1
Product commoditization 3.1
Customer-driven certifications (ISO 14001, SQF+ etc.) 3.2
Market demographics changes 3.2
Availability of local specialty service firms (accounting, IT, engineering etc.)
3.3
Consumer-driven sustainability demands 3.3
Domestic competitive pressures 3.3
Inadequate access to capital/financing 3.3
Technological changes 3.3
Ownership or leadership transition 3.4

50
To what extent have you implemented the following in your business?
Scale:
Have not considered (1)
Considered, not implemented (2)
Partial Implementation (3)
Full Implementation in Progress (4)
Implemented (5)
Industry
Fab
rica
ted
Met
al
Pro
du
ct
Man
ufa
ctu
rin
g
Foo
d M
anu
fact
uri
ng
Mac
hin
ery
Man
ufa
ctu
rin
g
Mis
cella
neo
us
Man
ufa
ctu
rin
g
Pla
stic
s an
d R
ub
ber
Pro
du
cts
Man
ufa
ctu
rin
g
Gra
nd
To
tal
Safety program (beyond regulatory requirements)
3.4 3.1 3.5 3.2 3.4 3.4
3D CAD modeling and advanced engineering tools
3.4 1.9 4.1 2.9 3.6 3.1
ESOP/Profit sharing 3.0 2.3 3.2 3.0 3.1 3.0
Social media marketing 2.5 3.2 2.8 3.2 3.2 2.9
Flexible scheduling for employees
2.6 2.6 3.0 3.0 3.2 2.9
Professional development and leadership development programs
2.6 2.7 2.9 2.9 2.9 2.8
Employee wellness program 2.4 2.8 3.0 2.7 2.9 2.7
Productivity improvement system
2.6 2.9 2.8 2.7 2.8 2.7
Data analytics in manufacturing or supply chain
2.7 2.3 3.0 2.7 2.9 2.6
Formal quality system 2.4 3.3 2.3 2.4 3.2 2.6
Industrial automation and robotics
2.8 2.3 2.9 2.3 2.9 2.6
Process improvement software, simulators
2.5 2.0 2.7 2.4 2.4 2.5
Formal innovation process 2.3 2.9 2.5 2.4 2.8 2.4
Sustainability/Corporate Social Responsibility program
2.0 2.8 2.4 2.2 2.7 2.4
Remote or offsite workforce 2.2 2.0 2.5 2.2 3.0 2.3
Knowledge management programs
1.9 2.3 2.3 2.5 2.8 2.3
High performance materials 2.0 1.6 2.4 2.2 2.8 2.1
Additive manufacturing (3D printing)
1.9 1.4 2.4 2.1 2.8 1.9
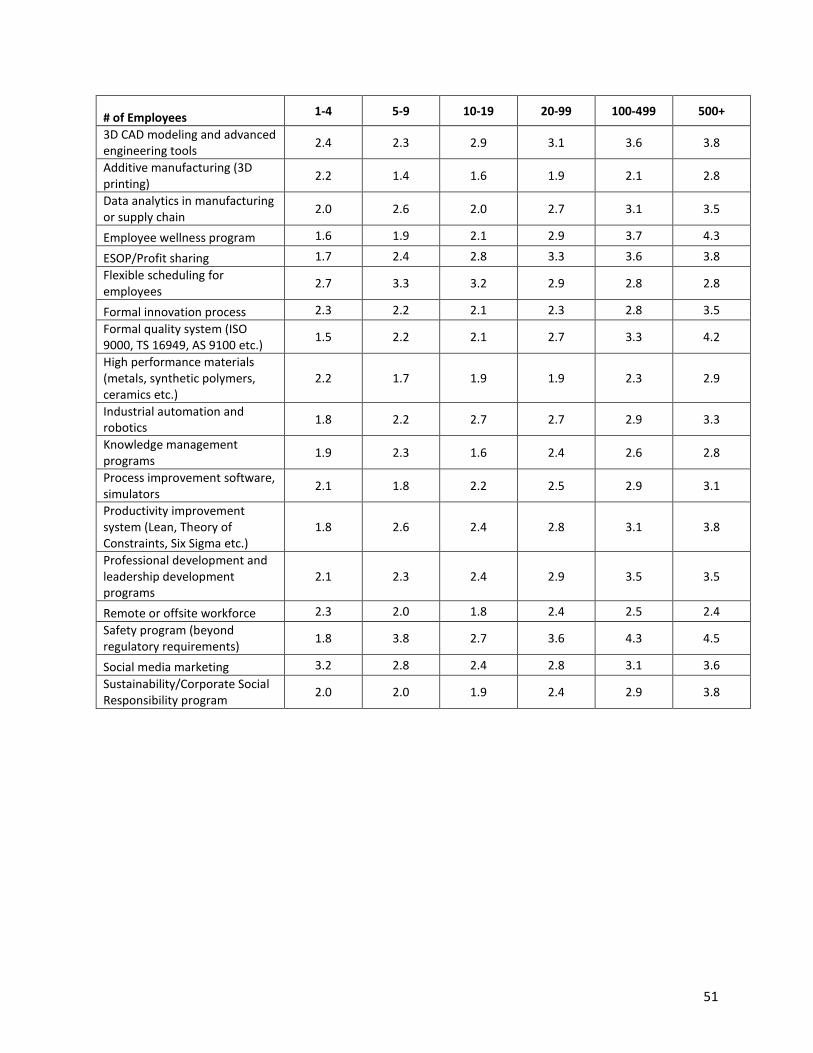
51
# of Employees 1-4 5-9 10-19 20-99 100-499 500+
3D CAD modeling and advanced engineering tools
2.4 2.3 2.9 3.1 3.6 3.8
Additive manufacturing (3D printing)
2.2 1.4 1.6 1.9 2.1 2.8
Data analytics in manufacturing or supply chain
2.0 2.6 2.0 2.7 3.1 3.5
Employee wellness program 1.6 1.9 2.1 2.9 3.7 4.3
ESOP/Profit sharing 1.7 2.4 2.8 3.3 3.6 3.8
Flexible scheduling for employees
2.7 3.3 3.2 2.9 2.8 2.8
Formal innovation process 2.3 2.2 2.1 2.3 2.8 3.5
Formal quality system (ISO 9000, TS 16949, AS 9100 etc.)
1.5 2.2 2.1 2.7 3.3 4.2
High performance materials (metals, synthetic polymers, ceramics etc.)
2.2 1.7 1.9 1.9 2.3 2.9
Industrial automation and robotics
1.8 2.2 2.7 2.7 2.9 3.3
Knowledge management programs
1.9 2.3 1.6 2.4 2.6 2.8
Process improvement software, simulators
2.1 1.8 2.2 2.5 2.9 3.1
Productivity improvement system (Lean, Theory of Constraints, Six Sigma etc.)
1.8 2.6 2.4 2.8 3.1 3.8
Professional development and leadership development programs
2.1 2.3 2.4 2.9 3.5 3.5
Remote or offsite workforce 2.3 2.0 1.8 2.4 2.5 2.4
Safety program (beyond regulatory requirements)
1.8 3.8 2.7 3.6 4.3 4.5
Social media marketing 3.2 2.8 2.4 2.8 3.1 3.6
Sustainability/Corporate Social Responsibility program
2.0 2.0 1.9 2.4 2.9 3.8

52
How much benefit have you seen from implementing the following in your business?
Scale:
Significantly below expectations (1)
Did not meet expectations (2)
Met expectations (3)
Exceeded expectations (4)
Significantly exceeded expectations (5)
Industry Fa
bri
cate
d M
etal
Pro
du
ct
Man
ufa
ctu
rin
g
Foo
d
Man
ufa
ctu
rin
g
Mac
hin
ery
Man
ufa
ctu
rin
g
Mis
cella
neo
us
Man
ufa
ctu
rin
g
Pla
stic
s an
d R
ub
ber
Pro
du
cts
Man
ufa
ctu
rin
g
Gra
nd
To
tal
3D CAD modeling and advanced engineering tools
3.6 3.2 3.5 3.4 3.2 3.4
Industrial automation and robotics
3.6 3.7 2.9 3.6 3.1 3.4
Safety program (beyond regulatory requirements)
2.9 3.8 3.5 3.3 3.3 3.2
Formal quality system 3.5 3.1 3.3 3.1 3.0 3.2
ESOP/Profit sharing 3.0 3.7 3.3 3.3 2.9 3.1
Additive manufacturing (3D printing)
3.0 2.5 2.8 3.5 2.9 3.1
Process improvement software, simulators
3.1 3.0 3.1 2.8 3.1 3.1
Productivity improvement system
3.4 3.2 2.6 2.9 3.5 3.1
Flexible scheduling for employees 2.5 3.2 2.7 3.3 3.4 3.1
Data analytics in manufacturing or supply chain
2.9 3.2 2.8 3.4 3.0 3.0
Sustainability/Corporate Social Responsibility program
2.9 3.1 3.1 2.6 3.6 3.0
Formal innovation process 2.8 2.8 3.1 2.6 3.4 2.9
Professional development and leadership development programs
2.6 3.0 2.4 3.2 3.3 2.9
High performance materials 2.7 3.0 2.6 2.8 3.5 2.9
Remote or offsite workforce 2.2 2.8 3.2 2.3 3.4 2.8
Knowledge management programs
2.4 2.8 2.6 2.7 3.4 2.8
Social media marketing 2.6 2.9 2.6 2.8 2.9 2.7
Employee wellness program 2.4 3.2 2.8 2.6 2.4 2.7

53
# of Employees 1-4 5-9 10-19 20-99 100-499 500+
Formal quality system (ISO 9000, TS
16949, AS 9100 etc.) 2.0 2.5 3.2 3.2 3.4 3.4
Productivity improvement system
(Lean, Theory of Constraints, Six
Sigma etc.)
2.5 2.3 2.8 3.0 3.2 3.9
Formal innovation process 3.2 2.2 2.3 2.9 2.9 3.2
Sustainability/Corporate Social
Responsibility program 3.0 2.3 2.8 2.9 3.1 3.5
Industrial automation and robotics 2.8 3.5 3.7 3.3 3.3 3.6
3D CAD modeling and advanced
engineering tools 3.2 3.0 3.8 3.3 3.5 3.6
ESOP/Profit sharing 2.2 3.8 2.6 3.3 3.3 3.0
Flexible scheduling for employees 3.2 3.6 3.2 3.0 2.8 3.5
Knowledge management programs 2.6 2.5 2.2 2.8 2.5 3.4
Social media marketing 2.3 2.9 2.5 2.8 2.8 2.9
Data analytics in manufacturing or
supply chain 3.0 3.5 2.3 3.0 2.9 3.2
Process improvement software,
simulators 3.1 2.8 2.9 3.1 3.2 2.9
Remote or offsite workforce 2.6 3.7 2.4 2.8 3.3 2.7
Additive manufacturing (3D
printing) 3.5 2.5 3.0 3.2 2.9 2.9
Professional development and
leadership development programs 2.7 3.0 2.6 3.0 2.7 3.3
High performance materials
(metals, synthetic polymers,
ceramics etc.)
3.2 3.5 2.8 2.9 2.8 2.9
Safety program (beyond regulatory
requirements) 2.8 3.6 2.8 3.2 3.5 3.5
Employee wellness program 1.8 3.0 2.8 2.5 2.7 3.5
54
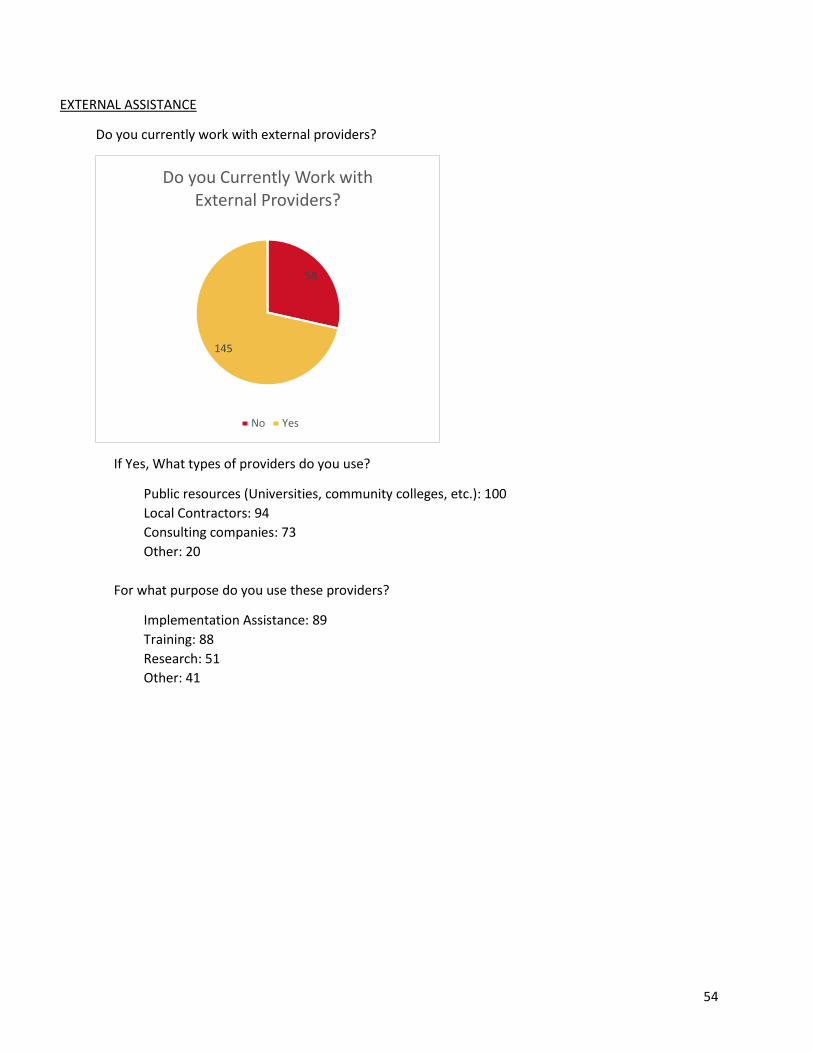
EXTERNAL ASSISTANCE
Do you currently work with external providers?
If Yes, What types of providers do you use?
Public resources (Universities, community colleges, etc.): 100
Local Contractors: 94
Consulting companies: 73
Other: 20
For what purpose do you use these providers?
Implementation Assistance: 89
Training: 88
Research: 51
Other: 41
58
145
Do you Currently Work with External Providers?
No Yes