iowa’s school tuition organization tax credit tax credits ... · iowa code section 2.48 directs...
TRANSCRIPT
By Anthony G. Girardi
and Angela Gullickson
Tax Research and Program Analysis Section Iowa Department of Revenue
Iowa’s School Tuition Organization Tax Credit Tax Credits Program Evaluation Study
December 2017
i
Preface
Iowa Code Section 2.48 directs the Legislative Tax Expenditure Committee to review all tax expenditures with assistance from the Department of Revenue. This law also provides a schedule for such reviews and requires a review in 2017 of the School Tuition Organization Tax Credit. In addition, the Department was directed to assist the Legislature by performing periodic economic studies of tax credit programs. This is the second evaluation study of the School Tuition Organization Tax Credit, with the prior evaluation study being completed in 2012. An advisory panel was convened to provide input and advice on the study’s scope and analysis. The members of this panel and their affiliated organizations are listed below.
Tom Cooley Iowa Department of Education Claudia Daggett Independent Schools Association of the Central States Brent Kreider Iowa State University Peter Orazem Iowa State University Nicole Proesch Iowa Department of Education Patti Schroeder Iowa Association of School Boards Shawn Snyder Iowa Association of School Boards Janna Voss North Central Iowa School Tuition Organization Jeanne Wells Catholic Tuition Organization of Des Moines Trish Wilger Iowa Alliance for Choice in Education
The authors wish to thank the members of the panel and other reviewers. The assistance of an advisory panel implies no responsibility on their part for the content and conclusions of the evaluation study. This study and other evaluations of Iowa tax credits can be found on the evaluation study web page on the Iowa Department of Revenue website.

2
Table of Contents Executive Summary ........................................................................................................ 5
I. Introduction .................................................................................................................. 8 II. Tax Credit Programs for Education Scholarships in the United States........................ 8
A. The Iowa School Tuition Organization Tax Credit ................................................... 8
B. Education Scholarship Tax Credit Programs in Other States ................................ 10 III. Literature Review ..................................................................................................... 12
A. Federal Tax Incentives .......................................................................................... 12 B. Fiscal Analysis of School Tuition Organizations .................................................... 13
C. Substitution Rate ................................................................................................... 14 IV. Analysis of Iowa School Tuition Organization Tax Credit Awards and Claims ......... 16
A. School Tuition Organization Tax Credit Awards .................................................... 16 B. School Tuition Organization Tax Credit Claims ..................................................... 17
V. Evaluation of the School Tuition Organization Tax Credit ......................................... 17
A. Who benefits from STO tuition grants? ................................................................. 18
1. Financial Aid Need .............................................................................................. 19 2. Amount of Tuition Grant ...................................................................................... 20 3. Percent of Need and Percent of Tuition Met by Tuition Grants ........................... 20
4. Percent of Need Met, By Income Level .............................................................. 21 5. Number and Amounts of Grants in Terms of Poverty Level Grouping ................ 22
6. Income Distribution of Tuition Grant Families and Other Iowa Families ............. 23 7. Tuition Grants and Financial Aid Need ............................................................... 24
B. What is the net fiscal impact of the STO tax credit? .............................................. 25 1. Cost of the tax credit ........................................................................................... 26 2. Estimated cost per student in public schools ...................................................... 27
3. Number of tuition grant recipients ....................................................................... 28 4. Substitution rate .................................................................................................. 28 5. Net Fiscal Impact ................................................................................................ 29 6. Breakeven Substitution Rate .............................................................................. 31 7. Meeting Financial Aid Need under the Tax Credit Program Cap ........................ 32
VI. Conclusion ............................................................................................................... 33
References .................................................................................................................... 35
Tables and Figures........................................................................................................ 37
Table 1A. Allocation of Tax Credits to School Tuition Organization by Year, 2006 - 2012 ........................................................................................................................... 39

3
Table 1B. Allocation of Tax Credits to School Tuition Organization by Year, 2013 – 2018 ........................................................................................................................... 40 Table 2. Scholarship Tax Credit Programs in Other States as of June 1, 2017 ......... 41 Table 3. School Tuition Organization Enrollment Statistics by Program Year ........... 51 Table 4. School Tuition Organization Enrollment and Tuition Grant Statistics by Program Year ............................................................................................................ 52 Table 5. School Tuition Organization Tax Credit Award Statistics by Program Year . 53 Table 6. School Tuition Organization Tax Credit Claims by Tax Year ....................... 54
Table 7. Timing of School Tuition Organization Tax Credit Claims by Award Year and Fiscal Year ................................................................................................................. 55
Table 8. Overview of Tuition Grant STO-Reported Student-Level Data File .............. 56 Table 9. Private School Tuition as Reported in Student-Level Data File by School Year ........................................................................................................................... 56
Table 10. Income, Financial Aid Need, and Tuition Grant Amounts for Tuition Grant Recipients .................................................................................................................. 57
Figure 1. Percent of Financial Aid Need Met by Tuition Grants, by Family Income, School Years 2012-13 through 2016-17 Combined ................................................... 58 Table 11. Distribution of Tuition Grants and Financial Aid Need by Family Income, School Years 2012-13 through 2016-17 Combined ................................................... 59 Table 12. 2017 Poverty Guidelines ............................................................................ 60 Figure 2. Share of Tuition Grants by Family Income Category for School Years 2012 through 2016 ............................................................................................................. 60 Figure 3. Share of Tuition Grant Dollars by Family Income Category for School Years 2012 through 2016..................................................................................................... 61
Figure 4. Average Tuition Grant by Family Income Category for School Years 2012 through 2016 ............................................................................................................. 62 Figure 5. Income Distribution of Iowa Families and Tuition Grant Recipients ............ 63 Table 13. Percentiles of Family Income, Need, and Tuition Grant Amounts in School Years 2012-13 through 2016-17 Combined ............................................................... 64

4
Table 14. Estimated Net Fiscal Impact of the STO Tax Credit .................................. 65 Table 15. Estimated Amount of Financial Aid Need Met Under Alternative Program Caps .......................................................................................................................... 66

5
Executive Summary A School Tuition Organization Tax Credit is available in Iowa, equal to 65 percent of the amount of a voluntary cash or noncash contribution made by a taxpayer to a School Tuition Organization (STO). The STO Tax Credit was enacted in 2006 in order to incentivize private contributions to fund tuition grants for low- and middle-income children in Iowa to attend accredited, nonpublic schools in the state. This is the second evaluation of the School Tuition Organization Tax Credit. The major findings of the study are these: Education Scholarship Tax Credit Programs Across the States
Eighteen states currently have some type of scholarship tax credit program. In the last five years six states have implemented tax credits similar to the Iowa credit.
Only Indiana and Oklahoma have lower tax credit rates than Iowa’s 65 percent. Indiana’s rate is 50 percent of qualifying contributions and Oklahoma’s rate is also 50 percent, but it can be increased to 75 percent if the taxpayer commits to the same donation amount for two consecutive years.
Eight states, Alabama, Arizona, Florida, Georgia, Louisiana, Montana, Nevada, and South Carolina offer tax credit rates of 100 percent of qualifying contributions. However, some of those states have other ways of limiting the fiscal impact of their tax credit.
With the exception of the tax credit in Louisiana, all of the other state scholarship tax credits are nonrefundable. Indiana, North Dakota, Pennsylvania, and Rhode Island offer no carry forward. Other states offer a carryforward period, with most allowing five years, although Oklahoma only allows three years.
Analysis of Iowa School Tuition Organization Tax Credit Awards and Claims
The total number of students enrolled in schools that participate in the STO program has held relatively steady around 34,000. In 2016, enrollment at STO schools was 33,465 and represented 98 percent of certified total enrollment at non-public schools in the state as reported by the Iowa Department of Education.

6
Since 2010, when the number of STOs reached 12, the number of schools covered has held steady around 139 schools across Iowa. During that same period, the number of tuition grants issued each year has averaged just over 10,500. With the cap increasing from $7.5 million in 2010 to $12 million in 2015 but the number of tuition grants largely unchanged, the average tuition grant increased from just over $1,000 to over $1,500.
Between 2006 and 2016, $89.5 million in awards have been issued to taxpayers making over $137 million in contributions to STOs. The annual award cap was met in every year except 2008.
Since the inception of the School Tuition Organization Tax Credit through tax year 2016, over $82 million of tax credits have been claimed by individual and corporation income taxpayers.
In 2014, tax credit claims exceeded $11.2 million. It is expected that claims will reach a similar level in tax years 2015 and 2016 once all tax credit claims have been reviewed.
For STO Tax Credits first awarded for tax years 2006 through 2011, the carry forward period is complete. Over the five-year carry forward period in which tax credit awards can be claimed, over 96 percent of awards issued in those years have been claimed.
Who Benefits from the School Tuition Organization Tuition Grants?
Ten of the 12 STOs provided student-level tuition grant information covering about 60 percent of students in each of the last five school years.
Average tuition among schools represented in the student-level data has increased steadily since 2012, from $2,710 to $3,658 in 2016.
The average family income of tuition grant recipients has been around $44,000, less than three times the poverty guideline for a family of two in 2017.
Procedures for calculating financial aid need, defined as the difference between the cost of tuition and a family’s calculated ability to pay, are determined by each STO. Average need was $1,791 in the 2012 school year and increased to $2,253 by 2016.
In 2016, the average tuition grant was $1,801 and the median tuition grant was $1,672. The median percentage of need met by a tuition grant was 78 percent. The median percentage of full tuition met by a tuition grant was 56.2 percent.
7
For the five-year period between 2012 and 2016, 23 percent of tuition grants have been issued to students whose family income was below the poverty guideline; 40 percent have been issued to those whose income was between one and two times the poverty guideline; and 37 percent have been made to those with incomes between two and three times the poverty guideline.
In 2016, the average tuition grant for the lowest family-income group was $2,288; for the middle family-income group, it was $1,941; and for the highest family income-group it was $1,178.
What is the Net Fiscal Impact of the School Tuition Organization Tax Credit?
The net fiscal impact of the STO tax credit compares the reduction in State spending on schools to the reduction in tax liability resulting from STO Tax Credit awards. It is calculated using the fiscal cost of the tax credit, the average cost to educate a student in a public school in the state, the number of tuition grant recipients, and the share of tuition grants given to students who would otherwise attend public schools.
Assuming that 30 percent of tuition grants in any year are issued to students who otherwise would attend public school (the substitution rate), then $24.6 million in the 2016-17 school year was saved by the State in lower public education expenditures. Given that the cost of the STO Tax Credit was $12.0 million, the net fiscal impact of the tuition grants in that year is an estimated $12.6 million.
The breakeven substitution rate is the value of the substitution rate when the net fiscal impact of the STO Tax Credit is estimated to equal zero. In the 2016-17 school year, the breakeven substitution rate is estimated to have been 14.6 percent, meaning that the net fiscal cost of the tax credit was positive as long as it resulted in at least 14.6 percent of tuition grant recipients attending a nonpublic school.
In 2016-17, an estimated 69 percent of tuition grant recipients’ total need was met under the program’s $12 million cap, which allowed for over $17 million in tuition grants. It is estimated that 80 percent of need could have been met if contributions totaled $19.8 million under a program cap of $13.9 million. If contributions equaled $24.8 million under a program cap of $17.4 million, it is estimated that 100 percent of the financial aid need of tuition grant recipients in that year could have been met.

8
I. Introduction This is the second evaluation of the School Tuition Organization (STO) Tax Credit. The STO Tax Credit was enacted in 2006 in order to incentivize private contributions to fund tuition grants for low- and middle-income children in Iowa to attend accredited, nonpublic schools in the state. Through 2015, $119.0 million has been contributed toward tuition grants, based on information received from the qualified School Tuition Organizations. The contributions received during that time resulted in over 100,000 tuition grants totaling over $114.3 million. Section II of the study describes the School Tuition Organization Tax Credit and discusses similar tax credits in other states. Section III provides a review of relevant research literature. Section IV presents characteristics of the individuals who are contributing to the STOs, and provides details about the utilization of the tax credits, including the timing of claims and the amount of credits that are being carried forward each year. Information is also provided about the tuition grants that are awarded by the STOs. Section V describes tuition grant recipients in terms of financial characteristics including family income and level of financial aid need based on an analysis of student-level data provided by STOs. Section V provides an analysis of the net fiscal impact of the STO Tax Credit, accounting for both its costs and positive fiscal impacts. The study is concluded in Section VI. II. Tax Credit Programs for Education Scholarships in the United States A. The Iowa School Tuition Organization Tax Credit The School Tuition Organization Tax Credit went into effect for the 2006 tax year. The STO Tax Credit is a nonrefundable tax credit awarded to a taxpayer who makes a voluntary cash contribution to a qualifying school tuition organization. Starting in the 2007 tax year, noncash contributions also qualified for the tax credit. The amount of the tax credit equals 65 percent of the contribution made by a taxpayer to the STO. The contribution cannot be used for the direct benefit of any dependent of the taxpayer or any other student designated by the taxpayer.
A qualifying school tuition organization must be a charitable organization in Iowa that is exempt from federal taxation under Section 501(c)(3) of the Internal Revenue Code. The STO is required to allocate at least 90 percent of annual contributions received, toward tuition grants. The STO must represent more than one school, and can only provide tuition grants to eligible students who are members of households whose annual income does not exceed three times the most recent Federal Poverty Guidelines published by the U.S. Department of Health and Human Services. In 2017, three times the Federal Poverty Guidelines was equal to $73,800 for a family of four.
The tuition grants help children, who must reside in Iowa, to attend a qualified Iowa school of their parents’ choice. In order to be a qualifying school, the school must be a nonpublic school accredited by the Iowa Department of Education. An accredited school

9
is one that meets or exceeds the minimum requirements for operation as either an elementary or secondary school as stated in the general statutes and regulations adopted by the State Board of Education.
The STO must initially register with the Iowa Department of Revenue (IDR) and must provide verification of 501(c)(3) status, a list of schools the organization serves, and the names and addresses of the board of directors of the organization. Once the organization has registered, it is not required to subsequently register unless the schools it serves changes.
When the tax credit was enacted in tax year 2006, the tax credit cap for all STO awards was set at $2.5 million per year. That amount was increased to $5 million for the 2007 tax year and increased again to $7.5 million for tax years 2008 through 2011. For tax years 2012 and 2013, the tax credit cap was $8.75 million per year. Since tax year 2014, the tax credit cap has been $12 million. The tax credits are issued on a first-come, first-served basis and once the cap has been reached, no additional tax credits can be issued and no waitlist is created.
The tax credit cap is allocated to the qualifying STOs in a given year based enrollment at each school served by a school tuition organization. The STOs submit an enrollment report to IDR each year by November 1st that provides the schools covered by the STO and the certified enrollment of each member schools as of October 1st. A school cannot be represented by more than one STO. Based on the certified enrollment figures received by IDR, the tax credit cap for the following year is allocated to each STO in proportion to the student enrollment (see Tables 1A and 1B). IDR notifies STOs of their allocation for the following year in December. The STOs receive donations and award tax credits throughout the next calendar year and provide detailed award information the following January to IDR. There has only been one year since the beginning of the program in which less than 97 percent of the credits available were awarded; in 2008, only 82.7 percent of the $7.5 million cap was awarded due to the award cap being raised half-way through the year and weakening economic conditions.
When the tax credit was enacted, the tax credits could only be awarded to individual income taxpayers. Effective for tax years starting on or after July 1, 2009, each STO can award up to 25 percent of allocated credits to corporations to be claimed against corporation income tax. There is no limit to what an individual taxpayer can contribute, but if an STO exceeds its allotted amount of tax credits, it is the organization’s responsibility to prorate the tax credits appropriately. Contributions in excess of the annual cap cannot be waitlisted and awarded in the next year. The nonrefundable tax credits reduce a taxpayer’s Iowa tax liability. If a taxpayer does not have any Iowa tax liability (or enough to fully utilize the credit) any remaining credit can be carried forward for up to five future tax years. Non-residents and part-year residents of Iowa can be awarded credits, but the tax credit claim must be prorated based on the ratio of Iowa-source income divided by total income; that is, if a

10
nonresident is awarded a $650 STO Tax Credit but Iowa-source income comprises ten percent of total income, the claim is limited to $65. B. Education Scholarship Tax Credit Programs in Other States In total, eighteen states currently have some type of scholarship tax credit program (see Table 2). Of these states, the program that has been in place the longest is the Individual Income School Tuition Organization Tax Credit in Arizona which was enacted in 1997. Since that time, Arizona added the Low-Income Corporate Income Tax Credit Scholarship Program in 2006 and the Switcher Individual Income School Tuition Organization Tax Credit in 2012. The corporate tax credit program in Arizona has an aggregate program cap of $20.736 million and the credit is equal to 100 percent of eligible contributions. There are no aggregate caps for the two individual income tax credit programs in Arizona, but the amount of tax credit is limited on a per taxpayer basis for both programs. The Individual Income STO Tax Credit is equal to 100 percent of eligible contributions up to $546 for single and head of household filers and $1,092 for joint filers in tax year 2017. The Switcher Individual Income STO Tax Credit is also equal to 100 percent of eligible contributions but the limits for tax year 2017 are $543 for single and head of household filers and $1,085 for joint filers. In order to receive a Switcher STO Tax Credit an individual must first make a maximum contribution to the regular Individual Income STO Tax Credit program. Since the last evaluation of the School Tuition Organization Tax Credit in 2012, six states have implemented tax credits similar to the Iowa credit including Alabama, Kansas, Montana, Nevada, South Carolina, and South Dakota. The largest of these new programs is the Invest in Kids Program enacted by Illinois in 2017. The nonrefundable income tax credit has an annual cap of $75 million and equals 75 percent of qualified contributions. The tax credits cannot exceed $1 million per taxpayer per year. The list of new states also includes a second Iowa neighbor. South Dakota enacted the Partners in Education Tax Credit Program in 2016. The South Dakota tax credit is equal to 80 percent of eligible contributions, but is capped each year at $2 million. Because South Dakota does not have an income tax, the nonrefundable tax credits can only be claimed by insurance companies against their premium tax. The largest tax credit program currently available is Florida’s Tax Credit Scholarship Program. The program cap of $559.1 million in state fiscal year 2017 will increase to $698.9 million in state fiscal year 2018. The credit is equal to 100 percent of the eligible contribution. Unlike most other states where credits can only be taken against corporate and/or individual income taxes, and occasionally franchise tax, Florida allows credits to be claimed against the corporate income tax, insurance premium tax, oil and gas production tax and the liquor, wine, and malt beverage excise tax. Florida does not have an individual income tax. Pennsylvania has two different programs; one focuses on offering scholarships to low-income students and the other focuses on offering scholarships to children who reside

11
in school districts that have been designated as low-achieving. Combined, the programs have a cap of $175 million. The amount of the credit is equal to 75 percent of eligible contributions unless the taxpayer commits to make the same donation in the following year, then the amount of the credit increases to 90 percent of the eligible contribution. There are some individual credit caps that may apply to the different credits. Only Indiana and Oklahoma have lower credit rates than Iowa’s 65 percent. Indiana’s rate is 50 percent of qualifying contributions. Oklahoma’s rate is also 50 percent, but it can be increased to 75 percent if the taxpayer commits to the same donation amount for two consecutive years. Eight states, Alabama, Arizona, Florida, Georgia, Louisiana, Montana, Nevada, and South Carolina offer credit rates of 100 percent of qualifying contributions. However, some of those states have other ways of limiting the fiscal impact of their tax credit. For example, in Arizona the maximum qualifying donation is $1,000 per tax credit program. In Alabama the credit cannot reduce the taxpayer’s tax liability by more than 50 percent and individuals are limited to $50,000 in tax credits per year. In South Carolina, the taxpayer can only claim the tax credit up to 60 percent of their tax liability. With the exception of the tax credit program in Louisiana, all of the other state scholarship tax credits currently offered are nonrefundable. This means that the taxpayer must have tax liability in order to utilize the tax credit. Most of the states that have nonrefundable credits offer carry forward that allows taxpayers to claim the balance of the tax credit in subsequent tax years. Only Indiana, North Dakota, Pennsylvania, and Rhode Island offer no carry forward. Most states that offer carry forward allow five years for the credits to be carried forward, although Oklahoma only allows three years. Most states require that the scholarships generated by the contributions collected go to low-income families, although the threshold differs among states. The percentage is usually based on either the Federal Poverty Guidelines or the National School Lunch Program’s free and reduced-price lunch income thresholds which are 130 percent and 185 percent of the Federal Poverty Guidelines, respectively. In general, the low-income threshold varies between 200 and 300 percent of either the Federal Poverty Guidelines or the free and reduced-price lunch income guidelines. Arizona’s individual income tax credit programs are the only tax credit scholarship programs that place no restrictions on the recipients of scholarships. Georgia and Montana’s programs have no income limits on student recipients but do require the recipients to be state residents. In most cases, states do not allow an eligible donation to also be taken as a charitable deduction. However, in Georgia, taxpayers can deduct any portion of their donation for which they did not receive a tax credit. Another common practice across states is that the taxpayer making the donation cannot designate which student receives a scholarship financed by their donation. There is an exception to this in Louisiana if the designated student is disabled. Most states also require that a minimum percentage of donations received be distributed as scholarships. That percent varies, usually between 90 and 95 percent.

12
III. Literature Review Research on school tuition organizations is part of a broader literature concerning public support for private education that can include tax-based assistance for higher education as well as for elementary and secondary schooling. Although tax credits for contributions to school tuition organizations are unique among policy approaches, the research on related areas of tax policy can help to inform the present study. A. Federal Tax Incentives Dynarski and Scott-Clayton (2017) identify sixteen incentives in the federal tax code that provide support for either K-12 education, postsecondary education, or both. As these authors point out, “Policy makers have a variety of tools at their disposal for subsidizing education: they can directly subsidize educational institutions through expenditures, they can directly subsidize students through student aid or voucher programs, and/or they can implement targeted tax credits and deductions” (p. 162). However, the federal government has not established an incentive similar to the numerous state-level STO Tax Credits discussed in Section II. In their investigation of one of these incentives, the above-the-line deduction for tuition and fees, Hoxby and Bulman (2016) found no evidence that the deduction has any effect on college attendance. They found, in part, this is because the deduction is perceived not as a subsidy for tuition but as a change in income; they attribute this to the temporal distance between the time the deduction is taken (i.e., when taxes are filed) and when tuition is due. On this question, at least, Dynarski and Scott-Clayton are in full agreement with Hoxby and Bulman. Crediting work by these authors in both 2015 and 2016 and Turner (2012) with having firmly settled the matter, Dynarski and Scott-Clayton contend that tax credits and the tuition tax deduction for higher education “have precisely zero effect on human capital accumulation” (p. 158). They suggest that this may partly be due to postsecondary institutions capturing the benefits through increased tuition and reduced institutional financial aid. Turner finds that “Contrary to the intention of policymakers, [...] schools fully counteract the cost reduction of tax-based aid by lowering institutional aid dollar-for-dollar” (p. 463). This area of research concerns the extent to which tax incentives might directly affect family behaviors; that is, it concerns policies intended to affect the educational choices of taxpayers themselves. In this regard, such policies differ qualitatively from the STO Tax Credit and similar tax credits in other states. Whereas the tax benefit associated with any of the federal incentives discussed above is in general realized by the same household that receives the incentivized education benefit, contributions to STOs subsidize educational assistance to families other than those who directly receive the tax credit.

13
B. Fiscal Analysis of School Tuition Organizations A 2008 book by Welner is devoted to analysis of tax credits for private school tuition donations. While Welner terms such tax credits “neovouchers,” the research reviewed by Welner concerns more conventional vouchers in general. Because there are numerous models of voucher programs, the research is often limited to either a particular program or some aspect of programs. Often, findings relevant to a given program can only be generalized to the extent that other programs are similarly structured. Despite its limitations, it is useful to assess the research on vouchers with respect to certain relevant questions. Vouchers are fundamentally a mechanism for funding education. Because, like school tuition organizations, they are a means of providing public support for private education, the fiscal effects of voucher- and voucher-like programs and the approaches used to evaluate these effects are of relevance to the present study. A study by Coulson (2008) assessed the likely fiscal impact of a hypothetical voucher program. The subject of inquiry was the Cato Institute’s model legislation for a state education tax credit program. Rather than empirically evaluating a program in place, this research provides a fiscal analysis based on model inputs employing published formulas, such as for the elasticity of demand for private schooling. This research calculated both state- and district-level budget impacts and found fiscal savings associated with student migration to private schools. Among efforts to address fiscal impacts of actual state school tuition organization tax credit programs are analyses by the Southern Education Foundation (2011), Buschman and Sjoquist (2014), and Lueken (2016). While these reports represent divergent viewpoints on STO tax credits, their approaches to calculation of fiscal impacts are broadly consistent. The Southern Education Foundation report concerns Georgia’s tax credit scholarship program and concludes, “there is no factual evidence to support a contention that tax credit scholarships are saving the State of Georgia any money” (p. 54). Nevertheless, its analysis demonstrates that the program’s fiscal impact hinges on certain key factors; these include the share of students who are enabled to attend private schools as a result of the scholarship and per pupil spending in the scholarship program as compared to the state’s average per pupil expenditures. According to Buschman and Sjoquist, the fiscal impact of STOs can be calculated based on four data points: “the tax credits per scholarship recipient, the number of recipients, the reduction in spending on education if a student switches from public school to private school as a result of the scholarship, and the share of scholarship recipients who switch” (p. 12). Their fiscal estimates are sensitive to the parameter values they assume for these elements. These range from as low as a net savings to the state of $25.7 million, when the authors assume a tax credit scholarship per student of $3,000 and that 30 percent of recipients switch as a result of the scholarship, to as high as a net cost of $18.0 million under assumptions that include higher tax credits per scholarships. Lueken’s analysis of programs in seven states incorporates precisely the elements adopted by Buschman and Sjoquist. Lueken found that Iowa’s STO Tax Credit resulted in a fiscal savings to the State of $73 million in 2014. Given that the Iowa tax

14
credit had an award cap of $8.75 million in that year, this estimate suggests an astounding rate of return on the State’s investment. However, the estimate assumes that 91 percent of students receiving tuition grants would have otherwise attended a public school. C. Substitution Rate Buschman and Sjoquist (2014) review research on voucher programs to inform estimates for the key data points noted above, in particular with respect to what they refer to as the switch rate. This rate represents the percentage of students who would attend public schools if not for the receipt of the aid in question, whether a voucher or tuition grant. For clarity in the present analysis, this rate is termed the substitution rate. The Montana Budget and Policy Center (MBPC) lays out the premise for a fiscal analysis of STOs as follows: “The principle behind tax credit scholarships rests on the idea that families save the state money by attending private schools rather than public ones. Theoretically, if a student leaves public school to attend private school, the state saves money” (MBPC, 2013, p. 3). However, MBPC argues “this premise is flawed” because, based on research concerning the tax credit scholarship program in Arizona, “typically, the primary users of these scholarships are students who would have or are already enrolled in private schools without the scholarship” (p. 4). This is to say that the MBPC assumes a substitution rate of close to zero. In an analysis of the Arizona tuition tax credit, Wells (2011) puts the matter similarly. Suggesting that estimates of the fiscal impact of the tax credit invariably hinge on estimates of the substitution rate, Wells states, “the challenge is to ascertain how many students currently in private school would be in public school […] if the tax credit scholarships were not available” (p. 7). Wells offers four estimates of the impact of the Arizona tax credit on private school enrollment, each based on alternative assumptions. However, Wells calculates that students whose presence in Arizona private schools is contingent on tax credit scholarships represent no more than 11 percent of scholarship recipients. Buschman and Sjoquist note that prior research by Lips and Jacoby (2001) estimates the substitution rate falls between 15 and 30 percent for statewide programs that are not restricted to low-income students. However, they warn that this estimate is based on interviews with tuition organization staff rather than on direct observation or quantitative analysis. For their own study of the fiscal impact of Georgia’s Tax Credit Scholarship program, Buschman and Sjoquist note that they lack the data necessary to estimate a substitution rate. Thus, instead, these authors calculate the degree to which estimates of fiscal impact are sensitive to various provisional substitution rates and other parameters. In addition, they estimate the substitution rate required for the Georgia program to break even; that is, for the cost of the program to be budget neutral at the state level. Given the number of program scholarship recipients, they estimate that the substitution rate would have to be quite high, approximately 87 percent, for Georgia to break even when the average scholarship is at its actual value. However, they suggest that a fairly high substitution rate is plausible when tuition grants are issued on a

15
means-tested basis such as for the Iowa STO Tax Credit program. These authors nevertheless admonish against accepting substitution rate estimates of up to 100 percent as employed elsewhere, such as in Gottlob (2008). Ferreyra (2007) developed a general equilibrium model using U.S. Census and other data to estimate the effects of hypothetical voucher programs on enrollment in private schools in the Chicago metropolitan area. In Ferreyra’s model, the substitution rate depends on the value of the voucher as well as a number of other factors, such as income, wealth, private school preference, and location variables. At the time of the study, household income in this district averaged $63,589. In response to a voucher of $1,000 made available to income eligible households, the author calculated that 6 percent of all students in the model school district would switch from public to private school, an estimate that represents 27 percent of households receiving vouchers in the model. As the value of hypothetical vouchers increases, so does the estimated substitution rate. In addition, along lines noted by Turner (2012) regarding higher education tax incentives, vouchers increase both spending per pupil and tuition in private schools. As Ferreyra notes, “Other things equal, vouchers lead to a higher tuition […] while reducing the share of tuition paid by parents” (p. 805). Assuming a voucher of $1,000, tuition is estimated to average $5,800, whereas assuming a voucher of $5,000, average tuition is estimated at $6,400. Assuming vouchers of up to $7,000, Ferreyra estimates substitution rates of up to 58 percent and tuition of up to $8,200. Ferreyra models vouchers that represent from 17 to 85 percent of tuition at private schools; given these parameters, estimated substitution rates range from 6 to 58 percent. Gottlob (2011) developed a regression model based on historical variation in district-level enrollments and expenditures to estimate marginal public school expenditures per student. In addition, he employed the model to estimate households’ responsiveness, in terms of private school enrollment, to the availability of tax credit scholarships. As Gottlob observes, scholarships have the effect of lowering the price of schooling. The extent to which a change in price affects demand is termed the price elasticity of demand; where a decrease in price leads to an increase in demand, price elasticity is negative. Citing Keeler and Kriesel, (1994), Chiswick and Koutroumanes (1996), Gwarntey and Stroup (1997), and Dynarski, Gruber, and Li (2009), Gottlob notes that estimates in the literature of the price elasticity of demand for private school range from -0.5, wherein a 10 decrease in price leads to a 5 percent increase in demand, to as a high a magnitude as -1.1. One other valuable and perhaps counterintuitive insight is to be found in the work by Dynarski, Gruber, and Li (2009). These authors used demographic and socioeconomic characteristics including race, ethnicity, income, parental education, and marital status to estimate families’ likelihood of private school attendance. They found that families with the lowest probability of attending private school as predicted from these characteristics were the most sensitive to price. They conclude that, as a result, voucher programs disproportionately induce behavior change among families who are otherwise less likely to attend private school. They note that this conclusion is dissonant with the prevalent assumption that vouchers induce new students who are as similarly disposed

16
to attend private school as current private school students; that is, their findings contradict the assumption that families who receive vouchers would generally attend private school even without vouchers. IV. Analysis of Iowa School Tuition Organization Tax Credit Awards and Claims A. School Tuition Organization Tax Credit Awards The STO Tax Credit cap has increased over time from $2.5 million in 2006 to $12 million since 2014 (see Table 3). There have been 12 active school tuition organizations since 2010, with the exception of 2016 when one of the STOs went inactive for a year. The total number of students enrolled in schools that participate in the STO program has held relatively steady between 33,000 and 34,000. On average, the smallest STO has covered just over 100 students in almost every year and the largest STO has covered almost 11,000 students each year. Since 2010, when the number of STOs increased to 12, the number of schools covered by school tuition organizations has held steady around 139 schools across Iowa (see Table 4). In that same period, the number of tuition grants issued each year has averaged just over 10,500. With the increasing cap, and thus contributions, over that time, the average tuition grant increased from just over $1,000 to over $1,500. It should be noted that there is a one year lag between when the program cap is increased and an increase is seen in the amount of tuition grants issued. This is due to the timing of when contributions are made versus the timing of when tuition grants are made. For example, contributions that were received during calendar year 2017 will be used for tuition grants issued for the 2018-2019 school year. There were over $0.5 million fewer tuition grants issued in 2016, this is due to seven of the 11 active STOs in 2016 issuing fewer tuition grants. The biggest decrease in tuition grants was seen by the Our Faith, Our Children, Our Future STO which covers the largest enrollment of private students in Iowa. The amount of tuition grants issued by the STOs decreased by $400,000 from 2015 to 2016. Despite the drop, the 90 percent requirement was still met. In 2006, when the tax credit cap was $2.5 million, there were 1,125 tax credit awards issued (see Table 5). The most STO Tax Credit awards were issued in 2014, when the number reached 3,708. Since 2014, when the tax credit cap was increased to $12 million, the average number of awards each year was 3,529. It should be noted that these are not necessarily the number of individuals or households, but the number of tax credit certificates issued. An individual or household can receive multiple tax credit certificates in a single year for several reasons. One reason is that some taxpayers choose to make several donations to one STO which can generate multiple certificates. Some individuals also choose to donate to more than one STO, in which case each STO must issue the taxpayer a separate tax credit certificate. It is also possible that both spouses in a household make donations to one or more qualified STOs and each spouse receives one or more tax credit certificates. In addition, it is possible that more donations are made than certificates issued because a taxpayer can make multiple

17
donations throughout the year and the amounts of those donations can be aggregated on one certificate. During award years of 2006 through 2016, $89.5 million in tax credits have been awarded for $137.5 million in contributions. With no cap on the award issued to any taxpayer, the largest tax credit issued is $325,000 for a taxpayer’s contribution of $500,000 in 2011. However, the program also generates small donations, with the smallest award of just $3 for a $5 donation in 2012. B. School Tuition Organization Tax Credit Claims As the tax credit cap has increased, so have STO Tax Credit claims. In 2006, the first year of the program, tax credit claims were nearly $2.2 million dollars (see Table 6). In 2014, tax credit claims exceeded $11.2 million. It is expected that claims will reach a similar level in tax years 2015 and 2016 once all tax credit claims have been reviewed. Since the inception of the School Tuition Organization Tax Credit Program, over $82 million of tax credits have been claimed to date. The nonrefundable tax credit can be carried forward for five additional tax years, but after that time, any unused tax credits expire. Preliminary numbers through tax year 2016 indicate that nearly $0.4 million of STO Tax Credits have expired. It is also of interest to examine the timing in which tax credit awards are claimed. On average, almost 71 percent of tax credit awards are claimed in the first fiscal year following the award (see Table 7). That percentage falls to just over 18 percent in the second fiscal year. Over the allowable carry forward period in which tax credit awards can be claimed, over 96 percent of all awards issued have been claimed for tax credits awarded between 2006 and 2011. V. Evaluation of the School Tuition Organization Tax Credit The evaluation of the STO Tax Credit addresses two questions.
1. Who benefits from STO tuition grants? 2. What is the net fiscal impact of the STO Tax Credit?
The following section describes tuition grant recipients in terms of financial characteristics including family income and level of financial aid need based on an analysis of student-level data provided by STOs on a voluntary basis in response to a request by the Iowa Department of Revenue. The Department requested information pertaining to tuition grant recipients for the following nine data elements: school year, grade, zip code of residence, family income, number of persons in the students’ household, school of attendance, school tuition, financial aid need, and amount of tuition grant. Ten of the 12 STOs provided student-level information concerning one or more, though not necessarily all, of these data elements. Of those ten STOs, two provided information
18
pertaining to only a single academic year and information from a third STO was submitted too late to be included in the analysis. The number of STOs for which data is available thus varies by year, with data from no more than seven STOs represented for any year. Iowa Code does not require STOs to retain or report this information and, for non-respondent STOs, records pertaining to the requested information may not have been available. Most respondent STOs provided data for the 2012 through 2016 school years and the analysis in this section concerns these years only.1 For each of these five most recent complete school years, the analysis file includes data from at least five STOs (see Table 8). The analysis is thus limited to only a portion of the tax credit’s history, both with respect to the number of school years it covers as well as with respect to the share of total tuition grant recipients. Records represent no more than 66 percent of the total number of tuition grants issued in any year. Tuition grants in the analysis data file represent 58 percent of the total number of tuition grants issued for the 2012 through 2016 school years. At least half of the schools served by STOs are represented in the data file, with the share of schools represented in any year reaching 71 percent in 2016.2 In addition, some records have missing data for some variables; for example, the foregoing percentages regarding number of schools represent only those records for which school information is not missing. Because the following analysis pertains to only a nonrandom share of the data underlying the total program, it may not be representative of the entire program. The analysis is undertaken with these limitations in mind. The following discussion focuses on the financial benefits of the tuition grants. However, if the tuition grants make it possible for some students to attend nonpublic schools, tuition grants presumably give rise to non-pecuniary benefits. These might include, for example, increased satisfaction with schooling and other benefits for participating families. It is has also been suggested that the tuition grants give rise to benefits for other students by expanding economic diversity. The nature and extent of such qualitative benefits are not considered here. A. Who Benefits from STO Tuition Grants? On a student-weighted basis, average tuition among schools represented in the data file has increased steadily since 2012, from $2,710 in that year to $3,658 in 2016 (see Table 9). Tuition data reflects all school levels represented in the data, including tuition for pre-K, K-8, and high school as well as both regular and special education, if different, as reported by STOs. Trends in tuition, as with other variables in the analysis file, partly reflect the changing composition of the data from year to year. In addition, for some schools more than one value for full tuition is reported in a single year. As with all data in the file, tuition is reported on a student-by-student basis and it is not possible in all cases to determine the tuition and fee structure by grade for each school.
1 For this discussion, school year refers to the calendar year in which the school year begins. For
example, the 2016 school year means the 2016-2017 school year. 2 Schools are identified in the data file by name only. The number of schools represents the number of
unique school names. Because more than one school can have the same name and because a single school might be listed under more than one (similar) name, the number of schools is only approximate.

19
The minimum value for tuition in the 2012-13 school year was $591 (see Table 9). After increasing in 2013, the minimum was below $300 through the end of the period. It is likely these minimum tuition amounts reflect only the tuition associated with attending only one class at the school. Meanwhile, the maximum tuition represented in the data file has ranged from $15,900 in 2013 to $24,400 in 2016.3 This rise and fall largely reflects changes in the sample of students for whom data is reported rather dramatic fluctuations in the tuition charged by schools. STOs provided complete data regarding reported household income, financial aid need, and tuition grant amount for only a portion of those tuition grant recipients for whom they provided any data. Tuition grant recipients for whom data on all of these elements was provided number between 4,500 and 5,400 in each year of the data file (see Table 10). Since 2013 the average family income of tuition grant recipients has decreased modestly. After reaching $44,896 in 2013 it decreased slightly in each subsequent year. In 2016, average family income was $43,897, its lowest point over the five-year period. The upper quartile is the point of the distribution at which the values for 75 percent of cases are lower. For family income, it means that the families of 75 percent of the students in the data analysis file had incomes that were below this level. The value of the upper quartile has varied little over the period but, as with average income, has trended downward since 2013 when it was $63,375. In the last year of the period it was $61,841. Whether as a result of an increasing number of low-income tuition grant recipients or the stagnation of income among existing recipients, or both, most measures of family income for tuition grant recipients have remained below the peak they reached in 2013. However, the maximum value for family income is comparatively high, exceeding $120,000 in all years. Further analysis of tuition grant awards by family income relative to poverty guidelines is provided below. 1. Financial Aid Need The Code that established the STO Tax Credit includes neither regulations nor guidelines for the determination of financial aid need among tuition grant applicants. Rather, procedures for calculating financial aid need are determined by each STO. Nevertheless, despite whatever variation in particulars among STOs, financial aid need uniformly represents the difference between the cost of tuition and a family’s calculated ability to pay. Thus, observed changes in financial aid need reflect changes in either family income, tuition, or both. As discussed above, income of tuition grant recipient families has, on average, decreased modestly since 2012. Meanwhile, tuition at schools participating in the STO program has fairly steadily increased. Taken together, these trends have led to an upward trend in financial aid need. Since 2012, the average amount of financial aid need among tuition grant recipients in the data analysis file has increased steadily. At $1,791 in the 2012 school year, average need increased to $2,253 over the next four years.
3 Tuition can include room and boarding costs as applicable.

20
The distribution of financial aid need is somewhat skewed by students with a high level of need. While the median level of financial aid need was $2,220 in 2016, for the quarter of tuition grant recipients with the greatest levels of need, need ranged from $2,975 to $8,540 (see Table 10). Meanwhile, the minimum level of financial aid need reported for tuition grant recipients in every year during the period is zero. That is, in every year, there are tuition grant recipients with no measured need. This follows from what a contact at one STO reported; specifically, that all students who apply and meet the program’s eligibility criteria are issued a tuition grant. For at least that STO, eligible students whose families’ calculated need based on the STO’s own formula is $0 nevertheless receive a tuition grant, typically the minimum allowed under the STO’s own policies. Based on the analysis file, this policy appears to be common among STOs. Nevertheless, most recipients in the data file demonstrate a fairly substantial amount of need. In each year, half of recipients had financial aid need of more than $1,700. More discussion of the relationship between family income and financial aid need is provided below. 2. Amount of Tuition Grant Among recipients in the analysis data file, the amount of each tuition grant received ranges from as little as $8 to as much as $5,750 (see Table 10). The average tuition grant has increased steadily, from $1,256 in 2012 to $1,801 in 2016. Many students receive tuition grants of modest amounts, consistent with the low amounts of calculated need among some recipients noted above. In the first three of the five years during the period, the tuition grant amount at the lower quartile was below $350, meaning that twenty-five percent of recipients in each of these years received tuition grants of this amount or less. In the last two years, however, the lower quartile value increased to above $600. In 2016, among the 5,211 students in the data, it was $620. In 2016, the median tuition grant was $1,672 and the maximum tuition grant was $5,664. 3. Percent of Need and Percent of Tuition Met by Tuition Grants Over time, as tuition grant amounts have increased, the percentage of need met by tuition grants has also increased. In 2015, the median tuition grant increased to $1,663 from $1,261 the previous year, corresponding to the increase in the program tax credit award cap from $8.75 million to $12 million. Also in 2015, after declining somewhat between 2012 and 2014, the average share of need met by tuition grants increased to 75 percent from 67 percent the year before. The mean percentage of need met has ranged from 67 percent, in 2014, to 79 percent in 2016. As of that year, the median percentage of need met by tuition grants is 78 percent. The upper quartile amount was 95 percent, meaning that, in that year, three quarters of tuition grant recipients had this percentage or less of financial aid need that was met. For this study, tuition is understood to encompass the price of schooling that is presented to a student’s family . That is, it does not include the full cost of schooling that might subsidized by other sources, such as an affiliated parish or school foundation. Because need is defined as the gap between tuition and a family’s calculated ability to pay it, need cannot exceed tuition. In general, tuition grant-recipient families are
21
expected to contribute to the cost of schooling and tuition exceeds calculated need. On average, between 2012 and 2014, tuition grants met between 48 and 49 percent of tuition costs facing tuition grant recipients. In subsequent years, tuition grants met a substantially higher percentage of tuition; in 2015 and 2016, respectively, the average share of costs met by tuition grants was 61 percent and 58 percent. The median percentage of need met by tuition grants has followed a similar trend. In all years, the maximum value for this metric has been 100 percent, indicating that, at least for some students, tuition grants offset the full cost of tuition. In 2016, although the percentage of tuition met by tuition grants varied from as low as three percent to 100 percent, three quarters of tuition grants issued offset at least 69 percent of tuition costs for recipients. For the five-year period between 2012 and 2016, data pertinent to family income and need is available for 24,833 tuition grant recipients (see Table 11). For this period, students from families with annual income of $80,000 or less accounted for 92.8 percent of tuition grant recipients. However, students from families with annual income below $80,000 accounted for a slightly higher percentage, 96.4 percent, of financial aid need. It is not surprising that financial aid need was inversely correlated with family income such that those students from lower income families accounted for a somewhat higher percentage of financial aid need than their higher-income counterparts. More significantly, the distribution of tuition grant dollars was highly proportionate to financial aid need. For example, students whose family income was $0 or less accounted for 3.1 percent of need and 3.6 percent of tuition grant dollars; students whose family income was more than $0 but less than $20,000 accounted for 19.7 percent of need and 19.4 percent of tuition grant dollars. As noted above, families with income of less than $80,000 accounted for 96.4 percent of need. Correspondingly, these families received 96.6 percent of tuition grant dollars. 4. Percent of Need Met, by Income Level The tuition grant data indicate that, as expected, students with greater need levels receive tuition grants that address a higher percentage of need (see Figure 1). As discussed in a previous section, the data include a sizable minority of students whose calculated financial aid need was $0 who nevertheless met program eligibility guidelines and received tuition grants. Those students are excluded from this analysis concerning the percentage of need met for families at different income levels. Considering only those students with calculated need, during the period there were 642 students whose family income was reported as $0 or less. For students in this income group, tuition grants met 83 percent of aggregate financial need. In general, for the whole group of tuition grant recipients, as family income increases, the percentage of need met by tuition grants decreases. Thus, for example, tuition grant recipient families with reported income between $1 and $60,000 received tuition grants that met between 71 percent and 73 percent of need. Correspondingly, families with higher incomes received tuition grants that met a lower percentage of need. The 132 families with income of between $100,000 and $120,000 received grants that, on average, met only 50 percent of need. Lastly, on aggregate, tuition grants met more than 70 percent of need for the 16 students in households with annual income above $120,000; that finding may partly

22
reflect that students in this highest income group have a level of financial aid need such that an STO’s minimum tuition grant might exceed the level of calculated need for the group as a whole. 5. Number and Amount of Tuition Grants by Poverty Level Grouping As noted above, STO Tax Credit tuition grants are limited to families whose income is no more than three times the most recently published federal poverty guidelines. Issued annually by the U.S. Department of Health and Human Services, the poverty guidelines are a measure of poverty used in the administration of certain federal programs.4 The guidelines vary by family size; for 2017 they vary from $12,070 for a single person to $41,320 for a family of eight and increase by $4,180 for each additional person thereafter (see Table 12). Because the poverty guidelines vary by the number of persons in a family or household and tuition grant eligibility is limited to 300 percent of those poverty guidelines, tuition grant eligibility varies by family size. Multiplying the poverty guidelines by three, for a family of eight, for example, the eligibility threshold in 2017 would be $123,960. With information about family size, students can be grouped in terms of the ratio of their family income to the applicable poverty guideline. For this analysis, students are classified by whether their family’s income is at or below the poverty guideline for their family size, between one and two times the poverty guideline, or between two and three times the poverty guideline. In 2012, 23 percent of tuition grants were made to students whose family income was below the poverty guideline (see Figure 2). Since then, the share of tuition grants made to students in this income grouping has remained remarkably steady, increasing by a single percentage point in 2015. Meanwhile, since 2012, the number of tuition grants made to students whose family income was between the poverty guideline and 200 percent of the guideline increased from 36 percent to 43 percent; the share of tuition grants going to the highest-income group decreased from 41 percent in 2012 to 35 percent in 2016. Since 2012, 23 percent of tuition grants have been made to students from families whose income was below the poverty guideline; 40 percent have been made to those whose income was between one and two times the poverty guideline; and 37 percent have been made to those with incomes between two and three times the poverty guideline. Over the period, students from families with incomes between one and two times the poverty guideline consistently account for the largest share of the dollar amount of tuition grants among the three groups, consistent with the larger share of grants received by this group (see Figure 3). The percentage of tuition grant award dollars granted to these students ranged from a low of 43 percent in 2013 to 47 percent in the 2014 and 2016 school years; it has averaged 46 percent over the entire period. Students from the lowest income group accounted for between 30 and 33 percent of tuition grant dollars while students from the highest income group received between 21 and 24 percent of tuition grant dollars, averaging 23 percent annual over the entire
4 U.S. Department of Health and Human Services (https://aspe.hhs.gov/poverty-guidelines).

23
period. This latter group began the period accounting for 24 percent of tuition grant dollars, a somewhat lower percentage than that of the lowest income group; in 2016, the highest income group accounted for 23 percent of tuition grant dollars, or about seven percentage points lower than the lowest income group despite their higher share of the number of grants. This reflects that the average grant awarded to students from families in the lowest group exceeds that made to those in the highest income group. This is discussed further below. Based on the sample of tuition grants, students from families with incomes above poverty outnumber those from families with incomes below poverty. They have received more tuition grants over the period, with students whose family incomes are between one and two times the poverty guideline receiving about the same percentage of the number of tuition grants as students with family incomes of more than twice the poverty guideline. Of the three groups, students from families in the middle category, i.e., with incomes of between 100- and 200 percent of the poverty guideline, have received the largest percentage of tuition grant dollars. Students in the lowest income group, with family incomes below poverty, have received the next largest share. Students in the highest income group have received the smallest share. On average, families with the lowest income received the highest tuition grant awards and families with the highest incomes received the lowest awards (see Figure 4). Over the period since 2012, the average tuition grant has increased for all three groups, as suggested in the discussion above concerning tuition grant recipients altogether. In 2012, the average tuition grant was $1,702 for students from families in the lowest income group, $1,558 for students in the middle family-income group, and $727 for the highest family-income group. By 2016, the average tuition grant for the lowest family-income group had increased 34 percent to $2,288; for the middle family-income group, it had increased 25 percent to $1,941; and for the highest family income-group it had increased by 62 percent, to $1,178. Increases in average awards are consistent with the overall upward trend in financial aid need observed in the analysis data set which, in turn, corresponds both to the increases in tuition among STO schools and the general stagnation of income among student families in the data. The increase was made possible by the increased STO program cap, and thus contributions. 6. Income Distribution of Tuition Grant Families and Other Iowa Families As has been noted elsewhere in this report, the public good rationale for the STO Tax Credit program is that it should allow children from low- and moderate-income families to attend nonpublic K-12 school in Iowa by reducing the effective tuition costs. Comparing the incomes of tuition grant-recipient families to those of other Iowa families, particularly those of all families with children who attend private school, can thus shed light on the degree to which the program serves its purpose. Information on the income distribution of Iowa families is based on data from two sources (see Figure 6). Family income data for the majority of tuition grant recipients was provided by the STOs, as discussed above. The distribution of Iowa households with children in private schools and all Iowa households was obtained from the U.S.

24
Census 2011-2015 American Community Survey five-year Public Use Microdata Sample (PUMS).5 To begin with a consideration of tuition grant recipient families only, it should be noted that the income distribution is strikingly normal. This bears out the findings from STO data discussed in previous sections. Owing to the income limitation on eligibility, of course, the distribution extends to only about $150,000. However, within this compressed range, the income distribution of tuition grant recipients is bell-shaped; there are more tuition grant families in the middle of the income-eligible range than at the very high end or very low end. In other words, the distribution is not skewed either to the top of the income-eligibility range or towards very low-income families. Nevertheless, tuition grant families are in general lower-income than their tuition grant non-recipient counterparts. The percentage of tuition grant recipients in lower-income groups is markedly higher than for either all Iowa families with private school students or Iowa families overall. When organized into income groups at $20,000 intervals, this is true for families with income through the $60,000 to $80,000 category. For example, families with income of more than $0 but less than $20,000 represent almost 15 percent of tuition grant families but less than 10 percent of Iowa families overall and five percent of Iowa families with children in K-12 private school. Likewise, families with income between $20,000 and $40,000 represent between 25 and 30 percent of tuition grant families but only about 16 percent of all Iowa families and about 12 percent of Iowa families with children in private school. By definition, tuition grant-recipient families are lower-income than tuition grant non-recipient families. This is all the more noteworthy insofar as, as a group, Iowa families with children in private K-12 school have higher incomes than Iowa families more generally. It is important to recognize that the two data sources employ different units of analysis. PUMs data is based on a multi-year weighted sample of Iowa families, such that each data point is taken to represent the income of one family. The data provided by STOs, by contrast, are provided on a student-by-student basis. For example, a single family with, say, two students attending an STO school would be represented twice in this data set; a family with three students would be represented three times, and so on. In addition, a given family can be represented across multiple years. That is, this analysis combines information for all five years under consideration, 2012 through 2016. For example, a family whose child received a tuition grant in all five of these years would be represented five times. Neither of these distinctions invalidates the analysis insofar as it is assumed that eligible families with higher or lower incomes are not systematically over- or under-represented in the data file. 7. Tuition Grants and Financial Aid Need The student-level data provided by STOs for this evaluation study is particularly valuable insofar as it informs the degree to which tuition grants meet financial need. For
5 Public Use Microdata Sample (PUMS) data and supporting documentation are published by the U.S.
Census at the following web address: https://www.census.gov/programs-surveys/acs/data/pums.html.
25
school years 2012-13 through 2016-17 combined, among tuition grant recipient-households with positive income and for whom full tuition was reported as greater than $500, tuition as a percentage of family income ranges from 2.5 percent at the tenth percentile to 91.6 percent at the 99th (see Table 13). For half of students, tuition represented 6.1 percent or less of family income. The 70th decile, or the point on this measure at which 70 percent of recipient-households fell at or below, was 9.5 percent. The 90th percentile is 19.6 percent, indicating that for ten percent of tuition grant households, tuition per student represented more than 20 percent of household income. It is important to remember that tuition data is reported on a student basis, not aggregated by family. For example, for a given family with two students for whom tuition represented ten percent of household income each, total tuition would represent 20 percent of family income; however, for this analysis, this family is counted as two instances in which tuition represents ten percent of income. As noted above, a number of tuition grant recipients in the data file had zero reported need. In fact, this was true of at least 10 percent of recipient households. However, the median level of need as a percentage of tuition was 88.5 percent, indicating that for half of tuition recipients in the data file, calculated financial aid need represented all or nearly all of their school’s tuition cost. The median level of need met by tuition grants was 73 percent. Although there were recipients in the data file whose tuition grant met 100 percent of financial aid need, for 90 percent of recipients, tuition grant amounts represented 95 percent or less of need. Because calculated need is lower than full tuition for about half of students in the data file, tuition grant amounts are somewhat lower as a share of full tuition than as a share of need. For half of recipients over all years, tuition grants equaled 56.2 percent or more of full tuition. B. What is the Net Fiscal Impact of the STO Tax Credit? The analysis of the net fiscal impact of the STO Tax Credit assesses the fiscal benefit of the tax credit comparing its costs to its positive fiscal impacts. While this question is crucial to the analysis of any tax credit, the STO Tax Credit is particularly well-suited to analysis on these terms. This is because key metrics used in the analysis are either readily available or can be estimated in an informed and straightforward way. A number of research efforts have examined this question with respect to school tuition tax credits in various states, including Iowa. As noted in the review of literature of this study, these include work by Buschman and Sjoquist (2014) and Lueken (2016), among others. These works describe a methodology for calculating the fiscal impact of similar tuition tax credits that can be adapted for the present study. As these authors point out, the fiscal impact of tax credits like the STO Tax Credit can be calculated on the basis of four data elements, as follows:
cost of the tax credit
the average cost to educate a student in a public school in the state

26
the number of tuition grant recipients
the share of tuition grants given to students who would otherwise attend a public school
The present study builds on this previous work, employing these data elements to evaluate the net fiscal impact of the STO Tax Credit. However, the present study differs from prior work by employing different, and in some cases more direct, metrics for some of these elements. With a focus on the Iowa experience, the present study also examines data over every year since the inception of the STO Tax Credit program. Data elements, their sources, and the calculation procedures used for this study are described below. 1. Cost of the Tax Credit Information about the aggregate cost of the STO Tax Credit for each full year since its inception is provided in Section IV of this evaluation study. As noted in that section, there is a lag of one year between when qualifying contributions are made and when the tuition grants associated with those contributions are issued; contributions received during a given calendar year fund tuition grants issued for the school year beginning in the subsequent calendar year. For example, contributions received during calendar year 2016 are used for tuition grants issued for the 2017-18 school year. For this analysis, the cost of the tax credit in a school year is the total amount of tax credit awards issued for the prior year.6 The aggregate cost of the tax credit is less than the total amount of tuition grants awarded because the cost to the State is no more than 65 cents per dollar of tuition grant. If tax credits expire before the taxpayers are able to claim them, this would lower the cost below the 65 percent tax credit rate.7 As initially noted in Table 6, the volume of tuition grants issued in each year has increased in nearly every year since 2007, paralleling increases in the program award cap (see Table 13). Based on tax credit program information, the cost of the tax credit has ranged from $2.5 million in the 2007 school year to $12 million for school years since 2015. The average tax credit award per tuition grant by school year factors in both the total cost of the tax credits as well as the number of tuition grant recipients (see Table 14). The average tax credit award per tuition grant is not equal to the average tuition grant amount because each tax credit dollar funds $1.53 of tuition grants. This is because the tax credit rate is 65 percent. The average tax credit award per tuition grant is simply tax credit awards issued divided by the number of tuition grants. It is employed here because it more directly reflects the per-student cost to the State of providing tuition grants than average tuition grant amount. As the total amount of tuition grants issued has increased, the number of tuition grants issued has remained quite steady; the average tax credit issued per tuition grant has
6 This approach slightly overstates the cost of the tax credit because it does not exclude expired tax
credits. Over the history of the program, about 3 percent of awarded credits expire each year. 7 The impact of the tax credit on school district surtax revenues is not estimated here.

27
thus increased over time. In 2008, the average tax credit award per tuition grant was $567. The size of the average tax credit award per tuition grant surpassed $1,100 in 2015-16, when it reached $1,106. In 2016-17, the average tax credit award per tuition grant was $1,114. 2. Estimated Cost Per Student in Public Schools Whereas the previous subsection discusses the State’s average cost per student associated with the STO tuition grants, this subsection is concerned with the average cost of educating each student in the public schools in Iowa. Note that both of these metrics concern costs borne by the State and by public school districts. In the most general terms, the average cost of any kind of production effort is simply the total cost of production divided by the number of units produced; as applicable to public schooling, the average cost per student is the total cost of education averaged over the number of students in question. Marginal cost, by contrast, is the additional cost associated with a single additional unit of output at various levels of total output; in the case of public schooling, it is the change in total costs of education associated with a change in the number of students in the school system under consideration at a given level of enrollment. This project is concerned with the impact of the STO Tax Credit on public school enrollment and the effect of this change on the total cost of educating students in public schools in Iowa. For this analysis it is stipulated that average costs approximate marginal costs.8 In the Iowa school finance formula, Iowa law provides a mechanism for establishing public school funding levels.9 The purposes of this formula include providing sufficient funding for education, equalizing both educational opportunity and taxation, and providing districts with as much control of spending as possible (Iowa Code 257.31). Importantly for the purposes of this analysis, the formula is also student-driven, with funding based on the number of students a district serves (Legislative Services Agency [LSA], 2013a).10 Spending is authorized on the basis of costs calculated on a per pupil basis; thus, the formula provides a suitable and straightforward point of reference for understanding educational costs per pupil in the state. Under the school aid formula, the amount of spending authorized is termed the combined district cost. The formula grants maximum spending per student that cannot, in general, be exceeded except that districts may authorize an additional instructional support levy of up to an additional ten percent of the regular program district cost and adjustment. Thus, the combined district cost incorporates the State aid portion of per pupil costs as well as district-level sources. Sometimes referred to as the district’s “controlled budget,” the combined district cost is the basis of budgeting education costs
8 Marginal cost=change in total education costs/change in enrollment. Marginal cost equals average cost
when average cost does not rise or fall with a change in quantity produced. 9 This discussion is based on information provided in the Iowa Legislative Services Agency (2013) Issue
Review School Finance Formula – Aid and Levy Worksheet. 10
Legislative Services Agency (2013). Overview of School Finance in Iowa. Retrieved September 14, 2017, from https://www.legis.iowa.gov/DOCS/LSAReports/k12Education/SchoolAidPresentation.pdf.

28
at the district and State levels. It covers regular program costs, State categorical supplements for teacher salaries and professional development, special education program costs, other school programs such as dropout prevention, and Area Education Agency programs (LSA, 2013b).11 In addition, the formula accounts for variations in aggregate property valuations and is designed to minimize funding differences across property-rich and property-poor districts; that is, its calculation of educational costs is neutral to districts’ ability to pay. The combined district cost is funded from both State aid and school district levies. The State aid portion consists of approximately two-thirds of foundation formula funding. Although the combined district cost per pupil varies somewhat across districts, it may not be less than the State cost per pupil plus categorical supplements. For this analysis, it is assumed that the per pupil cost of education in the state is equivalent to the regular program cost per pupil plus State categorical supplements. These include the categorical supplements for teacher compensation, professional development, and early intervention for all school years since 2007 and the teacher leadership supplement beginning with the 2016 school year.12 In 2016-17, this cost per pupil was $7,613. Table 14 presents the State cost per pupil for 2007 through 2017. 3. Number of Tuition Grant Recipients As noted in Section IV, the number of tuition grant recipients has averaged about 10,500 between 2010 and 2016, remaining quite steady despite the program award cap having increased by 60 percent over the same period. Rather than an increase in the number of tuition grants, the increased award cap and concomitant increases in contributions led to an increase in the average tax credit award per tuition grant (as well as the average tuition grant). Between 2007 and 2016, the average tax credit award per tuition grant increased from about $332 to more than $1,100. This upward trend, if not its exact magnitude, corresponds to the upward trend in the costs of education over this period. Because each student recipient of a tuition grant receives only one tuition grant, the number of tuition grants is equivalent to the number of students who receive tuition grants. During the seven years between 2010 and 2016, the number of tuition grants has averaged 10,547 (see Table 14). The number of tuition grants issued in a single year ranges from 10,279 in 2010 to 10,848 in 2015; 10,771 tuition grants were issued in 2016. 4. Substitution Rate Central to the analysis of the fiscal impact of the STO Tax Credit is a measure of the extent to which it allows students who otherwise would attend public school to attend private school. While some tuition grant recipients would attend private school regardless, it is assumed that a percentage of students would not attend private school
11
2013, LSA Issue Review. Note, the combined district cost does not include the instructional support levy, miscellaneous income, nor any unspent balance. 12
Information about State education costs per pupil is published by the Iowa Department of Management. Data for fiscal year 2017 is published at https://dom.iowa.gov/document/district-cost-pupil-fy2017.

29
but for the tuition grant they receive. This percentage is referred to as the substitution rate. Although numerous considerations factor into a decision to attend private school, the financial assistance provided by the tuition grant presumably results in some families switching from sending their students to free public school to private school. The percentage of tuition grant recipients who otherwise would attend public school is estimated from information about the financial need of tuition grant recipients. Because this analysis can use administrative data from students’ family income, measured need, and the extent that the tuition grant meets students’ financial need, the present study improves on previous studies. During the ten full years since the establishment of the STO Tax Credit, total enrollment at schools served by STOs has ranged from a low of 33,342 to a high of 35,082, varying overall during this period by just 6 percent (see Table 4).13 In the STO Tax Credit program’s first full year, the number of students receiving tuition grants was 7,527; this number increased to almost 10,300 students in 2010. Since 2010, both the total number of students attending schools served by STOs and the number of students receiving tuition grants have remained very steady. Section V.A. provides information about the family financial characteristics of tuition grant recipients. As noted there, among families that receive tuition grants, the average percentage of financial aid need met by tuition grants has ranged from 69 percent to 79 percent over the last five years. Because need is associated with both income and tuition, those families for whom tuition was a larger share of income experienced more need. Based on the information provided in Table 13, for 40 percent of tuition grant families, tuition represented 8 percent or more of income. For this same percentage of families, financial need represented 100 percent of tuition. Because need represents the full price of attendance for these students, it might be assumed that 40 percent of tuition grant recipients would attend public school in the absence of the tuition grant. For this analysis, a somewhat more cautious estimate of the substitution rate is employed; it is assumed that 30 percent of tuition grant recipients would have attended public school in the absence of the tuition grant. As noted in Table 13, tuition represented 10 percent or more of family income for 30 percent of recipient families in the data file; likewise financial need represented 100 percent of tuition for this percentage of families. STOs have an incentive to identify need and to maximize the amount of aid allocated to those families who need it most and to minimize the amount of financial assistance allocated to those who do not. That is, STOs presumably seek to optimize assistance in terms the number of students for whom tuition grants are issued in order to maximize both school enrollment and met need. 5. Net Fiscal Impact As described above, the net fiscal impact of the STO Tax Credit can be understood simply as the difference between the reduction in public education costs resulting from
13
Table 4 is initially discussed in Section IV.

30
students receiving tuitions grants shifting to private schools and, the total amount of tax credit awards issued to finance the tuition grants. A net positive impact equates to a net fiscal savings to the State and a negative impact reflects a net fiscal cost. The formula can be expressed as follows: Net Fiscal Impact = (E x G x P) - C Where
E = per pupil cost of public education G = total number of tuition grant recipients P = estimated percentage of tuition grant recipients who otherwise would attend
public school (i.e., substitution rate) C = cost of the tax credit (i.e., total awards)
Following Buschman and Sjoquist (2014) and Lueken (2016), the reduction in public education costs can be calculated as the average cost to educate a student in a public school (E) times the total number of tuition grant recipients (G) times the percentage of tuition grant recipients who, without the tuition grant, would attend public school (P). Subtracting the cost of the tax credit from the result yields the estimated net fiscal impact of the tax credit. It is worth reiterating that costs to educate are average costs, not marginal costs. The values for each of these elements are described above. For the 2016-17 school year, the average cost to educate a pupil in Iowa public schools was $7,613 (see Table 14). With some 10,771 tuition grants issued to students attending private schools in the state, the total dollar amount of tuition grants was $17.1 million based on tax credit awards of $12 million. As noted above, the substitution rate is assumed to be 30 percent; in other words, it is assumed that 30 percent of the number of tuition grants, or 3,231, were issued to students who otherwise would have attended public school. Given the average cost of educating a student in public schools, it is estimated that it would have cost the State (including both General Fund and district-level funds) $24.6 million to educate these students in Iowa public schools. According to this analysis, then, the net fiscal impact of the STO program equals the reduced expenditures associated with public education, $24.6 million, minus the cost of the tuition grants, $12 million, or the total STO Tax Credit awards issued. The net fiscal impact of the tuition grant in 2017-18 school year is thus estimated to equal $12.6 million (see Table 14). Estimates of the STO Tax Credit’s fiscal impact for each year since 2007, the first full year of the tax credit’s availability, are all positive, under the assumption of a 30 percent substitution rate. In the first year, the estimated net fiscal impact of the tax credit was $10.4 million. Over subsequent years, the estimated net fiscal impact rises and falls slightly as a result of the interplay between trends in the State cost per pupil and the average tax credit award per tuition grant; the estimated net fiscal impact rises with increases in the State cost per pupil, and ebbs when these are overtaken by increases in the average tax credit award per tuition grant. The estimated net fiscal impact

31
increases in seven of the nine fiscal years through 2017 when it reaches the $12.6 million level noted above. 6. Breakeven Substitution Rate The formula used to calculate the net fiscal impact can be rearranged to calculate a breakeven substitution rate. This is the value of the substitution rate when, all other factors of the equation held equal, the net fiscal impact of the STO Tax Credit is zero. As described above, there were some 10,771 tuition grant recipients in 2017. Given the State cost per pupil of $7,613 in that year, it would have cost $82.0 million to educate all of these students in the state’s public schools. If the substitution rate were assumed to be 100 percent, wherein all tuition grant recipients would attend public school if not for the tuition grant, then the net fiscal impact of the tax credit program would equal that total less cost of the tax credits awards, a gain of $70.0 million. While it is assumed that some tuition grant recipients would attend private school even if they did not receive the tuition grant, the exact percentage of recipients who would attend public school but for a tuition grant is unknown. Whereas the estimated fiscal impact described above is a useful approximation, the breakeven substitution rate provides a lower bound for the point at which the program can be said to be cost effective from a fiscal perspective. For 2017, the breakeven substitution rate is that which would yield a reduction in costs to public education of $12.0 million such that the reduction would exactly equal the maximum cost of the STO Tax Credit for the 2017 program year such that the net fiscal impact of the tax credit would be zero. Mathematically, given the elements defined above, the breakeven substitution rate can be calculated by multiplying the number of tuition grants by the State cost per pupil and dividing the result by the total cost of the tax credit. The historical annual breakeven substitution rate was only 5.8 percent for 2007-08 (see final column in Table 14). Note that these calculations do not account for the expiration of any tax credits. For 2017-18, the breakeven substitution rate is 14.6 percent. This means that, given the assumptions outlined for this analysis, the net fiscal impact of the STO Tax Credit would be zero if the percentage of tuition grant recipients who would attend public school but for the tuition grant was only 14.6 percent, half of the rate estimated in the above analysis. The net fiscal impact would be negative—i.e., would result in a net loss to taxpayers—if the substitution rate were any lower than this percentage. Over time, the breakeven substitution rate has paralleled trends in average tax credit award per tuition grant and State cost per pupil. The rate peaked at 15.5 percent in 2015-16, the year in which the tax credit program cap was first increased to $12 million. It fell in the subsequent year when the average tax credit award per tuition grant leveled off but the State cost per pupil increased.
32
7. Meeting Financial Aid Need under the STO Tax Credit Program Cap Recall that the STO Tax Credit is equal to 65 percent of the value of a contribution made by a taxpayer to an STO and each STO is required to allocate at least 90 percent of its annual revenue to tuition grants. Under current law, the tax credit is subject to a program award cap of $12 million. The analysis in this section addresses the extent to which tuition grants meet the financial aid need of recipient families in the aggregate and estimates how any change in the program award cap might affect this measure. This analysis is based on student-level information provided by STOs. Information concerning need and tuition grant amounts was available for 7,395 tuition grant recipients in the 2016-17 school year. According to this information, 69 percent of the aggregate need of those recipients was met by tuition grants in that year. Given the level of need among recipients for whom data is available, and extrapolating to all recipients, it is estimated that total financial aid need for all tuition grant recipients in the 2016-17 school year was $24.8 million. Of this estimated total, $17.1 million was met by tuition grants awarded under the STO Tax Credit’s $12 million program cap. Overall, STOs retained eight percent of contributions to cover administrative costs, rather than the ten percent allowed by Iowa Code. With these parameters for total need and administrative costs, the program cap that would have been necessary, if fully subscribed, to meet various target percentages of total need for 2016-17 tuition grant recipients can be estimated. Thus, whereas an estimated 69 percent of total need was met under the program’s $12 million cap, it is estimated that 80 percent of need could have been met under a fully subscribed program cap of $13.9 million (see Table 15). Similarly, in order to meet 90 percent of need in 2016-17, the program cap would have needed to be an estimated $15.7 million; and a program cap of $17.4 million is estimated to have been required to meet 100 percent of the financial aid need of tuition grant recipients in that year. Using parameters described in previous sections, it is also possible to estimate the net fiscal impact of the STO tax credit under alternative program caps. Under a program cap of $15.7 million and all else equal, for example, it is estimated that the program’s net fiscal impact would be $8.9 million. Under a program cap of $17.4 million, the level at which it is estimated the STO tax credit could have met 100 percent of the financial aid need of tuition grant recipients in 2016-17, the program’s net fiscal impact remains positive. Given an alternative program cap of this magnitude, the program’s net fiscal impact is estimated at $7.2 million. These estimates for the STO Tax Credit cap necessary to meet 100 percent of need for the 2016-17 school year are subject to important caveats. For one, they concern a single academic year and do not account for changes in tuition costs or family income and need that are likely to occur over time. These estimates also do not account for any changes in either the supply or demand for private schooling that might result from any change in the program cap. The cap necessary to meet any given targeted percentage

33
of need is likely to increase somewhat each year if tuition costs rise more quickly than family income, thus expanding need. In addition, the analysis concerns current tuition grant recipients only; it is based partly on the assumption that all eligible students attending STO schools received a tuition grant in 2016-17. It does not consider the financial aid need of otherwise eligible students who, for whatever reason, did not apply for or receive a tuition grant nor the need of any students who did not attend STO schools but might be incentivized to apply for a tuition grant if the size of grants is increased. Lastly, as described in a previous section, while Iowa Code does not provide guidelines for the determination of applicants’ financial aid need, among STOs for which data regarding tuition grant recipients’ financial need is available, need consistently denotes the difference between the cost of tuition and a family’s ability to pay. However, except that it requires that recipients meet financial eligibility requirements, Code does not require that tuition grants be distributed on the basis of need. The analysis in this section assumes that tuition grant dollars are distributed proportionate to need. VI. Conclusion This evaluation study provides an overview and analysis of the STO Tax Credit. Enacted in 2006 to incentivize funding of tuition grants for children of low- and middle-income Iowa families to attend accredited schools in the state, the tax credit is equal to 65 percent of the amount of a voluntary financial contribution to an STO. Iowa is one of 18 states that offers some form of education scholarship tax credit. Since the program’s beginning in 2006, $89.5 million in tax credits have been awarded on the basis of contributions of $137.5 million. Of awarded tax credits, $82.2 million has been claimed. The twelve STOs operating in the state in 2017 represented schools with total enrollment of 34,000. This study provides a description of tuition grant recipients in terms of financial characteristics including family income and level of financial aid need. The percentage of tuition grant award dollars granted to students in families with income between 100 and 200 percent of the federal poverty guideline averaged 46 percent over the 2012-13 and 2016-17 school years. Students in families with income below poverty guidelines accounted for between 30 and 33 percent of tuition grant dollars while students in families with income between 200 and 300 percent of poverty guidelines (the program income limit) received 23 percent. Following estimates in the literature, an analysis of the net fiscal impact of the STO Tax Credit suggests the program results in net gains for the State. For the most current year, the program is estimated to have resulted in a $12.6 million positive fiscal impact, under the assumption that 30 percent of tuition grant recipients would have otherwise attended public school. That rate is based on the observation that financial aid need
34
represented 100 percent of the full cost of tuition for at least 30 percent of tuition grant recipients, tuition represented at least 10 percent of family income for 30 percent of recipient families, and tuition grants met at least 70 percent of the price of tuition for 30 percent of tuition grant recipients. The estimated net fiscal impact would be zero if the breakeven rate was only 14.6 percent that year. In the 2016-17 school year, it is estimated that the STO program met 69 percent of the measured financial need of the 10,771 students who received tuition grants. In order to have meet 100 percent of need, the 2016 STO Tax Credit cap would have to have been increased from the actual $12 million to $17.4 million. At that level, the net fiscal impact would still have remained positive.

35
References Buschman, R., & Sjoquist, D. L. (2014). Georgia’s Tax Credit Scholarship Program
(FRC Report No. 268). Georgia State University, Andrew Young School of Policy Studies . Fiscal Research Center. Retrieved May 18, 2017, from frc.gsu.edu/files/2014/06/Georgia-Tax-Credit-Scholarship_Nov2014.pdf
Chiswick, B., & Koutroumanes, S. (1996). An Econometric Estimate of the Demand for
Private Schooling. In Research in Labor Economics (pp. 209-237). Coulson, A. (2008). The Fiscal Impact of a Large-Scale Education Tax Credit Program.
Policy Analysis [serial online], No. 618. Retrieved from https://object.cato.org/pubs/pas/pa-618.pd
Dynarski, S., & Scott-Clayton, J. (2017). Tax Benefits for College Attendance. In A. J.
Auerbach, & K. Smetters, The Economics of Tax Policy (pp. 157-177). New York: Oxford University Press.
Dynarski, S., Gruber, J., & Li, D. (2009). Cheaper by the Dozen: Using Sibling
Discounts at Catholic Schools to Estimate the Price Elasticity of Private School Attendance. Working Paper # 15461. Chicago: National Bureau of Economic Research.
Ferreyra, M. M. (2007). Estimating the Effects of Private School Vouchers in Multidistrict
Economies. American Economic Review, 97, 789-817. Retrieved May 15, 2017, from https://pdfs.semanticscholar.org/5e6a/c6d25cc572f57c2659232e9004578663f09e.pdf
Gottlob, B. (2008). The Fiscal Impact of Tax-Credit Scholarships in Georgia. Foundation
for Educational Choice. Retrieved May 16, 2017, from http://www.edchoice.org/wp-content/uploads/2015/09/The-Fiscal-Impact-of-Tax-Credit-Scholarships-in-Georgia.pdf
Gottlob, B. (2011). The Fiscal Impact of Tax-Credit Scholarships in Oklahoma.
Foundation for Educational Choice. Retrieved May 16, 2017, from http://files.eric.ed.gov/fulltext/ED527011.pdf
Gwartney, J., & Stroup, R. (1997). Economics: Private and Public Choice (8th Ed.).
Dryden, NY: South-Western College Publishing. Hoxby, C. M., & Bulman, G. B. (2016, April). The Effects of the Tax Deduction for
Postsecondary Tuition: Implications for Structuring Tax-Based Aid. Economics of Education Review, 51, 23-60.

36
Keeler, A., & Kriesel, W. (1994). School Choice in Rural Georgia: An Empirical Analysis. Journal of Agriculture and Applied Economics, 26(2), 526-534.
Legislative Services Agency (2013a). Overview of School Finance in Iowa. Retrieved
July 17, 2017, from https://www.legis.iowa.gov/DOCS/LSAReports/k12Education/SchoolAidPresentation.pdf.
Legislative Services Agency (2013b). School Finance Formula – Aid and Levy
Worksheet [Issue Review]. Retrieved July 17, 2017, from https://www.legis.iowa.gov/docs/publi-cations/IR/16774.pdf
Lips, C., & Jacoby, J. (2001). The Arizona Scholarship Tax Credit Giving Parents
Choices, Saving Taxpayers Money. Policy Analysis [serial online], No. 414. Retrieved from https://www.cato.org/pubs/pas/pa414.pdf
Lueken, M. F. (2016). The Tax-Credit Scholarship Audit Do Publicly Funded Private
School Choice Programs Save Money? EdChoice. Retrieved May 15, 2017, from https://www.heartland.org/publications-resources/publications/the-tax-credit-scholarship-audit-do-publicly-funded-private-school-choice-programs-save-money
Montana Budget and Policy Center (2013). Tax Credit Scholarships: A Threat to
Montana-Based Education Solutions. Retrieved May 15, 2017, from http://www.montanabudget.org/wp-content/uploads/2013/08/Tax-Credit-Scholarships-A-Threat-to-Montana-Based-Education-Solutions.pdf
Southern Education Foundation (2011). A Failed Experiment Georgia's Tax Credit
Scholarships for Private Schools. Retrieved May 16, 2017, from http://www.southerneducation.org/getattachment/12d045ec-6960-4715-82fb-26a2b94de61c/Test-Publication-2.aspx
Turner, N. (2012). Who Benefits from Student Aid? The Economic Incidence of Tax-
Based Federal Student Aid. Economics of Education Review, 31(4), 463-481. Welner, K. G. (2008). NeoVouchers The Emergence of Tuition Tax Credits for Private
Schooling. Lanham MD: Rowman and Littlefield. Wells, D. (2011). Arizona’s Tuition Tax Credit Program’s Limited Impact on Private
School Enrollment. Unpublished study. Retrieved May 15, 2017, from http://www.public.asu.edu/~wellsda/research/ArizonasTuitionTaxCreditProgramandPrivateSchoolEnrollment.pdf

37
Iowa’s School Tuition Organization Tax Credit Tax Credits Program Evaluation Study
Tables and Figures

38
This page intentionally left blank
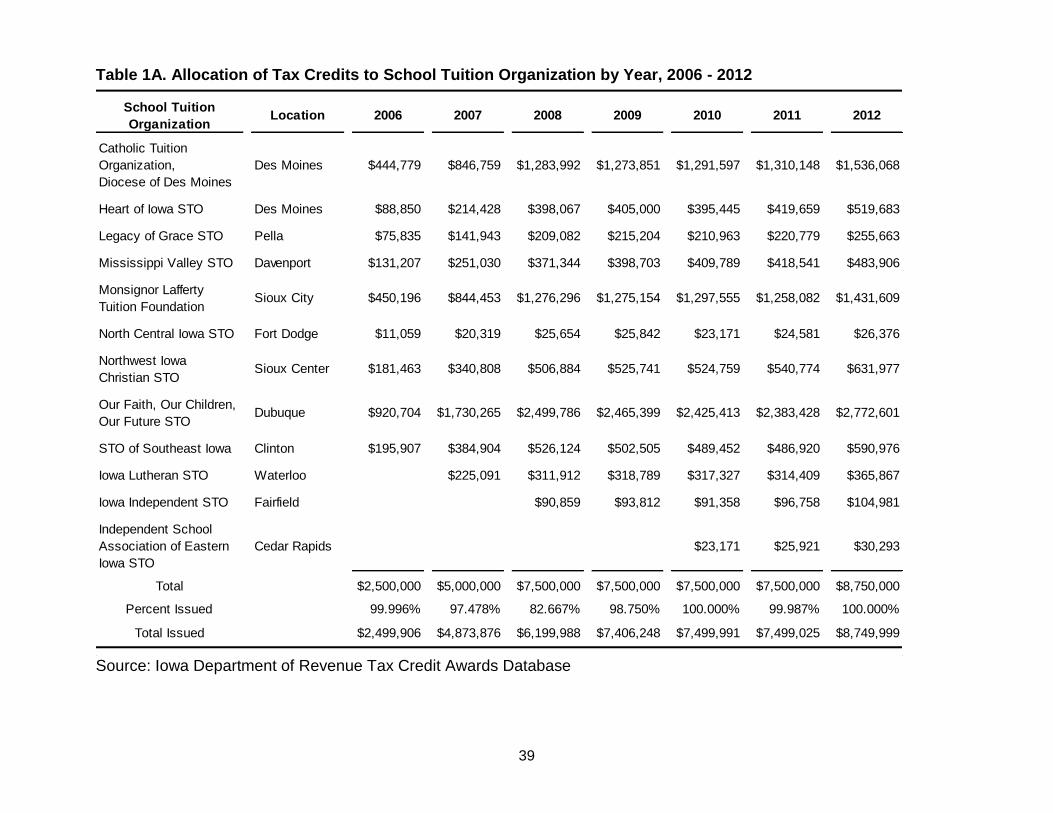
39
Table 1A. Allocation of Tax Credits to School Tuition Organization by Year, 2006 - 2012
Source: Iowa Department of Revenue Tax Credit Awards Database
School Tuition
OrganizationLocation 2006 2007 2008 2009 2010 2011 2012
Catholic Tuition
Organization,
Diocese of Des Moines
Des Moines $444,779 $846,759 $1,283,992 $1,273,851 $1,291,597 $1,310,148 $1,536,068
Heart of Iowa STO Des Moines $88,850 $214,428 $398,067 $405,000 $395,445 $419,659 $519,683
Legacy of Grace STO Pella $75,835 $141,943 $209,082 $215,204 $210,963 $220,779 $255,663
Mississippi Valley STO Davenport $131,207 $251,030 $371,344 $398,703 $409,789 $418,541 $483,906
Monsignor Lafferty
Tuition FoundationSioux City $450,196 $844,453 $1,276,296 $1,275,154 $1,297,555 $1,258,082 $1,431,609
North Central Iowa STO Fort Dodge $11,059 $20,319 $25,654 $25,842 $23,171 $24,581 $26,376
Northwest Iowa
Christian STOSioux Center $181,463 $340,808 $506,884 $525,741 $524,759 $540,774 $631,977
Our Faith, Our Children,
Our Future STODubuque $920,704 $1,730,265 $2,499,786 $2,465,399 $2,425,413 $2,383,428 $2,772,601
STO of Southeast Iowa Clinton $195,907 $384,904 $526,124 $502,505 $489,452 $486,920 $590,976
Iowa Lutheran STO Waterloo $225,091 $311,912 $318,789 $317,327 $314,409 $365,867
Iowa Independent STO Fairfield $90,859 $93,812 $91,358 $96,758 $104,981
Independent School
Association of Eastern
Iowa STO
Cedar Rapids $23,171 $25,921 $30,293
Total $2,500,000 $5,000,000 $7,500,000 $7,500,000 $7,500,000 $7,500,000 $8,750,000
Percent Issued 99.996% 97.478% 82.667% 98.750% 100.000% 99.987% 100.000%
Total Issued $2,499,906 $4,873,876 $6,199,988 $7,406,248 $7,499,991 $7,499,025 $8,749,999
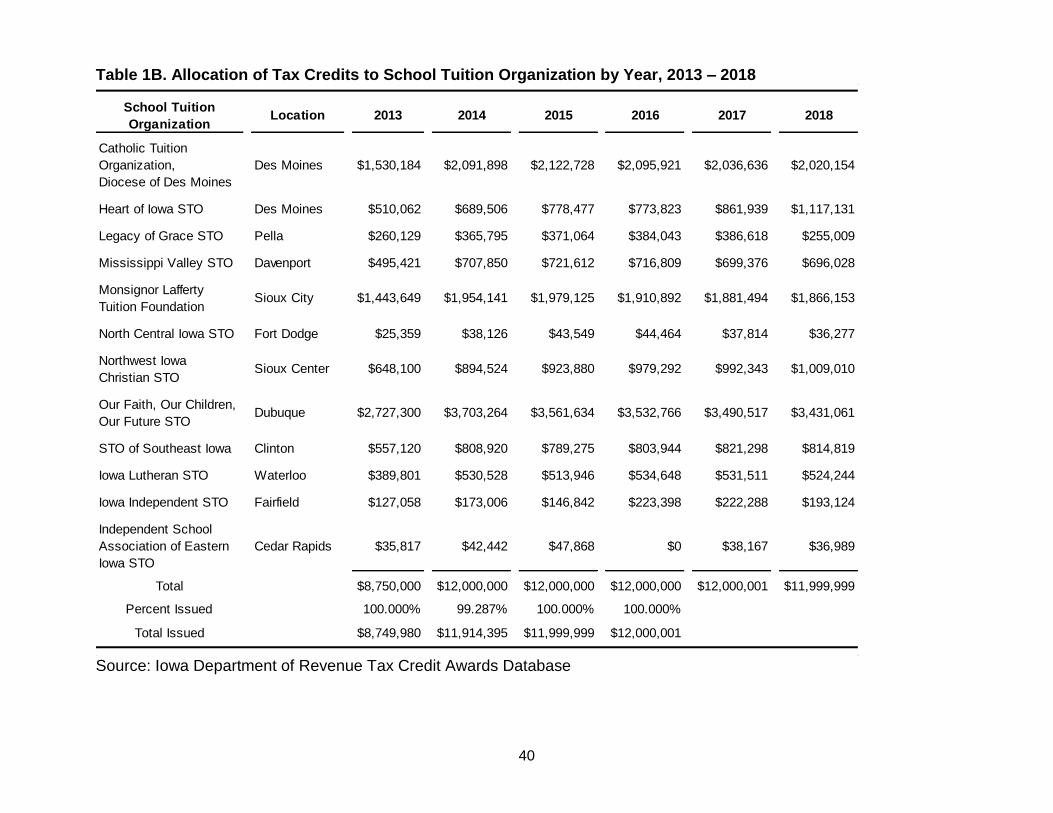
40
Table 1B. Allocation of Tax Credits to School Tuition Organization by Year, 2013 – 2018
Source: Iowa Department of Revenue Tax Credit Awards Database
School Tuition
OrganizationLocation 2013 2014 2015 2016 2017 2018
Catholic Tuition
Organization,
Diocese of Des Moines
Des Moines $1,530,184 $2,091,898 $2,122,728 $2,095,921 $2,036,636 $2,020,154
Heart of Iowa STO Des Moines $510,062 $689,506 $778,477 $773,823 $861,939 $1,117,131
Legacy of Grace STO Pella $260,129 $365,795 $371,064 $384,043 $386,618 $255,009
Mississippi Valley STO Davenport $495,421 $707,850 $721,612 $716,809 $699,376 $696,028
Monsignor Lafferty
Tuition FoundationSioux City $1,443,649 $1,954,141 $1,979,125 $1,910,892 $1,881,494 $1,866,153
North Central Iowa STO Fort Dodge $25,359 $38,126 $43,549 $44,464 $37,814 $36,277
Northwest Iowa
Christian STOSioux Center $648,100 $894,524 $923,880 $979,292 $992,343 $1,009,010
Our Faith, Our Children,
Our Future STODubuque $2,727,300 $3,703,264 $3,561,634 $3,532,766 $3,490,517 $3,431,061
STO of Southeast Iowa Clinton $557,120 $808,920 $789,275 $803,944 $821,298 $814,819
Iowa Lutheran STO Waterloo $389,801 $530,528 $513,946 $534,648 $531,511 $524,244
Iowa Independent STO Fairfield $127,058 $173,006 $146,842 $223,398 $222,288 $193,124
Independent School
Association of Eastern
Iowa STO
Cedar Rapids $35,817 $42,442 $47,868 $0 $38,167 $36,989
Total $8,750,000 $12,000,000 $12,000,000 $12,000,000 $12,000,001 $11,999,999
Percent Issued 100.000% 99.287% 100.000% 100.000%
Total Issued $8,749,980 $11,914,395 $11,999,999 $12,000,001

41
Table 2. Scholarship Tax Credit Programs in Other States as of June 1, 2017
State Program Enacted
Annual
Program
Cap
Amount of Tax
Credit
Qualifying Tax
Types Refundable
Carry
Forward
State
Itemized
Deduction
Scholarship Recipient
Guidelines
AlabamaEducation Scholarship
Program2013 $30 million
100% of qualified
contributions up to
50% of tax liability for
both businesses and
individuals, however
individuals are limited
to $50,000 per year.
Individual
Income Tax
Taxable C
corporations, S
corporations,
LLCs,
partnerships,
and pass
through entities
No 3 Years No
Student must qualify for
free or reduced-price
school lunches and be
younger than 19 years of
age. The student must also
be zoned to attend a public
school that is designated
as failing OR have been a
non-graduate scholarship
recipient in the previous
school year under this
program from a family with
an income less than 275%
of the federal poverty level.
Individual Income
School Tuition
Organization Tax
Credit
1997 None
100% up to $546 for
single and head of
household filers or
$1,092 for joint filers
in tax year 2017.
Individual
Income TaxNo 5 Years No
Students must be in
grades K–12 or be a
preschool enrollee
identified by the school
district as having a
disability under the
Individuals with Disabilities
Education Act or Section
504 of the Rehabilitation
Act.
Lexie's Law for
Disabled and
Displaced Students
Tax Credit Scholarship
Program
2009 $5 million
Credit is equal to
100% of the eligible
contribution.
Corporate
Income TaxNo 5 Years No
Students are eligible if they
(1) have a Multidisciplinary
Evaluation Team (MET) or
Individualized Education
Plan (IEP) from an Arizona
public school, (2) have a
504 plan from an Arizona
public school or (3) are now
or have ever been in the
Arizona foster care
system.
Arizona

42
Table 2 (continued) Scholarship Tax Credit Programs in Other States as of June 1, 2017
State Program Enacted
Annual
Program
Cap
Amount of Tax
Credit
Qualifying Tax
Types Refundable
Carry
Forward
State
Itemized
Deduction
Scholarship Recipient
Guidelines
Low-Income Corporate
Income Tax Credit
Scholarship Program
2006$20.736
million
Credit is equal to
100% of the eligible
contribution.
Corporate
Income TaxNo 5 Years No
At least 185% or below the
free and reduced-price
lunch income guidelines.
Additionally, students must
either be (1) enrolled in
private school kindergarten,
(2) enrolled in a private
preschool program for
students with disabilities,
(3) a public school enrollee
for at least 90 days in the
previous year or one full
semester of the current
school year, (4) a
dependent of an active-duty
member of the military
stationed in Arizona or (5)
a prior scholarship recipient
under this program or the
individual tax-credit
scholarship program.
Switcher Individual
Income School Tuition
Organization Tax
Credit*
2012 None
100% up to $543 for
single and head of
household filers or
$1,085 for joint filers
in tax year 2017.
Individual
Income TaxNo 5 Years No
Students must be in
grades K–12 and have
previously attended a
public school for at least a
full semester or 90 days or
be a preschool enrollee
identified by the school
district as having a
disability under the
Individuals with Disabilities
Education Act or Section
504 of the Rehabilitation
Act. Additionally, students
who are in kindergarten,
children of active military
members stationed in
Arizona and previous
recipients of a Low-Income
Corporate Income Tax
Credit Scholarship or
“Switcher” Individual
Income Tax Credit
Scholarship who have
remained in private school
are eligible.
Arizona
(continued)

43
Table 2 (continued) Scholarship Tax Credit Programs in Other States as of June 1, 2017
State Program Enacted
Annual
Program
Cap
Amount of Tax
Credit
Qualifying Tax
Types Refundable
Carry
Forward
State
Itemized
Deduction
Scholarship Recipient
Guidelines
FloridaTax Credit Scholarship
Program2001
$559.1 million
in FY 2017
and $698.9
million in FY
2018
Credit is equal to
100% of the eligible
contribution.
Corporate
Income Tax,
Insurance
Premium Tax,
Oil and Gas
Production Tax,
and Liquor,
Wine, and Malt
Beverage
Excise Tax
No 5 Years No
Students in households
earning less than 260% of
poverty are eligible for
scholarships. Students
who qualify under 200% of
poverty are eligible for full
scholarships worth $5,886.
Partial scholarships are
available with scholarship
values reduced by 12% to
50% if the student comes
from a household with an
income between 200% and
260% of the federal poverty
level. First priority is given
to renewal students and to
new students eligible for
the federal free and
reduced-price lunch
program. Eligibility also
opened to siblings of
current scholarship
recipients, as long as they
live in the same household,
and the income limit for
previous scholarship
recipients was removed.
Additionally, students
placed in foster care or out-
of-home care are now able
to apply for a scholarship
at any time.

44
Table 2 (continued) Scholarship Tax Credit Programs in Other States as of June 1, 2017
State Program Enacted
Annual
Program
Cap
Amount of Tax
Credit
Qualifying Tax
Types Refundable
Carry
Forward
State
Itemized
Deduction
Scholarship Recipient
Guidelines
GeorgiaQualified Education
Expense Tax Credit2008 $58 million
100% up to $1,000 for
single or head of
household filers and
$2,500 for married
filing a joint return.
The lesser of 75% of
a corporation or
trust's income tax
liability or the actual
amount donated.
Individual
Income Tax and
Corporate
Income Tax
No 5 Years
No, but can
take
deduction for
any portion
of a donation
that does
not receive a
credit.
All public school students
are eligible if they attended
a public school for at least
six weeks immediately
prior to receiving a
scholarship, as are
students enrolling in
prekindergarten,
kindergarten or first grade.
Eligibility continues until a
student graduates, reaches
age 20 or returns to public
school.
Illinois Invest in Kids Program 2017 $75 million
Credit is equal to 75%
of eligible
contributions. Credits
cannot exceed $1
million per taxpayer,
per year.
Individual
Income Tax and
Corporate
Income Tax
No 5 Years No
Students are eligible to
receive scholarships if their
family income does not
exceed 300 percent of the
federal poverty level . Once
a student has received a
scholarship, families may
earn up to 400 percent of
the federal poverty level for
the duration of the
scholarship or scholarship
renewal while retaining
eligibility. Students must
also (1) be eligible to
attend an Illinois public
elementary or high school
the semester prior to
receiving a scholarship or
be starting school in Illinois
for the first time and (2)
reside in the state.
IndianaSchool Scholarship
Tax Credit2009 $9.5 million
Credit is equal to
50% of eligible
contribution.
Individual
Income Tax and
Corporate
Income Tax
No No No
At least 200% below the
free and reduced-price
lunch income guidelines.
Children must be between
ages 5 and 22 to
participate. Current private
school students can
qualify.

45
Table 2 (continued) Scholarship Tax Credit Programs in Other States as of June 1, 2017
State Program Enacted
Annual
Program
Cap
Amount of Tax
Credit
Qualifying Tax
Types Refundable
Carry
Forward
State
Itemized
Deduction
Scholarship Recipient
Guidelines
Iowa
School Tuition
Organization Tax
Credit
2006 $12 million
Credit is equal to
65% of eligible
contribution.
Individual
Income Tax and
Corporate
Income Tax
No 5 Years NoLess than 300% of federal
poverty guidelines.
Kansas
Tax Credit for Low
Income Students
Scholarship Program
2014 $10 million
Credit is equal to
70% of eligible
contribution.
Corporate
Income TaxNo
Until
credits
can be
utilized
No
Children are eligible to
receive scholarships if their
family income does not
exceed 100% of the
guidelines needed to
qualify for the free lunch
program; they also must be
assigned to a Title 1 Focus
School or a Title 1 Priority
School (“Failing Schools”).
Children must be between
ages 5 and 21 to
participate. In addition,
children must have been
enrolled in any public
school the previous school
year, unless the child is
fewer than 6 years of age.
LouisianaTuition Donation
Rebate Program2012 None
Credit is equal to
100% of eligible
contribution.
Individual
Income Tax,
Corporate
Income Tax,
and Franchise
Tax
Yes No NoLess than 250% of federal
poverty guidelines.
Montana
Tax Credits for
Contributions to
Student Scholarship
Organizations
2015
$3 million in
2015-16 (the
limit
increases
10% each
year if the
cap is
reached)
Credit is equal to
100% of eligible
contribution up to
$150.
Individual
Income Tax and
Corporate
Income Tax
No No No
Students must be between
the ages of 5 and 18 and
live in Montana.

46
Table 2 (continued) Scholarship Tax Credit Programs in Other States as of June 1, 2017
State Program Enacted
Annual
Program
Cap
Amount of Tax
Credit
Qualifying Tax
Types Refundable
Carry
Forward
State
Itemized
Deduction
Scholarship Recipient
Guidelines
New
Hampshire
Education Tax Credit
Program2012 $5.1 million
Credit is equal to 85%
of eligible
contribution. One
taxpayer cannot
receive more than
10% of the aggregate
tax credits available.
Business
Profits Tax and
Business
Enterprise Tax
NoNot
availableNo
Less than 300% of federal
poverty guidelines. At least
40% of scholarships must
go to students eligible for
the federal free or reduced-
price lunch program.
Students must be between
the ages of 5 and 20.
NevadaEducational Choice
Scholarship Program2015 $26.05 million
Credit is equal to
100% of the eligible
contribution.
Modified
Business TaxNo No No
All students receiving
scholarships under this
program must come from
families whose household
incomes are at or below
300% of the federal poverty
line.
Oklahoma
Oklahoma Equal
Opportunity Education
Scholarships
2011
$3.5 million
($1.75 million
for individual
income tax
and $1.75
million for
corporate
income tax)
Credit is equal to 50%
of eligible contribution
(75% if the taxpayer
commits to the same
amount for two
consecutive years).
Up to $1,000 for
single taxpayers,
$2,000 for married
couples, and
$100,000 for
corporations.
Individual
Income Tax and
Corporate
Income Tax
No 3 Years No
Less than 300% of free and
reduced-price school
lunches or who attend or
live in the attendance zone
of a public school
designated as in need of
improvement. Once a
student has received a
scholarship, that student
and his or her siblings
remain eligible until high
school graduation or age
21.

47
Table 2 (continued) Scholarship Tax Credit Programs in Other States as of June 1, 2017
State Program Enacted
Annual
Program
Cap
Amount of Tax
Credit
Qualifying Tax
Types Refundable
Carry
Forward
State
Itemized
Deduction
Scholarship Recipient
Guidelines
Opportunity
Scholarship Tax Credit
Program
2012 $50 million
For donations to a
Educational
Opportunity
Organization the
credit is equal to 75%
of qualified
contribution (90% if
the taxpayer commits
to the same amount
for two consecutive
years). Credits per
taxpayer are limited
to $400,000 in the
first year, $750,000 in
the second year, and
is eliminated after
that.
Corporate Net
Income Tax,
Capital Stock
Franchise Tax,
Bank and Trust
Company
Shares Tax,
Title Insurance
Companies
Shares Tax,
Insurance
Premiums Tax,
and Mutual
Thrift
Institutions Tax.
Also Personal
Income Tax for
shareholders of
S corporations
or partnerships.
No No No
Eligible students must
reside within the attendace
boundaries of a low-
achieving school and
household income must be
below $75,000, plus
$15,000 for each
dependent in the
household. Additional
income adjustment can be
made for students with a
disability.
Educational
Improvement Tax
Credit Program
2001 $125 Million
For donations to a
Scholarship
Organization or an
Educational
Improvement
Organization the
credit is equal to 75%
of qualified
contribution (90% if
the taxpayer commits
to the same amount
for two consecutive
years). Credit is
limited to $750,000
each year per
taxpayer, however,
this cap will be lifted
from October 1
through November 30
if credits go
unclaimed.
Corporate Net
Income Tax,
Capital Stock
Franchise Tax,
Bank and Trust
Company
Shares Tax,
Title Insurance
Companies
Shares Tax,
Insurance
Premiums Tax,
and Mutual
Thrift
Institutions Tax.
Also Personal
Income Tax for
shareholders of
S corporations
or partnerships.
No No No
Household income must be
below $75,000, plus
$15,000 for each
dependent in the
household.
Pennsylvania

48
Table 2 (continued) Scholarship Tax Credit Programs in Other States as of June 1, 2017
State Program Enacted
Annual
Program
Cap
Amount of Tax
Credit
Qualifying Tax
Types Refundable
Carry
Forward
State
Itemized
Deduction
Scholarship Recipient
Guidelines
Rhode Island
Tax Credits for
Contributions to
Scholarship
Organizations
2006 $1.5 million
Credit is equal to 75%
of the qualified
contribution (90% if
the taxpayer commits
to donate for two
consecutive years
and the second year’s
donation is equal to at
least 80% of the first
year’s donation).
Donors are limited to
$100,000 in tax
credits each year.
Corporate
Income TaxNo No No
At or below 250% of federal
poverty guidelines.
South
Carolina
Educational Credit for
Exceptional Needs
Children
2013 $11 million
Credit is equal to
100% of eligible
contributions, but
taxpayer can only
claim tax credits up
to 60% of their tax
liability.
Individual
Income Tax and
Corporate
Income Tax
No Yes No
Students are eligible to
receive scholarships if they
have been designated by
the South Carolina
Department of Education
as meeting the federal
definition of a “child with a
disability”. Additionally, a
student’s parents must
believe the assigned public
school district does not
sufficiently meet the
student’s needs. Students
who have been diagnosed
within the last three years
as having a
neurodevelopmental
disorder; a substantial
sensory or physical
impairment or some other
disability or acute or
chronic condition that
significantly impedes the
student’s ability to learn
and succeed in school
without specialized
instructional and
associated supports and
services tailored to the
child’s unique needs are
eligible.

49
Table 2 (continued) Scholarship Tax Credit Programs in Other States as of June 1, 2017
State Program Enacted
Annual
Program
Cap
Amount of Tax
Credit
Qualifying Tax
Types Refundable
Carry
Forward
State
Itemized
Deduction
Scholarship Recipient
Guidelines
South
Dakota
Partners in Education
Tax Credit Program2016 $2 million
The credit is equal to
80% of eligible
contributions.
Insurance
Premium TaxNo No No
Students are eligible if they
live in families with
incomes up to, but not
exceeding, 150 percent of
the federal free and
reduced-price lunch (FRL)
program and either (1)
attended a public school
the preceding semester, (2)
is starting at a K–12 school
in South Dakota for the first
time or (3) is entering
kindergarten, first grade or
ninth grade. Once a
student has received a
scholarship, that student
remains eligible for three
years or, if the student is
entering high school, until
high school graduation
regardless of income. After
the initial period of income
eligibility, scholarship
students remain eligible if
their family income in the
prior year does not exceed
200 percent of the FRL
program.

50
Table 2 (continued) Scholarship Tax Credit Programs in Other States as of June 1, 2017
Sources: The Friedman Foundation for Educational Choice Web site: www.edchoice.org Various state Revenue Web sites
*Cannot claim this credit without making the maximum donation to the original STO credit.
State Program Enacted
Annual
Program
Cap
Amount of Tax
Credit
Qualifying Tax
Types Refundable
Carry
Forward
State
Itemized
Deduction
Scholarship Recipient
Guidelines
Virginia
Education Improvement
Scholarships Tax
Credits Program
2012 $25 million
The credit is equal to
65% of eligible
contributions. An
individual must donate
at least $500 and
may not donate more
than $125,000 per
year. There is no limit
on the size of
business donations.
Individual
Income Tax and
Corporate
Income Tax
No 5 Years No
Students must come from
households where family
income is less than 300
percent of the federal
poverty line; students with
special needs are also
eligible and have a higher
income limitation. Students
must either be enrollees in
grades K–1, a public
school student the previous
school year, a previous
scholarship recipient or a
new resident of Virginia.
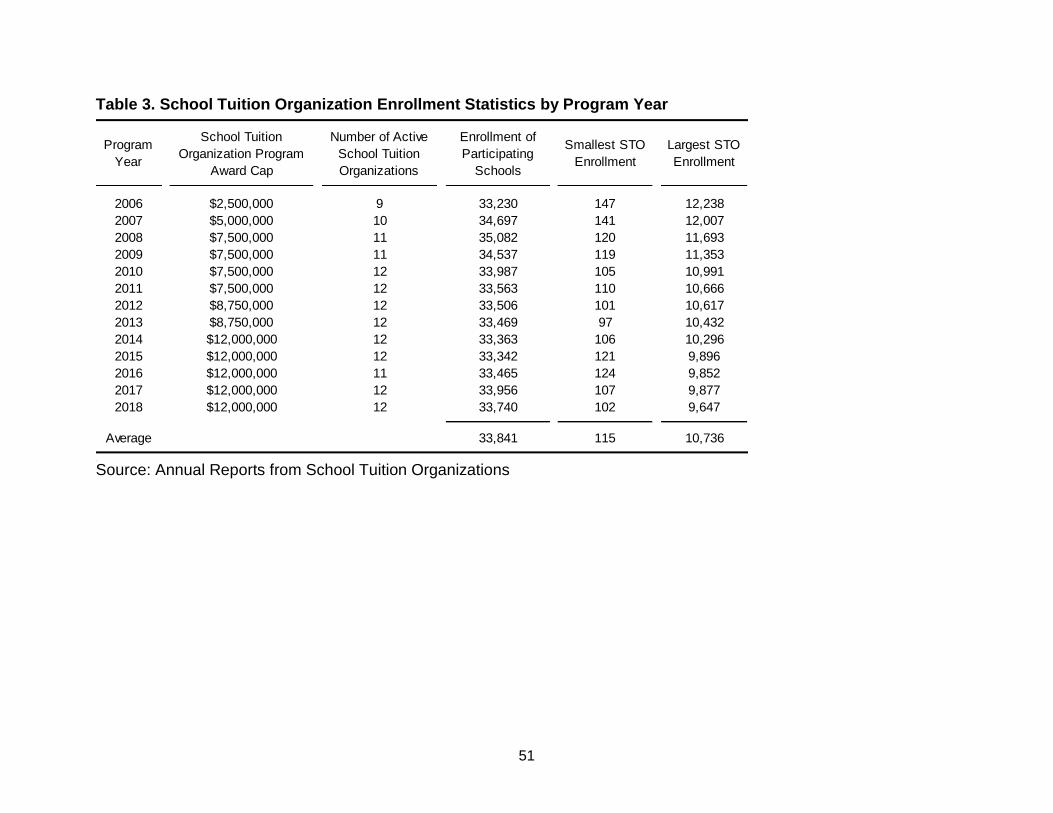
51
Table 3. School Tuition Organization Enrollment Statistics by Program Year
Source: Annual Reports from School Tuition Organizations
Program
Year
School Tuition
Organization Program
Award Cap
Number of Active
School Tuition
Organizations
Enrollment of
Participating
Schools
Smallest STO
Enrollment
Largest STO
Enrollment
2006 $2,500,000 9 33,230 147 12,238
2007 $5,000,000 10 34,697 141 12,007
2008 $7,500,000 11 35,082 120 11,693
2009 $7,500,000 11 34,537 119 11,353
2010 $7,500,000 12 33,987 105 10,991
2011 $7,500,000 12 33,563 110 10,666
2012 $8,750,000 12 33,506 101 10,617
2013 $8,750,000 12 33,469 97 10,432
2014 $12,000,000 12 33,363 106 10,296
2015 $12,000,000 12 33,342 121 9,896
2016 $12,000,000 11 33,465 124 9,852
2017 $12,000,000 12 33,956 107 9,877
2018 $12,000,000 12 33,740 102 9,647
Average 33,841 115 10,736

52
Table 4. School Tuition Organization Enrollment and Tuition Grant Statistics by Program Year
Source: Annual Reports from School Tuition Organizations * Only three school tuition organizations issued tuition grants in the 2006-2007 school year, most STOs waited until the second year of the program to start issuing tuition grants.
Program
Year
Number of
Active School
Tuition
Organizations
Enrollment of
STO Schools
Number of
Schools
Covered by
STOs
Average
Enrollment
Number of
Tuition Grants
Issued*
Amount of
Tuition Grants
Issued
Average
Tuition
Grant
2006 9 33,230 127 262 487 $296,867 $610
2007 10 34,697 137 253 7,527 $3,977,969 $528
2008 11 35,082 136 258 8,623 $7,369,576 $855
2009 11 34,537 136 254 9,411 $9,109,979 $968
2010 12 33,987 140 243 10,279 $10,938,484 $1,064
2011 12 33,563 140 240 10,600 $10,933,806 $1,031
2012 12 33,506 138 243 10,446 $11,326,286 $1,084
2013 12 33,469 138 243 10,388 $12,662,735 $1,219
2014 12 33,363 139 240 10,494 $13,505,269 $1,287
2015 12 33,342 140 238 10,848 $17,611,871 $1,624
2016 11 33,465 138 243 10,771 $17,046,608 $1,583
99,874 $114,779,450

53
Table 5. School Tuition Organization Tax Credit Award Statistics by Program Year
Source: Iowa Department of Revenue CACTAS database
Program
Year
Total
Contributions
Total Awards
Issued
Number of
Awards
Issued
Smallest
Award Issued
Largest
Award Issued
Average
Award Issued
Median
Award Issued
2006 $3,846,436 $2,499,904 1,125 $13 $113,750 $2,222 $650
2007 $7,439,827 $4,886,880 1,850 $10 $97,500 $2,642 $650
2008 $9,538,522 $6,200,378 2,830 $12 $97,500 $2,191 $650
2009 $11,394,228 $7,402,023 3,160 $13 $124,865 $2,342 $650
2010 $11,538,862 $7,499,992 3,029 $5 $113,750 $2,476 $650
2011 $11,536,961 $7,499,413 2,835 $10 $325,000 $2,645 $650
2012 $13,461,567 $8,749,061 3,103 $3 $266,500 $2,820 $650
2013 $13,461,507 $8,749,980 2,996 $7 $260,000 $2,921 $650
2014 $18,329,839 $11,997,890 3,708 $7 $260,000 $3,236 $975
2015 $18,461,535 $12,000,000 3,396 $4 $130,000 $3,534 $975
2016 $18,461,534 $12,000,000 3,484 $7 $195,000 $3,444 $976
Total $137,470,819 $89,485,521 31,516 $3 $325,000 $2,839 $650

54
Table 6. School Tuition Organization Tax Credit Claims by Tax Year
Source: Iowa Department of Revenue CACTAS database * Not all tax credit claims for this tax year have been reviewed.
Tax Year
Amount of Claims
Carried Forward from
Prior Year
Amount of
New Tax
Credits
Total Amount
of Tax Credits
Available
Amount of
Tax Credits
Claimed
Amount of
Tax Credits
Expired
Amount of Tax Credits
Carried Forward to Next
Tax Year
2006 $0 $2,462,998 $2,462,998 $2,225,442 $0 $255,631
2007 $241,877 $4,851,137 $5,093,014 $4,498,181 $0 $596,131
2008 $574,279 $6,118,398 $6,692,677 $5,631,723 $0 $1,068,358
2009 $1,018,055 $7,324,252 $8,342,307 $6,888,984 $0 $1,458,279
2010 $1,391,754 $7,460,163 $8,851,917 $7,263,222 $0 $1,590,968
2011 $1,533,560 $7,514,134 $9,047,694 $6,714,221 $10,007 $2,330,495
2012 $2,071,904 $8,709,958 $10,781,992 $8,437,169 $35,953 $2,316,716
2013 $2,183,578 $8,581,834 $10,765,412 $8,239,660 $63,606 $2,495,508
2014 $2,406,958 $11,835,424 $14,244,032 $11,247,049 $79,063 $2,946,855
2015* $2,223,028 $11,242,266 $13,464,186 $10,788,441 $141,375 $2,535,677
2016* $2,298,443 $11,306,007 $13,603,995 $10,717,803 $35,039 $2,849,270
Total $82,651,895 $365,043
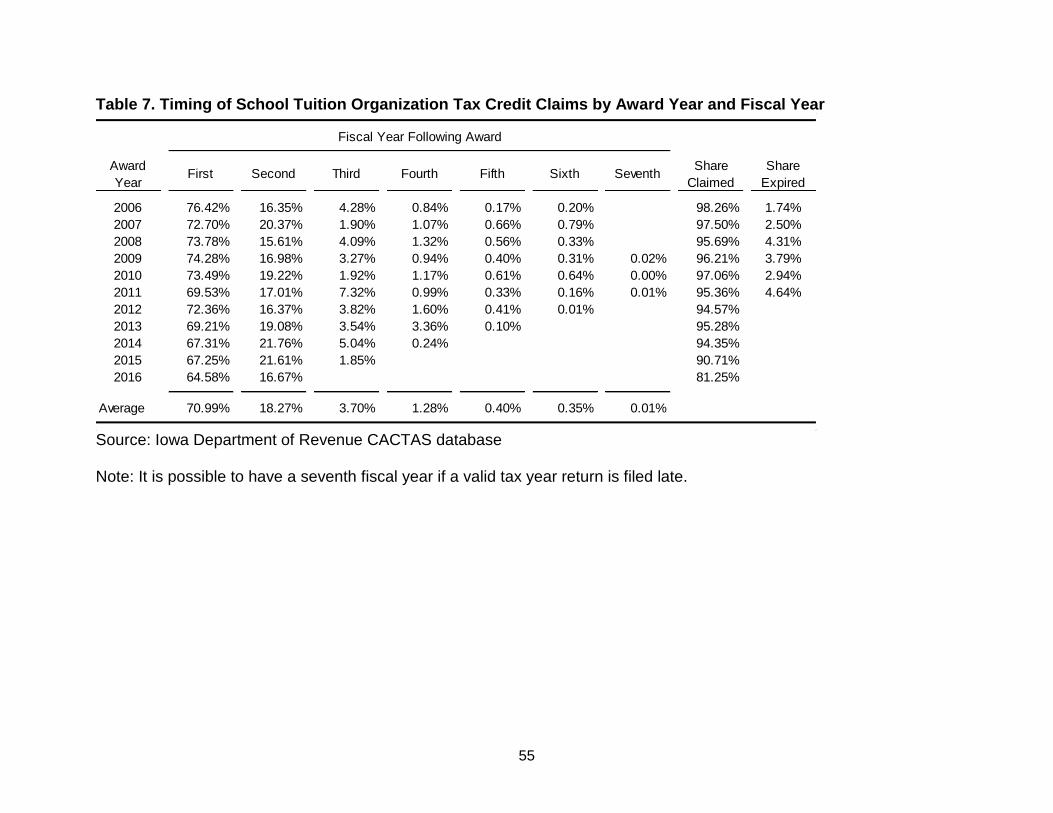
55
Table 7. Timing of School Tuition Organization Tax Credit Claims by Award Year and Fiscal Year
Source: Iowa Department of Revenue CACTAS database Note: It is possible to have a seventh fiscal year if a valid tax year return is filed late.
Award
YearFirst Second Third Fourth Fifth Sixth Seventh
Share
Claimed
Share
Expired
2006 76.42% 16.35% 4.28% 0.84% 0.17% 0.20% 98.26% 1.74%
2007 72.70% 20.37% 1.90% 1.07% 0.66% 0.79% 97.50% 2.50%
2008 73.78% 15.61% 4.09% 1.32% 0.56% 0.33% 95.69% 4.31%
2009 74.28% 16.98% 3.27% 0.94% 0.40% 0.31% 0.02% 96.21% 3.79%
2010 73.49% 19.22% 1.92% 1.17% 0.61% 0.64% 0.00% 97.06% 2.94%
2011 69.53% 17.01% 7.32% 0.99% 0.33% 0.16% 0.01% 95.36% 4.64%
2012 72.36% 16.37% 3.82% 1.60% 0.41% 0.01% 94.57%
2013 69.21% 19.08% 3.54% 3.36% 0.10% 95.28%
2014 67.31% 21.76% 5.04% 0.24% 94.35%
2015 67.25% 21.61% 1.85% 90.71%
2016 64.58% 16.67% 81.25%
Average 70.99% 18.27% 3.70% 1.28% 0.40% 0.35% 0.01%
Fiscal Year Following Award

56
Table 8. Overview of Tuition Grant STO-Reported Student-Level Data File
Source: Iowa Department of Revenue analysis of School Tuition Organization data. Table 9. Private School Tuition as Reported in Student-Level Data File by School Year
Source: Iowa Department of Revenue analysis of School Tuition Organization data Note: Average tuition is calculated on a student-weighted basis; i.e., it represents the average among students in the file and not necessarily the average tuition price among represented schools.
School
Year
Number of
School Tuition
Organizations
Number of
Schools Covered
by STOs
Number of
Tuition
Grants
Issued
Number of
STOs reporting
Student-Level
Data
Number
of
Schools
Number of
Tuition
Grants
Share of STO-
Covered Schools
in File
Share of Total
Tuition Grants in
File
2012-2013 12 138 10,446 5 73 5,564 52.9% 53.3%
2013-2014 12 138 10,388 5 69 5,069 50.0% 48.8%
2014-2015 12 139 10,494 6 82 5,929 59.0% 56.5%
2015-2016 12 140 10,848 7 90 6,755 64.3% 62.3%
2016-2017 11 138 10,771 7 98 7,152 71.0% 66.4%
Total 52,947 30,469 57.5%
STO-Reported Student-Level DataTax Credit Program Administrative Data
2012-2013 2013-2014 2014-2015 2015-2016 2016-2017
Tuition
Average $2,710 $2,871 $3,226 $3,307 $3,658
Minimum $591 $846 $295 $205 $226
Maximum $20,050 $15,900 $16,900 $18,700 $24,400
School Year

57
Table 10. Income, Financial Aid Need, and Tuition Grant Amounts for Tuition Grant Recipients
Source: Iowa Department of Revenue analysis of School Tuition Organization data * The data in this table concerns only those tuition grant recipients for whom STOs provided complete data regarding household income, financial aid need, and tuition grant amount.
2012-2013 2013-2014 2014-2015 2015-2016 2016-2017
Tuition Grant Recipients* 5,128 4,585 4,557 5,352 5,211
Family Income
Average $44,323 $44,896 $44,340 $44,322 $43,897
Minimum -$122,961 -$58,639 -$274,744 -$259,970 -$271,365
Lower Quartile $25,024 $25,914 $25,069 $25,441 $25,366
Median $43,075 $44,176 $43,384 $43,019 $43,208
Upper Quartile $62,621 $63,375 $62,839 $62,440 $61,841
Maximum $144,936 $123,148 $122,134 $155,093 $144,006
Financial Aid Need
Average $1,791 $1,946 $2,027 $2,170 $2,253
Minimum $0 $0 $0 $0 $0
Lower Quartile $321 $575 $602 $869 $878
Median $1,742 $1,865 $2,007 $2,155 $2,220
Upper Quartile $2,500 $2,646 $2,750 $2,875 $2,975
Maximum $7,195 $6,674 $6,984 $10,635 $8,540
Amount of Tuition Grant
Average $1,256 $1,356 $1,379 $1,811 $1,801
Minimum $55 $105 $8 $95 $100
Lower Quartile $250 $337 $328 $686 $620
Median $1,207 $1,283 $1,261 $1,663 $1,672
Upper Quartile $1,688 $1,828 $1,935 $2,381 $2,432
Maximum $5,324 $5,320 $5,415 $5,750 $5,664
Percent of Need Met by Tuition Grant
Average 69% 68% 67% 75% 79%
Minimum 7% 8% 1% 16% 7%
Lower Quartile 58% 54% 52% 64% 62%
Median 73% 65% 63% 74% 78%
Upper Quartile 86% 86% 86% 95% 95%
Maximum 100% 100% 100% 100% 100%
Percent of Tuition Met by Tuition Grant
Average 48% 49% 48% 61% 58%
Minimum 5% 5% 2% 2% 3%
Lower Quartile 18% 18% 19% 34% 31%
Median 48% 50% 48% 65% 61%
Upper Quartile 73% 77% 68% 90% 78%
Maximum 100% 100% 100% 100% 100%

58
Figure 1. Percent of Financial Aid Need Met by Tuition Grants, by Family Income, School Years 2012-13 through 2016-17 Combined
Source: Iowa Department of Revenue analysis of School Tuition Organization data Income is expressed in current year (non-inflation-adjusted) dollars. The chart excludes families with $0 need.
N=642
N=3,407 N=6,528
N=5,390N=3,235
N=865
N=132
N=16
0%
10%
20%
30%
40%
50%
60%
70%
80%
90%
100%
$0 orless
$1 -$20K
$20K -$40K
$40K -$60K
$60K -$80K
$80K -$100K
$100K -$120K
Greaterthan
$120K
Percent of Need Met by Tuition Grant
Annual Family Income

59
Table 11. Distribution of Tuition Grants and Financial Aid Need by Family Income, School Years 2012-13 through 2016-17 Combined
Source: Iowa Department of Revenue analysis of School Tuition Organization data Note: Income is expressed in current year (non-inflation-adjusted) dollars.
Family Income Group
Number of Tuition
Grants
Share of
Tuition
Grants
Financial Aid
Need
Share of
Financial Aid
Need
Amount of Tuition
Grant
Share of
Tuition Grant
Amount
$0 or less 776 3.1% $1,586,599 3.1% $1,385,584 3.6%
$1 - $20,000 3,534 14.2% $9,985,380 19.7% $7,368,907 19.4%
$20,000 - $40,000 6,928 27.9% $18,049,085 35.6% $13,479,369 35.5%
$40,000 - $60,000 6,589 26.5% $12,834,203 25.3% $9,523,175 25.1%
$60,000 - $80,000 5,205 21.0% $6,414,502 12.7% $4,925,426 13.0%
$80,000 - $100,000 1,530 6.2% $1,549,321 3.1% $1,145,068 3.0%
$100,000 - $120,000 230 0.9% $252,598 0.5% $160,736 0.4%
Greater than $120,000 41 0.2% $25,232 0.0% $28,161 0.1%
Total 24,833 100.0% $50,696,920 100.0% $38,016,426 100.0%
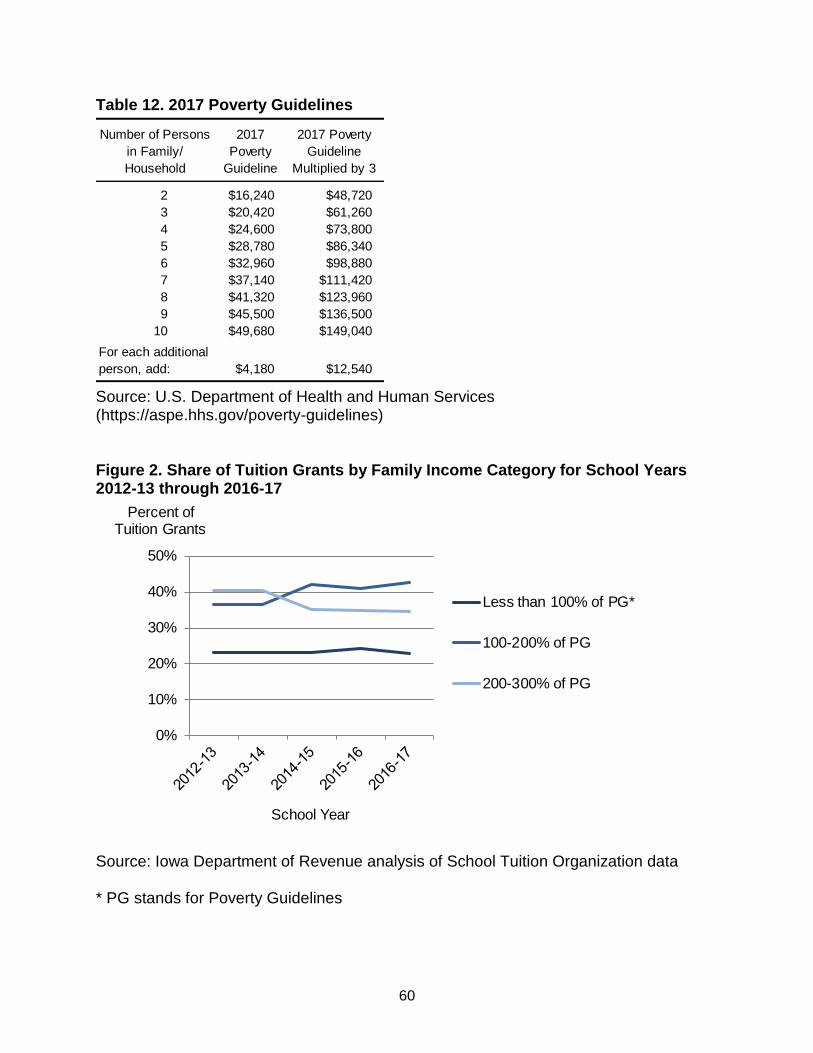
60
Table 12. 2017 Poverty Guidelines
Source: U.S. Department of Health and Human Services (https://aspe.hhs.gov/poverty-guidelines) Figure 2. Share of Tuition Grants by Family Income Category for School Years 2012-13 through 2016-17
Source: Iowa Department of Revenue analysis of School Tuition Organization data * PG stands for Poverty Guidelines
Number of Persons
in Family/
Household
2017
Poverty
Guideline
2017 Poverty
Guideline
Multiplied by 3
2 $16,240 $48,720
3 $20,420 $61,260
4 $24,600 $73,800
5 $28,780 $86,340
6 $32,960 $98,880
7 $37,140 $111,420
8 $41,320 $123,960
9 $45,500 $136,500
10 $49,680 $149,040
For each additional
person, add: $4,180 $12,540
0%
10%
20%
30%
40%
50%
Less than 100% of PG*
100-200% of PG
200-300% of PG
Percent of Tuition Grants
School Year

61
Figure 3. Share of Tuition Grant Dollars by Family Income Category for School Years 2012-13 through 2016-17
Source: Iowa Department of Revenue analysis of School Tuition Organization data * PG stands for Poverty Guidelines
0%
10%
20%
30%
40%
50%
Less than 100% of PG*
100-200% of PG
200-300% of PG
Percent of Tuition Grant Dollars
School Year

62
Figure 4. Average Tuition Grant by Family Income Category for School Years 2012-13 through 2016-17
Source: Iowa Department of Revenue analysis of School Tuition Organization data * PG stands for Poverty Guidelines
$-
$500
$1,000
$1,500
$2,000
$2,500
Less than 100% of PG*
100-200% of PG
200-300% of PG
Average Amount of Tuition Grant
School Year

63
Figure 5. Income Distribution of All Iowa Families and Tuition Grant Recipients
Source: Iowa Department of Revenue analysis of School Tuition Organization data and U.S. Census American Community Survey (ACS) Public Use Microdata Sample (PUMS) 2011-2015 5-Year Estimates
0%
5%
10%
15%
20%
25%
30% Tuition Grant Recipient Families(2012-2016)
Iowa Families With Children inPrivate K-12 School
All Iowa Families
Percent of Families
Annual Income (2015 Constant Dollars)

64
Table 13. Percentiles of Family Income, Need, and Tuition Grant Amounts in School Years 2012-13 through 2016-17 Combined
Source: Iowa Department of Revenue analysis of School Tuition Organization data * Includes families with positive income only. ** Excludes families with zero need. Note: The data in this table concerns tuition grant recipients only; excludes students for which reported full tuition is less than $500.
Percentile
Tuition as
Percentage of Family
Income*
Need
as Percentage of
Full Tuition
Percent of Need
Met by
Tuition Grant**
Percent of
Full Tuition Met by
Tuition Grant
99th 91.6% 100.0% 100.0% 95.0%
90th 19.6% 100.0% 95.0% 95.0%
80th 12.6% 100.0% 95.0% 86.0%
70th 9.5% 100.0% 86.0% 72.4%
60th 7.5% 100.0% 79.0% 61.7%
50th 6.1% 88.5% 73.0% 56.2%
40th 5.0% 69.0% 64.9% 45.1%
30th 4.1% 44.5% 58.4% 30.1%
20th 3.4% 7.7% 54.0% 20.0%
10th 2.5% 0.0% 44.8% 14.3%
Generally
lower
income
Generally
higher
income

65
Table 14. Estimated Net Fiscal Impact of the STO Tax Credit
Source: Iowa Department of Revenue analysis of School Tuition Organization data * The public schooling cost per pupil is the regular program cost plus State categorical supplements.
School
Year
Cost of STO
Tax Credit
Number of
Tuition Grants
Average Tax
Credit Award
per Tuition
Grant
Public
Schooling
Cost per
Pupil*
Number of Tuition
Grants
x
Public Schooling
Cost per Pupil
Assumed
Substitution
Rate
Estimated Public
School Cost
Associated with
Substitution
Estimated Net
Fiscal Impact
Estimated
Breakeven
Substitution
Rate
2007-08 $2,499,904 7,527 $332 $5,708 $42,962,310 30.0% $12,888,693 $10,388,789 5.8%
2008-09 $4,886,880 8,623 $567 $6,074 $52,379,982 30.0% $15,713,995 $10,827,115 9.3%
2009-10 $6,200,378 9,411 $659 $6,383 $60,067,590 30.0% $18,020,277 $11,819,899 10.3%
2010-11 $7,402,023 10,279 $720 $6,510 $66,916,290 30.0% $20,074,887 $12,672,864 11.1%
2011-12 $7,499,992 10,600 $708 $6,510 $69,006,000 30.0% $20,701,800 $13,201,808 10.9%
2012-13 $7,499,413 10,446 $718 $6,641 $69,367,081 30.0% $20,810,124 $13,310,711 10.8%
2013-14 $8,749,061 10,388 $842 $6,773 $70,361,352 30.0% $21,108,406 $12,359,345 12.4%
2014-15 $8,749,980 10,494 $834 $7,044 $73,924,143 30.0% $22,177,243 $13,427,263 11.8%
2015-16 $11,997,890 10,848 $1,106 $7,133 $77,377,808 30.0% $23,213,342 $11,215,452 15.5%
2016-17 $12,000,000 10,771 $1,114 $7,613 $82,000,592 30.0% $24,600,178 $12,600,178 14.6%

66
Table 15. Estimated Amount of Financial Aid Need Met Under Alternative Program Caps (2016-17 School Year)
Source: Iowa Department of Revenue analysis of School Tuition Organization data * Estimate assumes that the program cap is fully subscribed. ** The estimated public school cost associated with substitution reflects the assumption that 30 percent of tuition grant recipients in 2016-17 would have attended public school if not for the tuition grant they received.
Estimated Total
Financial Aid Need of
Tuition Grant
Recipients in
2016-17
($ Millions)
Targeted Percentage
of Need To be Met
Under Alternative
Program Cap
Estimated Amount of
Need Met Under
Alternative Program
Cap* at Targeted
Percentage
($ Millions)
Alternative Program
Cap Necessary
to Meet Targeted
Percentage of Need
($ Millions)
Estimated Public
School Cost
Associated with
Substitution**
in 2016-17
($ Millions)
Estimated Net Fiscal
Impact under
Alternative Program
Cap
in 2016-17
($ Millions)
$24.8 69% $17.1 $12.0 $24.6 $12.6
$24.8 70% $17.3 $12.2 $24.6 $12.4
$24.8 80% $19.8 $13.9 $24.6 $10.7
$24.8 90% $22.3 $15.7 $24.6 $8.9
$24.8 100% $24.8 $17.4 $24.6 $7.2