iowa’s re-envisioned economic development roadmap · iowa’s re-envisioned economic development...
TRANSCRIPT
Iowa’s Re-Envisioned Economic Development Roadmap
Prepared by:
Battelle Technology Partnership Practice
December 2014

Battelle is the world’s largest nonprofit independent research and development organization,
providing innovative solutions to the world’s most pressing needs through its four global
businesses: Laboratory Management, National Security, Energy, Environment and Material
Sciences, and Health and Life Sciences. It advances scientific discovery and application by
conducting approximately $5 billion in global R&D annually through contract research,
laboratory management and technology commercialization. Battelle’s Technology Partnership
Practice (TPP) assists local, state, and regional organizations, universities, nonprofit
technology organizations, and others in designing, implementing, and assessing technology‐
based economic development programs. For more information on TPP, please contact Mitch
Horowitz, Vice President and Managing Director, at [email protected].
Battelle Memorial Institute (Battelle) does not endorse or recommend particular companies,
products, services, or technologies nor does it endorse or recommend financial investments
and/or the purchase or sale of securities. Battelle makes no warranty or guarantee, express or
implied, including without limitation, warranties of fitness for a particular purpose or
merchantability, for any report, service, data or other information provided herein.
Copyright 2014 Battelle Memorial Institute. Use, duplication, or distribution of this document
or any part thereof is prohibited without the written permission of Battelle Memorial
Institute. Unauthorized use may violate the copyright laws and result in civil and/or criminal
penalties.

| P a g e i
TABLE OF CONTENTS
Page
List of Acronyms and Short Forms ............................................................................................................... iv
Forward ......................................................................................................................................................... 1
Charge From the Iowa Partnership for Economic Progress .......................................................................... 4
The Context: Advancing a Strategic Framework for Economic Development in the 21st Century ............... 7
What Are the Appropriate Measures of Economic Success? ................................................................. 10
What Are the Industry clusters Generating Economic Success in Iowa? ................................................ 11
What Are the Economic Program Activities Needed in Iowa? ............................................................... 15
What Are the Critical Development resources in Iowa for Industry Clusters? ....................................... 17
Key Findings on Iowa’s Economic Performance and Implications for Future Development ...................... 19
Key Findings: Iowa’s Economic Progress Over the Last Decade ............................................................. 21
Key Findings: The Performance of Industry Clusters Driving Iowa’s Economy ....................................... 25
Key Findings on Iowa’s Economic Foundations ...................................................................................... 32
Key Findings: Skilled Workforce Development & Broader Population Dynamics .............................. 32
Key Findings: Innovation and Entrepreneurial Culture ....................................................................... 39
Key Findings: Physical Infrastructure .................................................................................................. 43
Key Findings: Business Climate ........................................................................................................... 45
Strategic Priorities for Advancing Iowa’s Economy .................................................................................... 47
From Strategies to Actions .......................................................................................................................... 49
Proposed Action Plan to Build on the Competitiveness and Growth of Iowa’s Industry Clusters through
Innovation, Retention and Attraction ..................................................................................................... 51
Proposed Action Plan to Generate and Attract Skilled Workforce in Demand by Iowa’s Businesses .... 56
Proposed Action Plan to Accelerate the Development of Iowa’s Emerging Entrepreneurial Eco‐System
................................................................................................................................................................ 61
Proposed Action Plan to Advance Iowa’s Physical Infrastructure and Regional Development Capacities
to Realize Iowa’s Economic Potential ..................................................................................................... 67
Appendix A: Line of Sight to Iowa’s Industry Growth Opportunities .......................................................... 73

| P a g e ii
LIST OF TABLES
Page
Table 1: Listing of Twelve Distinct Industry Clusters Driving Iowa’s Economy. .................................... 13
Table 2: Summary of Results of Analysis of Economic Performance of Key Industry Clusters. ............ 30
Table 3: Middle‐ and High‐Skilled Occupations and Job Growth Relative to the U.S., 2004–
2013. ........................................................................................................................................ 33
Table 4: STEM‐related Postsecondary Degree Graduates from Iowa Institutions, 2009–2012. .......... 35
Table 5: Postsecondary STEM‐related Degree Metrics for Iowa vs. U.S. and Key Comparison
States. ...................................................................................................................................... 35
Table 6: Achievement in Math and Science for Iowa 8th Graders vs. U.S. and Key Comparison
States. ...................................................................................................................................... 36
Table 7: Iowa’s Standing in Growth and Relative Level of Industry and University R&D Activities
vs. U.S. and Key Comparison States. ....................................................................................... 39
Table 8: Iowa’s Standing in Statewide Technology Transfer Performance Across All Research
Universities, Compared to other Midwestern States, Normalized by Size of State
University Research Base, 2012. ............................................................................................. 40
Table 9: Iowa’s Standing in Statewide Entrepreneurial and New Company Formation and
Growth Measures vs. U.S. and Key Comparison States. ......................................................... 41
Table 10: Iowa’s Standing in Statewide Levels of Innovation Capital vs. U.S. and Key Comparison
States. ...................................................................................................................................... 42
Table 11: Innovation Activities of Iowa’s Industry Clusters. ................................................................... 42
Table 12: Iowa’s Standing in Freight Transportation System vs. U.S. and Key Comparison States. ....... 43
Table 13: Iowa Industry Cluster Employer Insights into Business Climate Factors, Synchronist
Site Visits, 2011–2013. ............................................................................................................ 46
Table 14: Selected Business Cost Components for Iowa vs. U.S. and Key Comparison States. .............. 46
LIST OF FIGURES
Page
Figure 1: Strategic Framework and Key Elements for Economic Development in Iowa. ......................... 9
Figure 2: Comparison of Iowa and U.S. Growth in Economic Output (Real Gross Domestic
Product), 2007–2013. .............................................................................................................. 22
Figure 3: Comparison of Iowa and U.S. Growth in Total Employment, 2007–2013. ............................. 22
Figure 4: Comparison of Iowa and U.S. Growth in Employment by High‐, Middle‐, and Low‐
Skilled Workforce, 2004–2013. ............................................................................................... 23
Figure 5: Trends in Average Wages in Private Sector Industries, Iowa and U.S., 2007–2013................ 23
Figure 6: Per Capita Income Levels, Iowa and U.S., 2001–2013. ........................................................... 24
Figure 7: National Employment Projections for Iowa’s Industry Clusters, Average Annual Job
Growth for 2012–2022. ........................................................................................................... 28

| P a g e iii
Figure 8: National Employment Projections for Iowa’s Industry Clusters, Average Annual Job
Growth for 2012–2022. ........................................................................................................... 28
Figure 9: Identifying Iowa’s Growth Opportunities based on Target Product Markets and State
Core. ........................................................................................................................................ 29
Figure 10: Educational Attainment of the Population Ages 25 and Over, 2012. ..................................... 34
Figure 11: Domestic In‐ and Out‐Migration of College Educated Population Ages 25 to 54, 2007
to 2012. ................................................................................................................................... 36
Figure 12: Population Changes by Age, Iowa and U.S., 2000–2012. ........................................................ 37
Figure 13: Population Changes for Iowa’s High‐Growth Regions, 2000–2012. ....................................... 38
Figure 14: How Innovation and Entrepreneurial Culture Connect with Growing Industry Clusters. ....... 39
Figure 15: Summary of Recommended Tactics and Strategic Directions ................................................ 50
Figure A‐1: Line of Sight to Iowa’s Growth Opportunities ......................................................................... 74

| P a g e iv
LIST OF ACRONYMS AND SHORT FORMS
BEST Business Expansion and Strategic Trends
BLS Bureau of Labor Statistics
GDP gross domestic product
GOALI Grant Opportunities for Academic Liaison
I‐AM Iowa‐Advanced Manufacturing
IDOT Iowa Department of Transportation
IEDA Iowa Economic Development Authority
IIC Iowa Innovation Corporation
IMF International Monetary Fund
IPEP Iowa Partnership for Economic Progress
ISU Iowa State University
IWD Iowa Workforce Development
JPEC John Pappajohn Entrepreneurial Centers
NACE National Association of Colleges and Employers
NAICS North American Industry Classification System
ONAMI Oregon Nanoscience and Microtechnologies Institute
OSU Oregon State University
PNNL Pacific Northwest National Laboratory
PPP Public‐Private Partnership
QCEW Quarterly Census of Employment and Wages
RUTF Road Use Tax Fund
SBA Small Business Administration
SBCTC State Board for Community and Technical Colleges
SBDC Small Business Development Center
SBIR Small Business Innovation Research
STEM science, technology, engineering and math
TPP Technology Partnership Practice
VIC Virtual Incubator Company
WIA Workforce Investment Act
| P a g e 1
FORWARD
PROPELLING IOWA TO THE NEXT LEVEL OF ECONOMIC SUCCESS: KEY THEMES OF IOWA’S
RE‐ENVISIONED ECONOMIC DEVELOPMENT ROADMAP
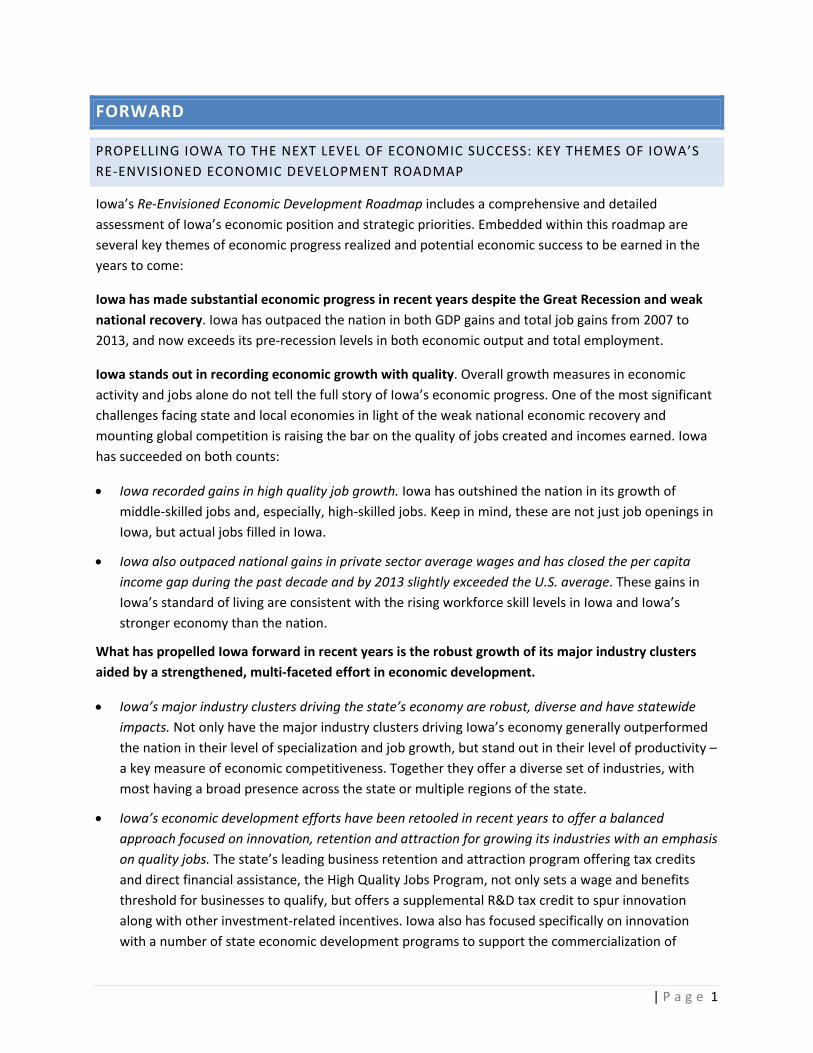
Iowa’s Re‐Envisioned Economic Development Roadmap includes a comprehensive and detailed
assessment of Iowa’s economic position and strategic priorities. Embedded within this roadmap are
several key themes of economic progress realized and potential economic success to be earned in the
years to come:
Iowa has made substantial economic progress in recent years despite the Great Recession and weak
national recovery. Iowa has outpaced the nation in both GDP gains and total job gains from 2007 to
2013, and now exceeds its pre‐recession levels in both economic output and total employment.
Iowa stands out in recording economic growth with quality. Overall growth measures in economic
activity and jobs alone do not tell the full story of Iowa’s economic progress. One of the most significant
challenges facing state and local economies in light of the weak national economic recovery and
mounting global competition is raising the bar on the quality of jobs created and incomes earned. Iowa
has succeeded on both counts:
Iowa recorded gains in high quality job growth. Iowa has outshined the nation in its growth of
middle‐skilled jobs and, especially, high‐skilled jobs. Keep in mind, these are not just job openings in
Iowa, but actual jobs filled in Iowa.
Iowa also outpaced national gains in private sector average wages and has closed the per capita
income gap during the past decade and by 2013 slightly exceeded the U.S. average. These gains in
Iowa’s standard of living are consistent with the rising workforce skill levels in Iowa and Iowa’s
stronger economy than the nation.
What has propelled Iowa forward in recent years is the robust growth of its major industry clusters
aided by a strengthened, multi‐faceted effort in economic development.
Iowa’s major industry clusters driving the state’s economy are robust, diverse and have statewide
impacts. Not only have the major industry clusters driving Iowa’s economy generally outperformed
the nation in their level of specialization and job growth, but stand out in their level of productivity –
a key measure of economic competitiveness. Together they offer a diverse set of industries, with
most having a broad presence across the state or multiple regions of the state.
Iowa’s economic development efforts have been retooled in recent years to offer a balanced
approach focused on innovation, retention and attraction for growing its industries with an emphasis
on quality jobs. The state’s leading business retention and attraction program offering tax credits
and direct financial assistance, the High Quality Jobs Program, not only sets a wage and benefits
threshold for businesses to qualify, but offers a supplemental R&D tax credit to spur innovation
along with other investment‐related incentives. Iowa also has focused specifically on innovation
with a number of state economic development programs to support the commercialization of
| P a g e 2
technologies by small and medium sized companies and support new firm formation. These state‐
level efforts for innovation complement those underway at Iowa’s colleges and universities as well
as among local economic development programs to further Iowa’s entrepreneurial support
infrastructure. Iowa also has placed a strong emphasis on STEM education – with tangible results in
the fast growth of STEM degrees at the post‐secondary level ‐‐ along with discrete actions to
strengthen connections between Iowa’s future workforce and industry through internships,
apprenticeships and increased technical education.
Propelling Iowa to the next level – to be among the most economically successful states in the nation
– is the goal of Iowa’s re‐envisioned economic development roadmap. Iowa’s strong trends in the level
of its performance on quality jobs and incomes earned still leaves it outside the top states in the level of
its performance. In quality jobs, Iowa is a national leader in its level of middle‐skilled jobs but not high‐
skilled jobs, where Iowa is slightly behind the U.S. average. Similarly, in per capita income Iowa ranked
only 23rd in the nation and in the level of average private sector wages Iowa is still behind the national
average.
There are strong headwinds that Iowa must address if it is to sustain its economic momentum and
reach the ranks of America’s most successful state economies.
Iowa must overcome the slower growth projected for its major industry clusters at the national
level and continue to outperform the nation to sustain significant economic growth.
Iowa can also expect that the fast pace of technological change and the growing competitive
strength of developing nations will continue to raise the bar for achieving economic success.
Continual improvements in Iowa’s economic development programs will be important, but not sufficient
to propel Iowa to the next level of reaching the top ranks of America’s most successful state economies.
It is critical that Iowa also pursue new strategic directions for working with its industry clusters,
universities and workers and their families to compete for growth, including:
Develop focused policy initiatives that capture the most promising emerging growth
opportunities. Through industry‐led consortiums, Iowa should focus on emerging growth
opportunities tied to tangible results in positioning Iowa as a leader in research and
commercialization, specialized workforce development and attraction of new investment to
Iowa. Iowa needs a replicable approach involving clear competitive selection criteria by which it can
identify promising opportunities. Potential opportunities have been identified across Iowa’s major
industry clusters in bio‐based products; precision agriculture; next‐generation big data applications
for health, food and finance; energy efficiency; and advanced materials and manufacturing
technologies, among other emerging growth opportunities.
Create a K‐20 industry‐driven career development partnership with the education community. To
provide Iowa with a robust and predictable workforce pipeline in demand by Iowa businesses
requires a systematic and pro‐active industry‐driven career development partnership with K‐20
education. The partnership must focus on and improve upon the transitions of students into middle‐

| P a g e 3
and high‐skill career opportunities through workplace learning from technical education and
apprenticeships (for middle‐skills jobs) to increased capacity of colleges and universities to provide
career awareness, experiential learning and connections to Iowa employers (for high‐skill jobs), as
well as retraining opportunities for recent graduates who were not well‐served in the past to gain
the skills to compete for career opportunities.
Establish new approaches for investing in Iowa’s physical infrastructure needs for broadband
speed/reliability and improved transportation network that ensures Iowa’s continued capacity to
grow. Key steps including setting out comprehensive incentives for broadband development,
prioritizing critical public investments in transportation (including taking traffic off the roads through
improved short haul rail/intermodal development) and recognizing the need for innovative
financing, such as public‐private partnerships, since public funds are not sufficient to address all
needs.
Facilitate the transfer of university research and development to industry startups. The size and
quality of Iowa’s university and federal lab research base is sufficient to generate increased levels of
high quality technology‐based startups, but Iowa’s entrepreneurial culture simply does not match
that of East and West Coast locations. Rather than replicating many of the value‐added services that
are the focus of existing and planned activities of the Iowa Innovation Corporation for
entrepreneurial mentoring, improved due‐diligence and commercialization assistance, Iowa has an
opportunity to more directly advance high quality startups from university research by leveraging
the capabilities of serial entrepreneurs to lead venture development corporations. These venture
development organizations will not only collaborate with universities to identify, assess, and
validate university research discoveries able to support new business ventures, but would have the
capacity to actually launch the new companies and serve as the management team leading the new
start‐up in its initial product development phase, including raising initial angel and product
development capital. As the new startup reaches key development milestones, then the serial
entrepreneur leading the venture development corporation can recruit permanent management for
the advancing the new business.
Bringing together these more systematic efforts with continued improvements to existing programs will
lead Iowa to advancing a next‐generation economic development system that can sustain its economic
momentum and propel its economy to the next level.

| P a g e 4
CHARGE FROM THE IOWA PARTNERSHIP FOR ECONOMIC PROGRESS
“Now is not the time to shy away from the challenges and the opportunities. Now is the time
to embrace them, to be bold, to move Iowa forward, to increase the competitiveness of our
state and its people today and for years to come.”
Governor Branstad, 2014 State of the State
This report presents the results of a year‐long effort to set a strategic direction for economic
development in Iowa. The study was initiated and led by the Iowa Partnership for Economic Progress
(IPEP), an industry‐led, CEO‐level advisory board established by Governor Branstad in 2011. The
mandate of IPEP is to continuously identify and study economic development issues facing Iowa and
recommend solutions and policy alternatives.
Iowa has long recognized that economic development is an important public purpose and that both
the public and private sectors have a shared interest in fostering the economic vitality of the state.
IPEP makes that partnership real by bringing together industry leaders in Iowa with public officials
responsible for advancing Iowa’s economic development efforts, including the Governor, Lt. Governor,
the Director of the Iowa Economic Development Authority, and the Chairs of the Iowa Economic
Development Authority Board and Iowa Innovation Corporation. By initiating and leading this strategic
planning effort, IPEP embraces its responsibility to assist Iowa in advancing the strategic economic
development directions needed to forge an economic future able to generate high quality jobs and
growing incomes for Iowans in a highly competitive global, knowledge‐based economy.
IPEP retained a third‐party expert, the Battelle Technology Partnership Practice (TPP), to provide an
objective assessment of Iowa’s industries and development assets, to serve as the foundation for the
IPEP Board to guide strategy development. Battelle TPP also assisted the IPEP Board in its strategy
deliberations bringing its extensive best practices knowledge as well as examining Iowa’s evolving
economic development efforts focused on innovation, retention and attraction.
Battelle TPP is the economic development consulting arm of the world’s largest independent non‐profit
research and development organization. The Battelle Technology Partnership Practice also brings an
understanding of the Iowa context. In the 2004–2006 period, Battelle developed a set of more targeted
roadmaps for the biosciences, advanced manufacturing, information technology and entrepreneurial
development that set the stage for many of Iowa’s recent economic development efforts.
In initiating this strategic planning effort, IPEP set out key guidelines for how to approach the re‐
envisioning of Iowa’s economic development roadmap:
First, engage a broad range of economic development stakeholders from private industry, economic
development and higher education to ensure broad‐based input. A Project Taskforce was formed to
help in reviewing the analysis Battelle undertook involving the Iowa Economic Development Authority,
the Iowa Innovation Corporation, regional economic development organizations from across the state

| P a g e 5
and leading statewide industry associations. Several extensive meetings were held with the Project
Taskforce over the course of the project to review the analysis and provide input as it was being
completed.
Battelle also undertook extensive field work to meet with stakeholders, visiting a wide number of
communities across Iowa. These included site visits to Ames, Burlington, Cedar Falls, Cedar Rapids,
Council Bluffs, Des Moines, Dubuque, Fort Dodge, Iowa City, Mason City, Quad Cities, Sioux City,
Spencer, and Waterloo to meet with regional stakeholders and conduct specific meetings at Iowa’s
public universities. Battelle also interviewed and met with industry leaders involved with the Iowa
Business Council and Iowa Innovation Council.
Battelle benefited from a unique and extensive survey of Iowa industry executives on their own business
situation and assessment of Iowa’s competitive capacity and business climate, known as the Business
Expansion and Strategic Trends (BEST) of Iowa. BEST uses the Synchronist System survey instrument, a
structured executive interview instrument that includes 42 questions designed to draw out business as
well as community issues that can impact growth and/or business stability. These questions are used by
over 700 Synchronist users across the U.S. and Canada to conduct thousands of executive interviews
every year, and allows for comparisons of Iowa to other places. In 2012 alone, Iowa’s economic
development community conducted 1,221 executive interviews in 62 counties and 160 Iowa
communities. BEST of Iowa is a strategic partnership of Black Hills Energy, Alliant Energy‐IPL, Iowa Area
Development Group and MidAmerican Energy Company in collaboration with the Iowa Economic
Development Authority.
Second, complete a comprehensive analysis of Iowa’s industry clusters, development resources and
economic assets. The strategic planning process needed to be informed by an objective, fact‐based and
updated assessment of the trends and competitiveness of Iowa’s industry clusters as well as
development resources and assets that businesses draw upon to sustain growth in today’s global,
knowledge‐based economy.
Finally, review and recommend the programs necessary for Iowa to strengthen its existing industry
clusters and capitalize on opportunities for growth. In assessing the standing of Iowa’s industry clusters
it is important not just to assess their recent performance, but to consider their potential to advance
and sustain economic growth in the future. In setting out strategic directions, while it is important to
improve and complement existing economic development programs that are working in Iowa, it is also
important to consider bold transformational initiatives that can propel Iowa forward.

| P a g e 6
Project Taskforce Members
Dee Baird, President and CEO, Cedar Rapids Metro Economic Alliance
Jay R. Byers, President and CEO, Greater Des Moines Partnership
Andrew Conrad, Senior Program Manager, Institute for Decision Making
Dan Culhane, President and CEO, Ames Economic Development Commission
Rick Dickinson, President and CEO, Greater Dubuque Development Corporation
Steve Dust, President and CEO, Greater Cedar Valley Alliance
Tina Hoffman,
Marketing and Communications Director, Iowa Economic Development Authority
Joe Hrdlicka, Executive Director, Iowa Biotechnology Association
Kathryn M. Kunert, Vice President, Business and Community Development, MidAmerican Energy
Mark Laurenzo, Manager, Business Development, Iowa Economic Development Authority
David Maahs, Executive Vice President of Economic Development, Greater Des Moines Partnership
Christopher McGowan, President, Siouxland Chamber of Commerce
Randy Pilkington, Executive Director, University of Northern Iowa Business and Community Services
Michael Ralston, President, Iowa Association of Business & Industry
Elliott G. Smith, Executive Director, Iowa Business Council
John Stineman, Executive Director, Iowa Chamber Alliance
Brian Waller, President, Technology Association of Iowa
Tim Whipple,
General Counsel and Legislative Affairs, Iowa Economic Development Authority
IPEP Board
Industry Members
Stan Askren, President, HNI Corporation
Miriam Erickson Brown, President, Anderson Erickson Dairy
Bill Fehrman, President and CEO, MidAmerican Energy
Debra Janssen, President and CEO, CDS Global
Patrick Meyer, President and CEO, Pella Corporation
Tom Penaluna, President, CBE Companies
Paul Schickler, President, Pioneer Hi‐Bred International
Steve Schuster, Owner, Schuster Company
Roger Underwood, Riverwood Management
Tom Whitson, American National Bank
Larry Zimpleman, CEO, Principal Financial Group
Ex‐Officio Members
Terry Branstad, Governor of the State of Iowa
Kim Reynolds, Lt Governor of the State of Iowa
Debi Durham, Director, Iowa Economic Development Authority
Larry Den Herder, Chair, Iowa Economic Development Authority Board
Robert Riley, Jr., Chair, Iowa Innovation Corporation

| P a g e 7
THE CONTEXT: ADVANCING A STRATEGIC FRAMEWORK FOR ECONOMIC
DEVELOPMENT IN THE 21ST CENTURY
Far too often economic development efforts are considered in the context of short‐term ups and downs
of the economy. This has been especially true in recent years given the difficult economic times posed
by the severe economic recession and weak national recovery. While understandable, this reactive
approach to short‐term conditions can overlook more significant and longer‐lasting changes in the
economy that are altering what it will take to be competitive and realize sustained economic growth
into the future.
A new economic era has been taking hold in recent decades marked by increasing globalization, the fast
pace of technological change, and the growing strength of developing nations in generating highly
educated and skilled talent to compete for economic growth. As the 2013 report by the National
Research Council, Rising to the Challenge, notes:
U.S. regional economies face mounting global competitive challenges. No longer do U.S.
states and cities primarily compete among themselves for talent, investment, and
entrepreneurs in technology‐intensive industries. They also compete against [foreign]
national and regional governments that are executing comprehensive strategies that
seek to create innovation clusters in many of the same important, emerging industries.1
So, in the midst of the ups and downs of the economy, what has continued to accelerate through the
first decade of the 21st Century is the rise of the global, knowledge‐based economy. These new
economic realities are raising the bar on what is needed to achieve economic success. But while the
competition may be rising, the expected rewards are also expected to be much higher. The economic
prosperity of a growing global economy will outpace growth expected in the U.S. economy, creating an
opportunity for states that position themselves well to reap significant benefits. Just looking over the
next five years, the International Monetary Fund (IMF) in its October 2014 World Economic Outlook has
the U.S. economy growing 27 percent from 2014 to 2019 compared to worldwide growth of 34 percent,
which will result in the U.S. share of the world economy declining from just over 16 percent in 2014 to
just over 15 percent by 2019.2
Iowa, with the right strategies for economic development specifically tailored to its industry growth
opportunities and development assets, can be a big winner. But setting a winning strategy calls for
having a widely shared understanding – or strategic framework – of what is required to advance
economic development in the emerging global, knowledge‐based economy.
In consultation with IPEP and other economic development stakeholders in Iowa, such a strategic
framework has helped guide the development of this economic development roadmap, providing the
1 Charles W. Wessner and Alan Wm. Wolff, Eds. “Rising to the Challenge: U.S. Innovation Policy for the Global Economy.” 2012. The National Academies Press, Washington, DC, page 431. 2 See http://www.imf.org/external/pubs/ft/weo/2014/02/weodata/index.aspx for data from IMF World Economic Outlook, calculations by Battelle.

| P a g e 8
“logic” for understanding how the interplay of industries, assets and economic development activities
result in measurable economic outcomes.3 Through this strategic framework, it is possible to address
the implications of the new terms of competition as well as incorporate the emerging best practices for
advancing economic development in an increasingly global, knowledge‐based economy. This strategic
framework also provides the lens through which to assess Iowa’s economic development position and to
identify future strategic directions.
The strategic framework for Iowa’s economic development addresses the following questions:
What are the appropriate measures of economic success for Iowa? In other words, what are
the ultimate goals to be achieved by Iowa’s economic development efforts?
What are the industry clusters for economic success for Iowa? How does one assess industry’s
role in advancing economic development in Iowa and its potential to sustain future economic
growth?
What are the economic program activities needed in Iowa? How can Iowa best advance
innovation, retention and attraction to grow its industry clusters, while advancing development
resources needed for industry to be successful?
What are the critical development resources in Iowa for industry clusters? What capacities and
assets found in Iowa are critical for business success and competitiveness?
The answers to these questions set the context for how Iowa needs to assess its challenges and
opportunities for advancing economic development and setting a focused course of strategic actions.
Figure 1 presents a graphic illustration of the logic of this strategic framework and the key elements for
Iowa. What follows explains the key elements driving this strategic framework.
3 Logic models are a widely used tool for evaluating strategies and specific programs. For more information, see W.K. Kellogg Foundation Logic Model Development Guide, January 2004, page 3, available at www.wkkf.org.

| P a g e 9
A Higher Standard of Living for Iowa
Major Industry Clusters
Agriculture& Food
Automation& Industrial Machinery
Heavy Machinery
Information Services
Transportation& Distribution
Attraction
Renewable Energy
Biosciences
Avionics & Electronics
PrimaryMetals
Insurance & Financial
Services
Building & Construction
Products HealthServices
Economic Development Activities
Economic Drivers
Workforce Physical Infrastructure
BusinessClimate
EntrepreneurialCulture
Economic Foundations
Retention Innovation
Figure 1: Strategic Framework and Key Elements for Economic Development in Iowa.

| P a g e 10
WHAT ARE THE APPROPRIATE MEASURES OF ECONOMIC SUCCESS?
Economic success is directly related to whether Iowa’s economy is growing and the pace of that growth.
But it is not simply economic growth that matters, but how that growth translates into economic well‐
being for Iowans. As Michael Porter, a thought leader in competitive strategies for industry and
economic development, states in his seminal work, The Competitive Advantage of Nations: “The
principal economic goal for a nation is to produce a high and rising standard of living for its citizens.”
Traditionally, job growth and whether workers were employed or unemployed was the key indicator
used in economic development to measure success. This made sense when having a job meant having a
decent standard of living. But in today’s global, knowledge‐based economy the ability of a job to
generate a decent and rising standard of living is now based on the skills it requires and knowledge
workers bring to the job. As the Organization for Economic Co‐Operation and Development explains:
“Employment in the knowledge‐based economy is characterized by increasing demand for more high
skilled workers … Changes in technology, and particularly the advent of information technologies, are
making educated and skilled labor more valuable, and unskilled labor less so.”4 In Iowa and across the
U.S., far too many low‐skilled jobs no longer generate decent and growing wages and benefits that
afford a decent standard of living. While a job is better than no job, without increasing wages it is
difficult for economic well‐being to rise.
So it is increasingly important to consider a wider number of measures to capture economic success
rather than jobs alone. An example is the effort of the Iowa Business Council in its annual Iowa
Competitiveness Index which uses a mix of measures to assess economic growth, including:
Total employment, again the traditional measure of economic development success, with a
more focused look at “knowledge jobs” recognizing the growing significance that high‐skilled
jobs have in today’s economy;
Growth in state gross domestic product (GDP), a measure of the value of the goods and services
produced in the state’s economy – analogous to national GDP that is tracked to measure
national economic activity – with a more detailed look at the share of manufacturing activity
given its significant role in Iowa’s economy;
Per capita income, a direct measure of the standard of living across all workers, though it
includes investment income, Social Security and other transfer payments and income generated
by businesses, such as farm income.
This broader view of economic success is used in this economic development roadmap to judge whether
or not the “economic fundamentals” of Iowa are improving and at a rate faster than the nation.
4 OECD, “The Knowledge‐Based Economy,” Paris, 1996, page 7.
| P a g e 11
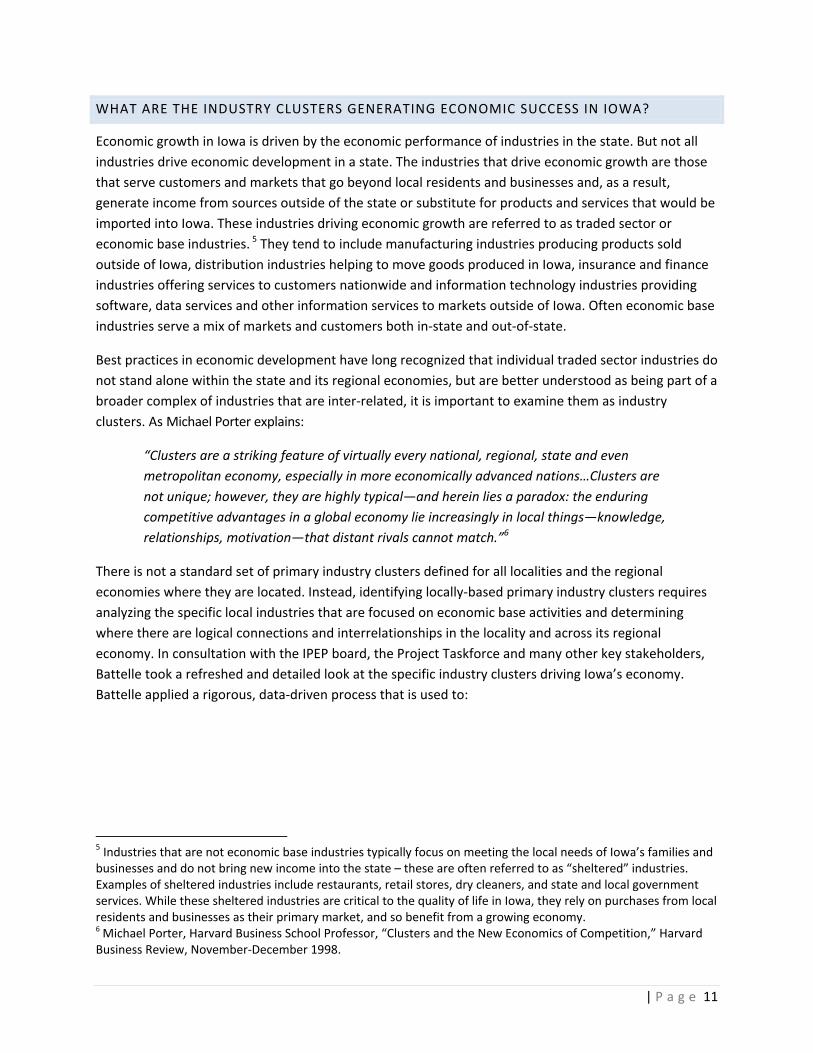
WHAT ARE THE INDUSTRY CLUSTERS GENERATING ECONOMIC SUCCESS IN IOWA?
Economic growth in Iowa is driven by the economic performance of industries in the state. But not all
industries drive economic development in a state. The industries that drive economic growth are those
that serve customers and markets that go beyond local residents and businesses and, as a result,
generate income from sources outside of the state or substitute for products and services that would be
imported into Iowa. These industries driving economic growth are referred to as traded sector or
economic base industries. 5 They tend to include manufacturing industries producing products sold
outside of Iowa, distribution industries helping to move goods produced in Iowa, insurance and finance
industries offering services to customers nationwide and information technology industries providing
software, data services and other information services to markets outside of Iowa. Often economic base
industries serve a mix of markets and customers both in‐state and out‐of‐state.
Best practices in economic development have long recognized that individual traded sector industries do
not stand alone within the state and its regional economies, but are better understood as being part of a
broader complex of industries that are inter‐related, it is important to examine them as industry
clusters. As Michael Porter explains:
“Clusters are a striking feature of virtually every national, regional, state and even
metropolitan economy, especially in more economically advanced nations…Clusters are
not unique; however, they are highly typical—and herein lies a paradox: the enduring
competitive advantages in a global economy lie increasingly in local things—knowledge,
relationships, motivation—that distant rivals cannot match.”6
There is not a standard set of primary industry clusters defined for all localities and the regional
economies where they are located. Instead, identifying locally‐based primary industry clusters requires
analyzing the specific local industries that are focused on economic base activities and determining
where there are logical connections and interrelationships in the locality and across its regional
economy. In consultation with the IPEP board, the Project Taskforce and many other key stakeholders,
Battelle took a refreshed and detailed look at the specific industry clusters driving Iowa’s economy.
Battelle applied a rigorous, data‐driven process that is used to:
5 Industries that are not economic base industries typically focus on meeting the local needs of Iowa’s families and businesses and do not bring new income into the state – these are often referred to as “sheltered” industries. Examples of sheltered industries include restaurants, retail stores, dry cleaners, and state and local government services. While these sheltered industries are critical to the quality of life in Iowa, they rely on purchases from local residents and businesses as their primary market, and so benefit from a growing economy. 6 Michael Porter, Harvard Business School Professor, “Clusters and the New Economics of Competition,” Harvard Business Review, November‐December 1998.

| P a g e 12
Examine how Iowa’s economic base industries were evolving at the most detailed industry
levels7 to understand specific economic base industry activities based on size, relative
concentration/specialization, and recent trends, particularly against national performance;
Consider likely supply chain relationships in Iowa based on the IMPLAN input/output model for
Iowa to learn about key inter‐relationships between the detailed industries. Input/output
models show the purchases of goods or services between industries, which enables identifying
those industries that do business together. IMPLAN is one of the most widely used models in the
nation and customizes the likely supplier chain relationships based on the economic structure
found in each state.
Refine the analysis based upon the specific activities of leading firms in economic base
industries. Battelle accessed information from corporate databases, visiting company websites,
and calling companies to understand their products, services, and applied technologies and
where they fit relative to other industries in the state.
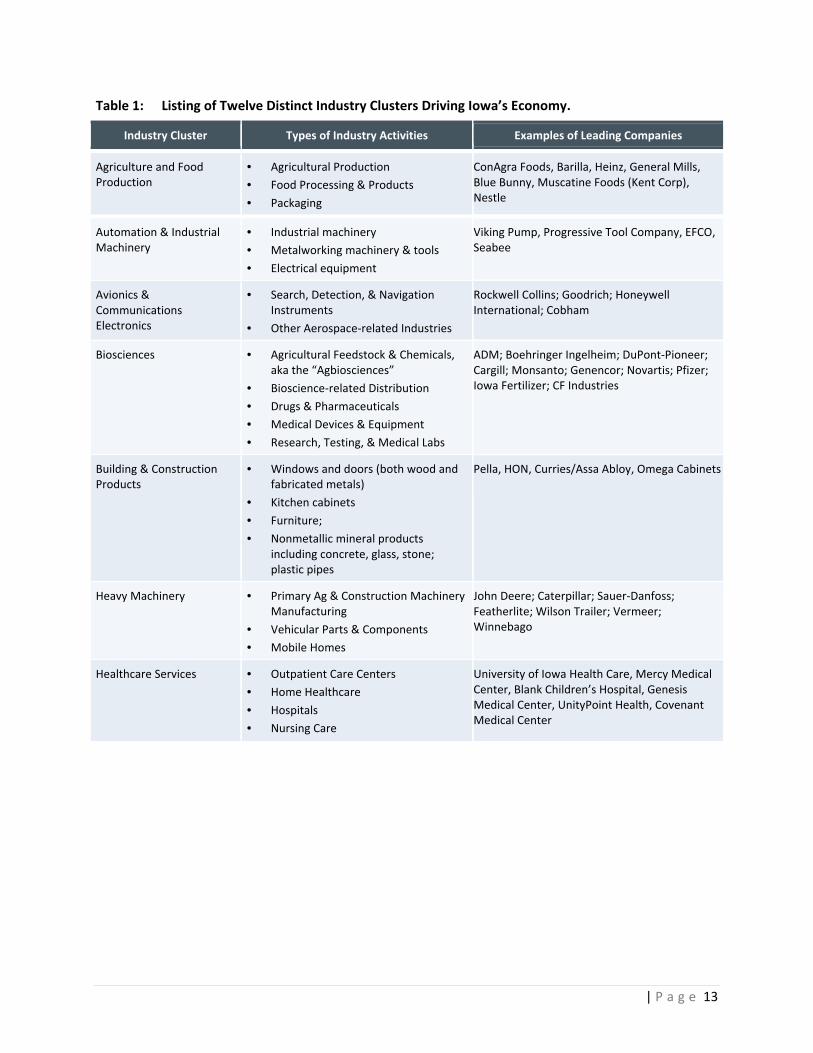
Twelve distinct industry clusters were identified as driving Iowa’s economy. Table 1 summarizes the
major industry components of these clusters and examples of leading firms found in Iowa.
7 Battelle examined industry employment data at the 6‐digit level of the North American Industry Classification System (NAICS) using an enhanced database from IMPLAN. These data are based on the U.S. Bureau of Labor Statistics’ Quarterly Census of Employment and Wages (QCEW) supplemented by County Business Patterns and other regional data sets. Employment data used in the analysis include full‐time and part‐time positions.
| P a g e 13
Table 1: Listing of Twelve Distinct Industry Clusters Driving Iowa’s Economy.
Industry Cluster Types of Industry Activities Examples of Leading Companies
Agriculture and Food Production
• Agricultural Production
• Food Processing & Products
• Packaging
ConAgra Foods, Barilla, Heinz, General Mills, Blue Bunny, Muscatine Foods (Kent Corp), Nestle
Automation & Industrial Machinery
• Industrial machinery
• Metalworking machinery & tools
• Electrical equipment
Viking Pump, Progressive Tool Company, EFCO, Seabee
Avionics & Communications Electronics
• Search, Detection, & Navigation Instruments
• Other Aerospace‐related Industries
Rockwell Collins; Goodrich; Honeywell International; Cobham
Biosciences • Agricultural Feedstock & Chemicals, aka the “Agbiosciences”
• Bioscience‐related Distribution
• Drugs & Pharmaceuticals
• Medical Devices & Equipment
• Research, Testing, & Medical Labs
ADM; Boehringer Ingelheim; DuPont‐Pioneer; Cargill; Monsanto; Genencor; Novartis; Pfizer; Iowa Fertilizer; CF Industries
Building & Construction Products
• Windows and doors (both wood and fabricated metals)
• Kitchen cabinets
• Furniture;
• Nonmetallic mineral products including concrete, glass, stone; plastic pipes
Pella, HON, Curries/Assa Abloy, Omega Cabinets
Heavy Machinery • Primary Ag & Construction Machinery Manufacturing
• Vehicular Parts & Components
• Mobile Homes
John Deere; Caterpillar; Sauer‐Danfoss; Featherlite; Wilson Trailer; Vermeer; Winnebago
Healthcare Services • Outpatient Care Centers
• Home Healthcare
• Hospitals
• Nursing Care
University of Iowa Health Care, Mercy Medical Center, Blank Children’s Hospital, Genesis Medical Center, UnityPoint Health, Covenant Medical Center

| P a g e 14
Industry Cluster Types of Industry Activities Examples of Leading Companies
Information Services, Digital Media & Technology
• Software & Computer Services
• Internet Services & E‐Commerce
• Multimedia Publishing
CDS Global, Datavision Resources (Equifax), TM1 Stop, Fiserv, Telligen, WebFilings, Lee Enterprises, Meredith Corporation, Kendall Hunt, Microsoft, Google, Facebook
Insurance & Finance • Insurance
• Commercial Banking
• Securities, Commodities, & Other Financial Investments
Principal Financial, AEGON/Transamerica, Nationwide, ING, Metlife, Wells Fargo, Bankers Trust
Primary Metals Manufacturing
• Iron, Steel, Aluminum, Nonferrous and Foundaries
SSAB (Swedish Steel); PMX Industries (Copper); Sivyer Steel Corp; Iowa Aluminum; Alcoa
Renewable Energy • Wind Turbines
• Energy Storage
• Ethanol & Biofuels
Siemens; GE Wind Energy; Acciona Windpower; TCE (Poet); Hawkeye Energy; Renewable Energy Group (REG)
Transportation, Distribution & Logistics
• Wholesale
• Transportation
• Warehousing & Storage
Perishable Distributors of Iowa, LTD. (Hy‐Vee); Ruan Transportation Management Systems; Simons Trucking; CRST International; Jacobson Global Logistics

| P a g e 15
WHAT ARE THE ECONOMIC PROGRAM ACTIVITIES NEEDED IN IOWA?
Economic development has to keep pace with the challenges posed by a global, knowledge‐based
economy by focusing on innovation, retention and attraction. As the National Research Council in its
2013 report on Best Practices in State and Regional Innovation Initiatives: Competing in the 21st Century
explains: “States confront stark economic challenges in the global era ... efforts at industrial revival using
traditional policy tools, including industrial recruitment and financial incentives to industry are now
being complemented by more technology‐based indigenous growth strategies.”8 The National Research
Council continues by noting that: “In the years since [late 1970s] ... state and local industrial
development efforts have continued unabated while undergoing a qualitative evolution that increasingly
emphasizes knowledge‐based development ... In recent decades, however, innovation‐related initiatives
have moved to the center of state and local development efforts.”9
In keeping with the best practices in state economic development, Iowa has advanced an active,
balanced and integrated economic development program that focuses on innovation, retention and
attraction. In recent years, Iowa has retooled its traditional economic development tools to meet the
challenges of integrating innovation, retention and attraction, while also creating new tools focused on
spurring and nurturing innovation. For example, the state’s leading business retention and attraction
program offering tax credits and direct financial assistance, the High Quality Jobs Program, not only sets
a wage and benefits threshold for businesses to qualify, but offers a supplemental R&D tax credit along
with other incentives. Iowa has also focused specifically on innovation with a number of more recent
economic development programs to support commercialization of technologies by small and medium
sized companies, promote creation of venture funds and assist businesses in pursuing the federal Small
Business Innovation Research program – now administered through a newly formed Iowa Innovation
Corporation that works closely with the Iowa Economic Development Authority.
In emphasizing innovation along with retention and attraction, Iowa is recognizing that technology
and innovation is critical for its mature and established industries, not just new, emerging industries.
The popular images of innovation are having innovative, new start‐up firms involved in emerging areas
of technology from biotechnology, nanotechnology, and digital media. But, in fact, the importance of
technology and innovation is not just for newly developing industries, but also is integral to the
competitiveness of existing industries. Well‐established industries involved in agriculture and
manufacturing are at the cutting edge of applications involving use of big data, Internet of Things, bio‐
based products, advanced materials, additive manufacturing and electronic design. Consider that
roughly six out of every ten information technology workers are employed outside of computer and
telecommunications industries, with high concentrations found in finance, insurance and
manufacturing. In Iowa, the largest employers of IT and engineering professionals include professional,
scientific, and technical services; computer and electronic products manufacturing; rail transportation;
insurance; banking; educational services; and corporate headquarters.
8 Charles W. Wessner, Editor. Best Practice in State and Regional Innovation Initiatives. Committee on Competing in the 21st Century; Board on Science, Technology, and Economic Policy; National Research Council, 2013, page 11. 9 IBID, page 28.

| P a g e 16
Emerging across states is a new powerful paradigm shift that brings together the notion of industry
cluster development and the integration of innovation, retention and expansion. The idea that state
and regional development is driven by industry clusters of geographically localized concentrations of
firms in related sectors that do business with each other and have common needs for trained workers,
infrastructure and technology goes back in the economic literature to the writings of Alfred Marshall in
the late 19th and early 20th centuries.10 But industry cluster development as a best practice for economic
development has only taken hold in the past two decades.
What is different today and is propelling the focus on industry cluster development is the emphasis
placed on technology and innovation as drivers of 21st century economic development. For a particular
state to succeed, it needs to identify those industry clusters with strong growth opportunities where the
state is best positioned to differentiate itself and build core competencies in specialized areas of
expertise where it can be a world leader. Core competencies represent a “critical mass” of know‐how
spanning industry and universities/federal labs/non‐profit research institutes as well as the technical,
management and entrepreneurial talent base they
generate and attract to the state, specialized
facilities found in the state, and venture capital
sources. For 21st century economic development,
advancing core competencies that industry clusters
are able to gain a competitive advantage represents
a unifying thread for economic development
efforts. It is the same core competencies that
inform and guide both a state’s efforts in more
home‐grown development strategies to retain and
grow emerging industries and its outreach
marketing to attract industries to locate in the
region. By being guided by core competencies, state
efforts between innovation, retention and business
attraction efforts are highly compatible and
reinforce each other.
10 For a discussion of industry cluster theory, see National Research Council’s report on Best Practices in State and Regional Innovation Initiatives, pages 31–34.
“U.S. economic strength depends on the
ability of each state to ‘compete’ successfully
in the world marketplace. Each state must
exploit the unique advantages it has relative
to other states and build on the strengths
found in its local ‘clusters of innovation’—
distinct groups of competing and cooperating
companies, suppliers, service providers and
research institutions.”
National Governor’s Association, “A
Governor’s Guide to Trade and Global
Competitiveness”
| P a g e 17
WHAT ARE THE CRITICAL DEVELOPMENT RESOURCES IN IOWA FOR INDUSTRY CLUSTERS?
Development resources are the assets that businesses draw upon to sustain growth in today’s global,
knowledge‐based economy. Of particular importance are workforce, innovation and entrepreneurial
culture, physical infrastructure and business climate.
Workforce touches upon all aspects of economic competitiveness. It represents not only the
general skills of workers to produce top quality goods and services quickly and efficiently, but
also the specialized capacity found among world‐class scientists and engineers to invent,
advance discoveries and develop new technologies. For economic development in the 21st
century, a high quality workforce is critical to defining a positive business climate. As the
National Governors’ Association points out in their series on State Leadership in the Global
Economy: “CEOs report that the availability of technically trained talent is their top priority—
one that often determines where they locate high‐value investments.”11
Innovation and entrepreneurial culture are critically important to regional economic
development, because it drives industrial competitiveness and offers a new source of growth
through new business formation. Starting with David Birch’s work and validated by the Office of
Advocacy of the U.S. Small Business Administration (SBA) and further refined by studies
commissioned in recent years by the Kauffman Foundation and others, it is clear that
technology, innovation, and entrepreneurship drive economic growth. A 2005 report prepared
for the SBA’s Office of Advocacy comparing regions with strong and weak entrepreneurial
activity found that “the most entrepreneurial regions had better local economies from 1990 to
2001 compared to the least entrepreneurial. They had 125 percent higher employment growth,
58 percent higher wage growth and 109 percent higher productivity. This general finding held
individually for large, medium and small sized regions but was most pronounced for large
regions.”12 With a few notable exceptions such as Silicon Valley and Austin, the entrepreneurial
climate necessary to generate high‐growth enterprises has not developed fully and sustainably
through market forces alone. It is often stated that entrepreneurship is a “contact sport,” and
the barriers and obstacles to being able to scale a firm is significant, particularly for technology
firms. One significant challenge for entrepreneurial development is the lack of experienced
management talent. A second challenge facing entrepreneurs is access to capital. Entrepreneurs
require access to capital at each stage of their development, from early‐stage, proof‐of‐concept
and prototype development to Series A and B venture financing. A third challenge that
entrepreneurs face is to find customers and markets as they seek to grow – which is the stage at
which economic development results are realized.
Physical Infrastructure may seem like a throw‐back to an earlier era, but if an industry is to be
competitive in a particular state it requires having access to a well‐developed infrastructure.
According to the World Economic Forum, physical infrastructure is one of its pillars for economic
11 National Governors’ Association, State Leadership in the Global Economy, 2002. 12 The Innovation‐Entrepreneurship Nexus: a National Assessment of Entrepreneurship and Regional Economic Growth and Development. Powell, Ohio: Advanced Research Technologies, LLC, April 2005, page 5.

| P a g e 18
competitiveness. A well‐developed transport and communications infrastructure network is a
prerequisite for core economic activities and services in today’s global economy. Effective
modes of transport—including quality roads, railroads, ports, and air transport—enable
entrepreneurs to get their goods and services to market in a secure and timely manner and
facilitate the movement of workers to the most suitable jobs. Economies also depend on
electricity supplies that are free from interruptions and shortages so that businesses and
factories can work unimpeded. Finally, a solid and extensive telecommunications network
allows for a rapid and free flow of information, which increases overall economic efficiency by
helping to ensure that businesses can communicate and decisions are made by economic actors
taking into account all available relevant information.
Business Climate – While talent, innovation and entrepreneurial climate and physical
infrastructure all contribute towards a healthy business environment, it is also important to be
mindful of the cost of doing business and the regulatory environment in a state. Places that have
high costs to doing business or pursue needed regulations in an inefficient or adversarial
manner still face a competitive disadvantage. Low costs or absence of regulations alone will not
spur economic development, but high costs and poor regulatory environment may choke off
growth. Two well‐regarded annual state by state business climate studies, by CNBC and Forbes,
develop a composite measure for business climate that builds across a whole range of factors
including the cost of doing business; the overall economy and growth prospects; infrastructure
and transportation; workforce; quality of life; technology and innovation; business friendliness;
and access to capital. Factors get various weights attached to them to emphasize and embed
their importance to industry, and CNBC applies the highest weight to cost of doing business. Site
selectors emphasize that while business costs is not the only factor driving location decisions, a
competitive cost landscape for companies will more often than not get your location noticed
and considered.

| P a g e 19
KEY FINDINGS ON IOWA’S ECONOMIC PERFORMANCE AND
IMPLICATIONS FOR FUTURE DEVELOPMENT
The comprehensive economic development framework provides a focused approach to assessing Iowa’s
recent economic performance and its position for future development. Bringing together the key
assessments across the elements of Iowa’s economic development framework suggests the following
high‐level key findings:
Iowa has made substantial economic progress over the last decade. The trends in Iowa’s top‐line
measures are positive, though Iowa is not always the leader in these measures; it demonstrates there
are many opportunities for Iowa to capitalize on its strengths.
Iowa’s industry clusters are robust, diverse and have statewide impacts. The 12 industry clusters
driving Iowa’s economy are generally outperforming the nation in their level of specialization, job
growth and productivity. Together they offer a diverse set of industries, with most having a broad
presence across the state or multiple regions of the state.
Some of the weaknesses in Iowa’s economic foundations require focused attention. Across each area
of Iowa’s economic foundations – workforce, innovation and entrepreneurial culture, physical
infrastructure and business climate – there are positives that would be expected given the strong
economic performance of Iowa over the past decade, along with weaknesses that pose economic
challenges for Iowa in the years ahead.
Looking to the future, Iowa has considerable economic momentum, but the detailed analysis of its
industry clusters driving the Iowa economy and its economic foundations suggests some specific
challenges to continued economic success. Four specific challenges for Iowa emerge as strategic
priorities from the comprehensive assessment:
Ensure the Competitiveness and Growth of Iowa’s Leading Industry Clusters through
Innovation, Retention and Attraction
• Iowa must overcome the slower growth projected for its leading industry clusters at the
national level and continue to outperform the nation to sustain significant economic
growth. This places a considerable urgency to furthering productivity gains and pursuing
high growth opportunities for Iowa’s industry clusters.
Generate and Attract Skilled Workforce in Demand by Iowa’s Businesses
• Despite growth in middle‐ and high‐skilled jobs in Iowa, Iowa businesses report
continued shortages of skilled workforce, which when combined with mixed
performance in science, technology, engineering and math (STEM) education and weak
growth in statewide population pose a critical economic development challenge for
Iowa.

| P a g e 20
Accelerate the Development of Iowa’s Emerging Entrepreneurial Eco‐System
• Recent trends suggest that while research and development activities have risen
strongly in Iowa, the translation of Iowa’s R&D base into the commercialization of new
products and a vibrant base of high growth, emerging companies is still lagging. Only in
recent years has Iowa pursued a focused programmatic effort to advance innovation
and entrepreneurial development, and while these efforts remain a work‐in‐progress,
they need to be pursued more vigorously.
Advance Iowa’s Physical Infrastructure and Regional Development Capacities to Realize Iowa’s
Economic Potential
• The need for continued investments in Iowa’s physical infrastructure to address needs in
its freight transportation system, upon which much of the state’s agricultural and
manufacturing economy depends, as well as in broadband capacity to provide the
critical digital connections required of a modern 21st century business environment
stand out.
The remainder of this section examines the details of Iowa’s economic performance, while the next
section examines Iowa’s position for future development in the context of the four strategic priorities
and recommended tactics for Iowa that address how to advance the state’s economic development
policies in the near term, but also pose strategic directions for the future.

| P a g e 21
KEY FINDINGS: IOWA’S ECONOMIC PROGRESS OVER THE LAST DECADE
Iowa has made broad gains in recent years even with the severe economic recession taking hold in 2008
and weak national recovery that has followed. To provide insights into Iowa’s economy going forward,
our focus will consider the period of 2007–2012/13, which encompasses the last year before the
recession hit and the most recent year for which data is available.
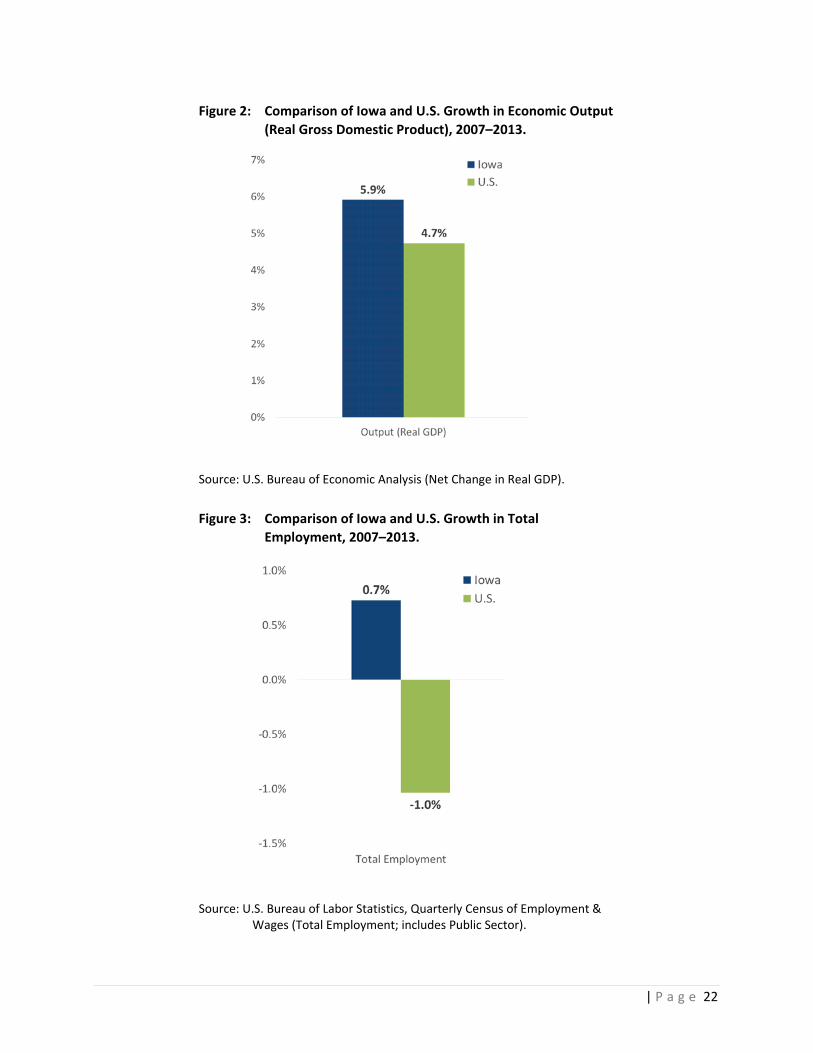
In economic output, Iowa by 2013 had increased its economic activity by nearly 6 percent in real,
inflation‐adjusted terms from 2007 pre‐recession levels (see Figure 2). Iowa’s growth in economic
output well outpaced the nation – growing 1.2 percentage points faster.
In total job growth, Iowa stands out in reaching above 2007 pre‐recession levels by 2013, while the
nation still had not replaced all of the lost jobs since 2007 (see Figure 3). Still, Iowa’s job gains have not
been stellar – reflecting the “job‐less” recovery noted in recent economic press accounts.
In high quality job growth, Iowa outshined the nation in both its growth in middle‐skilled jobs and,
especially, high‐skilled jobs (see Figure 4). Keep in mind these are not just job openings in Iowa, but
actual jobs filled in Iowa. It suggests that Iowa’s gains in economic output were reflected in the
workplace by a more highly skilled workforce able to generate high valued products.
It is also important to note another key difference between Iowa and the U.S. – at the other end of the
skill spectrum for low‐skilled jobs. Across the nation, low‐skilled jobs rose since the mid‐2000s,
suggesting many jobs were created that cannot support a family, while family‐supporting middle‐skilled
jobs declined. In Iowa low‐skilled jobs declined, as the skill spectrum of the workforce in Iowa shifted
upwards with gains in both middle and high‐skilled jobs taking place.
In average wages, Iowa well outpaced the gains made nationally in private sector industries (non‐
government) (see Figure 5). This is consistent with the rising skill levels found in Iowa, though it may also
represent greater demand for workforce bidding up wages in Iowa.
In per capita income, Iowa closed the gap with the U.S. over the past decade and by 2013 slightly
exceeded the U.S. average (see Figure 6). In the more recent 2007 to 2013 period, Iowa’s per capita
income rose by 22.5 percent compared to 11.9 percent, so Iowa nearly doubled the growth rate of the
nation.
A key generator of Iowa’s strong growth in per capita incomes was soaring farm personal incomes,
which rose 126 percent from 2007–2013 and comprised 18 percent of the increase in Iowa personal
income over the 2007–2013 period.
Still, growth in non‐farm personal income in Iowa increased faster than the nation (20 percent for Iowa
and 14 percent for US 2007–2013) and comprised 54 percent of gains in Iowa personal income,
compared to 59 percent nationally. So, while Iowa’s per capita income is strongly influenced by changes
in farm incomes, there have been broader economic forces at work that are enabling Iowa to close the
gap in per capita income with the national average.
| P a g e 22
Figure 2: Comparison of Iowa and U.S. Growth in Economic Output
(Real Gross Domestic Product), 2007–2013.
Source: U.S. Bureau of Economic Analysis (Net Change in Real GDP).
Figure 3: Comparison of Iowa and U.S. Growth in Total
Employment, 2007–2013.
Source: U.S. Bureau of Labor Statistics, Quarterly Census of Employment & Wages (Total Employment; includes Public Sector).

| P a g e 23
Figure 4: Comparison of Iowa and U.S. Growth in Employment by High‐, Middle‐, and Low‐
Skilled Workforce, 2004–2013.
Source: Battelle analysis of Bureau of Labor Statistics, Occupational Employment Statistics Data.
Figure 5: Trends in Average Wages in Private Sector Industries, Iowa and U.S., 2007–2013.
Source: Battelle analysis of Bureau of Labor Statistics, QCEW data.

| P a g e 24
Figure 6: Per Capita Income Levels, Iowa and U.S., 2001–2013.
Source: Bureau of Economic Analysis.
These broad and substantial gains made by Iowa in measures of economic success suggest the progress
being made in Iowa’s economy in growing the economy with high quality jobs that translate into
growing family incomes for Iowa.
Still, it is important not to lose sight that Iowa still needs further gains to be among the most
economically successful states in the nation.
As of 2013, even with the major gains of recent years, Iowa ranked only 23rd in the nation in per
capita income – perhaps the most meaningful measure of how a state’s economy is doing in
generating a high standard of living for its residents.
In high‐skilled jobs, while Iowa is growing faster than the nation in recent years, it remains
behind the U.S. average in the overall level of high‐skilled jobs, with 23 percent of Iowa’s
workforce employed in high‐skilled jobs compared to 26 percent for the nation in 2013.
In average wages, reflecting in part the lower level of high‐skilled workers, Iowa’s average
earnings for private sector workers stood at $40,489 in 2013 compared to a national average of
$49,700, so Iowa is roughly 23 percent lower than the nation.

| P a g e 25
KEY FINDINGS: THE PERFORMANCE OF INDUSTRY CLUSTERS DRIVING IOWA’S ECONOMY
The twelve industry clusters identified as key drivers of Iowa’s economy bring new income into the state
and support economic activity. Nearly all of Iowa’s top fifty private sector businesses, based on
employment size, are found within these industry clusters, including Principal Financial and
Transamerica within insurance and finance; Rockwell Collins in avionics; Pella and HNI Corp. in building
and construction products; John Deere and Winnebago in heavy machinery; CRST International in
transportation, distribution, and logistics; DuPont‐Pioneer and Cargill in the biosciences; CDS Global in
information services and digital media; and a number of hospitals and regional health systems within
healthcare services.
Given the significance of these industry clusters to Iowa’s economy, a comprehensive assessment of the
economic performance of these clusters is critical. Just as the measures of economic success are broad,
so are the measures of economic performance of an industry cluster. Battelle considered many
economic performance measures including:
Relative concentration of the industry cluster – This measures how specialized an industry cluster is in
Iowa relative to the nation, and so gauges “competitive advantage” for the industry cluster in Iowa
relative to the nation. The specific measurement of relative concentration is known as a location
quotient. A location quotient is the share of Iowa’s employment found in a particular industry cluster
divided by the share of total industry employment in that industry cluster for the nation. A location
quotient greater than 1.0 indicates a higher relative concentration, whereas a location quotient of less
than 1.0 signifies a relative underrepresentation. A location quotient greater than or equal to 1.20
denotes employment concentration significantly above the national average, and is considered
“specialized.”
Job generation for the industry cluster – A straightforward measure of whether an industry cluster is
growing is whether it has been gaining or losing jobs in Iowa.
Relative growth of the industry cluster – A measure of whether an industry cluster in Iowa is gaining or
losing competitive share compared to the nation. It is measured as the difference between the
percentage change in employment in an industry cluster in Iowa minus the percentage change in
employment in that same industry cluster for the nation.
Productivity – Comparing the level of productivity of industry clusters in Iowa to their national level
provides insights into whether the state’s industry cluster is more or less productive, and therefore
more or less competitive. Higher levels of productivity in Iowa compared to national levels mean that,
for each job, more economic output is generated; this suggests that the Iowa industry cluster is better
able to make use of advances in technology to produce goods and services and is able to produce more
complex, higher value products. Productivity is measured as the level of economic output per job.
High‐skilled jobs compared to the national average – This is a direct measure of the quality of jobs
offered by an industry cluster. Both high‐skilled and middle‐skilled jobs are considered since each
requires more training and/or education than found simply from a high school degree.

| P a g e 26
Average wages of the industry cluster compared to the nation – Another measure reflecting the overall
quality of jobs found in Iowa’s industry clusters in Iowa is average wages paid. Average wage levels are
measured by taking the total payroll reported by employers and dividing by the number of jobs. These
data are reported by employers to federal and state agencies.
Economic multiplier of the industry cluster – a way to consider the broader economic impact of an
industry cluster’s economic activity on Iowa’s economy. One component of the economic impact of an
industry cluster is the presence of a local supply chain for that industry, often referred to as “indirect"
impacts. A second component is the local income generated by an economic activity. Businesses pay
wages and salaries to their workers, which are translated into local purchases of products ranging from
housing, to medical care to groceries. These local income effects are termed “induced” impacts. Both
the indirect and induced multipliers for each cluster were estimated using the IMPLAN input‐output
model of the inter‐industry purchasing and income effects that occur on the national level.
The key results of this analysis are presented in Table 2 at the end of this section. Several key findings
stand out:
Nine of the 12 industry clusters represent industry specializations in Iowa based on having a
significantly higher concentration of employment relative to the national average. This reflects
the competitive advantages that Iowa offers these industry clusters relative to the nation and
their well‐established presence in Iowa.
Eight of the 12 industry clusters have a higher level of productivity compared to that same
industry cluster nationally. This suggests that it is not simply Iowa’s central location that stands
out for many industries and drives the strong level of industry specialization found in Iowa, but
that Iowa offers a higher value‐added location. Competing on high productivity is critical in
today’s innovation‐driven, global economy. What is particularly special about the industry
clusters driving Iowa’s economic growth is how extensively they outpace the nation, while the
average productivity across all private sector industries in Iowa is 90 percent of the nation.
Eight of the 12 industry clusters generated economic multipliers of more than $500,000 for
every additional $1 million in output they generate. Led by agriculture and food production,
which has an extensive footprint across Iowa and deep supply chain, there are many industry
clusters in Iowa that have substantial economic multiplier impacts on the state’s economy.
Interestingly, the importance of high wages comes through, as the avionics and communications
electronics industry cluster, with the highest average annual wages for the industry clusters in
Iowa, is also among the leaders in economic impact for the state.
Nine of the 12 industry clusters performed better in job changes than the U.S. average for that
industry cluster. This is another sign that Iowa’s industry clusters are more competitive than the
nation. But a sobering reality is that only five of the nine industry clusters performing better
than the U.S. gained jobs above the 2007 pre‐recession level. The other four industries
outpacing the U.S. job growth from 2007–2012, simply declined less in Iowa than across the
nation.

| P a g e 27
Still, Iowa is generally behind the nation in the quality of jobs its industry clusters generate
compared to those same industry clusters nationally. In the share of high‐skilled workers in the
workforce, Iowa leads the nation in only one industry cluster – the building and construction
products cluster. Iowa is considerably far behind the U.S. average share of high‐skilled workers –
5 percentage points or more – in several industry clusters, including information services, heavy
machinery, and transportation and logistics. In the other industry clusters, Iowa is within one to
two percentage points of the national average. Still Iowa’s level of average wages is lower in all
industry clusters except three – heavy machinery, building and construction products and
agriculture and food production.
Taken together, the recent performance of the industry clusters driving Iowa’s economy is quite robust
and positions the state to continue to improve the quality of jobs across the industry clusters.
In terms of future prospects, while past performance of Iowa’s industries matter in considering the
prospects for future growth, it is also critical to consider how the national prospects of the industry
clusters driving Iowa’s economy stand. The U.S. Bureau of Labor Statistics (BLS) prepares a well‐
respected long‐term industry employment projection of national average annual employment growth
over ten year periods. This ten‐year, long‐term industry employment forecast generated by BLS has
been a widely utilized tool for career guidance, educational and training program planning, and studying
long‐range employment trends. The most recent period for which projections are available is for 2012 to
2022.
The news for Iowa on national jobs growth for its industry clusters is not upbeat. Ten of the 12
industry clusters in Iowa are expected to record average annual job growth over the 2012–2022
period of less than 1 percent a year at the national level (see Figure 7). Only the growth of health
services is expected to be fast paced, while building and construction products is expected to exceed the
national average growth for the private sector overall.
The challenge for Iowa is to continue to outpace U.S. growth in its industry clusters in the years ahead
to generate strong economic performance. If Iowa were to grow at these national levels from 201–2022
it would add only slightly more than 42,000 jobs over the next decade. This gain of 42,000 jobs across
Iowa’s leading industry clusters is largely the pace of growth over the 2001–2012 period, which had the
most severe economic recession since the Great Depression ... so not a high standard.
Still, if Iowa can outpace U.S. growth across its leading industry clusters at the same higher rate as it did
over the 2001–2012 period, it would be expected to record a total job gain across its leading industry
clusters of more than 78,000 – so nearly double its expected level of growth (see Figure 8).

| P a g e 28
Figure 7: National Employment Projections for Iowa’s Industry Clusters, Average
Annual Job Growth for 2012–2022.
Source: Battelle analysis of BLS, Industry Employment Projections.
Figure 8: National Employment Projections for Iowa’s Industry Clusters,
Average Annual Job Growth for 2012–2022.

| P a g e 29
The implications for Iowa are significant. Iowa must set its economic development focus on exceeding
the growth levels expected nationally. It can do this by pursuing two specific objectives in advancing the
competitiveness of its industry clusters:
One objective for higher growth is to maintain the more substantial competitiveness of its
existing industry clusters through maintaining and growing Iowa’s higher productivity within
these industries. This will not be easy as each of the existing industry clusters are expected to
generate higher output per employee by 2022 in the national BLS forecasts – so Iowa has to
increase its own pace of growth in productivity to outperform the U.S.
The other objective for Iowa is to realize its potential in growing and emerging markets for each
of its leading industry clusters. This requires a forward‐looking assessment that considers Iowa’s
current and emerging strengths across detailed product markets, as well as an assessment of
core technology competencies identified in Iowa, and how that aligns with potential growth
markets in each industry cluster (see Figure 9). It is these opportunities that differentiate Iowa
and establish a platform from which Iowa can compete on a national and even global scale. A
high level assessment of the line of sight to growth opportunities is presented in Appendix A.
Figure 9: Identifying Iowa’s Growth Opportunities based on Target Product
Markets and State Core.

| P a g e 30
Table 2: Summary of Results of Analysis of Economic Performance of Key Industry Clusters.
Industry Cluster Industry
Specialization Gained
Jobs, 2007–12 Large Economic
Multiplier
Higher Share of High-skilled
Workers than U.S. Higher Average Wages than U.S.
Active in Patent Generation
Higher Productivity Than U.S.
Presence of Emerging
Innovation Firms
Agriculture & Food Production
✔ ✔ ✔ ✔ ✔ ✔ ✔
Automation & Industrial Machinery
✔ ✔ ✔ ✔
Avionics & Comm. Electronics
✔ ✔ ✔ ✔
Biosciences ✔ ✔ ✔ ✔ ✔ ✔
Building & Construction Products
✔ ✔ ✔ ✔ ✔
Health Services ✔ ✔
Heavy Machinery ✔ ✔ ✔ ✔
Info Svcs, Digital Media & Tech
✔ ✔
Insurance & Finance ✔ ✔ ✔
Primary Metals Manufacturing
✔
Renewable Energy ✔ ✔ ✔ ✔ ✔
Transp., Distribution, & Logistics
✔ ✔ ✔

| P a g e 31
Industry Cluster Industry
Specialization Gained
Jobs, 2007–12 Large Economic
Multiplier
Higher Share of High-skilled
Workers than U.S. Higher Average Wages than U.S.
Active in Patent Generation
Higher Productivity Than U.S.
Presence of Emerging
Innovation Firms
Measurement
Location Quotient of Iowa industry employment
concentration relative to U.S.
industry employment
concentration > 1.2 for 2012
Number of Jobs Greater in 2012
than 2007
Greater than $500,000 impact for every $1 million
increase in direct
economic activity, 2012
Based on Iowa and U.S. concentration of employment in high-skilled occupations by industry cluster for 2013
Based on Iowa and U.S. total payroll by industry cluster divided by total industry employment for 2012
More than 100 patents from 2009 to 2013
Based on Iowa and U.S. total industry cluster output divided by total industry employment, 2012
Based on having 10 or more emerging innovation firms as identified from venture capital, federal small business innovation research and state innovation (Demo Fund, etc.) awards

| P a g e 32
KEY FINDINGS ON IOWA’S ECONOMIC FOUNDATIONS
KEY FINDINGS: SKILLED WORKFORCE DEVELOPMENT & BROADER POPULATION DYNAMICS
The stellar performance of Iowa in growing middle‐skilled and high‐skilled jobs is a strong reflection on
how well the overall economy has performed in recent years, despite the severe economic recession
and weak economic recovery. A more detailed examination suggests that the strong gains are found
across a wide number of occupations at both the middle‐skill and higher‐skill levels (see text box).
Still surveys of 395 corporate executives from the twelve industry clusters report significant concerns
regarding workforce availability in Iowa based on the Synchronist survey for the Business Expansion and
Strategic Trends (BEST) tracking effort by Iowa’s economic development community. Across the twelve
industry clusters, two out of every three companies surveyed are experiencing recruitment problems.
Furthermore, while corporate executives in the twelve industry clusters rate workforce productivity at a
healthy 5.5 out of a scale of 1 (low) to 7 (high), workforce availability slips to a rating of only 4.2 and
workforce quality to a rating of 4.8. Nationally, the average workforce availability rating is 4.9,
suggesting just how much tighter labor market conditions are in Iowa.
This persistent concern of employers on the availability of qualified workers was heard by Battelle in its
fieldwork across the state. It suggests that Iowa’s current economic potential is being held back by
shortages of qualified workforce. Employers in the Synchronist surveys commonly identify the following
middle‐ and high‐skilled occupations in high demand with talent shortages in the state: information
technology professionals, particularly in software engineering, web development, and programming;
engineers; senior management/executive level talent; welders; and CNC machinists.
Iowa Workforce Development (IWD) conducts annual employer surveys to understand vacancies and
workforce needs. In a unique Hiring Demand Index metric developed by IWD, they adjust vacancy rates
for employee turnover to better understand occupations in high‐demand. This index identifies a number
of broad high‐ and middle‐skilled occupational groups with the highest unmet needs for workers
including architecture and engineering; computer science; personal care; healthcare support; and
production occupations.13
The key question is how well is Iowa generating and attracting the workforce to meet industry demand.
The data suggest a mixed picture of Iowa’s standing over time:
Iowa began the 21st Century ahead of the nation in middle‐skilled levels of education involving
some college and associate degrees of its workforce (for the population 25 years and older), but
behind the nation in educational attainment for higher‐skilled jobs involving bachelor’s and
graduate degrees.
13 Iowa Workforce Development, “Workforce Needs Assessment,” April 2013.

| P a g e 33
IOWA’S SKILLED WORKFORCE MAKING SIGNIFICANT GAINS
Iowa’s successes in creating and filling significant jobs for its skilled workers are well outpacing the national average, as established earlier in this report. Further, these job gains in middle‐ and high‐skilled occupations are not just among a handful of job categories, but are impressive in the range of occupational groups and skill sets that are demonstrating high‐growth—growing in Iowa and outpacing national growth rates over the past decade (see Table 3 below).
So what is considered a middle‐ or high‐skilled job? Battelle uses an approach for identifying occupational skill levels based on federal classifications of minimum educational attainment levels required for entry into individual occupations and occupational groups.
Middle‐skilled occupations: Requiring significant education, experience, and/or training beyond high school but less than a bachelor’s,* includes:
High School Diploma + Moderate to Long‐Term On‐the‐job Training
High School Diploma + Apprenticeship
Postsecondary non‐degree award
Some College, no degree
Associate’s Degree
High‐Skilled Occupations: Generally requiring bachelor’s & higher degrees
Table 3: Middle‐ and High‐Skilled Occupations and Job Growth Relative to the U.S., 2004–2013.
High‐Skilled Occupational Groups Middle‐Skilled Occupational Groups
Occupations
IA Growth Exceeding U.S.,
2004–13 Occupations
IA Growth Exceeding U.S.,
2004–13
Physical Scientists Legal Support Life Scientists Healthcare Support Postsecondary Teachers Other Education, Training, & Library Health Diagnosing & Treating Sales Life Science Technicians Transportation & Material Moving Computer‐Related Installation, Maintenance, & Repair Engineering Technicians Arts, Design, & Entertainment Management Personal Care & Service
Arts, Design, & Entertainment Health Technologists & Technicians
Community & Social Services Health Diagnosing & Treating
Engineers Production
Other Health Related Drafters & Mapping Technicians
K‐12 Teachers Protective Service
Business & Financial Operations Office & Administrative Support
Social Scientists Construction & Extraction
Medical & Clinical Lab Technicians
Math Science
Personal Care & Service
Sales
Other Education, Training, & Library
Source: Battelle analysis of Bureau of Labor Statistics, Occupational Employment Statistics Data; data shown for skilled groups with at least 1000 jobs.
*Note: Battelle takes a more refined or focused approach to identifying middle‐skilled workers by requiring that those jobs requiring a High School diploma only have at least a requirement for an apprenticeship and/or moderate or long‐term on the job training; those jobs requiring a High School diploma and short‐term training only have been designated as low‐skilled. This is a more stringent requirement than that used in many analyses of the middle‐skilled workforce.

| P a g e 34
Over the last decade, Iowa has generally raised the level of educational attainment of its
workforce, but continued this pattern of outpacing the nation in growth in middle‐skill levels of
educational attainment and slightly lagging the nation in the growth of higher‐skilled bachelor’s
and graduate degree holders in the workforce.
The result is that by 2012, Iowa’s overall workforce remains strong at middle‐skilled education levels
involving some college to associate degrees, but continuing to fall further behind the nation in higher‐
skilled education levels (see Figure 10).
Figure 10: Educational Attainment of the Population Ages 25 and Over, 2012.
Source: U.S. Census Bureau, American Community Survey.
A critical factor in the generation of a skilled workforce is how well Iowa’s educational system is doing in
generating graduates, especially for workers in science, technology, engineering and math skills, often
referred to as “STEM” fields. Iowa has made significant, strong gains in its STEM‐related degree
graduates (up 31 percent since 2009, see Table 4).
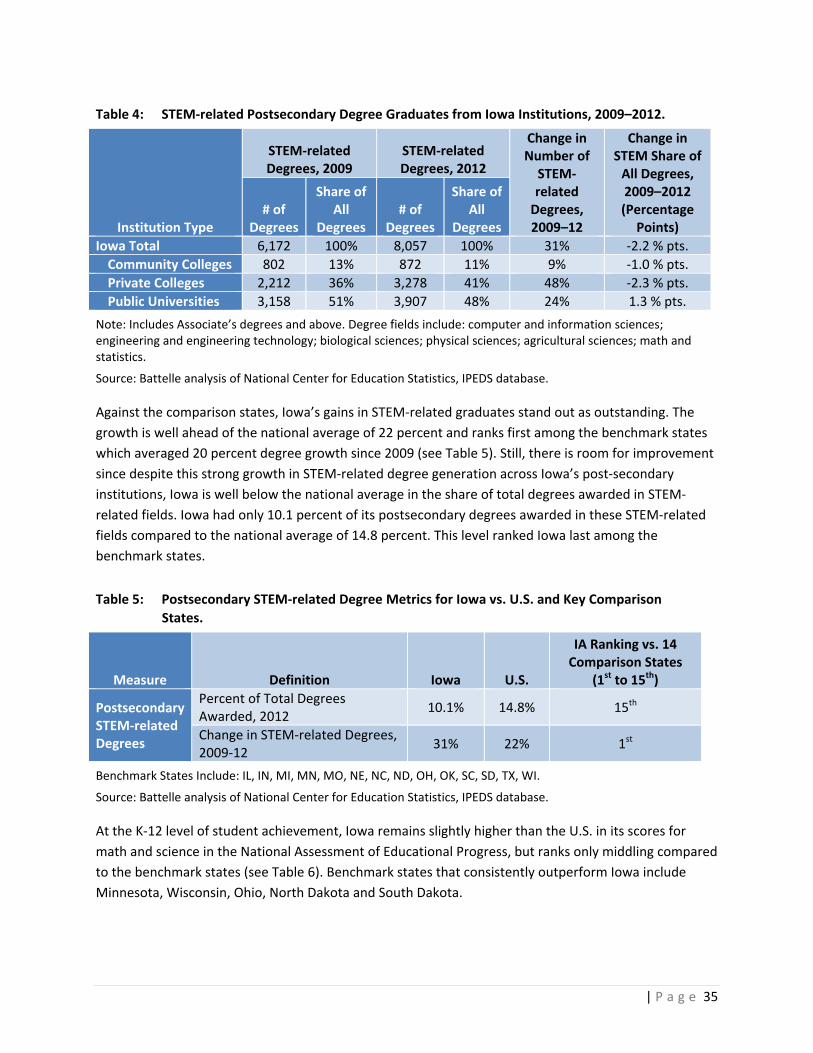
| P a g e 35
Table 4: STEM‐related Postsecondary Degree Graduates from Iowa Institutions, 2009–2012.
Institution Type
STEM‐related Degrees, 2009
STEM‐related Degrees, 2012
Change in Number of STEM‐related Degrees, 2009–12
Change in STEM Share of All Degrees, 2009–2012 (Percentage
Points) # of
Degrees
Share of All
Degrees # of
Degrees
Share of All
Degrees
Iowa Total 6,172 100% 8,057 100% 31% ‐2.2 % pts.
Community Colleges 802 13% 872 11% 9% ‐1.0 % pts.
Private Colleges 2,212 36% 3,278 41% 48% ‐2.3 % pts.
Public Universities 3,158 51% 3,907 48% 24% 1.3 % pts.
Note: Includes Associate’s degrees and above. Degree fields include: computer and information sciences; engineering and engineering technology; biological sciences; physical sciences; agricultural sciences; math and statistics.
Source: Battelle analysis of National Center for Education Statistics, IPEDS database.
Against the comparison states, Iowa’s gains in STEM‐related graduates stand out as outstanding. The
growth is well ahead of the national average of 22 percent and ranks first among the benchmark states
which averaged 20 percent degree growth since 2009 (see Table 5). Still, there is room for improvement
since despite this strong growth in STEM‐related degree generation across Iowa’s post‐secondary
institutions, Iowa is well below the national average in the share of total degrees awarded in STEM‐
related fields. Iowa had only 10.1 percent of its postsecondary degrees awarded in these STEM‐related
fields compared to the national average of 14.8 percent. This level ranked Iowa last among the
benchmark states.
Table 5: Postsecondary STEM‐related Degree Metrics for Iowa vs. U.S. and Key Comparison
States.
Measure Definition Iowa U.S.
IA Ranking vs. 14 Comparison States
(1st to 15th)
Postsecondary STEM‐related Degrees
Percent of Total Degrees Awarded, 2012
10.1% 14.8% 15th
Change in STEM‐related Degrees, 2009‐12
31% 22% 1st
Benchmark States Include: IL, IN, MI, MN, MO, NE, NC, ND, OH, OK, SC, SD, TX, WI.
Source: Battelle analysis of National Center for Education Statistics, IPEDS database.
At the K‐12 level of student achievement, Iowa remains slightly higher than the U.S. in its scores for
math and science in the National Assessment of Educational Progress, but ranks only middling compared
to the benchmark states (see Table 6). Benchmark states that consistently outperform Iowa include
Minnesota, Wisconsin, Ohio, North Dakota and South Dakota.

| P a g e 36
Table 6: Achievement in Math and Science for Iowa 8th Graders vs. U.S. and Key Comparison
States.
Measure Definition Iowa U.S.
IA Ranking vs. 14 Comparison States
(1st to 15th)
K‐12 Student Achievement
NAEP Tests, 8th Grade Math, Avg. Score 2011
285 283 9th
NAEP Tests, 8th Grade Science, Avg. Score 2011
157 151 6th
Benchmark States Include: IL, IN, MI, MN, MO, NE, NC, ND, OH, OK, SC, SD, TX, WI.
Source: National Center for Education Statistics, National Assessment of Educational Progress.
Another factor shaping skilled workforce availability is the ability to retain and attract workers. A close
look at recent population dynamics suggests some glimmers of hope in population migration, but even
greater concerns on whether Iowa has the population growth to generate needed workforce in future
generations.
In recent years, Iowa has had a positive net in‐migration from other states, albeit only small numbers.
Iowa is doing especially well in attracting net in‐migration of workers with a bachelor’s degree or higher
(see Figure 11). This likely reflects the strong growth in high‐skilled jobs as a magnet for population
growth.
Figure 11: Domestic In‐ and Out‐Migration of College Educated Population Ages 25
to 54, 2007 to 2012.
Source: Battelle analysis of U.S. Census Bureau, American Community Survey.

| P a g e 37
One other source of population migration is from foreign immigrants. From 2000 to 2012 Iowa well
outpaced the national growth, though from a small base that in 2012 still remains well below the U.S.
average. Foreign immigrants to Iowa fall on the extremes of workforce skill levels with 32 percent of
those foreign born adults in Iowa having less than a high school education and 14 percent having a
graduate or professional degree.
The troubling issue for Iowa is its population growth (see Figure 12). From 2000 to 2012, Iowa grew a
scant 5.1 percent in population compared with 11.5 percent for the U.S. Across all age groups Iowa
declined, but perhaps the most troubling is the nearly flat growth in population among Iowa’s youngest
population group, 24 and younger which grew a meager 0.5 percent from 2001 to 2012. Growing a
young population depends upon retaining and attracting families to Iowa – which given the presence of
a good quality of life and growing middle‐ and high‐skilled jobs would seem to be achievable for Iowa.
Figure 12: Population Changes by Age, Iowa and U.S., 2000–2012.
Source: Battelle analysis of U.S. Census Bureau, American Community Survey.
Yet, two regions of the state show it is possible for Iowa to generate high levels of population growth.
Both the Greater Des Moines region and the Greater Cedar Rapids‐Iowa City region have not only gained
population in all age groups, but outpaced the national average gains recorded from 2000 to 2012 (see
Figure 13).

| P a g e 38
Figure 13: Population Changes for Iowa’s High‐Growth Regions, 2000–2012.
Source: Battelle analysis of U.S. Census Bureau, American Community Survey.
The combination of industry concerns about skilled workforce availability and the population growth,
especially among young residents not yet in the workforce, suggests that Iowa has both a near‐term and
longer‐term problem with generating the needed skilled workforce. While there are positive signs in
attracting skilled workers to Iowa and in generating more STEM‐related graduates, the scale of these
positive trends needs to be significantly raised and there is still room for improvement for Iowa.
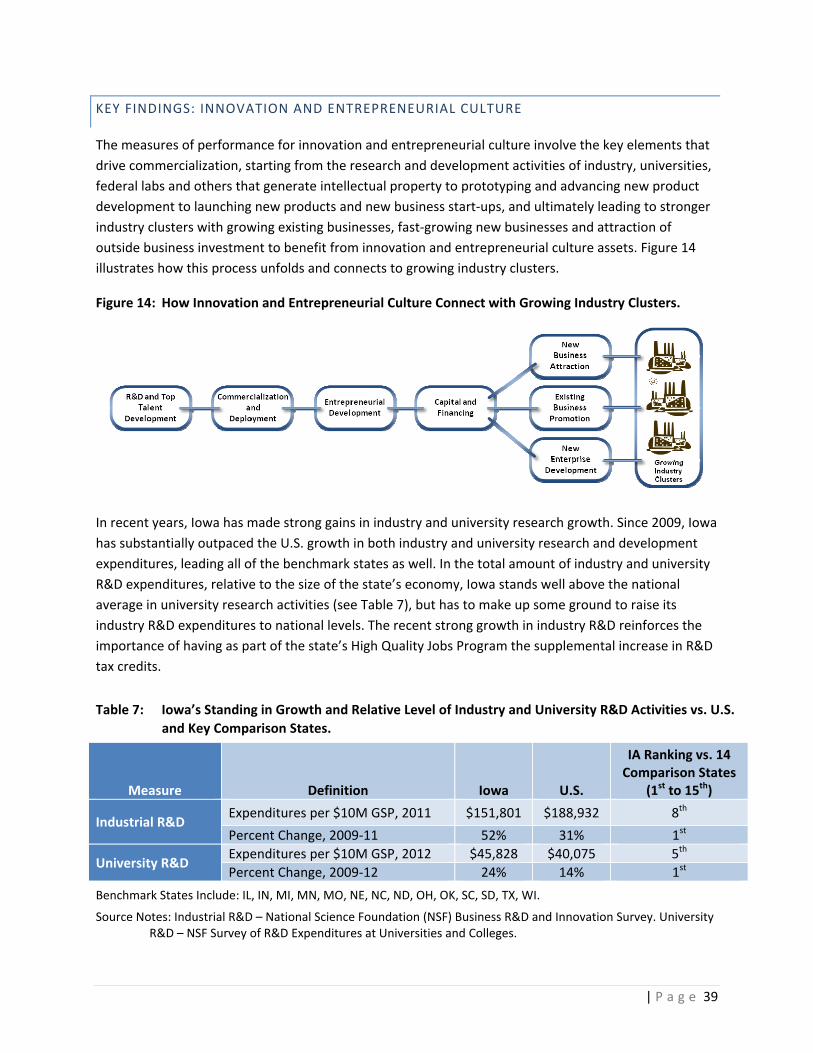
| P a g e 39
KEY FINDINGS: INNOVATION AND ENTREPRENEURIAL CULTURE
The measures of performance for innovation and entrepreneurial culture involve the key elements that
drive commercialization, starting from the research and development activities of industry, universities,
federal labs and others that generate intellectual property to prototyping and advancing new product
development to launching new products and new business start‐ups, and ultimately leading to stronger
industry clusters with growing existing businesses, fast‐growing new businesses and attraction of
outside business investment to benefit from innovation and entrepreneurial culture assets. Figure 14
illustrates how this process unfolds and connects to growing industry clusters.
Figure 14: How Innovation and Entrepreneurial Culture Connect with Growing Industry Clusters.
In recent years, Iowa has made strong gains in industry and university research growth. Since 2009, Iowa
has substantially outpaced the U.S. growth in both industry and university research and development
expenditures, leading all of the benchmark states as well. In the total amount of industry and university
R&D expenditures, relative to the size of the state’s economy, Iowa stands well above the national
average in university research activities (see Table 7), but has to make up some ground to raise its
industry R&D expenditures to national levels. The recent strong growth in industry R&D reinforces the
importance of having as part of the state’s High Quality Jobs Program the supplemental increase in R&D
tax credits.
Table 7: Iowa’s Standing in Growth and Relative Level of Industry and University R&D Activities vs. U.S.
and Key Comparison States.
Measure Definition Iowa U.S.
IA Ranking vs. 14 Comparison States
(1st to 15th)
Industrial R&D Expenditures per $10M GSP, 2011 $151,801 $188,932 8th
Percent Change, 2009‐11 52% 31% 1st
University R&D Expenditures per $10M GSP, 2012 $45,828 $40,075 5th
Percent Change, 2009‐12 24% 14% 1st
Benchmark States Include: IL, IN, MI, MN, MO, NE, NC, ND, OH, OK, SC, SD, TX, WI.
Source Notes: Industrial R&D – National Science Foundation (NSF) Business R&D and Innovation Survey. University R&D – NSF Survey of R&D Expenditures at Universities and Colleges.

| P a g e 40
Given the strength of Iowa in its university research and development activities, this is clearly an area
where Iowa can reap a significant advantage if it can effectively commercialize that university research
activity. The overall statewide totals in technology transfer from Iowa’s total university research base of
$784 million in 2012 are sizable with 216 disclosures, 160 patent applications, 73 licenses and options
executed, 5 start‐ups and licensing income of more than $17 million. Each of Iowa’s research universities
can also point to specific success stories and good performance on individual metrics. Comparing Iowa
as a state to other Midwestern states (see Table 8), normalizing for the size of each state’s research
base, Iowa is not the best, nor is it the worst on most measures, except for one noticeable outcome
measure of technology transfer – start‐up businesses leveraging patented university technologies.
Table 8: Iowa’s Standing in Statewide Technology Transfer Performance Across All Research
Universities, Compared to other Midwestern States, Normalized by Size of State
University Research Base, 2012.
State
Activity per $10M of University Research Conducted
Disclosures Received
Start‐ups Initiated
Patent Applications Total Filed
U.S. Patents Issued
Licenses/ Options Executed
License Income, Gross
Received
IA 2.75 0.06 2.04 0.61 0.93 $221,164
IL 3.37 0.10 3.50 1.00 0.76 $758,190
IN 5.02 0.18 6.03 0.60 1.01 $97,423
MI 2.87 0.08 2.43 0.74 0.82 $87,544
MN 3.78 0.14 1.89 0.69 0.88 $537,236
MO 3.23 0.12 2.28 0.58 1.20 $127,189
ND 3.69 0.07 2.73 0.96 5.17 $157,441
NE 6.71 0.20 4.08 0.71 1.47 $241,168
OH 4.42 0.12 3.41 0.59 0.56 $97,471
SD 9.78 0.00 2.98 0.14 0.71 $519,992
WI 3.25 0.04 2.16 1.18 0.55 $296,753
Source: Association of University Technology Managers, Licensing Activity Survey.
Holding back university efforts in commercializing its technology is the lagging performance of Iowa in
new business start‐up activity. From measures of entrepreneurial activity in the population to new
company birth rates to job creation by new businesses to the presence of fast growing private
companies, Iowa is well off the national pace and compares poorly to the benchmark states (see Table
9). While much work has been done to advance Iowa’s innovation and entrepreneurial culture across
Iowa’s regions, universities and state economic development efforts over the past 10 to 15 years, and
individual program results are promising, the results are clear that at the scale of the state’s economy
the imperative for continuing to advance Iowa’s entrepreneurial culture and support systems is critical.
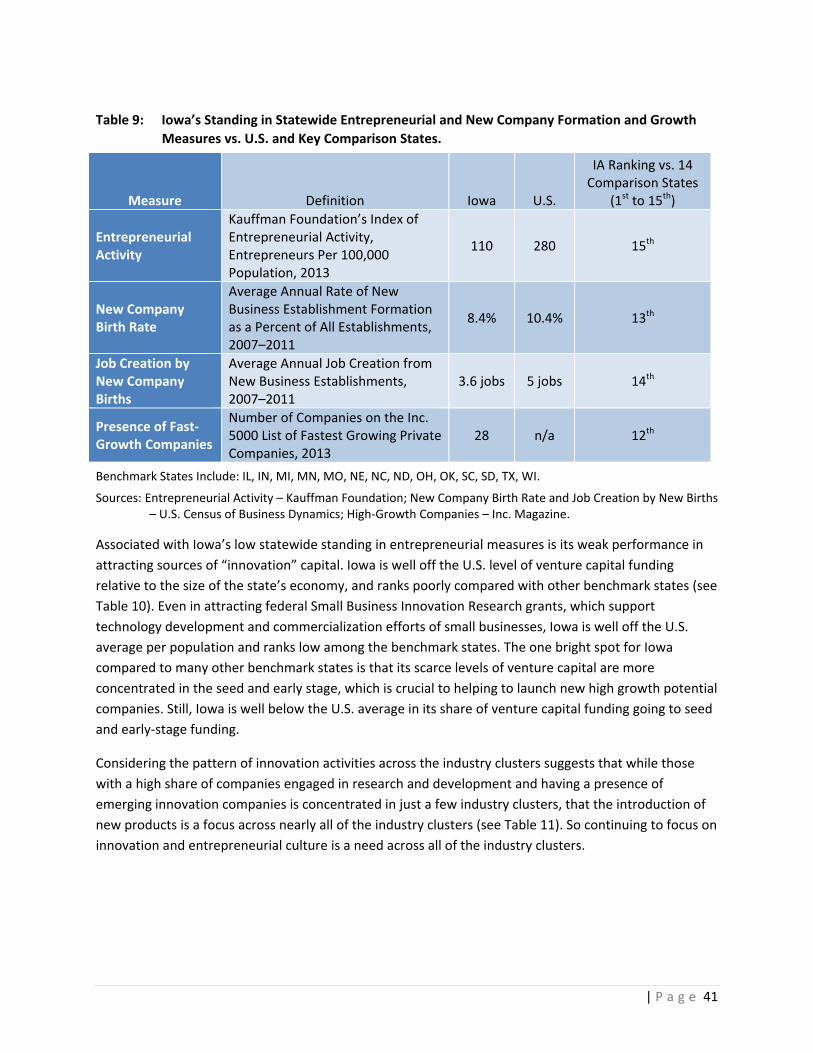
| P a g e 41
Table 9: Iowa’s Standing in Statewide Entrepreneurial and New Company Formation and Growth
Measures vs. U.S. and Key Comparison States.
Measure Definition Iowa U.S.
IA Ranking vs. 14 Comparison States
(1st to 15th)
Entrepreneurial Activity
Kauffman Foundation’s Index of Entrepreneurial Activity, Entrepreneurs Per 100,000 Population, 2013
110 280 15th
New Company Birth Rate
Average Annual Rate of New Business Establishment Formation as a Percent of All Establishments, 2007–2011
8.4% 10.4% 13th
Job Creation by New Company Births
Average Annual Job Creation from New Business Establishments, 2007–2011
3.6 jobs 5 jobs 14th
Presence of Fast‐Growth Companies
Number of Companies on the Inc. 5000 List of Fastest Growing Private Companies, 2013
28 n/a 12th
Benchmark States Include: IL, IN, MI, MN, MO, NE, NC, ND, OH, OK, SC, SD, TX, WI.
Sources: Entrepreneurial Activity – Kauffman Foundation; New Company Birth Rate and Job Creation by New Births – U.S. Census of Business Dynamics; High‐Growth Companies – Inc. Magazine.
Associated with Iowa’s low statewide standing in entrepreneurial measures is its weak performance in
attracting sources of “innovation” capital. Iowa is well off the U.S. level of venture capital funding
relative to the size of the state’s economy, and ranks poorly compared with other benchmark states (see
Table 10). Even in attracting federal Small Business Innovation Research grants, which support
technology development and commercialization efforts of small businesses, Iowa is well off the U.S.
average per population and ranks low among the benchmark states. The one bright spot for Iowa
compared to many other benchmark states is that its scarce levels of venture capital are more
concentrated in the seed and early stage, which is crucial to helping to launch new high growth potential
companies. Still, Iowa is well below the U.S. average in its share of venture capital funding going to seed
and early‐stage funding.
Considering the pattern of innovation activities across the industry clusters suggests that while those
with a high share of companies engaged in research and development and having a presence of
emerging innovation companies is concentrated in just a few industry clusters, that the introduction of
new products is a focus across nearly all of the industry clusters (see Table 11). So continuing to focus on
innovation and entrepreneurial culture is a need across all of the industry clusters.

| P a g e 42
Table 10: Iowa’s Standing in Statewide Levels of Innovation Capital vs. U.S. and Key Comparison
States.
Measure Definition Iowa U.S.
IA Ranking vs. 14 Comparison States
(1st to 15th)
Venture Capital Investments
VC Investments per $10M GSP, 2007‐Q3:2013
$19,825 $200,459 13th
VC Investments in Seed & Early Stage Companies as a Share of Total, 2007‐Q3:2013
12% 18% 6th
Federal SBIR Awards
SBIR Awards per 10,000 population, Avg. 2009–2012
$18,885 $72,343 14th
Benchmark States Include: IL, IN, MI, MN, MO, NE, NC, ND, OH, OK, SC, SD, TX, WI.
Sources: VC – Battelle analysis of Thomson Reuters Thomson One database. SBIR Awards – Battelle analysis of Small Business Innovation Research (SBIR) Federal database (sbir.gov).
Table 11: Innovation Activities of Iowa’s Industry Clusters.
Iowa Industry Cluster
Synchronist: Conducting
R&D Activity*
Presence of Emerging
Companies**
Synchronist: Anticipated New Product
Development***
Agriculture & Food Production 52% 11 76%
Automation & Industrial Machinery 53% 16 74%
Avionics & Communications Electronics
33% 8 73%
Biosciences & Health Services 57% 40 80%
Building & Construction Products 37% 2 69%
Heavy Machinery 57% 8 60%
Information Services, Digital Media & Technology
62% 40 89%
Insurance & Finance 16% 2 64% Primary Metals Manufacturing n/a 7 n/a Renewable Energy n/a 14 n/a
Transportation, Distribution, & Logistics
33% 0 65%
Source: Battelle analysis of Synchronist Site Visit Responses for Iowa Establishments.
* Battelle calculation from Synchronist Question on whether companies conduct R&D.
** Based on Battelle identification of emerging innovation companies receiving VC funding, SBIR funding or State Demo/Acceleration funding.
*** Synchronist Question: Are new products/services anticipated in next two years? Share responding “yes” noted.

| P a g e 43
KEY FINDINGS: PHYSICAL INFRASTRUCTURE
The two principal areas of concern regarding Iowa’s physical infrastructure for economic development
are the condition of its freight transportation system and its broadband communications infrastructure.
In freight transportation, Iowa has a well‐developed system, with a significant presence of interstate
highways and significant rail access across the state. Iowa particularly stands out in its strong presence
of rail miles and number of Class 1 rail carriers, and is slightly ahead of the nation in presence of
interstate miles given the size of the state (see Table 12). This extensive network for freight
transportation is a critical enabler for exporting Iowa’s agricultural and manufacturing goods, and has
supported the sizable and growing transportation, distribution and logistics industry cluster in the state,
which reached an employment level in Iowa of 108,418 jobs in 2012.
Table 12: Iowa’s Standing in Freight Transportation System vs. U.S. and Key Comparison States.
Measure Definition Iowa U.S.
IA Ranking vs. 14 Comparison States
(1st to 15th)
Highway Access Interstate Miles per 1,000 sq. miles, 2012
14.0 13.3 8th
Rail Access Rail Miles per sq. mile, 2011 69 39 5th
Number of Rail Carriers (Class 1/Total), 2011
5/15 7/566 n/a
Benchmark States Include: IL, IN, MI, MN, MO, NE, NC, ND, OH, OK, SC, SD, TX, WI.
Sources: Highway Access – U.S. Department of Transportation, Federal Highway Administration. Rail Access – Association of American Railroads.
Despite Iowa’s well‐developed freight transportation system, the Synchronist survey of industry
executives reveals frequent concern about need for highway improvements. It was rated as one of the
most serious economic development weaknesses found in Iowa, just behind the availability of skilled
workforce. Furthermore, the American Society of Civil Engineers’ in their 2013 report card for America’s
infrastructure found that 46 percent of Iowa’s major roads are in poor or mediocre condition compared
to 32 percent nationally and 21 percent of Iowa’s bridges are considered structurally deficient compared
to 11 percent nationally, based on data from the U.S. Federal Highway Administration.
Turning to broadband adoption and infrastructure capabilities, Iowa continues to make gains in
adoption of broadband both for businesses and homes across the state. Recent survey results of
residents and businesses by Connect Iowa provide a current and in‐depth perspective on Iowa’s
situation, which is essential in this fast moving arena of broadband infrastructure. For businesses in
Iowa, broadband adoption has increased from 72 percent in 2010 to 81 percent in 2014. For homes in
Iowa, broadband adoption has increased from 66 percent in 2010 to 76 percent in 2013 – which is on
par with national averages.
Still, there are significant concerns about the speed and reliability of Iowa’s broadband connections.
For businesses in Iowa that use broadband, the most frequently used access is through slower access
DSL service, involving 38 percent of Iowa’s businesses. By contrast, only 19 percent of Iowa’s businesses

| P a g e 44
access their broadband from fast fiber optic connections. Thirty one percent of businesses surveyed —
13,000 businesses in all – that want higher broadband speeds cannot get it at their current locations.
Even more disconcerting is that only 21 percent of Iowa businesses have redundant services, making
their business operations vulnerable to stoppages due to downtime in service. Among Iowa’s homes,
fast internet speeds of 50 to 100 mbps fail to reach 29 percent to 40 percent of Iowa homes in 2014. In a
2012 Connected Nation report on “broadband readiness,” 85 Iowa counties received a grade of “C” or
below, meaning that less than 70 percent of the households could access speeds of 3 mbps in
downloading.
Business leaders have expressed concerns about the availability of state economic development funding
and incentives to target the build out of broadband capacity to serve the existing business base of Iowa.
Issues from increased broadband access points to last mile connections to redundancy and reliability of
service top the concerns, not only for rural areas of Iowa where many highly connected businesses are
located, but for Iowa’s larger cities as well.
A third area of physical infrastructure concern, based on Battelle’s site visits to Iowa’s smaller
communities, arose relating to the need for more livable communities for retaining and attracting
young families. While it is difficult to assemble statewide data on this issue, economic development
stakeholders in the many smaller communities that Battelle visited expressed concerns that despite the
availability of jobs, Iowa’s smaller communities were not able to retain and attract young families. These
economic development stakeholders point to the lack of quality, affordable housing and amenities, such
as family‐oriented services and destination retail services, as holding back the attractiveness of these
communities to workers and their families.
| P a g e 45
KEY FINDINGS: BUSINESS CLIMATE
A range of factors contribute to industry perceptions of a state’s business climate. Some in industry look
solely to the government’s approach to taxation or the cost of doing business, while others may focus
on regulations that directly impact their industry or line of business, and still others may form views
based on workforce availability, quality of life, or access to capital. These factors and attitudes of
industry all combine to form high‐stakes perceptions regarding the overall business climate.
In the analysis and statewide discussions conducted in the course of this strategic effort, the overall
business climate has not emerged as a major concern for Iowa. There have been, however, certain
aspects of the climate raised as specific challenges, including workforce and talent quality and supply as
well as physical infrastructure deficiencies that lead to a somewhat mixed satisfaction arising out of the
Synchronist site visits and discussions with stakeholders. These challenges are being examined in‐depth
and addressed as strategic priorities for Iowa, in their own respective sections of this report.
The rankings of comprehensive studies on business climate – such as from CNBC and Forbes – suggest
Iowa is in the upper tier of states in its business climate, with both ranking Iowa 12th across all measures
of business climate. In particular, Iowa has consistently ranked among the top 10 states for the cost of
doing business which considers tax burdens as well as utilities, labor, and commercial real estate costs;
and for being “business friendly,” a metric which assesses the regulatory framework and legal
environment for business. Still, it is important to note that Iowa receives more middling or lagging marks
for its workforce, infrastructure, technology and innovation, and access to capital—all areas in which
this strategic effort is addressing through distinct strategies and actions. Plus in the area of taxes the Tax
Foundation rates Iowa as 40th in the nation overall in its 2014 State Business Tax Climate Index, and 49th
in its corporate tax sub‐index. The structure and rates of Iowa’s corporate income tax is the key reason
why it fares so poorly on the corporate tax sub‐index, since it adds complexity and uncertainty on
business taxation. A separate study by Deloitte Consulting LLP for the Iowa Chamber Association
calculated a tax complexity measure based on tax structure and rates across major state taxes and
found that Iowa was among the bottom tier of states. This attribute of tax complexity was found to have
a moderate correlation with investment and job creation measures of economic development success,
so can impact a state’s business climate.
Just as industries compete for market share, talent, and capital, states operate in a very competitive
market for business attraction, retention, and expansion and Iowa has established several key policies
perceived as business‐friendly, including:
Establishing a single‐factor corporate income tax based only on the share of total sales income
within the state
Charging no sales or use taxes on purchases of industrial machinery, equipment, and computers
used for manufacturing in Iowa
Bolstering innovation by offering a refundable R&D tax credit
Enacting “right‐to‐work” legislation limiting collective bargaining
Establishing a range of economic development programs offering tax credits and other
incentives for workforce training and development, for expanding employment in high‐quality
jobs, or for innovative product development.

| P a g e 46
While objective measures place Iowa among the top tiers with respect to business climate, Iowa
employers report mixed satisfaction with the business climate in recent site visits and surveys. In the
Synchronist site visit information (see Table 13), Iowa business executives in the leading industry
clusters that drive the state’s economy report a high satisfaction with the overall business climate and
quality of life in Iowa; however, a majority are concerned about higher costs of doing business. These
views of Iowa’s business executives in the leading industry clusters are quite consistent with those of all
business executives in the state.
Table 13: Iowa Industry Cluster Employer Insights into Business Climate
Factors, Synchronist Site Visits, 2011–2013.
Themes & Topics Viewed as
Positive/Favorable Viewed as Negative
Business Climate 60% 40%
Cost of Doing Business 36% 64%
Quality of Life 80% 20%
Source: Battelle analysis of Synchronist Site Visit Surveys; responses limited here to industry cluster companies only.
Countering these concerns regarding higher cost of doing business are facts regarding lower average
utility rates. Commercial and industrial utility rates in Iowa are not only well below the U.S. average, but
very competitive across the 14 key comparison states (see Table 14). Iowa employers may, however, be
concerned about the overall tax burden, considered to be among the highest across all states.
Table 14: Selected Business Cost Components for Iowa vs. U.S. and Key Comparison States.
Measure Definition Iowa U.S.
IA Ranking vs. 14 Comparison States
(1st to 15th)
Utility Rates* Commercial Rates, Cents/kilowatt hour, 2012
8.01 10.09 3rd
Industrial Rates, Cents/kilowatt hour, 2012
5.30 6.67 2nd
Tax Climate State Business Tax Climate Index, 2014 (1=lowest burden) 40th n/a 12th
Benchmark States Include: IL, IN, MI, MN, MO, NE, NC, ND, OH, OK, SC, SD, TX, WI.
Sources: Utility rates—U.S. Energy Information Administration (*lower rates get a higher ranking); Tax Climate—Tax Foundation.
Overall, Iowa’s business climate is viewed positively in both quantitative and qualitative assessments.
There remain, however, specific aspects of doing business in Iowa that are clear challenges and are
addressed as strategic priorities in this roadmap for Iowa.

| P a g e 47
STRATEGIC PRIORITIES FOR ADVANCING IOWA’S ECONOMY
At a time when many state and regional economies across the nation have struggled, Iowa over the last
decade, and even since the severe recession of 2008–2009, has demonstrated significant economic
strengths in growing high‐quality jobs and raising average wages and per capita income based on the
diverse and competitive base of leading industry clusters driving Iowa’s economy. While this economic
success is well‐earned, Iowa cannot afford to be complacent about its economic development prospects
going forward. Strong future growth of Iowa’s leading industry clusters is not guaranteed and Iowa’s
development resources need to be strengthened to meet the rising performance bar being set across
the nation to compete in today’s global, knowledge‐based economy.
The following four strategic priorities are critically important for seizing the opportunities and
addressing the challenges that Iowa confronts in generating a higher‐performing economy able to
generate a rising standard of living for Iowans over the next ten years.
Strategic Priority One: Build on the Competitiveness and Growth of Iowa’s Industry Clusters through
Innovation, Retention and Attraction. Despite Iowa’s leading industry clusters outperforming the nation
in their level of specialization, job growth and productivity, there are concerns looking forward. With the
fast pace of technological change and increased global competition for high‐value, high‐skilled
production, the performance bar for maintaining industry competitiveness is constantly on the rise in
today’s global, knowledge‐based economy. More specific for Iowa is that its mix of leading industry
clusters driving its economy are not expected at the national level to be strong job generators over the
next ten years. Ten of the 12 industry clusters in Iowa are expected to record average annual job growth
over the 2012–2022 period of less than 1 percent a year at the national level. So for Iowa to generate
strong economic growth in the years ahead it will be challenged to continue to outpace U.S. growth in
its leading industry clusters by continuing to raise productivity and pursue high growth market
opportunities where there is a line of sight to Iowa’s existing and emerging core competencies and
specific industry strengths.
Strategic Priority Two: Generate and Attract Skilled Workforce in Demand by Iowa’s Businesses. In
today’s global, knowledge‐based economy, states and their local communities are increasingly
competing based on their ability to educate, train, and recruit a qualified workforce that meets the
needs of industry. Even as middle and high‐skilled jobs grow in Iowa, the availability of a skilled
workforce is a major area of concern to Iowa businesses. Combined with Iowa’s weak population
growth, this workforce problem is likely to plague Iowa for many years to come. While there are positive
signs in attracting skilled workers to Iowa and in generating more STEM‐related graduates at the post‐
secondary level, the scale of these positive trends needs to be significantly raised and there is still room
for improvement for Iowa.
Strategic Priority Three: Accelerate the Development of Iowa’s Emerging Entrepreneurial Eco‐System.
Advancing a state’s overall position in innovation and entrepreneurial culture is more like a marathon
than a sprint. Iowa, like many states in the Midwest, has the research and technological assets necessary
for advancing innovation in today’s knowledge‐based economy, but lacks the deep‐rooted

| P a g e 48
entrepreneurial culture and support system essential to realizing the growth potential of technology‐
based start‐ups.
In recent years, Iowa has made strong gains in industry and university research growth. Most notable is
that the size of Iowa’s university research activities is well above the national average, controlling for
the size of the economy. Given the strength of Iowa in its university research and development
activities, this is clearly an area where Iowa can reap a significant advantage if it can more effectively
commercialize that university research activity. Currently, Iowa’s university technology transfer and
commercialization activities are sizable, but there is room for improvement even compared to other
Midwestern states.
Holding back university efforts in commercializing its technology is the lagging performance of Iowa’s
overall entrepreneurial culture. From measures of entrepreneurial activity in the population to new
company birth rates to job creation by new businesses to the presence of fast growing small companies,
Iowa is well off the national pace and compares poorly to benchmark states. While much work has been
done to advance Iowa’s innovation and entrepreneurial culture across Iowa’s regions, universities and
state economic development efforts over the past 10 to 15 years, and individual program results are
promising, the results are clear that at the scale of the state’s economy the imperative for continuing to
advance Iowa’s entrepreneurial culture and support system is critical.
Strategic Priority Four: Advance Iowa’s Physical Infrastructure and Regional Development Capacities
to Realize Iowa’s Economic Potential. Physical infrastructure remains a prerequisite for economic
development. The condition of Iowa’s freight transportation system and broadband communications
infrastructure is raising substantial concerns across the business community in Iowa. The declining
condition of Iowa’s highways and fall‐off in available highway improvement funding through the existing
gas tax is now among the top concerns of industry executives across the state. At the same time,
significant concerns about the speed and reliability of Iowa’s broadband infrastructure have been
identified that directly impact industry. Nearly one‐third of Iowa businesses surveyed by Connect Iowa –
13,000 businesses in all – want higher broadband speeds that cannot be supported at their current
locations. Even more disconcerting is that only 21 percent of Iowa businesses have redundant
broadband services, making their business operations vulnerable to stoppages due to downtime in
service. And a third physical infrastructure concern relating to the need for more livable communities to
retain and to attract young families is frequently noted by regional economic development stakeholders
across Iowa’s smaller communities.

| P a g e 49
FROM STRATEGIES TO ACTIONS
Detailed actions are proposed to address the strategic priorities critically important for Iowa’s future
economic prosperity. In developing these actions, careful consideration was taken to identify specific
gaps or enhancements needed in Iowa’s current mix of economic development activities across the
strategic priorities. Iowa was benchmarked against other states to provide insights into what works and
how to implement similar programs and initiatives in Iowa.
In developing the action plan, specific tactics were identified that are highly achievable and complement
Iowa’s existing economic development activities. Many of these tactics have benefited from ongoing
discussion and analysis in recent years by Iowa’s many economic development stakeholders. Now a
consensus on how to move forward has clearly been identified.
In addition to “tactics” which represent specific actions that can be taken in the short term, for each
strategic priority there are “strategic directions” proposed which are intended to orient policy makers
toward the most promising long‐term goals, so they can align future policies accordingly.
Figure 15 summarizes the proposed action plan across each of Iowa’s strategic priorities involving tactics
and strategic directions.
A discussion of the action plan associated with each strategic priority is presented in this section
explaining on‐going existing efforts and how the actions address specific gaps and enhancements
needed, as well as identifying leading examples from other states and best practice guidance. A more
detailed discussion of the specifics for each of the recommended tactics and strategic directions is set
out in a separate Appendix to this strategy.

| P a g e 50
Figure 15: Summary of Recommended Tactics and Strategic Directions

| P a g e 51
PROPOSED ACTION PLAN TO BUILD ON THE COMPETITIVENESS AND GROWTH OF IOWA’S
INDUSTRY CLUSTERS THROUGH INNOVATION, RETENTION AND ATTRACTION
SITUATIONAL ASSESSMENT OF IOWA’S ECONOMIC DEVELOPMENT POSITION
For Iowa to generate strong economic growth in the years ahead it will be challenged to continue to
outpace U.S. growth in its leading industry clusters. It can do this by pursuing two specific objectives in
advancing the competitiveness of its industry clusters:
One objective for higher growth is to maintain the more substantial competitiveness of its
existing industry clusters through maintaining and growing Iowa’s higher productivity within
these industries. This will not be easy as each of the existing industry clusters is expected to
generate higher output per employee by 2022 in the national BLS forecasts – so Iowa has to
increase its own pace of growth in productivity to outperform the U.S.
The other objective for Iowa is to realize its potential in high‐growth, emerging markets and
technologies that are expected to arise within its leading industry clusters. Having a clear line of
sight to growth opportunities for Iowa’s leading industry clusters will be critical to give Iowa’s
economic prospects a major boost forward.
One key advantage that has strengthened Iowa’s ability to compete is the retooling of its traditional
economic development incentives to meet the challenges of integrating innovation, retention and
attraction. The state’s leading business retention and attraction program offering tax credits and direct
financial assistance, the High Quality Jobs Program, also offers a supplemental R&D tax credit along with
other incentives, and is often packaged with the 260E Customized Job Training incentives available
through Iowa’s community colleges to meet the short‐term job training needs for firms expanding and
opening new operations in Iowa. This means Iowa is providing the incentives that position its leading
industry clusters to advance innovation to pursue new markets and worker skills to raise productivity
and the deployment of advanced technology. Economic developers across the state view the High
Quality Jobs Program as an effective attraction tool for business development opportunities and as a
retention tool for expanding Iowa firms.
A common need identified by economic developers across the state is having additional discretionary
funds to advance major projects that can advance specific industry clusters at the state and regional
level. The Iowa Economic Development Authority has established a strategic infrastructure fund that
seeks to tap prior unused economic development appropriations and other sources of income
generated by prior economic development activities (including the past Iowa Values Fund). Recent
legislative changes now focuses the strategic infrastructure fund on commonly utilized assets across
groups of firms to advance economic development. From the many discussions with industry leaders
and the economic development community, many such opportunities exist at the state and regional
level to advance commonly used assets for industry cluster development such as pilot scale‐up facilities
and product development centers, specialized multi‐tenant lab space, improved broadband capacity and
inter‐modal transportation needs. Key findings from a survey of other states regarding the enactment
and use of a state discretionary fund for economic development prepared for Kansas Inc. found that a
majority of states have discretionary funds, with a total of 30 states having discretion over an economic

| P a g e 52
development fund beyond statutory programs, tax credits and grants they competitively offered.14
Based on the analysis from Kansas Inc., a number of best practices emerged, including enacting
extended, multi‐year funding sources, mandating timely response for decision‐making, utilizing non‐
general fund sources and establishing an oversight and annual reporting requirement.
Another concern voiced consistently by Iowa’s economic development community is that small‐ and
medium‐sized Iowa manufacturing firms need assistance with and access to modernization financing
and incentives to improve competitiveness and upscale jobs. For many of these small and mid‐sized
manufacturing companies it is critical for them to modernize in order to stay competitive and grow
sales. Despite improving a company’s operations and competitiveness, these modernization efforts will
often not lead to increases in the size of the company’s workforce due to the gains from increased
efficiency and automation. This result of growing company’s operations but not their jobs places
modernization beyond the reach of many of Iowa’s economic development assistance programs that are
triggered by having job creation, even if the company is also retaining jobs. The importance of
addressing modernization assistance for manufacturing industries facing significant global competition
and the need to modernize to raise productivity is being recognized by a number of states. A 2012
article in Site Selection magazine notes a number of states have either modified existing incentives
programs or created new ones to address job retention, including Massachusetts, Illinois, Indiana,
Kentucky, New Jersey and Ohio.15
Iowa also needs to focus on emerging growth opportunities that bring together multiple industry
partners and higher education institutions to pursue specific activities for innovation, retention and
attraction. What particularly sets Iowa apart is that it is far more than just a “farming state” in
agriculture – offering an advanced industrial and innovation agricultural complex across its industry
clusters and research assets. Iowa’s core technology strengths found in agbiosciences are extensive and
involve the development of new crop varieties, protection of crops from disease and improving insect
resistance, and broader genomic analysis of plants, along with technology competencies in industrial
biotechnology and chemical processing. Iowa has opportunities in several emerging growth markets
related to its advanced industrial agbio economy from bio‐based products to precision agriculture
development to animal health. In addition, the diverse industry clusters found in Iowa, combined with
existing and emerging research competencies found across its research universities and federal labs,
also offers many other high growth market opportunities beyond the state’s advanced agbio complex.
These include efforts in advanced materials, advanced manufacturing technologies, energy efficiency,
next generation information and data applications, imaging and sensing technologies, and biomedical
innovations, among other opportunities. Already new initiatives are taking form, such as the Iowa
Advanced Manufacturing Center and the Cultivation Corridor, that seek to advance targeted
development initiatives aligned with economic growth opportunities for Iowa focused around multiple
industry clusters and drawing upon the capabilities of Iowa’s higher education institutions – but with no
14 Richard Caplan & Associates, Analysis of State‐Level Economic Development Contingency Funds, prepared for
Kansas Inc., February 2009. 15 Biggins and Weisfuse, “Please Don’t Go: State incentives to retain jobs evolve with the times, but defining ‘at risk’ can be tricky,” Site Selection, November 2012.
| P a g e 53
formalized approach from the state’s economic development effort in how best to support and advance
these initiatives.
PROPOSED TACTICS:
Create an initiative to assist Iowa manufacturers to stay on the cutting edge of their industry,
positioning them to be globally competitive. This would be a dedicated new program effort targeted to
SME manufacturing companies that have an improvement plan that documents how modernization
efforts will lead to quantifiable improvements over baseline operations and retention of at least 85
percent of the current workforce for five years with no reduction in benefits or wages. The benefits for
modernizing SME manufacturers should include access to low‐interest financing for machinery and
equipment, accelerated depreciation for the machinery and equipment acquired and automatic
qualification and priority access to 260F Incumbent Worker Training Funding.
Increase resources in the Strategic Infrastructure Fund to address competitive industry cluster
development needs in a collective and collaborative way and target growth opportunities led by
industry consortium. This new tool for addressing industry cluster development needs, in which the
Iowa Innovation Council plays an important role in reviewing proposed uses, should be ensured a
targeted level of funding of at least $2 million annually. If targeted resources from non‐current general
fund sources, including all loan and repayments from past economic development efforts, falls short,
then general fund appropriations should be considered.
Address Iowa’s non‐competitive tax environment to reduce the complexity of the system and simplify
the structure and rates. As noted earlier, Iowa ranks 49th in the nation in the Tax Foundation’s corporate
tax sub‐index due to the structure and rate of its corporate income tax. With a four bracket corporate
income tax that tops out at a nation leading 12 percent, it is hard for corporations to have certainty in
their corporate taxes. Moreover, in tax complexity across major state taxes, Iowa was found to be
among the bottom tier of states in a study by Deloitte Consulting LLP for the Iowa Chamber Alliance.
Deloitte Consulting LLP used the data from the Tax Foundation to create a measure of tax complexity.
Tax simplification in the structure and rates of taxes is a key step to take to improve Iowa as a
destination for job‐creating investments. The Tax Foundation reports that twenty‐seven states and the
District of Columbia have single‐rate corporate income tax systems, which is consistent with the sound
tax principles of simplicity and neutrality. In contrast to the individual income tax, the Tax Foundation
argues there is no meaningful “ability to pay” concept in corporate taxation.
PROPOSED STRATEGIC DIRECTIONS:
Develop focused policy initiatives that capture the most promising emerging growth opportunities for
the industry clusters. Iowa should support these targeted development initiatives by bringing together
industry and universities to pursue specific activities for innovation, retention and attraction to position
Iowa for growth in these emerging opportunities. The selection of targeted growth development
initiatives should be based on a competitive process that evaluates proposed activities from joint
industry‐university consortium applicants. Among the criteria to be considered should be: the economic
growth potential of the initiative to create high wage jobs in Iowa; how the initiative will provide a
competitive advantage for Iowa; the potential of the initiative to leverage of private and federal funding;

| P a g e 54
and how the proposed activities address real needs for advancing the emerging opportunity in Iowa.
Learning from best practices of Oregon Inc. and the North Carolina Biotech Center, it is important for
accountability and ensuring strong economic development connections that each of the targeted
development initiatives be advanced as an industry‐led, non‐profit organization, with representation of
state government and participating Iowa universities and other higher education partners.
Promote regions that are economically connected in order to facilitate collaborative initiatives. All
states contain regional economies, some of which cross state lines, where companies, workers and
development assets/support services are connected through commercial and social relationships and
interactions. These spatial relationships that define regional economies often bring together cities, their
suburban rings and more distant rural communities into functional economic regions. These naturally
occurring economic regions differ, sometimes significantly, from other “regions” defined by the public
and quasi‐public sector at various levels for their operational purposes. There is a growing recognition
that while many of Iowa’s leading industry clusters have a statewide presence, each economic region
has its own industry dynamics and specific development assets that require more local action to
maximize that region’s economic potential. Iowa should recognize the unique roles and attributes of its
the functional economic regions and how regional economic strategies can be advanced and supported
to complement and connect this statewide economic development roadmap that supports industry
clusters found across Iowa’s regions.
| P a g e 55
Leading Example in Advancing a Competitive Growth Initiative Bringing Industry and Universities Together
The Oregon Nanoscience and Microtechnologies Institute (ONAMI) is one of three “signature research centers” of Oregon Inc. and a best practices example of a government‐industry–university partnership approach oriented more to the consortium model that was seeded with state dollars. ONAMI is a collaboration of four Oregon universities (Oregon Health and Science University, University of Oregon, Oregon State University [OSU] and Portland State University), a national laboratory (Pacific Northwest National Laboratory [PNNL]), industry, and the investment community. ONAMI’s mission is to accelerate research and commercialization of materials science and related device and system technology in Oregon.
ONAMI seeks to accomplish its mission by:
Providing matching funds for federal and private collaborative research projects undertaken by ONAMI principal investigators.
Providing industry with access to a collection of university‐based shared/open user facilities on a user‐friendly, fee‐for‐service basis. These are world‐class materials characterization and fabrication laboratories. Not only do the firms have access to sophisticated equipment, but they also have access to people with the expertise to run the equipment.
Providing commercialization funding and business development services. ONAMI provides proof‐of‐concept grants that enable university researchers to conduct commercialization activities, and helps link entrepreneurs to sources of private capital. Efforts are under way to create a nanoscience and microtechnology‐focused early‐stage fund that would be similar to Seattle’s Biotechnology Accelerator.
Holding periodic conferences and seminars and providing opportunities for networking among industry and academic researchers. The ONAMI network includes 150 research affiliates at four universities and PNNL.
ONAMI received both capital and operating support from the State of Oregon. Between March 2006 and April 2011, ONAMI distributed $14.75 million in grants to Oregon universities, helping to attract more than $100 million in federal and industry R&D funding. Between 2004 and 2008, awards to Oregon’s universities for nanotechnology and microtechnology R&D tripled, and seven new companies were created based on nanotechnology and microtechnology discoveries.1
Companies working with ONAMI have raised more than $70 million for research projects to help dramatically grow research revenue in Oregon and accelerate commercialization of resulting technology.1 ONAMI is housed in Corvallis on Hewlett‐Packard’s campus, and has provided many research and employment opportunities for OSU students and graduates.

| P a g e 56
PROPOSED ACTION PLAN TO GENERATE AND ATTRACT SKILLED WORKFORCE IN DEMAND
BY IOWA’S BUSINESSES
SITUATIONAL ASSESSMENT OF IOWA’S ECONOMIC DEVELOPMENT POSITION
Recent strong growth in high‐ and middle‐skilled jobs in Iowa is an important sign of Iowa’s strong
economic performance; however, the lack of availability of these skilled workers is proving to be a
strain on businesses in Iowa. While the state can work toward attraction of workers from elsewhere –
and there is evidence that incentives can address targeted skill shortage areas, such as the Oklahoma
Aerospace Engineer Workforce Tax Credits – its future lies in the current and future generations of Iowa
students and their ability to compete lies in Iowa’s education system, career awareness and training,
and their ability to envision a viable career path in their home state. A robust and predictable talent
pipeline ensures state businesses can compete at the highest levels and have confidence in their ability
to grow in their current location.
Iowa has many efforts under way in its educational system to address this workforce development —
the Governor’s STEM Advisory Council is actively improving K‐12 STEM education and experiential
learning; the Iowa Department of Education has a major effort under way to transform and modernize
the delivery of career and technical education to middle and high school students in Iowa, with support
from a Secondary Career Technical Education Taskforce authorized by the Legislature; many community
colleges in the state offer career connections programs for high school students in collaboration with
local industry and through the pathways for academic career and employment program access to more
hands‐on navigators to assist target populations of students through academic and career planning;
each of the state’s public universities offer an active program of career services for students; short‐term
customized job training is a major facet of the state’s economic development infrastructure; and
innovative initiatives are under way to connect veterans with careers in Iowa.
In an effort to directly influence and address talent needs, Iowa’s community colleges applied for and
were awarded a $13 million grant by the U.S. Department of Labor to build capacity in awarding
associate’s degrees and certificates in welding, machining, industrial maintenance, industrial
automation, manufacturing technology, robotics, and transportation and logistics. The community
college consortium effort, known as Iowa‐Advanced Manufacturing (I‐AM) is working directly with Iowa
businesses and aligning skills delivery with nationally‐recognized certifications. Synchronist company
interviews specifically emphasize the following key areas of shortage in manufacturing – welders,
machinists, and maintenance/repair. Each of these occupations is expected to see double‐digit
employment growth through 2020. Investigation by Battelle confirms that in welding and machining
occupations, projected annual demand for new and replacement workers is outpacing associate’s and
certificate level graduates in Iowa. The I‐AM initiative has made significant progress in year one with 27
of 32 signature programs launched, nearly $1M of equipment purchased and deployed across signature
programs, more than 800 individuals enrolled, and a significant outreach campaign is under way to
“Elevate Advanced Manufacturing.”16
16 See Elevate Iowa implementation update: http://www.elevateiowa.com/assets/public/PDFs/I‐AM%20One%20Year%20Brochure.pdf.

| P a g e 57
Iowa is also having success in advancing student internships and other experiential learning efforts as
a tool for retaining talent in the state, but more systematic efforts can be advanced. The Iowa Student
Internship Program is designed to support postsecondary student interns in Iowa small to medium sized
companies in the targeted sectors including advanced manufacturing, biosciences, and information
technology through grant funding with the goal of transitioning the intern into full‐time employment in
the state following graduation. Program participants, both companies and students, give the program
high marks and these connections result in increased student interest in working in Iowa; however, the
program is limited in funding and over‐subscribed by industry. Through FY 2013, 160 individual
companies (many companies use program in multiple years) and 822 students have participated. An
expansion of Iowa’s postsecondary internships for STEM students was passed this last legislative session,
but it is only an incremental increase.
A much larger number of post‐secondary students in Iowa participate in volunteer, service‐learning
through the Iowa Campus Compact, a statewide association of 23 community colleges, private colleges
and Iowa’s three public universities. Over 18,000 post‐secondary students in Iowa participate annually,
gaining skills in communications, critical thinking and team work. Research suggests that volunteers
have a 27 percent higher likelihood of finding a job, due largely to increasing the volunteer’s social
connections and skill sets.17 For this reason, the Iowa Commission for Volunteer Service has placed an
emphasis on volunteering as a pathway to employment in Iowa.
Still, the benefits of an internship are significant. The National Association of Colleges and Employers
(NACE) in their 2013 survey of graduating seniors found that 67 percent of paid interns at for‐profit
organizations were offered a full‐time job.18 When NACE examined the outcomes of participating in an
internship the impacts were significant with those with intern experience having starting salaries that
were about $7,000 greater than their counterparts with no internship experience.19
An untapped opportunity for Iowa to advance workforce development is focusing more on upskilling
its existing workforce, which is the bulk of the state’s workforce for the next few decades. There is
also an opportunity to upskill college graduates at all levels who find themselves employed in low‐
paying, low‐skill occupations. While it is difficult to fully assess the level of underemployment found in
Iowa, an analysis of the American Community Survey suggests that nearly three in ten of Iowa’s college
educated workers with an associate’s degree and higher are employed in occupations with a minimum
educational requirement below an associate’s degree and where two out of three of the workers
employed in that occupation do not have at least an associates’ degree. So, these are college educated
workers employed in occupations requiring lower skills and where most of the workers do not have an
associate or higher college degree.
A number of these occupations may also require some higher‐skill level positions that also pay well– so a
sales representative for an engineering services firm may also need to be an engineering graduate, while
most sales representatives do not require any formal educational requirements. This population of
17 See Corporation for National and Community Service report at: http://www.nationalservice.gov/sites/default/files/upload/employment_research_report.pdf. 18 National Association of Colleges and Employers (NACE), Class of 2013 Student Survey. Data on internships do not include those participating in student teaching. 19 NACE, Class of 2010 Student Survey.

| P a g e 58
underemployed college graduates is generally untapped by existing workforce programs. Iowa’s own‐
state‐funded workforce development programs are more employer driven, while federal employment
and training programs tend to address the needs of the economically disadvantaged, who typically have
low educational attainment. This offers a significant opportunity for Iowa to re‐engage with college
graduates, who have the basic educational grounding to master more career‐specific training, through
more targeted educational and training efforts.
Few if any states, and countries for that matter, can claim to have a seamless education‐to‐work
system that effectively transitions its students through education levels and into work in a manner in
which the student has a great awareness of his or her options regarding career and postsecondary
education paths. Iowa faces significant challenges in ensuring this high‐ and middle‐skilled talent
pipeline and must consider a transformative approach that is unique to its population and skills
challenges. Iowa was selected to participate in a National Governors’ Association Policy Academy on
World Class Education, World Class Workforce to further the policy development of a unified career
pathway system in order to ensure the state’s education and workforce systems align with industry
demand, are efficiently delivered, target and stretch limited resources and ensure continual and
effective business partnerships at the state and regional levels.
PROPOSED TACTICS:
Create incentives for recent graduates, veterans and high‐skilled workers to take positions in Iowa in
specific industry clusters with critical worker shortages. A pilot program is proposed that would offer
new workers to Iowa – either recent graduates or relocated workers who have never worked in Iowa
before – an annual personal income tax credit over a two year period for individual’s with a bachelor’s
or higher degree in specific critical high‐skilled shortage fields. Based on Synchronist survey, IWD skill
shortage assessment and discussions with industry and economic development representatives, it is
recommended that the pilot focus on information technology workers that are in demand across many
industry clusters, involving web development, software engineers, and programmers. The personal
income tax credit would be structured to be revenue neutral, which for IT workers would be roughly
$2,400 per year.
Advance workplace learning through colleges, continuing education and retraining involving small‐
and mid‐sized employers, including further development of internship programs and apprenticeship
opportunities. To address the challenge of how to scale‐up internship and experiential learning, a more
broad‐based effort to make it broadly available to businesses as well as embedding within how
universities and colleges advance their degree programs should be pursued. It is proposed all public
college degree programs pursue an internship or other experiential learning activity in STEM degree
programs, led by Professors of Practice who can help with employer engagement, development of
internship and experiential learning projects and help in placing and mentoring students. To more
broadly engage Iowa companies a tax credit mechanism is proposed for internships associated with
STEM degree majors entering their senior year as well as providing a statewide internship website to
facilitate the matching of students to internship opportunities in Iowa and offer other support services
to students and employers. While many states have pursued internship programs, Indiana’s efforts
| P a g e 59
supported by the Lilly Endowment suggest how capacity‐building within colleges and universities
together with a web‐based internship organization can help in raising the level of effort.
PROPOSED STRATEGIC DIRECTIONS:
Create a K‐20 industry‐driven career development partnership with the education community. This
would be a broad‐based effort to fully integrate across Iowa’s educational system a stronger emphasis
on career development, such as accelerating alignment of career development with ongoing K‐12 STEM
reforms through project‐based, STEM‐integrated career and technical education courses, addressing
industry “soft” skill needs, promoting use of teacher and faculty externships with industry and
promoting increased use of career orientation courses at post‐secondary level. The key element for
success would be coordinating industry advisory skill panels across the entire education system to
ensure alignment on skill requirements and avoid fragmentation.
Scale‐up ongoing efforts demonstrating success in technical education for advanced manufacturing
workforce development of new and incumbent workers, through efforts such as the Iowa Advanced
Manufacturing Center and the Iowa‐Advanced Manufacturing (I‐AM) community college initiative.
Two program initiatives under way hold significant promise in helping to address Iowa’s needs for
middle‐skilled manufacturing workers. One is the I‐AM initiative of Iowa’s community colleges
(mentioned above) and the other is the newly formed Advanced Manufacturing Center at TechWorks,
which is expected to be a critical hub for manufacturing workforce training in Iowa leveraging the
presence of its Applied Research Lab for specialized hands‐on training. It is important for the state to
build upon the successes of these efforts and to address needs for future investments once their initial
funding support ends to keep these programs current, such as through investments in new state‐of‐the‐
art equipment, professional development of instructors and new curriculum and program development.

| P a g e 60
Leading Example in Advancing Career Development across Education and Training
Washington State has spent years coordinating workforce development with the specific needs of its industry clusters. The State Legislature formalized this approach in 2009 enacting legislation that identified industry clusters as the central organizing framework for workforce planning and services. Partnerships across numerous state organizations have been focused on initiatives that align numerous components of workforce development with a cluster‐based approach including:
The Workforce Board’s Industry Skill Panels connect regional stakeholders from business, labor, and education to enhance worker skills for strategic industry clusters. Competing businesses come together to have input on key skill and training needs and to agree on how to monitor progress. The state has utilized skill panels since 2000 and in 2008–09 the Workforce Board invested nearly $400,000 for 16 skill panels across the state. An independent evaluation of just 4 skills panels found they closed skill gaps and job vacancies and leveraged substantial additional funding, in this case $18 million or 30 times the public investment.
Washington’s High Skills, High Wages Strategic Fund works to meet cluster needs through workforce training targeted at low‐income populations. The Workforce Board was authorized to spend $950,000 in federal Workforce Investment Act dollars toward these projects which include targeted regional cluster activities, including a specific emphasis on K‐12 career awareness and technical training.
The state has targeted higher education funding to address high‐demand jobs—where graduate levels are insufficient to meet projected annual demands. In middle‐skill jobs, two areas of emphasis have been boosting graduate levels in aerospace mechanics and technicians, and in allied health occupations, addressing needs for two key state clusters. Among high‐skilled jobs, the state has had more mixed results in its investments in allied health, computer science, and engineering, areas it has further identified as key to its clusters.
Washington’s State Board for Community and Technical Colleges (SBCTC) oversees 10 cluster‐based Centers of Excellence throughout the state, which create and share model curricula, and best practices in college assistance to industry. The Centers also coordinate partnerships among all education levels including articulation arrangements for more seamless relationships with K‐12 students.
The Workforce Investment Act (WIA) program provides employment and training resources for strategic clusters. WIA‐funded community and technical college training dollars have been used predominantly in strategic cluster industries: health care (37 percent); manufacturing/construction (22 percent); and information technology (11 percent).
| P a g e 61
PROPOSED ACTION PLAN TO ACCELERATE THE DEVELOPMENT OF IOWA’S EMERGING
ENTREPRENEURIAL ECO‐SYSTEM
SITUATIONAL ASSESSMENT OF IOWA’S ECONOMIC DEVELOPMENT POSITION
One of the newest and most dynamic areas of state economic development activities in Iowa has
been to advance innovation and entrepreneurial development. Starting close to the outset of the 21st
Century, Iowa’s attention has turned to building a broader infrastructure of entrepreneurial
development services and support and to shifting its business culture to embrace higher‐risk
entrepreneurial endeavors.
What is taking form in Iowa is a multi‐sector, public‐private partnership approach in which government,
colleges and universities and the private sector have each been advancing new and, often, innovative
approaches to addressing Iowa’s entrepreneurial culture and upgrading its ecosystem of support
services.
Iowa’s five John Pappajohn Entrepreneurial Centers (JPEC) were initiated in the late 1990s to provide
tailored, comprehensive education and support services with the mission of growing entrepreneurs
and sustainable businesses in Iowa. The JPEC’s offer a whole range of services, often in collaboration
with the Iowa Small Business Development Centers and housed within state universities and a
community college, including:
Business start‐up and expansion services (includes business plan preparation,
counseling/consulting, access to market research, mentoring and networking, incubation and
acceleration opportunities)
Technical assistance (access to Iowa universities technology transfer and other technology
resources, IP assessment, R&D funding sources)
Access to capital (guidance regarding commercial lending, seed and venture funds, annual VC
and entrepreneur conference)
Creating entrepreneurial communities and regions
Entrepreneurial education for students (spanning K‐12 and postsecondary).
Beyond the presence of the Pappajohn Entrepreneurial Centers, Iowa’s public research universities
have particularly stepped up in advancing innovation and entrepreneurial development. Iowa State
University (ISU) and the University of Iowa each have university‐affiliated research parks and incubators
that support new spin‐out companies and other start‐ups in their regions. Given the substantial research
base at both ISU and University of Iowa, each have active technology transfer offices which have been
advancing more business friendly intellectual property policies; are placing a strong emphasis on
technology commercialization with resources from Iowa’s Board of Regents to undertake proof‐of‐
concept funding to validate the commercial potential of new research discoveries; and focused on
generating new spin‐off companies from the university’s research activities, including efforts to such
early stage company formation with Entrepreneurs‐in‐Residence. The University of Iowa Research
Foundation is also providing gap funding to bridge early stage funding from the state’s innovation
programs.

| P a g e 62
Still, there is a clear consensus that the challenges of commercializing technology in Iowa given the
state’s historical lack of entrepreneurial culture poses significant hurdles for the commercialization of
university research. So, while the basic technology transfer function involving the identification,
protection and licensing of a university’s intellectual property based on research discoveries of faculty
and students is most appropriately and effectively handled by each university through its own
technology transfer staff, there is a need for more focused efforts to complement Iowa’s universities
efforts in technology commercialization to form high quality start‐up ventures from university research.
The University of Northern Iowa, meanwhile, has placed a major emphasis on innovative
entrepreneurial programs that serve entrepreneurs statewide going well beyond the services advanced
through their Pappajohn Entrepreneurial Center and SBDC. The UNI Regional Business Center, part of
the College of Business Administration, hosts and provides a range of support for key programs:
Two on‐campus business incubators—the Innovation Incubator and Purple Cat CoWork; both
are supported by comprehensive support and technical services at the University.
MyEntre.Net which supports an online community of Iowa small business owners and
entrepreneurs with training, networking events, and shared technology resources.
Advance Iowa, a relatively new and promising statewide effort in “economic gardening” to
assist mid‐sized Iowa businesses to expand. To participate with Advance Iowa, a company must
work with a local Iowa economic development organization. If a firm qualifies and is open to
examining new and innovative approaches to business a set of strategic planning services are
offered to these companies.
Significant entrepreneurial activities are also well‐established and ongoing at the community
economic development level in Iowa. For example, the EDC business accelerator in Cedar Rapids is
connecting existing and emerging businesses and entrepreneurs across the state with critical state
resources and business direction. Over a decade, EDC has built a model program with significant
impacts—supporting more than 600 businesses, helping raise more than $200 million in capital, helping
start 88 new businesses, helping generate $738 million in new business revenue and $266 million in new
wages translating into roughly $1.2 billion in total economic impacts. The Greater Des Moines
Partnership has launched a series of entrepreneurial development activities, most recently announcing a
new global insurance accelerator with backing from Iowa industry leaders, such as Principal Financial
Group, Delta Dental and Farmers Mutual Hall Insurance Company, to attract insurance talent and
technology‐based start‐ups to Iowa.
At the state level, the Iowa Economic Development Authority (IEDA) has worked actively with the
industry‐led Iowa Innovation Council and other key stakeholders to identify and address gaps in
Iowa’s innovation system. A new public‐private partnership intermediary was launched in 2012, the
Iowa Innovation Corporation, to work under the direction from IEDA, the Iowa Innovation Council and
with public and private partners. Just recently the IEDA and Iowa Innovation Corporation launched the
Innovation Iowa brand to create an umbrella that encompasses the work being done jointly by both
organizations.
One well‐regarded effort at the state level has been a series of innovation programs – such as the
Demonstration Fund (state funds) and the Innovation Acceleration Fund (federal funds) – to support

| P a g e 63
high technology prototype and concept development activities by small‐and‐medium‐sized companies in
advanced manufacturing, biosciences and information technology that have a clear potential to lead to
commercially viable products or services. An independent economic and fiscal impact study of the
Demonstration Fund’s efforts from 2007 to 2012 found that the 127 investments made, totaling about
$13 million, generated 600 direct jobs and annual revenue growth of $87 million, based on survey
results from 79 of the firms assisted (a number of firms received multiple awards and some closed or
eventually declined the investment). The total economic impact of this $13 million of commercialization
support, after considering multiplier effects, is estimated at $150 million in additional economic activity,
supporting about 1,100 workers and generating slightly over $2 million annually in new tax revenue –
the equivalent of a 16 percent annual return between 2007‐2012 over the entire cost of the program (it
would be 24 percent return from just those who completed surveys).20 VentureNet Iowa has been the
outsource management provider for these IEDA/Iowa Innovation Corporation efforts in
commercialization. It has earned high marks for the review process that engages a network of
technology and management executives and offers quality feedback to the firms applying for the state’s
innovation programs.
The IEDA/Iowa Innovation Corporation efforts – or what is now referred to as Innovation Iowa – are now
turning to a range of other activities to further innovation and entrepreneurial development in Iowa.
One effort is focused on attracting follow‐on venture capital to Iowa through the Iowa Innovation Fund,
which was recently amended to offer a slightly higher tax credit and eliminate a three year waiting
period. Next Level Ventures, a $15 million venture fund, is the first Iowa Innovation Fund awardee, and
was formed in early 2014. The Iowa Innovation Corporation is working to help launch another fund
soon.
Other state‐level Iowa Innovation efforts include establishing an SBIR assistance program that is seeking
to raise Iowa’s share of the approximately $2.5 billion awarded by federal agencies conducting research
to commercialize promising technologies by small businesses. Iowa is well behind the nation in its SBIR
awards. Over the 2009–2012 period, on a per 10,000 population basis, Iowa averaged $18,885 annually
in SBIR awards compared to $72,343 for the nation. An industry applied research program has also been
initiated, but has not generated interest and a bottom‐up review led by the Iowa Innovation Corporation
is just starting up.
Still further expansion of innovation and entrepreneurial services is well recognized by stakeholders in
Iowa. Efforts and discussions are under way for a range of activities from improving the
commercialization of university research to piloting entrepreneur mentoring services.
PROPOSED TACTICS:
Expand entrepreneurial services offered through Innovation Iowa (IIC/IEDA) to include mentoring
services and access to business resources, as well as programming to entrepreneurs to promote better
utilization of the federal SBIR program. Best practices from other states make clear that it is critical that
Iowa’s entrepreneurial services provide follow‐on assistance beyond making initial proof‐of‐concept and
20 Econsult Solutions, “The Economic and Fiscal Impacts of the Demonstration Fund on the Iowa Economy,” February 2013.

| P a g e 64
product development investments in order to realize the full growth potential of its emerging
innovation‐driven businesses. Mentoring and access to business resources are proven tools for helping
emerging innovation‐driven companies to grow. Also, the federal SBIR program is the largest product
development funding source in the nation and Iowa entrepreneurs and emerging businesses can better
compete for this pool of product development funding by deepening the state’s SBIR assistance services
to include: a matching grant program for successful SBIR awardees; increased commercialization
planning assistance; and a more targeted focus on federal agencies that align strongly with the state’s
areas of technology competencies and growth opportunities as well as strategic partnering with large
Iowa companies in those focus areas.
Create an effective angel investor tax credit that eliminates the waiting period, increases the tax
credit percentage and makes the credits transferrable to attract broader investor interest. Unlike
other states, Iowa’s angel investment tax credits have not been effective. Iowa should consider
revamping along the lines of Wisconsin’s successful program to raise the tax credit from 20 percent to at
least 25 percent, eliminate the three year waiting period for redeeming the tax credits, making them
transferable to attract broader investor interest, lifting the limits an investor can claim by investing in
more than one qualified company and eliminating or at least raising the annual cap on total available tax
credits from $2 million to $5 million.
Reassess public‐private research partnerships to promote strategic collaboration among academia,
government and industry, including the creation of post‐doctoral and graduate entrepreneurial
education tracks. Follow the approach of Science Foundation Arizona and the National Science
Foundation’s Grant Opportunities for Academic Liaison (GOALI) in advancing strategic scientific
collaborations in which Iowa university faculty can focus on more industry‐facing basic research that
addresses key challenges identified in concert with industry, with the industry partner serving to focus
more on the applied research required to commercialize the technology. One innovative means to
advance strategic alliances with industry is to leverage the efforts of graduate students in pursuing the
commercialization of university‐based technology advances. These graduate students offer the higher
skill sets needed for more technology‐intensive businesses, but lack the entrepreneurial skills for
commercialization. A one‐semester graduate entrepreneurship certificate is recommended, with a
common core curriculum across universities in Iowa, and offering stipends for participating graduate
students and a business plan competition. Iowa might want to consider having companies sponsor
competitions of graduate student teams, who are participating in the entrepreneurial education
courses, in specific technology topic areas, such as precision agriculture, Big Data, sensor networks, etc.
Expand the state’s economic gardening program, Advance Iowa, for mid‐sized growth companies.
Recognizing that entrepreneurs and new businesses face a set of unique challenges as they grow and
move beyond their initial start‐up phase, there has been a movement nationally toward servicing the
needs and challenges of these “second‐stage” businesses. “Economic Gardening” programs assist these
firms with strategies for growth that might include a new product offering, expanding into a new market
or customer base, or enhancing marketing. Iowa’s efforts after just one year of operation has reached
over 50 mid‐sized companies, but is reaching limits on capacity to serve companies with far more
demand than it can presently handle. Additional funding is needed to assist mid‐sized Iowa firms realize

| P a g e 65
their growth potential by creating more “spokes” across the state access these economic gardening
consulting services.
PROPOSED STRATEGIC DIRECTIONS:
Facilitate the transfer of university research and development to industry startups. The size and
quality of Iowa’s university and federal lab research base is sufficient to generate increased levels of
high quality technology‐based start‐ups, but Iowa’s entrepreneurial culture simply does not match that
of East and West Coast locations. Rather than replicating many of the value‐added services that are the
focus of existing and planned activities of the Iowa Innovation Corporation for entrepreneurial
mentoring, improved due‐diligence and commercialization assistance, Iowa has an opportunity to more
directly advance high quality start‐ups from university research by leveraging the capabilities of serial
entrepreneurs to lead venture development corporations to not only identify, assess, and validate
university research discoveries able to support new business ventures, but to actually launch the new
companies and serve as the management team leading the new start‐up in its initial product
development phase, including raising initial angel and product development capital. As the new start‐up
reaches key development milestones, then the serial entrepreneur leading the venture development
corporation can recruit permanent management for the advancing new business. Key resources that will
attract these serial entrepreneurs and ensure their success in launching high‐growth potential
companies includes access to pre‐seed and seed funding support.
Increase the amount of venture capital and seed‐stage funding available to allow startups to grow
locally. The lack of venture financing at different stages from angel investment through seed investment
and more formal rounds of venture capital funding is one of the more difficult challenges to address.
The economic development roadmap focuses on addressing the severe shortfall in angel investment in
Iowa through a revamped tax credit mechanism. A big question mark is whether the recent changes to
the Iowa Innovation Fund tax credit will be sufficient to attract additional venture capital funds,
particularly at earlier stages of seed and the first round of formal venture capital.

| P a g e 66
Leading Examples in Venture Development Organizations
One of the more recent and noted approaches is the Seattle Accelerator Corporation, founded in 2003, to create high growth potential is a vehicle for disciplined and efficient investment in and management of emerging biotechnology opportunities. The Accelerator Corporation is led by Carl Weissman, who was previously an accomplished venture capitalist from Boston and serial biotechnology entrepreneur. What is notable about the Accelerator Corporation is its partnerships, including: 1) a world‐class research institute—the Institute for Systems Biology, a non‐profit research organization founded by Lee Hood—which enables deal flow plus access to specialized scientific equipment and shared use labs; 2) national venture capital firms for seed capital for proof of concept funding and initial business formation, including Amgen Ventures, ARCH Venture Partners, OVP Venture Partners, PPD, Inc. and WRF Capital; and 3) dedicated wet lab space for locating its companies through its partnership with Alexandria REIT. In the past nine years, twelve companies have been invested in through Accelerator. Five have emerged and raised follow on financings of more than $164 million. Three companies remain under management at Accelerator. In all, Accelerator companies have raised in excess of $221 million in initial and follow‐on financings. Recently, the Seattle Accelerator Corporation announced its expansion to New York City.
Another example from a more remote location is the Virtual Incubator Company (VIC) in Fayetteville, Arkansas. Started by a serial entrepreneur and former university professor with a PhD from Stanford in mechanical engineering. VICs focus is multi‐market and very science‐oriented companies including in nanotechnology, instrumentation, and biosciences. It has formed 11 companies in Arkansas raising more than $100 million of outside capital. Its first company, NanoMech, is now a fully independent manufacturer of innovative application specific nanoparticle additives, nanoparticle‐based coatings and coating deposition systems that can be used in a variety of critical industry sectors. Recently VIC has opened branch offices in suburban Boston and Annapolis, Maryland, with each now leading two portfolio companies in those regions.
A recent Arkansas Business article from this past August explains how VIC works:1
Each year, VIC reviews roughly 1,500 technologies from research universities and labs across the globe. Its intellectual property assessment team then selects a handful — perhaps just a couple, perhaps as many as four — for which to negotiate.
Once VIC obtains an exclusive license for the technology, it forms a new start‐up for commercialization of that technology.
The new firm receives $250,000 in seed money from the VIC Investor Network, whose members retain an equity stake based on individual investments.
An internal VIC business development team and a CEO are assigned, and an initial research‐and‐development team is hired.
VIC staff based at the Fayetteville headquarters provides administrative support in the areas of corporate records, finance/accounting, graphic design/communications, grant writing, human resources, IT support, engineering and more.
The VIC business development team oversees product development strategies, funding activities including grants and private investment rounds and begins recruitment of a permanent executive team for the appropriate time in a company’s growth. VIC then maintains a board presence in portfolio companies that become operationally independent.

| P a g e 67
PROPOSED ACTION PLAN TO ADVANCE IOWA’S PHYSICAL INFRASTRUCTURE AND REGIONAL
DEVELOPMENT CAPACITIES TO REALIZE IOWA’S ECONOMIC POTENTIAL
SITUATIONAL ASSESSMENT OF IOWA’S ECONOMIC DEVELOPMENT POSITION
State funding for highway maintenance and improvements in Iowa is of great concern at a time when
the need for highway improvements is well‐recognized. Similar to all states, Iowa uses dedicated
funding sources, comprised principally excise tax on fuels and vehicle registration fees. For Iowa these
funds are deposited into the Iowa Road Use Tax Fund (RUTF) and cannot be used for any other purpose
than highway projects. The Iowa excise tax on gasoline is collected as a flat fee per gallon purchased of
21 cents. The excise tax on ethanol blended fuel is 19 cents per gallon and 22.5 cents per gallon on
diesel fuel. These figures do not include the one cent per gallon underground storage tank fee. Iowa also
has had no increases in the level of the motor fuels excise tax since 1989.
Controlling for the cost of construction, based on actual awarded contracts for excavation, surfacing and
structures in Iowa, the purchasing power of Iowa’s RUTF receipts has plummeted from just over $900
million in 2003 to roughly $650 million in 2010, according to the Iowa Department of Transportation’s
2011 Road Use Tax Fund Study. One factor contributing to the declining purchasing power of Iowa’s
RUTF is the rise of more fuel efficient and hybrid cars and trucks that in turn is translating into lower
usage of gasoline per mile traveled and so limiting the receipts from the state’s motor fuels excise tax.
The Iowa Department of Transportation in its 2011 Road Use Tax Fund Study estimated that to meet all
current and future needs of Iowa’s city, county and state roadway system would require new funding of
$1.6 billion annually. Of that overall funding shortfall, an assessment of the needs that are most critical
to assure Iowa’s roadway system can support and grow the state’s economy was conducted. It was
determined the 20 year shortfall in meeting Iowa’s most critical highway needs is $215 million annually.
This figure has been the basis of ongoing funding discussions at the legislature.
Across states in the U.S. a wide variety of approaches are being enacted or considered from simply
increasing the motor fuel flat rate per gallon to replacing the flat rate with a sales tax on fuel to indexing
the flat rate to inflation to increasing annual registration fees – or some hybrid of all of these actions.
In broadband development, the uneven development in Iowa is of great concern. For this updated
economic development roadmap, the priority is placed on addressing the business needs for
broadband speeds and reliability, no matter where a business is located in Iowa, including Iowa’s
farmers who increasingly need to access broadband for new innovations involving precision
agriculture. Still, it is difficult to separate out the needs of industry for broadband in their business
operations to broader business interests in ensuring a well‐educated workforce and quality healthcare
services in Iowa. As students use broadband at school the demand for access at home grows. Similarly in
health care delivery, digital innovations are rapidly advancing into more advanced monitoring and
diagnosing of patients in their homes. And, of course, telecommuting from home is becoming more
common for workers, at least on a partial basis, given that much of the information systems of their
companies can now be accessed through Internet‐based applications.

| P a g e 68
The National Conference of State Legislatures reports that all 50 states have created either a task force,
commission, or broadband project. Some states have created programs to identify underserved and
unserved areas through online public mapping websites, while others have established task forces or
commissions to provide input on the development of a statewide broadband framework and promote
public‐private sector participation. At least 14 states have enacted these initiatives and authorities
through legislation.
Despite this broad‐based concern on advancing broadband access, there is no specific program or
actions that stand out as making the difference. Instead, the common efforts found across states are
focused on a wide range of activities, such as: creating awareness of the importance of broadband and
raising digital literacy among all areas and populations in a state; helping local communities mobilize;
focusing on leveraging existing federal funding, state assets and existing provider networks; and
advancing high‐value broadband applications that state government can advance from connected
schools to telemedicine to smart housing to public safety networks as a means of delivering improved
public services.
Iowa is doing all of this to advance broadband development and yet is still falling short. So more direct
action to mobilize the marketplace is needed.
In advancing livable communities, Iowa is actively involved across many state agencies. Recently Iowa
enacted a new Workforce Housing Tax Incentive Program, administered by the Iowa Economic
Development Authority, to create higher incentives for affordable housing, involving a 10 percent tax
credit for housing projects including multiple dwelling units, up to $1 million for a single housing project
and a $20 million cap. Another IEDA program focused on advancing livable communities is Vision Iowa
that assists projects that provide recreational, cultural, entertainment and educational attractions that
position a community to take advantage of economic development opportunities in tourism and
strengthen a community’s competitiveness as a place to work and live. IEDA also offers limited
Downtown Revitalization Funding, using federal community development block grant assistance, to
provide grants to communities for a variety of projects and activities contributing to comprehensive
revitalization in historic city centers.
Other state agencies through more infrastructure‐related funding are also active in supporting livable
communities. Examples include:
• Iowa Department of Transportation offers a number of programs that supports the livability of
communities including trail funding for recreation, congestion mitigation, and By‐ways program.
• Iowa Department of Natural Resources helps in funding and regulating critical infrastructure for
water quality and treatment. One example is the funding IDNR receives from the Resource
Enhancement and Protection program supported by the state’s Environment First Fund (Iowa
gaming receipts). It includes funding for land management, city parks and open space, and soil and
water enhancement, among other uses.
• Iowa Department of Cultural Affairs administers the historic preservation tax credit which helps to
maintain the historic character and revitalize areas. Since its inception283 historic buildings across

| P a g e 69
64 communities in Iowa. In addition, the Department supports the Arts Council, which has a wide
assortment of programs to support local arts and culture across the state.
• Iowa’s public universities also are actively involved through a myriad of programs in supporting
community development across the state.
Overall, it is clear that infrastructure development needs of Iowa are well‐beyond what local, state
and federal government can afford. An excellent example of the large demands for infrastructure
development investment are the needs that exist on the Upper Mississippi River to assure the lock and
dam system can continue to facilitate the movement of Iowa’s agricultural products and other
commodities. Still, without these investments Iowa’s economy will underperform resulting in lower
personal income in Iowa and lower state and local tax revenues.
For a growing range of infrastructure development projects that can demonstrate economic
development viability, a growing range of alternative financing approaches that tap the private sector
are being advanced, including:
• Advancing public‐private partnership approaches in which the private sector assumes the
substantial financial, technical and operational responsibilities and risks for an infrastructure
project under contract with the public sector and generates revenues either from users of
the project or through payments from government.
• Creating regional development authorities that as political subdivisions of a state or multiple
states have the powers to manage designated land development for transportation and
economic development purposes, finance and construct key facility developments, operate
these facilities and generate revenues from the operations.
PROPOSED TACTICS:
Address highway improvement funding by advancing a hybrid approach that balances the need for
stable and predictable revenue by retaining a fixed per gallon fee but at a lower rate, and adding a
sales tax component that provides a means to allow for revenue growth as the price of fuel increases.
The Iowa Department of Transportation (IDOT) has engaged in extensive public dialogue in the past year
about how to best address Iowa’s roadway funding shortfall using the wide range of approaches being
undertaken across the nation. From this extensive public outreach the concept that gained the most
traction is a hybrid approach that balances the need for stable and predictable revenue by retaining a
fixed per gallon fee but at a lower rate, and adding a sales tax component that provides a means to
allow for revenue growth as the price of fuel increases.
Support Iowa Department of Transportation’s (IDOT) targeting of high‐value transportation
improvements using information gleaned through the Freight Optimization Study. The study, by
applying supply chain network design and optimization techniques used in the private sector, will
allow Iowa to advance a comprehensive approach to prioritize investment for advancing the state’s
freight transportation capacities. With limited funding available for major new highway projects, it is
essential for Iowa to be able to identify the specific economic development impacts of proposed

| P a g e 70
projects in helping to determine transportation improvement priorities. IDOT, with cooperation from
IEDA, is applying supply chain network design and optimization techniques used in the private sector to
advance a comprehensive approach to prioritize investment for advancing Iowa’s freight transportation
capacities. This effort compiles a unique database that integrates information on suppliers, plants,
warehouses and flows of products from origin to the final customer to estimate economic value from
different proposed highway improvements. This focus on economic value of highway improvement
projects will promote Iowa’s overall economic development, plus it can offer a valuable service to help
Iowa businesses optimize their logistics approaches. The analysis for this supply chain network design
and optimization is still under way and work is expected to be completed later this calendar year.
Develop incentives for broadband investment that creates a comprehensive approach to spur
broadband development that can be depended upon over time. Recognizing from the efforts of states
across the nation that there is no silver bullet to solve broadband needs – and that the requirements for
broadband speeds will continuing to increase as higher value applications unfold – it is critical that Iowa
create a comprehensive approach to advancing a business environment to spur broadband
development that can be depended upon over time. Several specific initiatives should be advanced as
components of this comprehensive approach, including:
• Establishing a comprehensive package of tax incentives that broadband providers can rely
upon in making long‐term investment decisions in building out and enhancing service
capacity.
• Leveraging the excess capacity of the state‐owned Iowa Communications Network in a
manner that balances the business interests of Iowa’s large number of independent
telecommunications providers of broadband services with the needs of industry, residents
and community improved access to broadband.
• Setting reasonable time lines for local regulatory actions on permitting of wireless towers
and other broadband infrastructure so that broadband providers can be assured some
certainty in making investment decisions.
• Ensuring resources for community capacity‐building to advance approaches on broadband
development, so that informed decisions and increased awareness can be advanced.
PROPOSED STRATEGIC DIRECTIONS:
Explore innovative methods of financing infrastructure improvements, including the use of public‐
private partnerships. Iowa should advance the use of regional port authority developments and public‐
private partnerships on a case‐by‐case basis, with specific project evaluation criteria. As way of general
guidance, The Brookings Institution study sets out some general guidelines that would be helpful for
Iowa as it explores these Public‐Private Partnership (PPP) opportunities:
• PPPs should be pursued not simply for funding a project, but with a focus to achieve
efficiency gains from the private sector by bundling responsibility for the initial capital
investment with future maintenance and operating costs.

| P a g e 71
• PPPs should be well‐defined projects that are awarded in competitive auctions and not
through bilateral negotiations.
• Governments should consider not only the benefits, but also the costs, of PPPs – and it
should be accounted for in budget reports.
• Split the responsibility between two separate groups in government for planning, project
selection, and awarding projects, and an independent unit responsible for contract
enforcement and the supervision of contract renegotiations.
Focus on intermodal transportation infrastructure and other infrastructure improvements to support
the export economy and livable communities. Intermodal transportation is a critical but often
overlooked need in Iowa. Upgrades to all forms of transportation infrastructure are necessary in order
to increase regional export capacity, address bottlenecks in the state’s freight transportation system and
improve quality of life by taking freight traffic off the roads. At the same time, many of Iowa’s rural
communities need other infrastructure improvements in order to retain and attract young families and
this includes revitalizing downtowns and developing more affordable housing. There are many existing
state‐supported programs, including those offered by universities in the state, that need to be
maintained or expanded and consideration of some new initiatives being proposed in this economic
development roadmap. The success and effectiveness of these efforts must be examined in the future,
but having a plan to address infrastructure holistically will be an important element in how Iowa
advances its regional development strategies in the years ahead.

| P a g e 72
Leading Example in Public‐Private Partnerships for Infrastructure Development
Australia has been one of the most active nations using PPPs. An independent study by the Allen Consulting Group, in conjunction with The University of Melbourne, of the efficiency of Public‐Private Partnerships (PPPs) relative to Traditional procurement approaches in the provision of public infrastructure found that that PPPs provide superior performance in both the cost and time dimensions, and that the PPP advantage increases (in absolute terms) with the size and complexity of projects. Specific findings included:
PPPs demonstrate clearly superior cost efficiency over Traditional procurement, which can range from 30.8 percent when measured from project inception, to 11.4 percent when measured from contractual commitment to the final outcome.
In absolute terms, the PPP cost advantage was found to be economically and statistically significant. On a contracted $4.9 billion of PPP projects the net cost over‐run was only $58 million – not statistically different from zero. For $4.5 billion of Traditional procurement projects, the net cost over‐run amounted to $673 million.
With respect to time over‐runs, on a value‐weighted basis we found Traditional projects were likely to be completed later than PPPs relative to the budget. For example, between the signing of the final contract and project completion, PPPs were found to be completed 3.4 percent ahead of time on average, while Traditional projects were completed 23.5 percent behind time. This difference is statistically significant.
In contrast to commonly held perceptions about the relative transparency of PPPs, we found that PPP projects were far more transparent than Traditional projects, as measured by the availability of public data for this study.

| P a g e 73
APPENDIX A: LINE OF SIGHT TO IOWA’S INDUSTRY GROWTH
OPPORTUNITIES
While Iowa’s twelve industry clusters are driving much of the state’s economy, it is also important to
take a more forward‐looking assessment to understand the growth opportunities that exist across and
within each one. It is these opportunities that differentiate Iowa and establish a platform from which
Iowa can compete on a national and even global scale. Each cluster is positioned in unique ways for
growth into the future—some continued to grow, even during the deep recession and have broad‐based
opportunities moving forward, while others may have been hit hard during the recession but have key
niche components that are emerging or poised for growth, still others have technology competencies
yet to be leveraged. It is critical, therefore, to investigate each cluster component with a “line of sight”
to market opportunities.
Battelle’s approach to identifying this line of sight involves identifying both Iowa’s current and emerging
strengths across detailed product markets, as well as a forward‐looking assessment of core technology
competencies. These analyses are described here.21
Targeted Product Markets within Clusters: Battelle identified, for each of the 12 industry
clusters, detailed product markets in which Iowa has a strong or growing presence based on its
current employment concentration and recent growth. Current strengths in these most
detailed industry classifications are those that are specialized and growing in Iowa, while
emerging strengths are growth areas that do not yet have a specialized employment
concentration. These target markets are combined in the table on the next page.
Core Technology Competencies and Innovation Themes: Battelle conducted a patent cluster
analysis and combined this with the technology focus areas of emerging innovative companies
to identify Iowa’s core research and technology competencies which were then aligned with
each cluster. The patent analysis leverages a proprietary Battelle software tool that connects
and clusters the words and phrases in the titles and abstracts of the more than 3,500 patent
applications and awards among Iowa inventors from 2009 through 2013. While industry was
the predominant player in the patent data, Iowa’s universities were very active in several of the
patent innovation themes.
Identify Possible Market Niches for Growth: Held discussions with industry executives and surveyed market research studies at the detailed industry and project level to identify, for the most attractive product/service market opportunities, the market growth potential and critical technology and market advances required. Battelle generally relied on the market research intelligence from IBISWorld or BCC Research to identify faster growing market opportunities and specific market and technology challenges. The advantage of IBISWorld is that its industry research reports align well with the industry classification system and so focus on detailed industry product markets.
21 For a more detailed discussion of these analyses and for an overview of the analysis for each industry cluster see the Appendix to this report.

| P a g e 74
Figure A‐1: Line of Sight to Iowa’s Growth Opportunities
Industry Cluster Industry Drivers/Target
Product Markets IA Competitive
Advantages/Innovation Themes Illustrative Growth
Markets/Opportunities
Ag & Food Production
Automation & Industrial Machinery
Avionics & Comm.
Electronics
Biosciences
Building & Construction Products
Health Services
Heavy Machinery
Info Svcs, Digital Media &
Technology
Insurance & Finance
Large Array Across
Ag Production;
Food Mfg;
Packaging
Agbiosciences;
Ind. & Nutritional Biotech;
Imaging & Sensing;
Internet, Wireless Computer Techs
Precision agricultureEnhanced seed & plant improvement/protectionHigher value‐added food (additives, functional foods)Food Safety & Intelligence
Conveyor equip; Cutting & machine tools; Pumping equip; Metal Valves; Metalworking machinery; Ind. Process instrs, controls; Ind Molds
Imaging & Sensing; Valves, Seals, Fluid Control;
Internet, Wireless Computer Techs; Turbine Fuel Techs
Industrial process controls—sensing systems
Search, detection, & navigation instruments; Aircraft engines & parts; Engineering Svcs
Imaging & Sensing; Internet,Wireless Computer Techs; Electrical Switching, Power Controls; Antennas
Unmanned aerial system electronics
Consumer‐related electronics for aviation
Agbio incls: Ag Feedstocks, Ethanol mfg, Ag chemicals;
Medicinal & botanicals mfg; Surgical appliances; Commercial R&D
Agbiosciences; Industrial & Nutritional Biotech;
Biopharmaceuticals
Bio‐based chemicals & productsMedical imaging & softwareAnimal healthBiofuelsContract manufacturing
Flat glass mfg; Wood office furniture; Showcases, partitions; Cut stone; Wood windows; Truss mfg; Concrete; Ornamental metal
Advanced Materials;
Sustainability“Net Zero” energy products
Blood & organ banks; Nursing care facilities; Residential mental & substance abuse facilities; Kidney dialysis centers
BiopharmaceuticalsHealth informaticsClinical research
Farm machinery & equip; Construction machinery; Vehicles: tires, carburetors, pistons, power train, metal stamping; Motor homes
Agbiosciences; Ag Machinery & Vehicles; Imaging & Sensing; Valves, Seals & Fluid Control; Advanced Materials
Precision agriculture‐related equipment and machinery and associated services
Custom computer programming; Systems design; E‐commerce; Computer facilities; Publishing
Internet, Wireless Computer Technologies
Enterprise & cloud computingData analytics/customer insightsDomain‐specific applications—Ag, Health IT, Educ. Software, LogisticsMobile applications
Comm. banking & credit unions; Mortgage & non‐mortg. loan brokers; Commodity contracts brokers; Claims adjusting; Fin. Transactions processing; Securities; Portfolio mgmt.; Pension funds
Internet, Wireless Computer Technologies
Financial transactions processingMobile finance applications

| P a g e 75
Industry Cluster Industry Drivers/Target
Product Markets IA Competitive
Advantages/Innovation Themes Illustrative Growth
Markets/Opportunities
Primary Metals Mfg.
Renewable Energy
Transport., Distribution, &
Logistics
Aluminum foundries, die‐casting & sheet/plate/foil mfg; Steel foundries, pipes, wire; Iron & steel mills; Iron foundries
Advanced Materials Next generation aluminum alloys
Ethanol/biofuels; Turbine & turbine generators; Storage batteries
Industrial & Nutritional Biotech
BiofuelsWind—generationEnergy storage
Whole range across TDL including:
Warehousing; Freight trucking (general & long‐distance); Broad wholesale trade; Logistics—process & consulting svcs
N/ALogistics management & consulting svcs.Intermodal transportation