ipr-intensive industries: contribution to economic ... · ipr-intensive industries: contribution to...
TRANSCRIPT
IPR-intensive industries: contribution to
economic performance and employment in
the European Union
Joint EPO-OHIM study
Theon van Dijk
EPO Chief Economist
Athens
21 March 2014
Full report available at:
www.epo.org/ip-intensive-industries
2/8
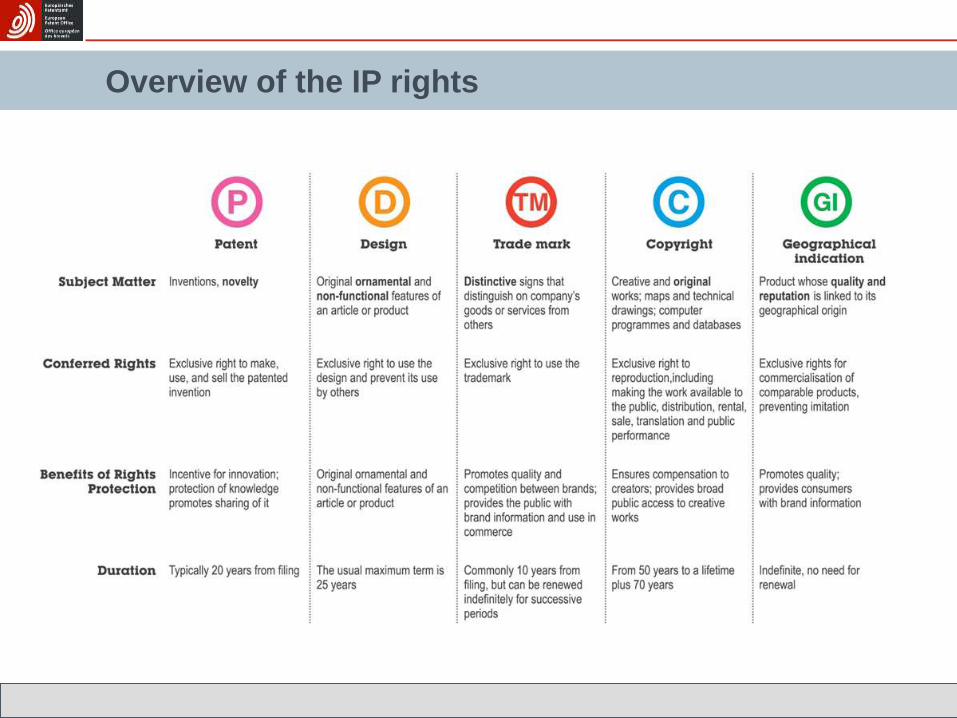
Overview of the IP rights
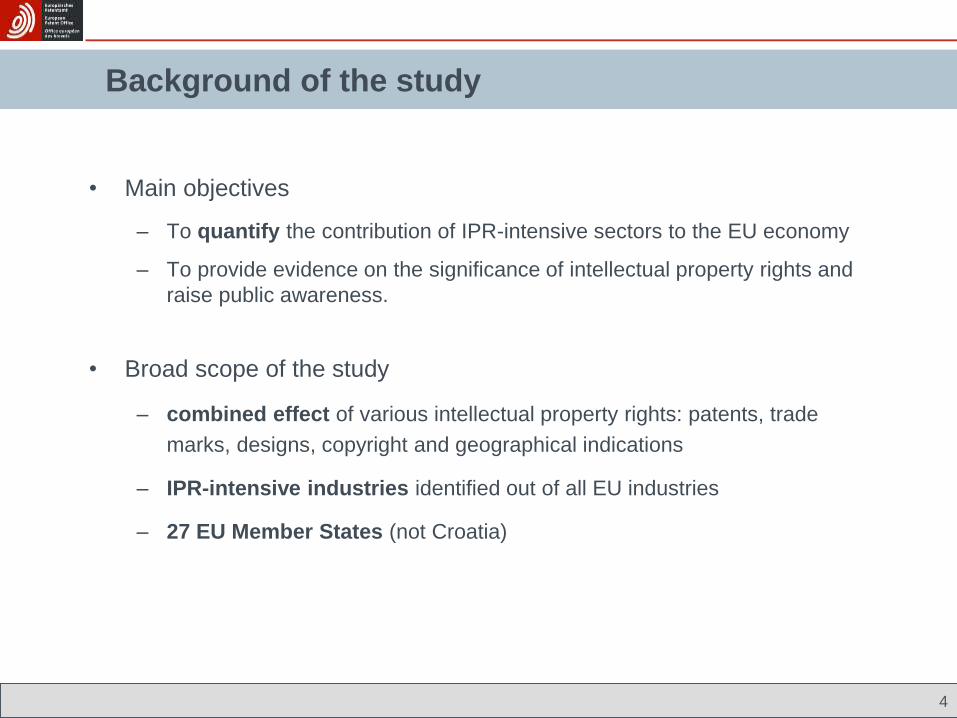
Background of the study
• Main objectives
– To quantify the contribution of IPR-intensive sectors to the EU economy
– To provide evidence on the significance of intellectual property rights and
raise public awareness.
• Broad scope of the study
– combined effect of various intellectual property rights: patents, trade
marks, designs, copyright and geographical indications
– IPR-intensive industries identified out of all EU industries
– 27 EU Member States (not Croatia)
4
Main findings
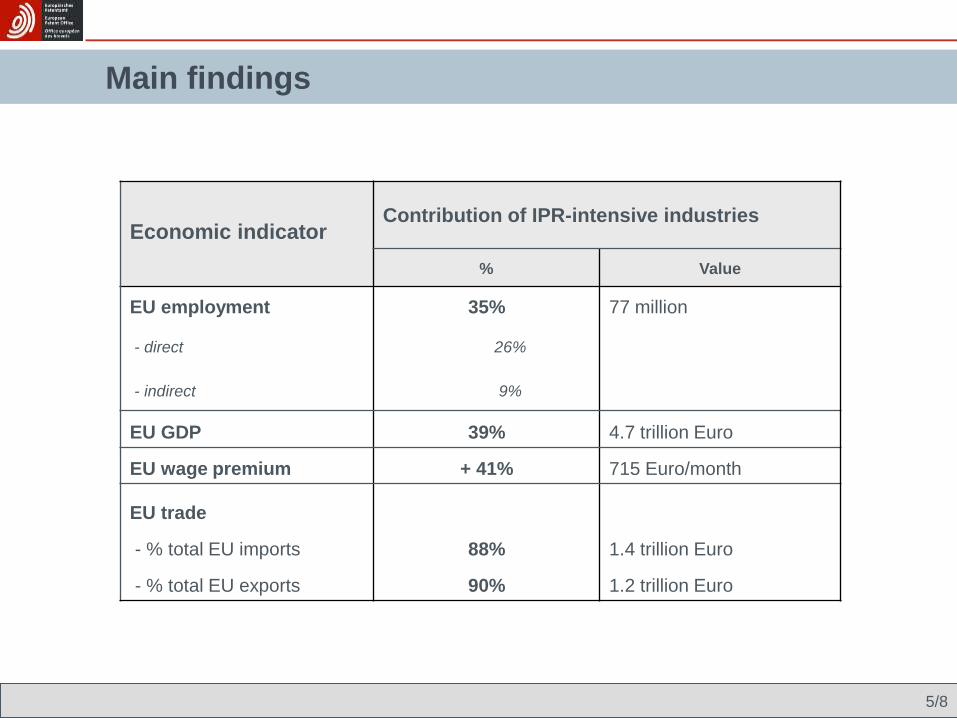
Economic indicator Contribution of IPR-intensive industries
% Value
EU employment 35% 77 million
- direct 26%
- indirect 9%
EU GDP 39% 4.7 trillion Euro
EU wage premium + 41% 715 Euro/month
EU trade
- % total EU imports 88% 1.4 trillion Euro
- % total EU exports 90% 1.2 trillion Euro
5/8

Into the methodology
6/8
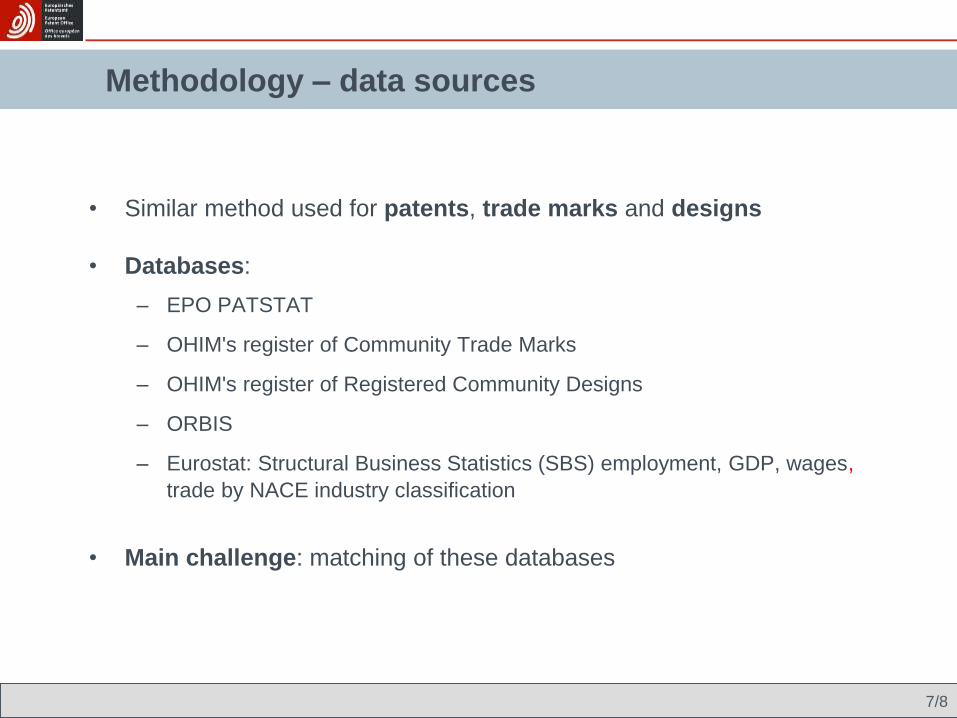
Methodology – data sources
• Similar method used for patents, trade marks and designs
• Databases:
– EPO PATSTAT
– OHIM's register of Community Trade Marks
– OHIM's register of Registered Community Designs
– ORBIS
– Eurostat: Structural Business Statistics (SBS) employment, GDP, wages,
trade by NACE industry classification
• Main challenge: matching of these databases
7/8
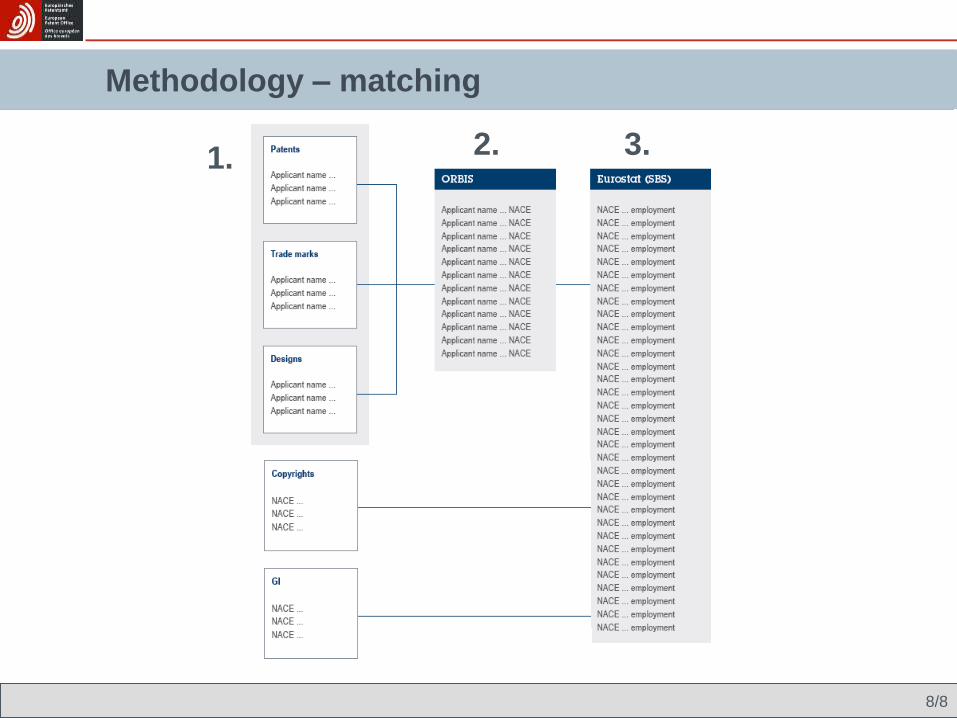
Methodology: overview of the approach
1. 2. 3.
Methodology – matching
8/8
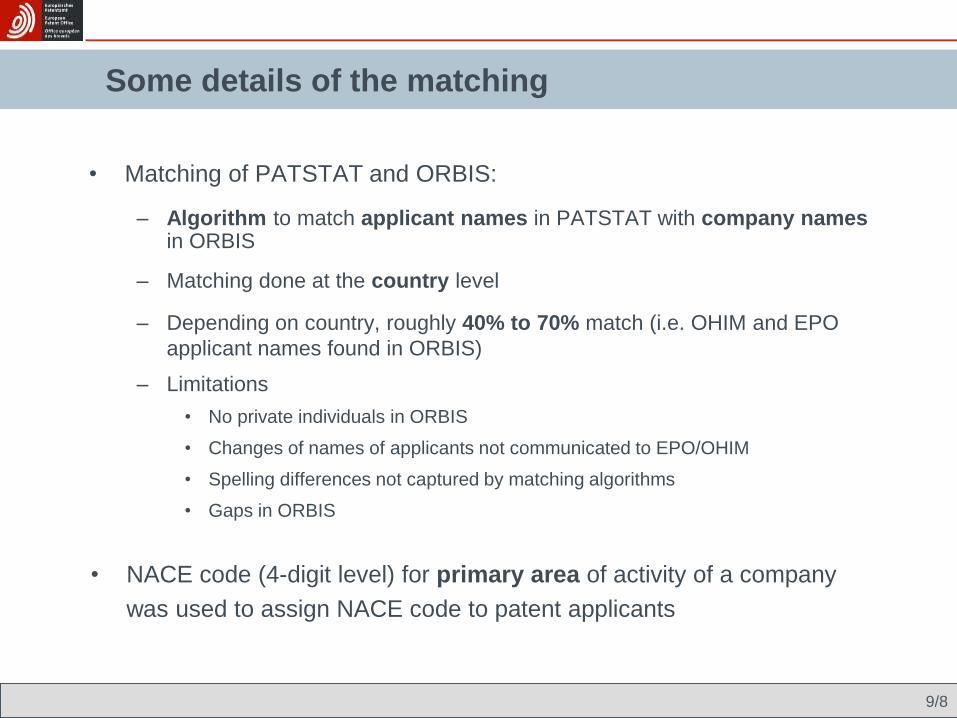
Some details of the matching
• Matching of PATSTAT and ORBIS:
– Algorithm to match applicant names in PATSTAT with company names in ORBIS
– Matching done at the country level
– Depending on country, roughly 40% to 70% match (i.e. OHIM and EPO
applicant names found in ORBIS)
– Limitations
• No private individuals in ORBIS
• Changes of names of applicants not communicated to EPO/OHIM
• Spelling differences not captured by matching algorithms
• Gaps in ORBIS
• NACE code (4-digit level) for primary area of activity of a company
was used to assign NACE code to patent applicants
9/8
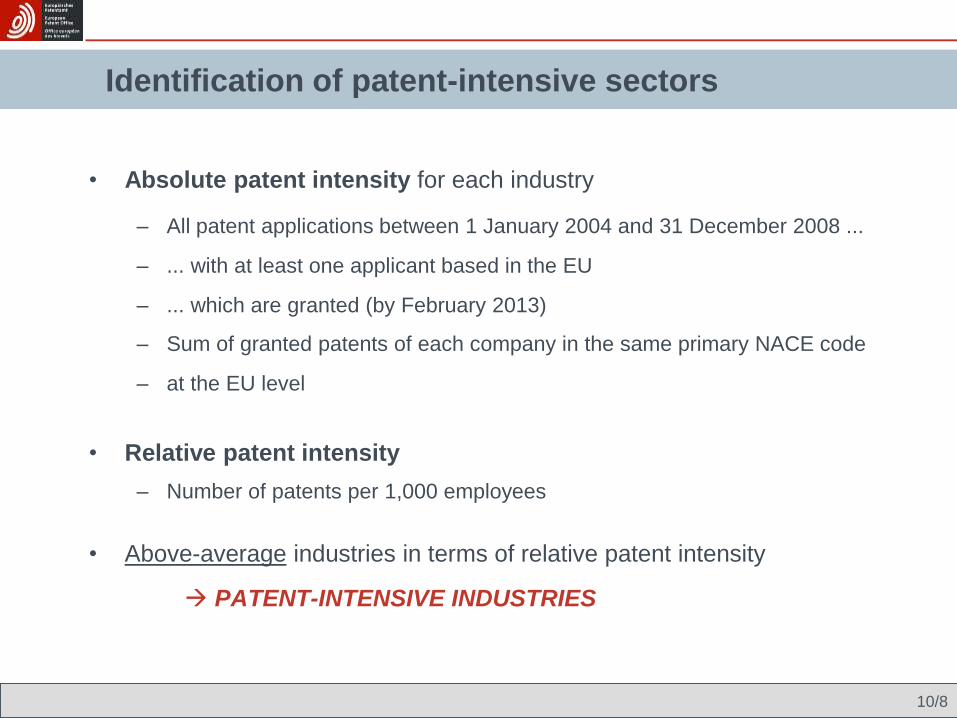
Identification of patent-intensive sectors
• Absolute patent intensity for each industry
– All patent applications between 1 January 2004 and 31 December 2008 ...
– ... with at least one applicant based in the EU
– ... which are granted (by February 2013)
– Sum of granted patents of each company in the same primary NACE code
– at the EU level
• Relative patent intensity
– Number of patents per 1,000 employees
• Above-average industries in terms of relative patent intensity
PATENT-INTENSIVE INDUSTRIES
10/8
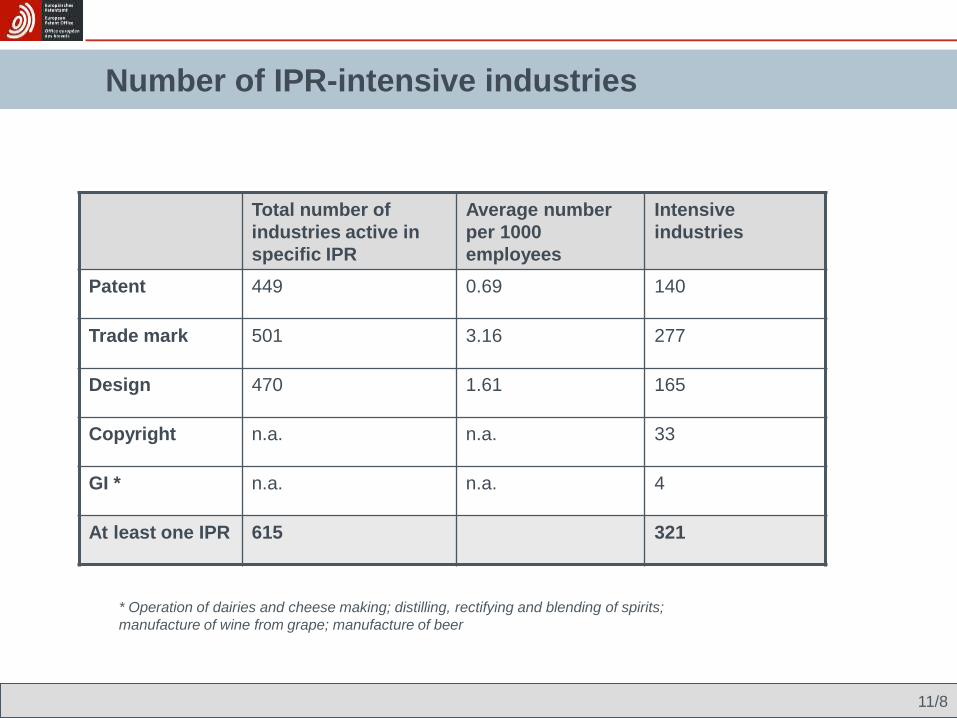
Number of IPR-intensive industries
Total number of
industries active in
specific IPR
Average number
per 1000
employees
Intensive
industries
Patent 449 0.69 140
Trade mark 501 3.16 277
Design 470 1.61 165
Copyright n.a. n.a. 33
GI * n.a. n.a. 4
At least one IPR 615 321
* Operation of dairies and cheese making; distilling, rectifying and blending of spirits;
manufacture of wine from grape; manufacture of beer
11/8
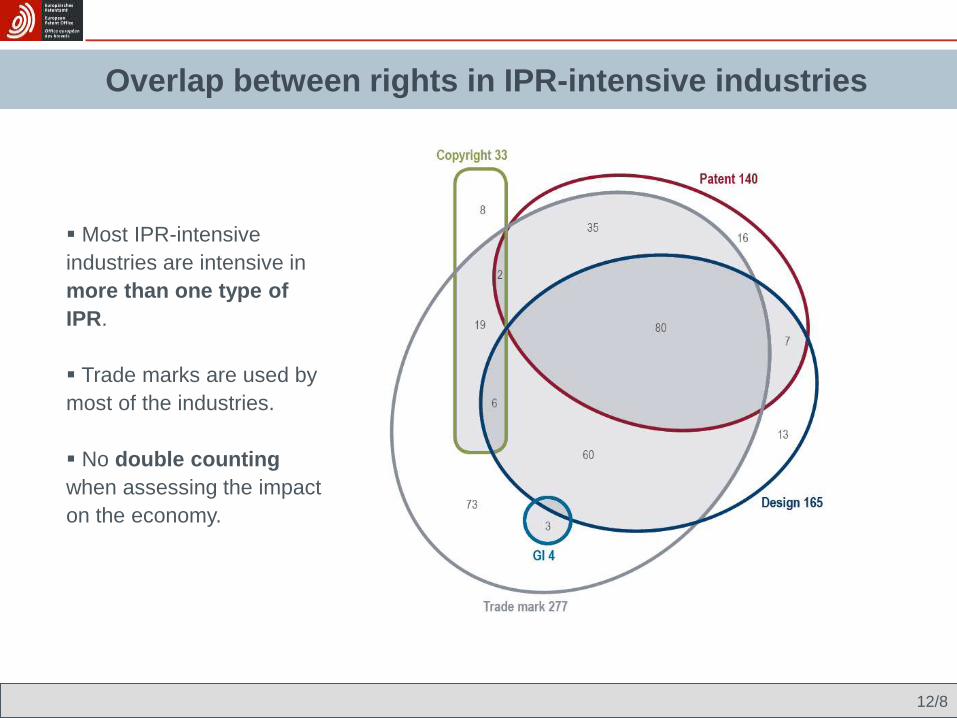
Overlap between rights in IPR-intensive industries
Most IPR-intensive
industries are intensive in
more than one type of
IPR.
Trade marks are used by
most of the industries.
No double counting
when assessing the impact
on the economy.
12/8
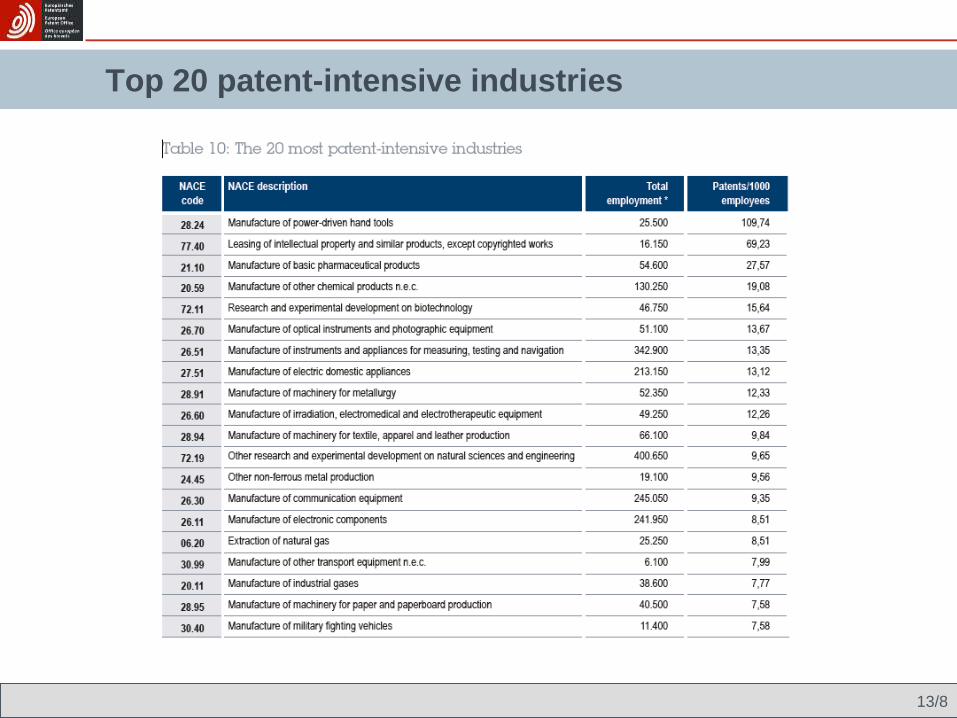
Examples of IPR-intensive industries Top 20 patent-intensive industries
13/8
Link to main economic variables
IPR-intensive industries identified on the basis of
successful applications in the period 2004 – 2008
Industry economic performance indicators in the
period 2008 - 2010
14/8
Link to main economic variables - some caveats
• Careful interpretation of results required:
– no causal relationships between IPR and economic variables
– no value of IPR for firms or for industries
– for some countries a relatively large share of applicants unaccounted for
– assumption of no variation in the use of IPR between firms within an
industry
– assumption of no variation in the industry use of IPR across countries
15/8
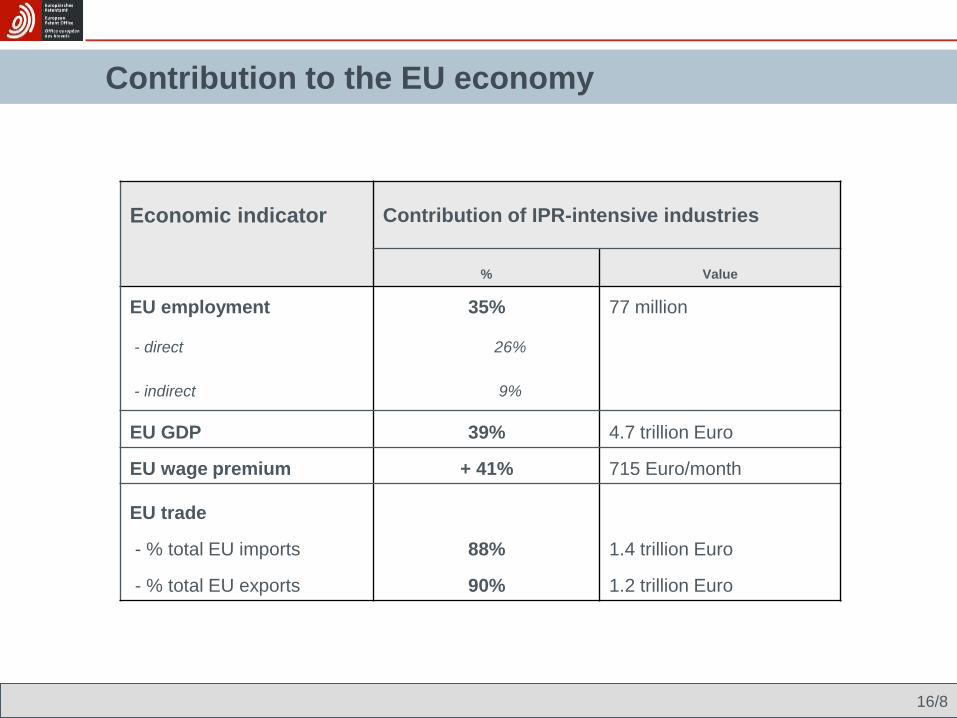
Contribution to the EU economy
Economic indicator Contribution of IPR-intensive industries
% Value
EU employment 35% 77 million
- direct 26%
- indirect 9%
EU GDP 39% 4.7 trillion Euro
EU wage premium + 41% 715 Euro/month
EU trade
- % total EU imports 88% 1.4 trillion Euro
- % total EU exports 90% 1.2 trillion Euro
16/8
Main findings: Country level analysis
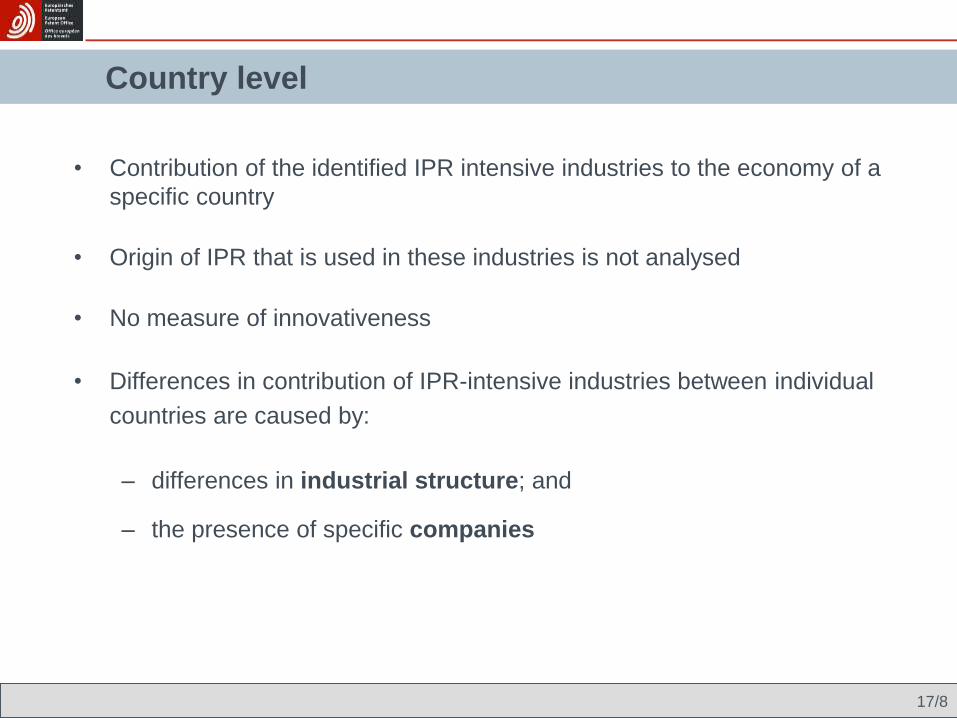
• Contribution of the identified IPR intensive industries to the economy of a
specific country
• Origin of IPR that is used in these industries is not analysed
• No measure of innovativeness
• Differences in contribution of IPR-intensive industries between individual
countries are caused by:
– differences in industrial structure; and
– the presence of specific companies
Country level
17/8
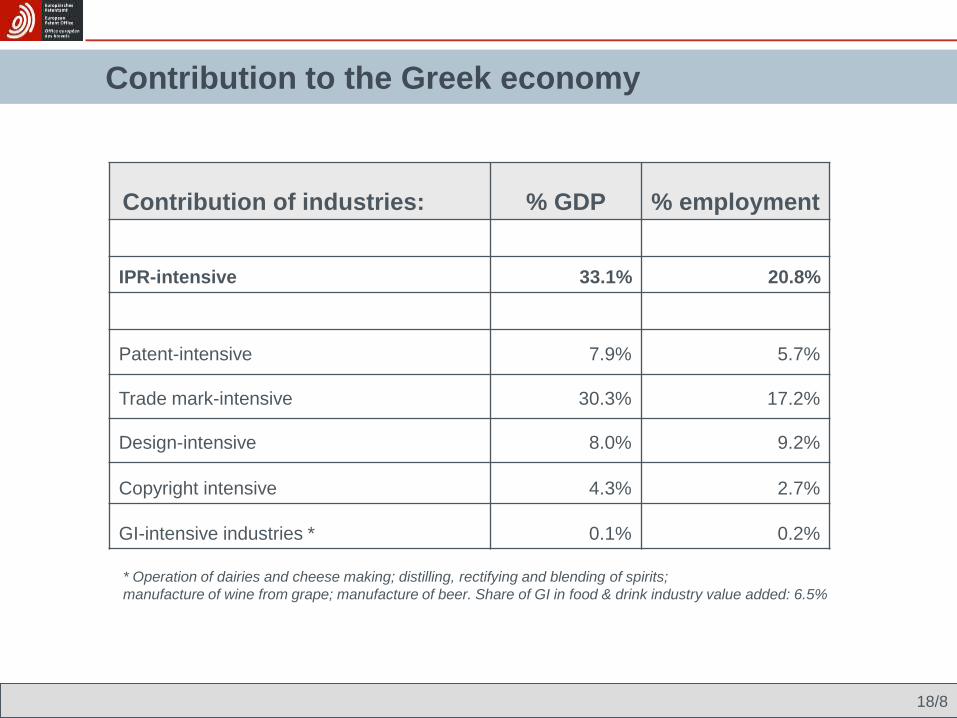
Contribution to the Greek economy
Contribution of industries: % GDP % employment
IPR-intensive 33.1% 20.8%
Patent-intensive 7.9% 5.7%
Trade mark-intensive 30.3% 17.2%
Design-intensive 8.0% 9.2%
Copyright intensive 4.3% 2.7%
GI-intensive industries * 0.1% 0.2%
* Operation of dairies and cheese making; distilling, rectifying and blending of spirits;
manufacture of wine from grape; manufacture of beer. Share of GI in food & drink industry value added: 6.5%
18/8
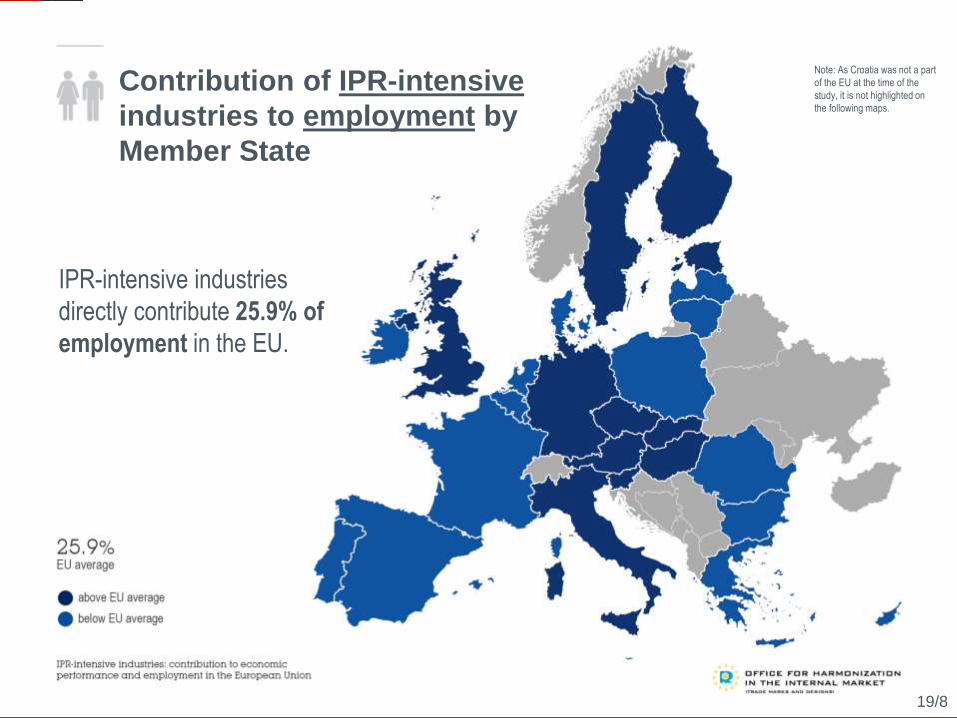
Contribution of IPR-intensive
industries to employment by
Member State
IPR-intensive industries
directly contribute 25.9% of
employment in the EU.
Note: As Croatia was not a part
of the EU at the time of the
study, it is not highlighted on
the following maps.
19/8
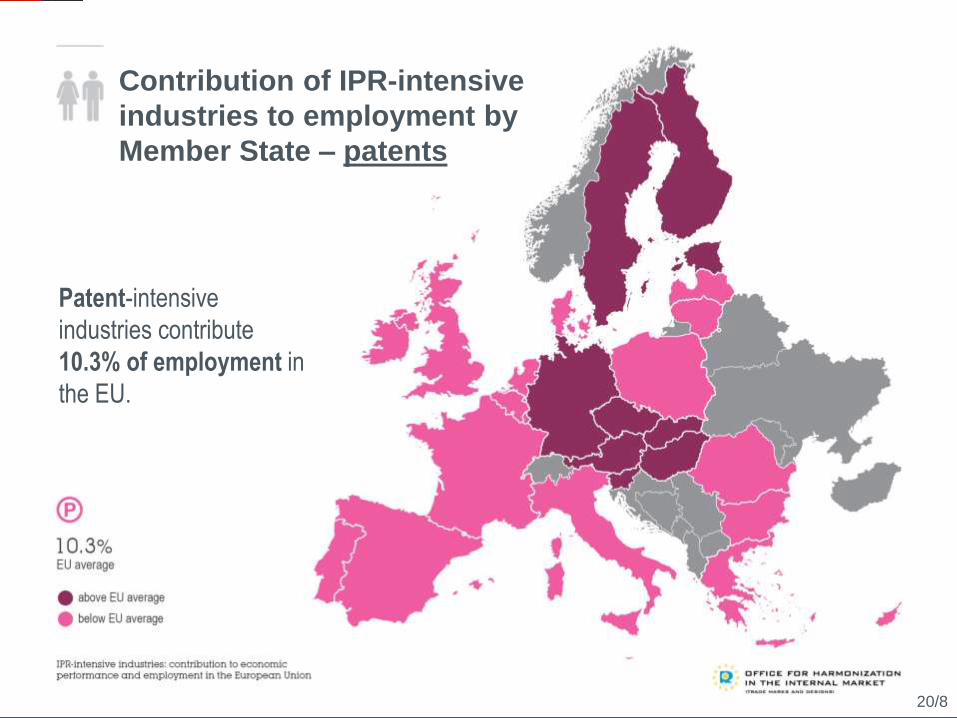
Contribution of IPR-intensive
industries to employment by
Member State – patents
Patent-intensive
industries contribute
10.3% of employment in
the EU.
20/8
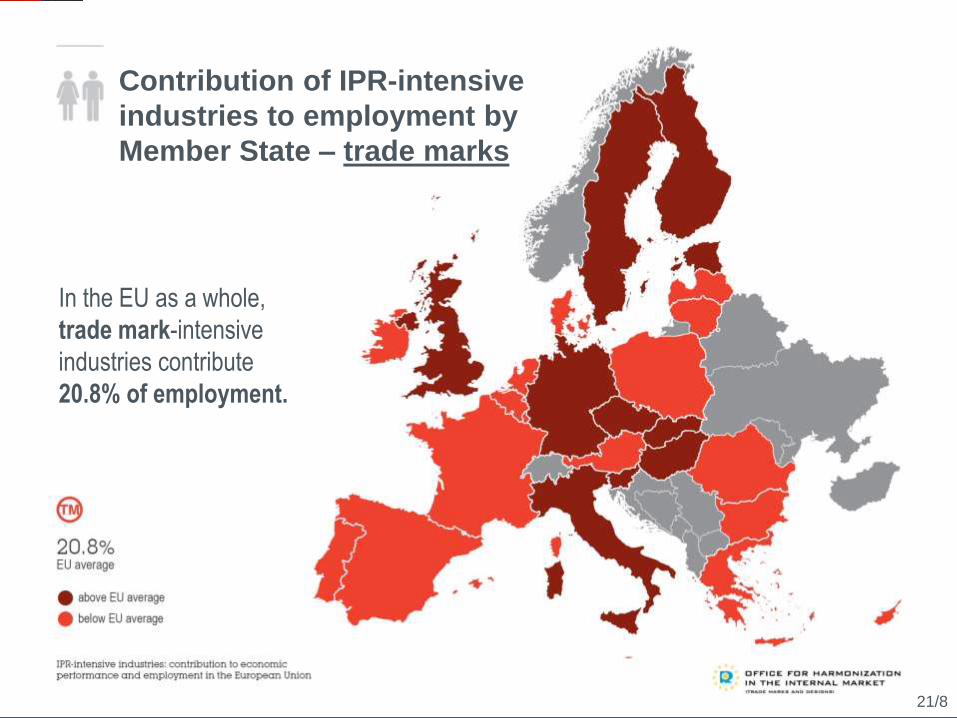
Contribution of IPR-intensive
industries to employment by
Member State – trade marks
In the EU as a whole,
trade mark-intensive
industries contribute
20.8% of employment.
21/8
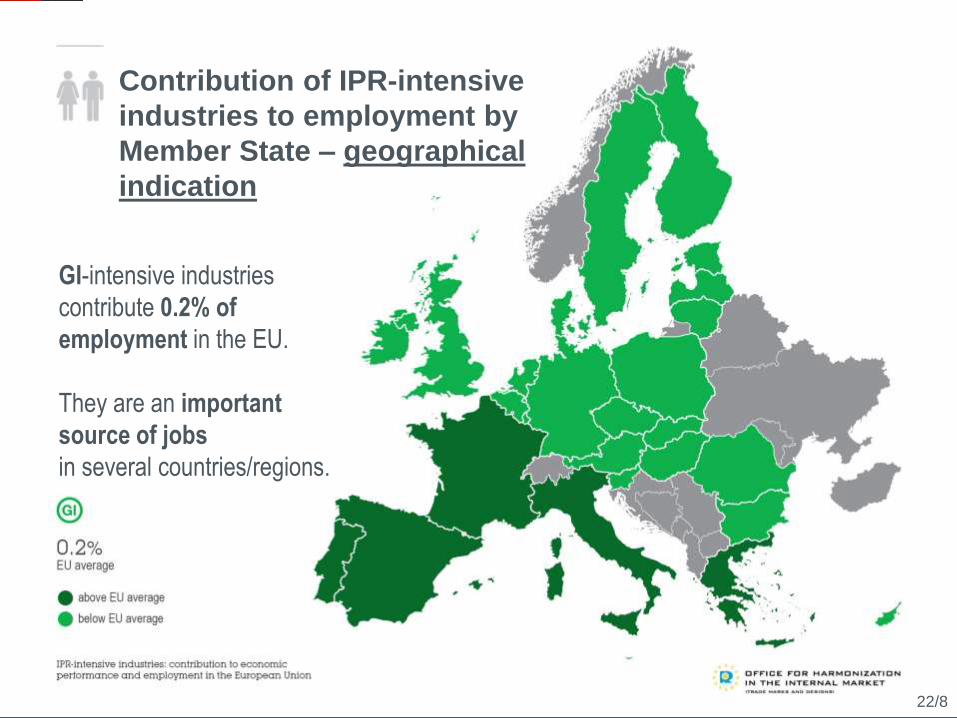
Contribution of IPR-intensive
industries to employment by
Member State – geographical
indication
GI-intensive industries
contribute 0.2% of
employment in the EU.
They are an important
source of jobs
in several countries/regions.
22/8
Main findings: Country level analysis
• Impact of IPRs on firm performance
• European and national applications of patents, trade marks and designs
• Econometric analysis
• Interplay between various IPRs – eg. are patents and trade marks
substitutes or complements?
• Expected publication: Q3/Q4 2014
Follow-up study with OHIM
23/8

Thank you for your attention
24/8