iran steel exports report 2017 - trade.gov€™s steel exports increased by 32 percent to 7.4...
TRANSCRIPT
1
Steel Exports Report: Iran April 2018 Background
Within the past year, Iran has emerged as the world’s eighteenth-largest steel exporter. In 2017, Iran exported 7.4 million metric tons of steel, a 32 percent increase from 5.6 million metric tons in 2016. Iran’s exports represented about 1 percent of all steel exported globally in 2016. The volume of Iran’s 2017 steel exports was about 1/10th that of the world’s largest exporter, China. In value terms, steel represented 6.4 percent of the total amount of goods Iran exported in 2017.
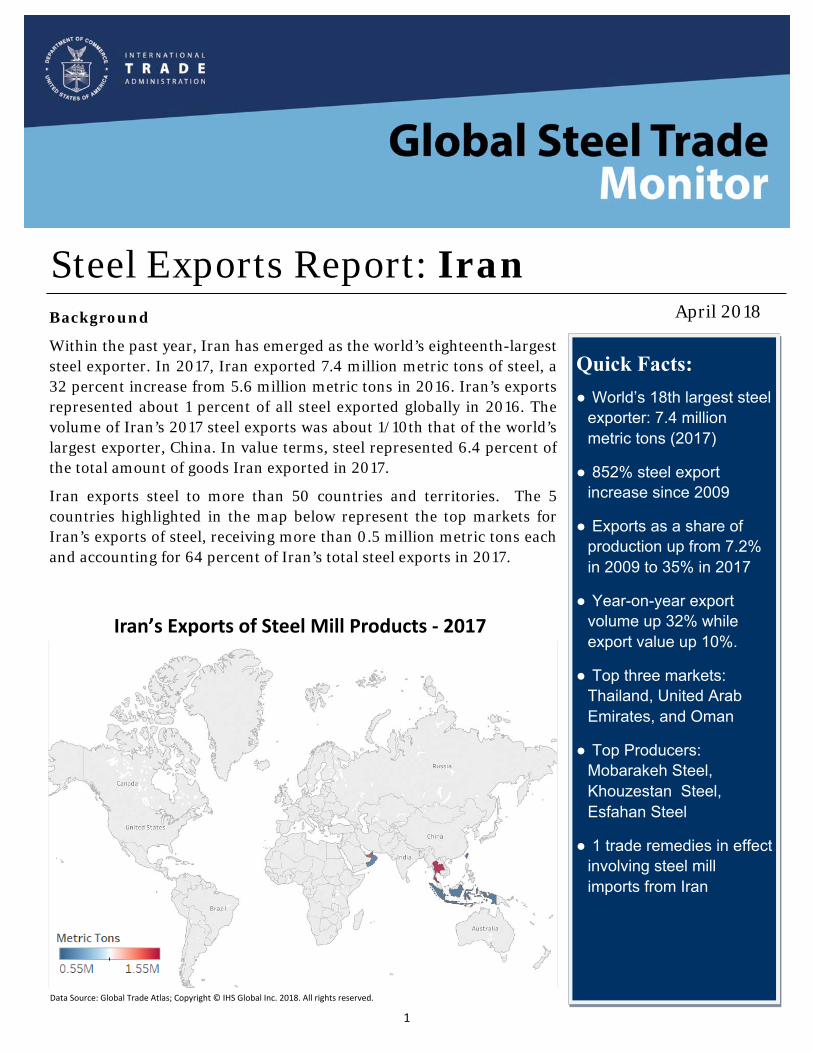
Iran exports steel to more than 50 countries and territories. The 5 countries highlighted in the map below represent the top markets for Iran’s exports of steel, receiving more than 0.5 million metric tons each and accounting for 64 percent of Iran’s total steel exports in 2017.
Quick Facts:
● World’s 18th largest steel exporter: 7.4 million metric tons (2017)
● 852% steel export increase since 2009
● Exports as a share of production up from 7.2% in 2009 to 35% in 2017
● Year-on-year export volume up 32% while export value up 10%.
● Top three markets: Thailand, United Arab Emirates, and Oman
● Top Producers: Mobarakeh Steel, Khouzestan Steel, Esfahan Steel
● 1 trade remedies in effect involving steel mill imports from Iran
Iran’s Exports of Steel Mill Products ‐ 2017
Data Source: Global Trade Atlas; Copyright © IHS Global Inc. 2018. All rights reserved.
2
Steel Trade Balance
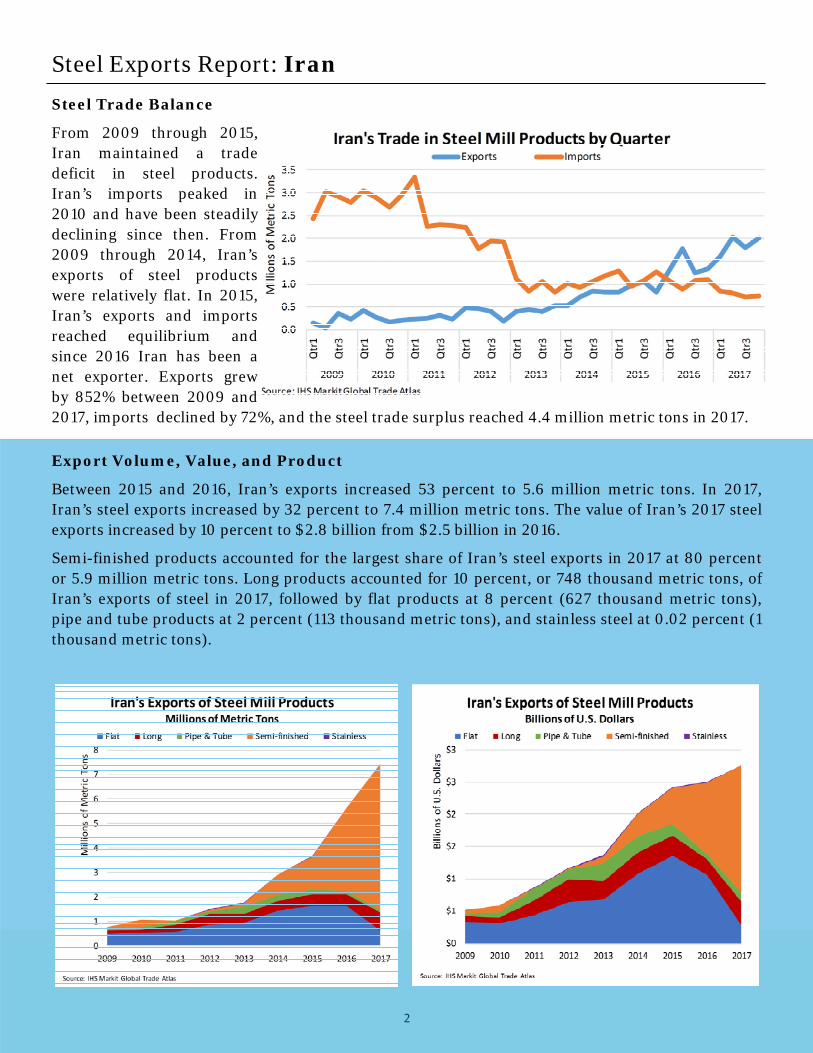
From 2009 through 2015, Iran maintained a trade deficit in steel products. Iran’s imports peaked in 2010 and have been steadily declining since then. From 2009 through 2014, Iran’s exports of steel products were relatively flat. In 2015, Iran’s exports and imports reached equilibrium and since 2016 Iran has been a net exporter. Exports grew by 852% between 2009 and 2017, imports declined by 72%, and the steel trade surplus reached 4.4 million metric tons in 2017.
Steel Exports Report: Iran
Export Volume, Value, and Product
Between 2015 and 2016, Iran’s exports increased 53 percent to 5.6 million metric tons. In 2017, Iran’s steel exports increased by 32 percent to 7.4 million metric tons. The value of Iran’s 2017 steel exports increased by 10 percent to $2.8 billion from $2.5 billion in 2016.
Semi-finished products accounted for the largest share of Iran’s steel exports in 2017 at 80 percent or 5.9 million metric tons. Long products accounted for 10 percent, or 748 thousand metric tons, of Iran’s exports of steel in 2017, followed by flat products at 8 percent (627 thousand metric tons), pipe and tube products at 2 percent (113 thousand metric tons), and stainless steel at 0.02 percent (1 thousand metric tons).
3
Steel Exports Report: Iran
Exports by Top Market
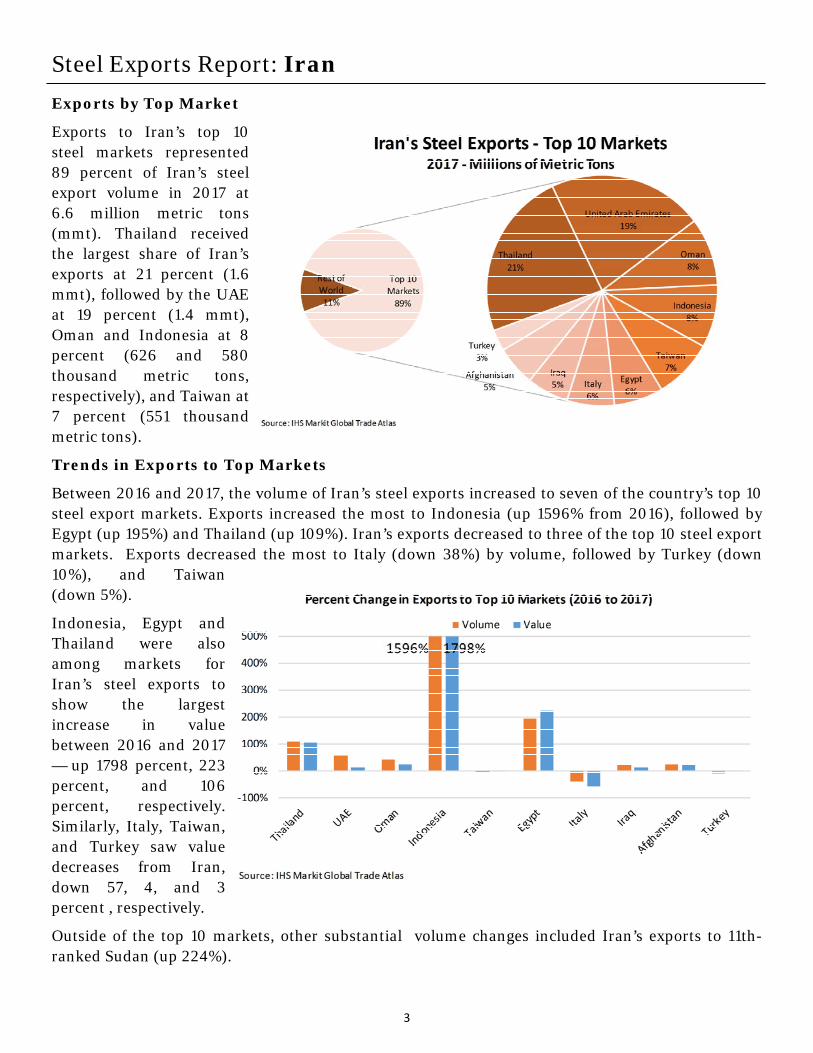
Exports to Iran’s top 10 steel markets represented 89 percent of Iran’s steel export volume in 2017 at 6.6 million metric tons (mmt). Thailand received the largest share of Iran’s exports at 21 percent (1.6 mmt), followed by the UAE at 19 percent (1.4 mmt), Oman and Indonesia at 8 percent (626 and 580 thousand metric tons, respectively), and Taiwan at 7 percent (551 thousand metric tons).
Trends in Exports to Top Markets
Between 2016 and 2017, the volume of Iran’s steel exports increased to seven of the country’s top 10 steel export markets. Exports increased the most to Indonesia (up 1596% from 2016), followed by Egypt (up 195%) and Thailand (up 109%). Iran’s exports decreased to three of the top 10 steel export markets. Exports decreased the most to Italy (down 38%) by volume, followed by Turkey (down 10%), and Taiwan (down 5%).
Indonesia, Egypt and Thailand were also among markets for Iran’s steel exports to show the largest increase in value between 2016 and 2017 — up 1798 percent, 223 percent, and 106 percent, respectively. Similarly, Italy, Taiwan, and Turkey saw value decreases from Iran, down 57, 4, and 3 percent , respectively.
Outside of the top 10 markets, other substantial volume changes included Iran’s exports to 11th-ranked Sudan (up 224%).

4
Steel Exports Report: Iran Top Markets by Steel Product Category
Iran’s top export markets by volume vary across types of steel products. The United Arab Emirates received the largest share of Iran’s exports of flat products in 2017 at 37 percent (231 thousand metric tons). Afghanistan held the largest share of Iran’s long products at 42 percent (313 thousand metric tons), and Turkmenistan accounted for the largest share of its pipe and tube products at 51 percent (58 thousand metric tons). Thailand received the largest share of Iran’s semi-finished products at 26 percent (1.5 million metric tons) in 2017, and the Netherlands was the top market for Iran’s stainless exports holding a 22 percent share (257 metric tons).
5
Steel Exports Report: Iran
Iran’s Import Market Share in Top Destinations
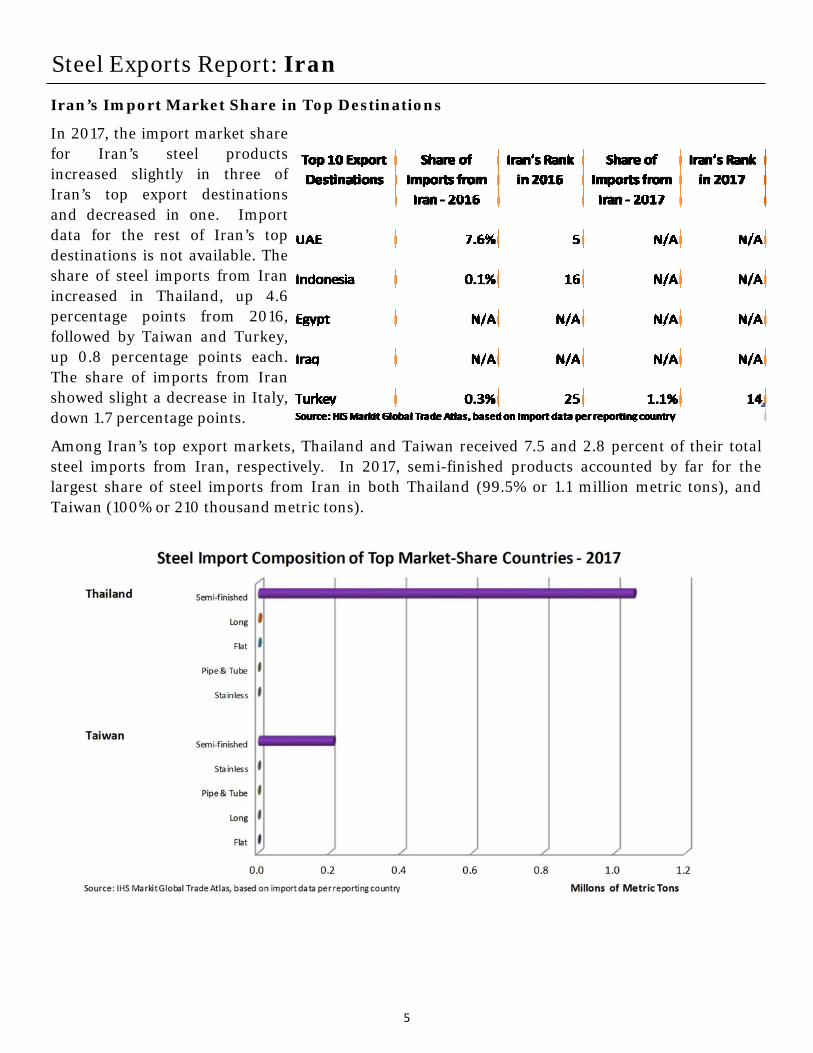
In 2017, the import market share for Iran’s steel products increased slightly in three of Iran’s top export destinations and decreased in one. Import data for the rest of Iran’s top destinations is not available. The share of steel imports from Iran increased in Thailand, up 4.6 percentage points from 2016, followed by Taiwan and Turkey, up 0.8 percentage points each. The share of imports from Iran showed slight a decrease in Italy, down 1.7 percentage points.
Among Iran’s top export markets, Thailand and Taiwan received 7.5 and 2.8 percent of their total steel imports from Iran, respectively. In 2017, semi-finished products accounted by far for the largest share of steel imports from Iran in both Thailand (99.5% or 1.1 million metric tons), and Taiwan (100% or 210 thousand metric tons).

6
Steel Exports Report: Iran
Overall Production and Export Share of Production
Iran’s crude steel production increased to 21.2 million metric tons in 2017, an increase of 19 percent from 2016’s total of 17.9 million metric tons. From 2009 through 2015, apparent consumption (a measure of steel demand) outpaced production. Since 2009, apparent consumption has been gradually declining and in 2017, production outpaced apparent consumption by 4.4 million metric tons. Between 2009 and 2017, crude steel production grew by 95 percent, while apparent consumption decreased by 21 percent. Between 2009 and 2017, Iran’s steel exports as a share of production increased by 27.8 percentage points as production and exports increased. In 2017, the export share of production was 35 percent.
Top Producers
The top three steel producers in Iran are all state-owned companies, and all three are subsidiaries of Iranian Mines & Mining Industries Development & Renovation (IMIDRO). Based on available data, the top three producers, accounted for roughly 64 percent of total production in 2017. In 2016, IMIDRO, and all its subsidiaries produced 14.02 mmt of steel, 78 percent of total production in 2016.
Iran’s Top Steel Producers
Rank Company Production (mmt)
Main Products
1 Mobarakeh Steel Company* 7 Hot-rolled, cold-rolled, galvanized, color coated
2 Khouzestan Steel Company* 3.6 Slab, blooms, billets
3 Esfahan Steel Company* 3 Beams, Bars
Source: World Steel Association; Bloomberg; Company websites *Denotes state-owned subsidiary of IMIDRO (Iranian Mines & Mining Industries Development & Renovation)
7
Steel Exports Report: Iran
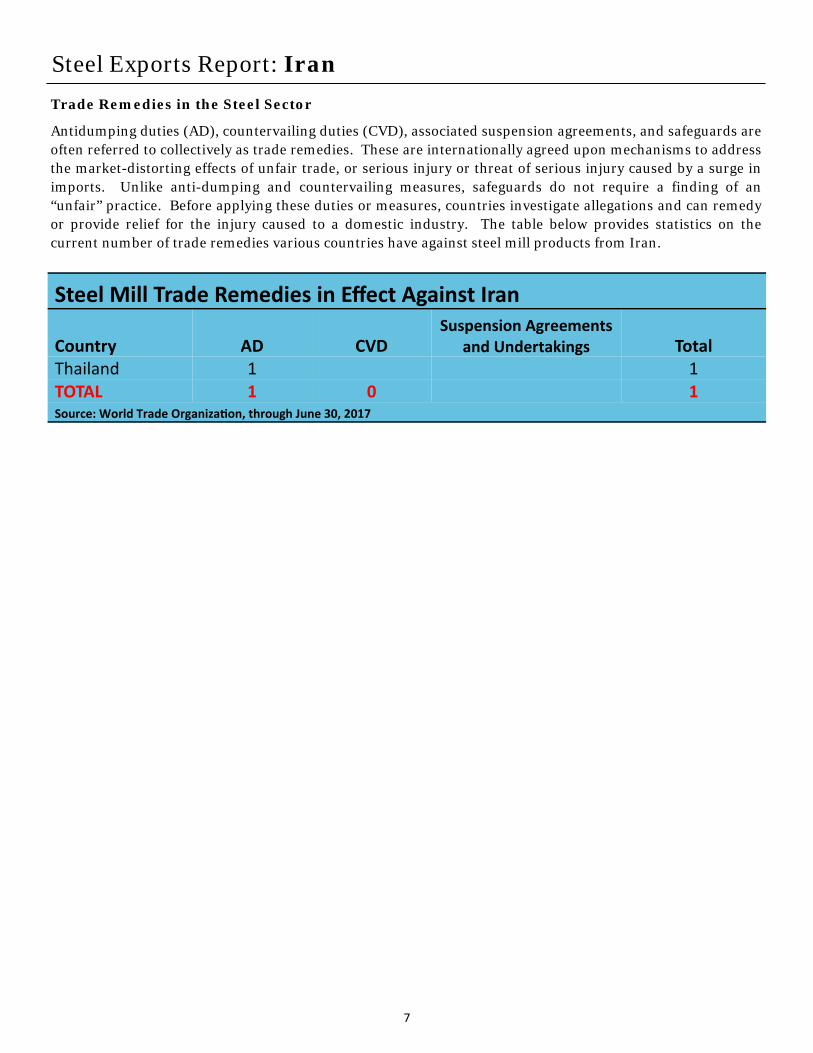
Steel Mill Trade Remedies in Effect Against Iran
Country AD CVD Suspension Agreements
and Undertakings Total Thailand 1 1 TOTAL 1 0 1 Source: World Trade Organiza on, through June 30, 2017
Trade Remedies in the Steel Sector
Antidumping duties (AD), countervailing duties (CVD), associated suspension agreements, and safeguards are often referred to collectively as trade remedies. These are internationally agreed upon mechanisms to address the market-distorting effects of unfair trade, or serious injury or threat of serious injury caused by a surge in imports. Unlike anti-dumping and countervailing measures, safeguards do not require a finding of an “unfair” practice. Before applying these duties or measures, countries investigate allegations and can remedy or provide relief for the injury caused to a domestic industry. The table below provides statistics on the current number of trade remedies various countries have against steel mill products from Iran.

8
Steel Exports Report: Glossary
Apparent Consumption: Domestic crude steel production plus steel imports minus steel exports. Shipment data are not available for all countries, therefore crude steel production is used as a proxy.
Export Market: Destination of a country’s exports.
Flat Products: Produced by rolling semi-finished steel through varying sets of rolls. Includes sheets, strips, and plates. Used most often in the automotive, tubing, appliance, and machinery manufacturing sectors.
Import Penetration: Ratio of imports to apparent consumption.
Import Source: Source of a country’s imports.
Long Products: Steel products that fall outside the flat products category. Includes bars, rails, rods, and beams. Used in many sectors but most commonly in construction.
Pipe and Tube Products: Either seamless or welded pipe and tube products. Used in many sectors but most commonly in construction and energy sectors.
Semi-finished Products: The initial, intermediate solid forms of molten steel, to be re-heated and further forged, rolled, shaped, or otherwise worked into finished steel products. Includes blooms, billets, slabs, ingots, and steel for castings.
Stainless Products: Steel products containing at minimum 10.5% chromium (Cr) offering better corrosion resistance than regular steel.
Steel Mill Products: Carbon, alloy, or stainless steel produced by either a basic oxygen furnace or an electric arc furnace. Includes semi-finished steel products and finished steel products. For trade data purposes, steel mill products are defined at the Harmonized System (HS) 6-digit level as: 720610 through 721650, 721699 through 730110, 730210, 730240 through 730290, and 730410 through 730690. The following discontinued HS codes have been included for purposes of reporting historical data (prior to 2007): 722520, 722693, 722694, 722910, 730410, 730421, 730610, 730620, and 730660.
Global Steel Trade Monitor: The monitor provides global import and export trends for the top countries trading in steel products. The current reports expand upon the early release information already provided by the Steel Import Monitoring and Analysis (SIMA) system that collects and publishes data on U.S. imports of steel mill products. Complementing the SIMA data, these reports provide objective and current global steel industry information about the top countries that play an essential role in the global steel trade. Information in these reports includes global exports and import trends, production and consumption data and, where available, information regarding trade remedy actions taken on steel products. The reports will be updated quarterly.
Steel Import Monitoring and Analysis (SIMA) System: The Department of Commerce uses a steel import licensing program to collect and publish aggregate data on near real-time steel mill imports into the United States. SIMA incorporates information collected from steel license applications with publicly released data from the U.S. Census Bureau. By design, this information provides stakeholders with valuable information on the steel trade with the United States. For more information about SIMA, please go to http://enforcement.trade.gov/steel/license/.