ireland; designing a green roof for ireland
TRANSCRIPT

8/3/2019 Ireland; Designing a Green Roof for Ireland
http://slidepdf.com/reader/full/ireland-designing-a-green-roof-for-ireland 1/20
Designing a Green Roof for Ireland
Report Contributors: Ian Hewitt1, Andrew Lacey2,
Niklas Mellgren 3, Michael Vynnycky4,
Marguerite Robinson4,5 and Mark Cooker6
Study Group Contributors: Andrew Fowler4, Maria Gonzalez4,
Hilda Simboek4, Thomas Murphy 7, Michael Devereux4, Roman
Sedakov4
, Grainne Kirby4
, Gemma Fay1
and Qi Wang8
Industry Representatives:
Catherine Adley 7, Billy Kirwan 9 and John O’Hara 10
1OCIAM, Mathematical Institute, University of Oxford, United Kingdom2Department of Mathematics, University Heriot-Watt, United Kingdom3Department of Mechanics, KTH Royal Institute of Technology, Sweden4MACSI, Department of Mathematics and Statistics, University of Limerick, Ireland5Report coordinator, [email protected] of Mathematics, University of East Anglia, United Kingdom7Department of Chemical and Environmental Science, University of Limerick, Ireland8School of mathematical sciences, Dublin Institute of Technology, Ireland9GFM Systems, Waterway House, Crag Crescent, Clondalkin Ind. Estate, Dublin 22, Ireland10Landtech Soils Ltd, 20 Kenyon Street, Nenagh, Co. Tipperary, Ireland
8/3/2019 Ireland; Designing a Green Roof for Ireland
http://slidepdf.com/reader/full/ireland-designing-a-green-roof-for-ireland 2/20
Abstract
A model is presented for the gravity-driven flow of rainwater descending through the soil layerof a green roof, treated as a porous medium on a flat permeable surface representing an efficientdrainage layer. A fully saturated zone is shown to occur. It is typically a thin layer, relativeto the total soil thickness, and lies at the bottom of the soil layer. This provides a bottom
boundary condition for the partially saturated upper zone. It is shown that after the onset of rainfall, well-defined fronts of water can descend through the soil layer. Also the rainwater flowis relatively quick compared with the moisture uptake by the roots of the plants in the roof.In a separate model the exchanges of water are described between the (smaller-scale) porousgranules of soil, the roots and the rainwater in the inter-granule pores.
46
8/3/2019 Ireland; Designing a Green Roof for Ireland
http://slidepdf.com/reader/full/ireland-designing-a-green-roof-for-ireland 3/20
1 Introduction
Green roofs are becoming increasingly popular around the world. The many benefits of a green
roof include assistance in the management of storm water, pollution control, building insulation,recycling of carbon dioxide, in addition to being aesthetically pleasing. A green roof is subjectto various stresses from the weather, in particular wind-loading, which we ignore in this report,and rainfall: it is the flow, drainage and uptake of rainwater that we model. An understandingof where the water goes is essential to design a roof able to achieve sustained healthy plantsand loads that lie within the safe capacity of the supporting structure.
The main focus of this report is on the transport of water through the green roof structure.Inadequate drainage can lead to the undesirable occurrence of a fully saturated soil which willcut off the air supply to the plants. Conversely, if the saturation levels are too low plants willdie from lack of water. Ideally a degree of saturation that is less than eighty per cent shouldbe maintained at all times. Our goal is to model the distribution of the degree of saturationthrough the depth of the soil layer, and to see how it changes due to spells of rain, and underthe influence of moisture-uptake by plant roots.
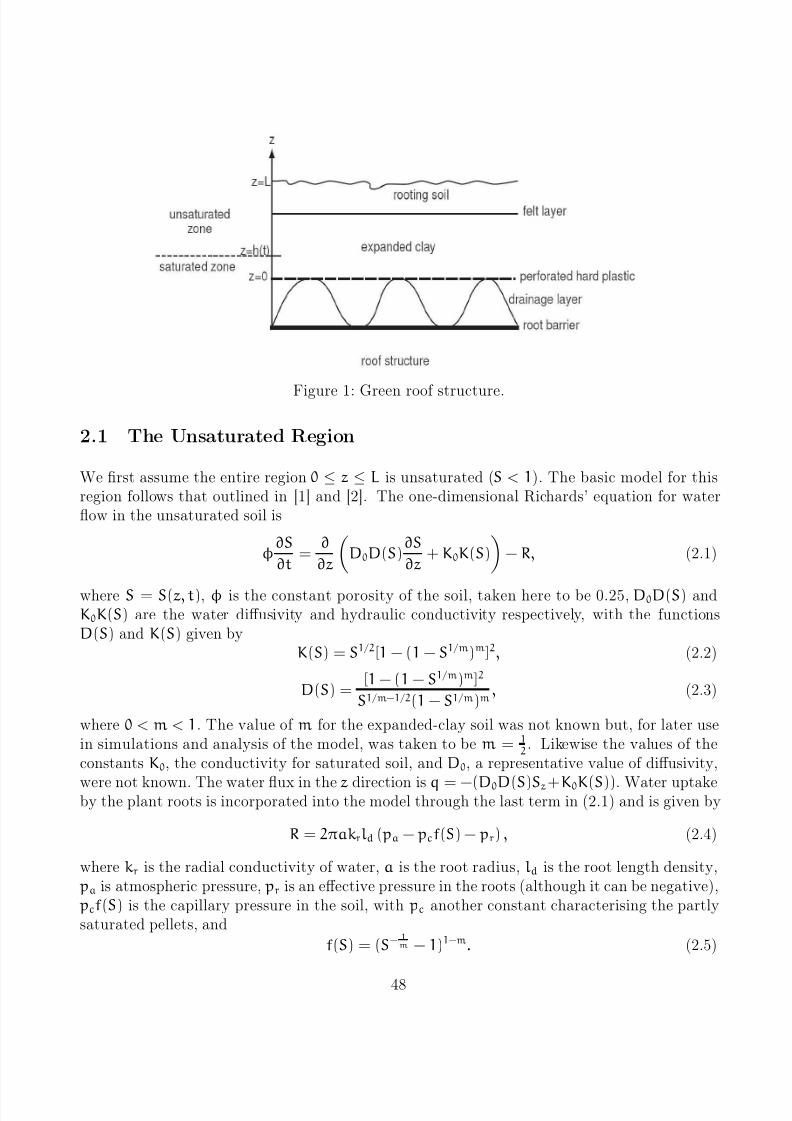
The basic structure of a common green roof is shown in Fig. 1. A waterproof root barrierprotects the underlying roof structure. A drainage layer sits atop this barrier. The typicalthickness of this layer is 8/15/20 mm depending on the type of roof. The soil and drainagelayers are separated by a thin sheet of perforated hard plastic containing holes approximately 2mm in diameter and spaced 2 cm apart. There are two layers of soil at the top of the structureseparated by a layer of felt. A thin layer (< 2 cm) of refined rooting soil contains the plant
life, mainly sedum for thinner roofs and, for thicker ones, low growing grasses such as commonbent grass and/or other plants, such as cowslip and ladies bedstraw. Beneath the rooting soilare pellets of lightweight expanded clay. This layer is 5-10 cm thick. Grain sizes are typically< 2 mm for rooting soil and 4-8 mm for expanded clay pellets.
2 The Model
We model the dynamics of water flow through the soil layer. We consider a single soil layerwith thickness L ≈ 10−1 m and we ignore the presence of the felt layer. We assume that the
soil-drainage-layer interface is located at z = 0 and the soil surface at z = L. We consider twopossible scenarios: (i ) the entire region 0 ≤ z ≤ L is unsaturated, so that the soil saturation S isalways less than 1 and (ii ) a saturated region forms at the bottom of the soil layer for 0 ≤ z ≤ h.Note that the model as presented here is one-dimensional, and represents a horizontal roof, butcan be easily extended to two (or three) dimensions, and to account for sloping roofs.
47
8/3/2019 Ireland; Designing a Green Roof for Ireland
http://slidepdf.com/reader/full/ireland-designing-a-green-roof-for-ireland 4/20
Figure 1: Green roof structure.
2.1 The Unsaturated Region
We first assume the entire region 0 ≤ z ≤ L is unsaturated (S < 1). The basic model for thisregion follows that outlined in [1] and [2]. The one-dimensional Richards’ equation for waterflow in the unsaturated soil is
φ∂S
∂t=
∂
∂z
D0D(S)
∂S
∂z+ K0K(S)
− R, (2.1)
where S = S(z, t), φ is the constant porosity of the soil, taken here to be 0.25, D0D(S) andK0K(S) are the water diffusivity and hydraulic conductivity respectively, with the functionsD(S) and K(S) given by
K(S) = S1/2[1 − (1 − S1/m)m ]2, (2.2)
D(S) =[1 − (1 − S1/m)m ]2
S1/m−1/2(1 − S1/m)m, (2.3)
where 0 < m < 1. The value of m for the expanded-clay soil was not known but, for later usein simulations and analysis of the model, was taken to be m = 1
2. Likewise the values of the
constants K0, the conductivity for saturated soil, and D0, a representative value of diffusivity,
were not known. The water flux in the z direction is q = −(D0D(S)Sz +K0K(S)). Water uptakeby the plant roots is incorporated into the model through the last term in (2.1) and is given by
R = 2πakrld ( pa − pcf(S) − pr) , (2.4)
where kr is the radial conductivity of water, a is the root radius, ld is the root length density, pa is atmospheric pressure, pr is an effective pressure in the roots (although it can be negative), pcf(S) is the capillary pressure in the soil, with pc another constant characterising the partlysaturated pellets, and
f(S) = (S− 1
m − 1)1−m. (2.5)
48

8/3/2019 Ireland; Designing a Green Roof for Ireland
http://slidepdf.com/reader/full/ireland-designing-a-green-roof-for-ireland 5/20
We take parameter values from Roose and Fowler [2] and let 2πakr = 7.85 × 10⁻¹⁶ m2 s−1
Pa−1, ld = 5 × 10³ m−2 and pc = 10 4 N m−2. The root pressure pr will be determined fromconservation of water within the root. Finally we must prescribe boundary conditions at the
top and bottom of the soil layer. At the soil surface we take
D0D(S)∂S
∂z+ K0K(S) = Qin(t) at z = L, (2.6)
where Qin is the rainfall rate averaged over the surface area of the ground. We assume, in thisunsaturated case, no outflow at the base of the soil layer and set
D0D(S)∂S
∂z+ K0K(S) = 0 at z = 0. (2.7)
We nondimensionalise the equations by scaling
z = Lz, pr = |P| ^ pr, t =L
K0
t, p = pa + pc ^ p, R= 2πakrld|P|R, Qin = QtypQ, (2.8)
where P is the (negative) root pressure at the soil surface and we set |P| = 106 N m−2. Thetime scale used here is that for flow though the soil layer under the action of gravity. Thedimensionless Richards’ equation (2.1) then has the form
φ∂S
∂t=
∂
∂z
δD(S)
∂S
∂z+ K(S)
− η(θ − εf(S) − ^ pr), (2.9)
where
δ =D0
LK0
≈ 10− 4, η =2πakrld|P|L
K0
≈ 4× 10⁻⁶, θ =pa
|P|≈ 10−1, ε =
pc
|P|≈ 10−2. (2.10)
Roose and Fowler [2] give values of D0 for different soil types and we can reasonably take D0 =
10−6 m2 s−1. However, the value of K0 is more difficult to determine as it varies significantlywith different soil types. The parameter values in (2.10) are given for K0 = 10−1 m s−1. We notethat η ≪ 1 suggesting that water uptake by the roots is negligible over the chosen timescale.The dimensionless forms of the boundary conditions are given by
δD(S)∂S
∂z + K(S) = νQ at z = 1, (2.11)
δD(S)∂S
∂z+ K(S) = 0 at z = 0, (2.12)
where
ν =Qtyp
K0
≈ 3× 10⁻⁶, (2.13)
with Qtyp taken to be some typical rainfall. We set Qtyp = 3 × 10⁻⁷ m s−1 for a “wet day" inIreland.
49
8/3/2019 Ireland; Designing a Green Roof for Ireland
http://slidepdf.com/reader/full/ireland-designing-a-green-roof-for-ireland 6/20
2.2 The Saturated Region
When the soil becomes saturated we assume that a moving boundary forms at z = h(t) and
the soil saturation is identically one for z ∈ [0, h ]. Our governing equation can now be writtenin the (dimensionless) form
∂
∂z
1 +
1
γ
∂^ p
∂z
− η (θ + ε^ p − ^ pr) = 0, (2.14)
where
γ =ρgL
pc
≈ 10−1. (2.15)
The flux through the membrane at z = 0 is prescribed to occur at a rate proportional to thepressure difference across it; Qmem = κ( p − pa) dimensionally, where pa is the atmospheric
pressure in the drainage layer beneath, p is the pressure at z = 0, and κ ≈ 10−5 m s−1 Pa−1
(determined experimentally in the next sub-section). This gives the dimensionless condition
1 +1
γ
∂^ p
∂z= α^ p at z = 0, (2.16)
where α = κpcK0
≈ 1. At the saturation front z = h(t) ≡h(t)
L, ^ p = 0 (atmospheric), and
continuity of fluid flux requires
K(S) + δD(S)∂S
∂z= 1 +
1
γ
∂^ p
∂zat z = h. (2.17)
Neglecting the η term in (2.14) for this saturated region, and using ^ p = 0 at z = h along with(2.16), gives
^ p(z, t) =γ(h(t) − z)
1 + αγh(t), (2.18)
so that (2.17) becomes
K(S) + δD(S)∂S
∂z=
αγh
1 + αγhat z = h. (2.19)
In principle equation (2.19) and boundary condition S = 1 at z = h(t) determine h in termsof the flux from the unsaturated region. However, we can simplify things if we notice from(2.11) that the dimensionless flux will in general be small, of order ν (due to the rainfall). If this is the case, then the value of h required to satisfy (2.19) will be small. Physically, this isbecause for the typical size of fluid flux considered, the pressure required to force it throughthe membrane according to (2.16) is provided by the hydrostatic head of a very thin layer of water (dimensionally, h is calculated to be much less than 1 mm).
Thus if a saturated region is created at the bottom of the soil layer, it will quickly grow to adepth which is sufficient to drain exactly the same amount of water through the membrane as
50
8/3/2019 Ireland; Designing a Green Roof for Ireland
http://slidepdf.com/reader/full/ireland-designing-a-green-roof-for-ireland 7/20
is arriving from the unsaturated region above. Provided this depth is substantially less thanthe depth of the soil, the saturated region can be ‘collapsed’ (mathematically) onto the linez = 0, and the boundary condition applied to the problem in the unsaturated zone for some of
the numerical solutions of sub-section 2.5 is then∂
∂z
K(S) + δD(S)
∂S
∂z
= 0 at z = 0, 11 (2.20)
which states that whatever flux arrives there from above is allowed through the membrane (thebuild-up of the small saturated layer which would physically enable this is therefore assumedto happen instantaneously), with the uptake of water by the roots being neglected. We apply(2.20) while K(S) + δD(S) ∂S
∂z> 0 at z = 0 since water is trying to exit, not enter, the soil layer.
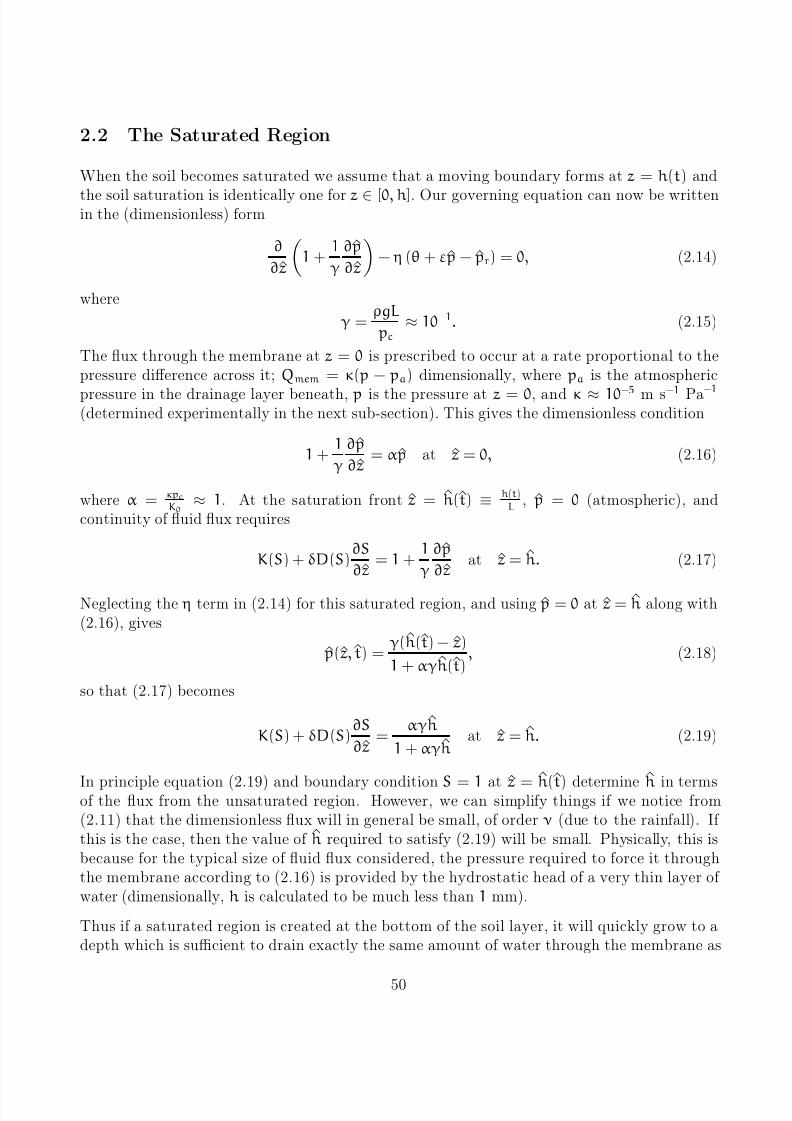
2.3 Experimental measurement of κThe value of κ was deduced from a simple experiment, which involved puncturing a 2 mmdiameter hole in a plastic bottle, made with material similar to what we believe the drainagemembrane is made of. The rate of drainage through the hole driven by the hydraulic headin the bottle was measured, and used to determine the coefficient of proportionality betweenpressure difference across the membrane ∆p and the water flux through it q. Writing
q = k∆p, (2.21)
where ∆p = ρgh, the water depth in the bottle, h, satisfies the equation
Abottledhdt
= −kρgh, (2.22)
where Abottle is the cross-sectional area of the bottle. Thus
log h = −kρg
Abottle
t. (2.23)
Measurements of h against t made during the experiment are in Fig. 2, and the best fit valueof the time constant tc = Abottle/kρg was 74 seconds. The flux through an individual hole canbe converted into an average velocity through a membrane, using the area of the membraneAmembrane that is drained by each hole. Thus
¯ u = κ∆p, κ =Abottle
Amembraneρgtc
. (2.24)
Taking Amembrane = π cm2, and using the cross-sectional area of the bottle Abottle = 25 cm2,ρ = 103 kg m−3, and g = 10 m s−2, gives κ ≈ 10−5 m s−1 Pa−1.
11More accurately the bottom condition might be specified in linear complementary form (1 − S)q = 0 with1 − S ≥ 0 (for no super-saturation) and q ≤ 0 (for upward flux). We use (2.20) for its convenience in some of the numerical simulations, but for others we approximate the more correct linear complementary form, as in(2.33).
51

8/3/2019 Ireland; Designing a Green Roof for Ireland
http://slidepdf.com/reader/full/ireland-designing-a-green-roof-for-ireland 8/20
0 20 40 60 80 100
101
t (s)
h ( c m )
Figure 2: Experimental measurements of h against t.
2.4 The Root Pressure
To determine the root pressure pr in equation (2.9), we assume that the root extends through
the full thickness of the soil layer of depth L. Conservation of water inside the root yields
kz
d2 pr
dz2+ 2πakr ( pa − pcf(S) − pr) = 0, (2.25)
where kz = 10−14 m6 s−1 N−1 is the root axial conductivity and f(S) is defined in equation (2.5).Zero axial flux at the root tip implies
dpr
dz+ ρg = 0 at z = 0. (2.26)
In addition we prescribe a driving pressure at the root base yielding
pr = pa + P at z = L. (2.27)
In dimensionless form the root pressure will satisfy
d2 ^ pr
dz2+ τ (θ − εf(S) − ^ pr) = 0, (2.28)
subject tod^ pr
dz= −εγ at z = 0, (2.29)
52
8/3/2019 Ireland; Designing a Green Roof for Ireland
http://slidepdf.com/reader/full/ireland-designing-a-green-roof-for-ireland 9/20
^ pr = θ − 1 at z = 1, (2.30)
where
τ =
2πakrL2
kz ≈ 10
−3
. (2.31)
The parameters τ ≪ 1 and εγ ≪ 1 which implies d2^ prdz2
≈ 0 subject to d^ prdz
= 0 on z = 0. Theroot pressure is thus given by
^ pr = θ − 1. (2.32)
The complete model is now given by (2.9), with the definitions (2.2), (2.3), (2.5) and (2.32),
with boundary condition (2.11) at z = 1 and (2.12) if S < 1, or (2.20) if S = 1, at z = 0. Aninitial condition is also needed.
The diffusion term in (2.9) is small, so the equation is essentially a first order non-linear wave
equation; the boundary condition (rainfall) is transmitted downwards as a wave. If rain startssuddenly, there is a shock front that propagates quickly down to the bottom of the soil; if itstops suddenly there is an expansion fan.
2.5 Numerical Solutions
The governing equation for the unsaturated region (2.9) was solved subject to boundaryconditions (2.11) and (2.12). As a first approach the η term in (2.9) is neglected so thatwe are just considering drainage of the soil layer under gravity. The initial saturation was
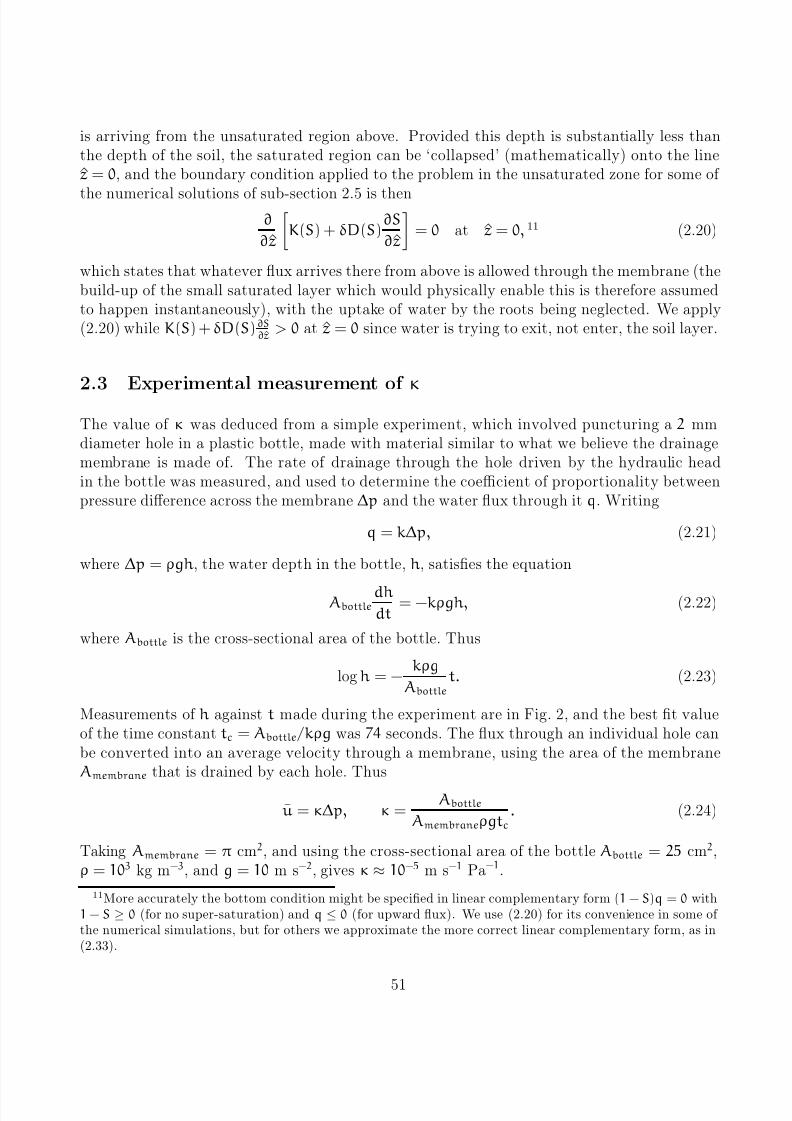
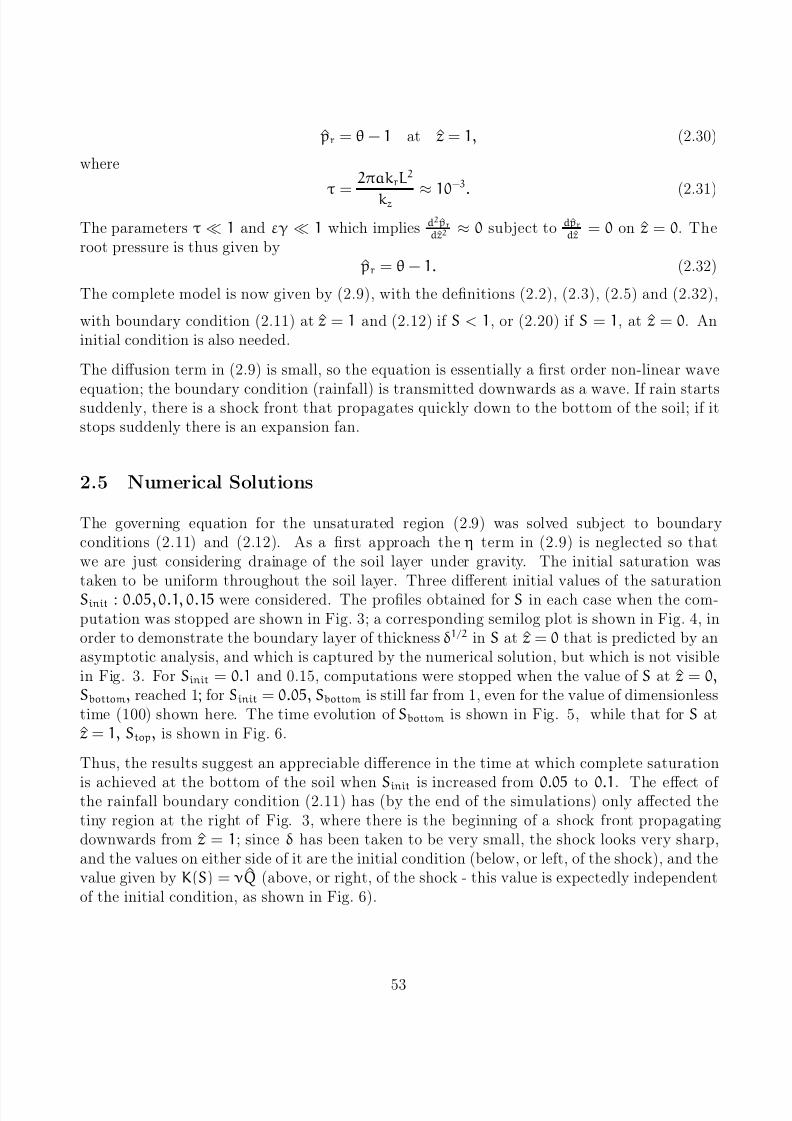
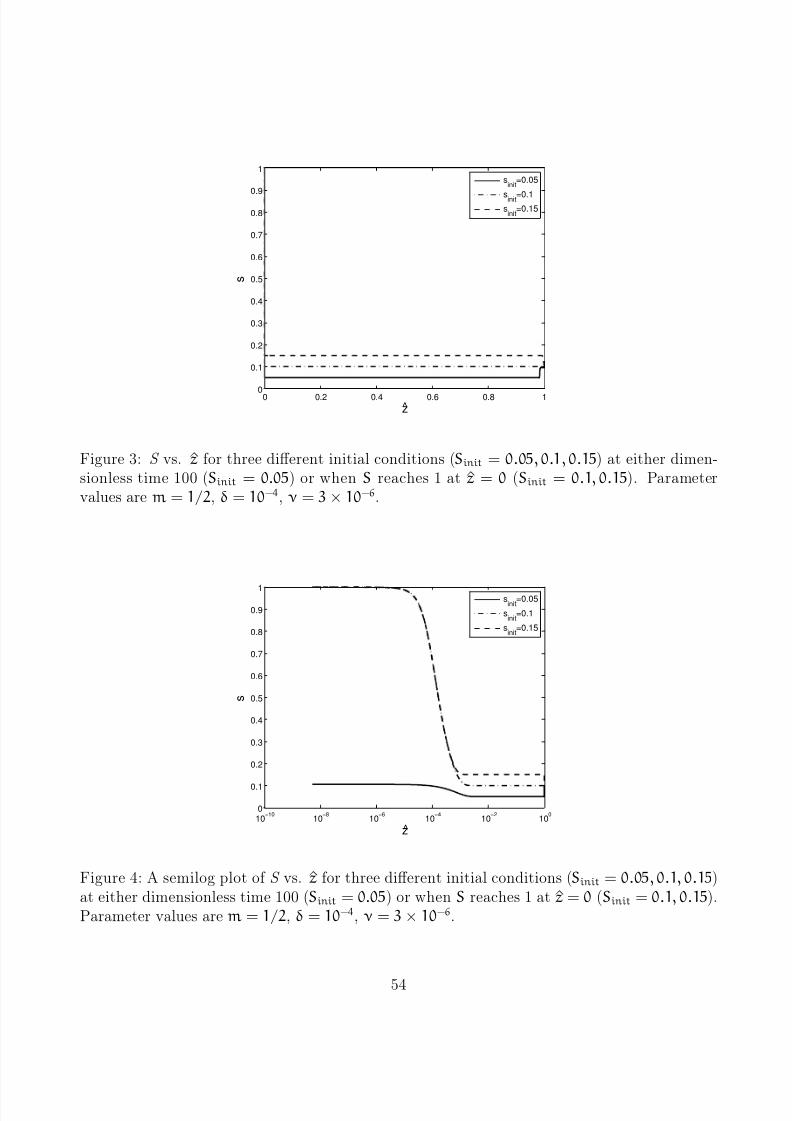
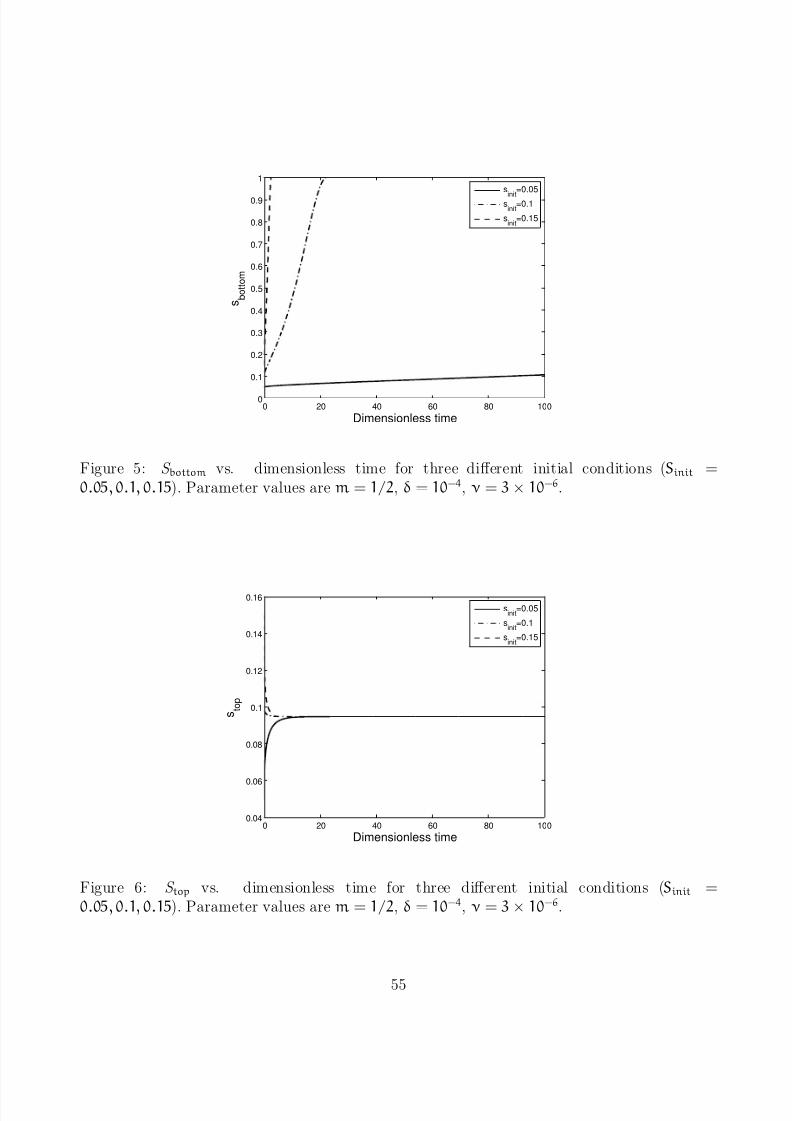
taken to be uniform throughout the soil layer. Three different initial values of the saturationSinit : 0.05, 0.1, 0.15 were considered. The profiles obtained for S in each case when the com-putation was stopped are shown in Fig. 3; a corresponding semilog plot is shown in Fig. 4, inorder to demonstrate the boundary layer of thickness δ1/2 in S at z = 0 that is predicted by anasymptotic analysis, and which is captured by the numerical solution, but which is not visiblein Fig. 3. For Sinit = 0.1 and 0.15, computations were stopped when the value of S at z = 0,Sbottom, reached 1; for Sinit = 0.05, Sbottom is still far from 1, even for the value of dimensionlesstime (100) shown here. The time evolution of Sbottom is shown in Fig. 5, while that for S atz = 1, Stop, is shown in Fig. 6.
Thus, the results suggest an appreciable difference in the time at which complete saturation
is achieved at the bottom of the soil when Sinit is increased from 0.05 to 0.1. The effect of the rainfall boundary condition (2.11) has (by the end of the simulations) only affected thetiny region at the right of Fig. 3, where there is the beginning of a shock front propagatingdownwards from z = 1; since δ has been taken to be very small, the shock looks very sharp,and the values on either side of it are the initial condition (below, or left, of the shock), and thevalue given by K(S) = νQ (above, or right, of the shock - this value is expectedly independentof the initial condition, as shown in Fig. 6).
53
8/3/2019 Ireland; Designing a Green Roof for Ireland
http://slidepdf.com/reader/full/ireland-designing-a-green-roof-for-ireland 10/20
0 0.2 0.4 0.6 0.8 10
0.1
0.2
0.3
0.4
0.5
0.6
0.7
0.8
0.9
1
z
s
^
sinit
=0.05
sinit=0.1s
init=0.15
Figure 3: S vs. z for three different initial conditions (Sinit = 0.05, 0.1, 0.15) at either dimen-sionless time 100 (Sinit = 0.05) or when S reaches 1 at z = 0 (Sinit = 0.1, 0.15). Parametervalues are m = 1/2, δ = 10− 4, ν = 3× 10⁻⁶.
10−10
10−8
10−6
10−4
10−2
100
0
0.1
0.2
0.3
0.4
0.5
0.6
0.7
0.8
0.9
1
z
s
^
sinit
=0.05
sinit
=0.1
sinit
=0.15
Figure 4: A semilog plot of S vs. z for three different initial conditions (Sinit = 0.05, 0.1, 0.15)at either dimensionless time 100 (Sinit = 0.05) or when S reaches 1 at z = 0 (Sinit = 0.1, 0.15).Parameter values are m = 1/2, δ = 10− 4, ν = 3× 10⁻⁶.
54
8/3/2019 Ireland; Designing a Green Roof for Ireland
http://slidepdf.com/reader/full/ireland-designing-a-green-roof-for-ireland 11/20
0 20 40 60 80 1000
0.1
0.2
0.3
0.4
0.5
0.6
0.7
0.8
0.9
1
Dimensionless time
s b o t t o m
sinit
=0.05
sinit
=0.1
sinit
=0.15
Figure 5: S bottom vs. dimensionless time for three different initial conditions (Sinit =
0.05, 0.1, 0.15). Parameter values are m = 1/2, δ = 10− 4, ν = 3× 10⁻⁶.
0 20 40 60 80 1000.04
0.06
0.08
0.1
0.12
0.14
0.16
Dimensionless time
s t o p
sinit
=0.05
sinit
=0.1
sinit
=0.15
Figure 6: S top vs. dimensionless time for three different initial conditions (Sinit =
0.05, 0.1, 0.15). Parameter values are m = 1/2, δ = 10− 4, ν = 3× 10⁻⁶.
55
8/3/2019 Ireland; Designing a Green Roof for Ireland
http://slidepdf.com/reader/full/ireland-designing-a-green-roof-for-ireland 12/20
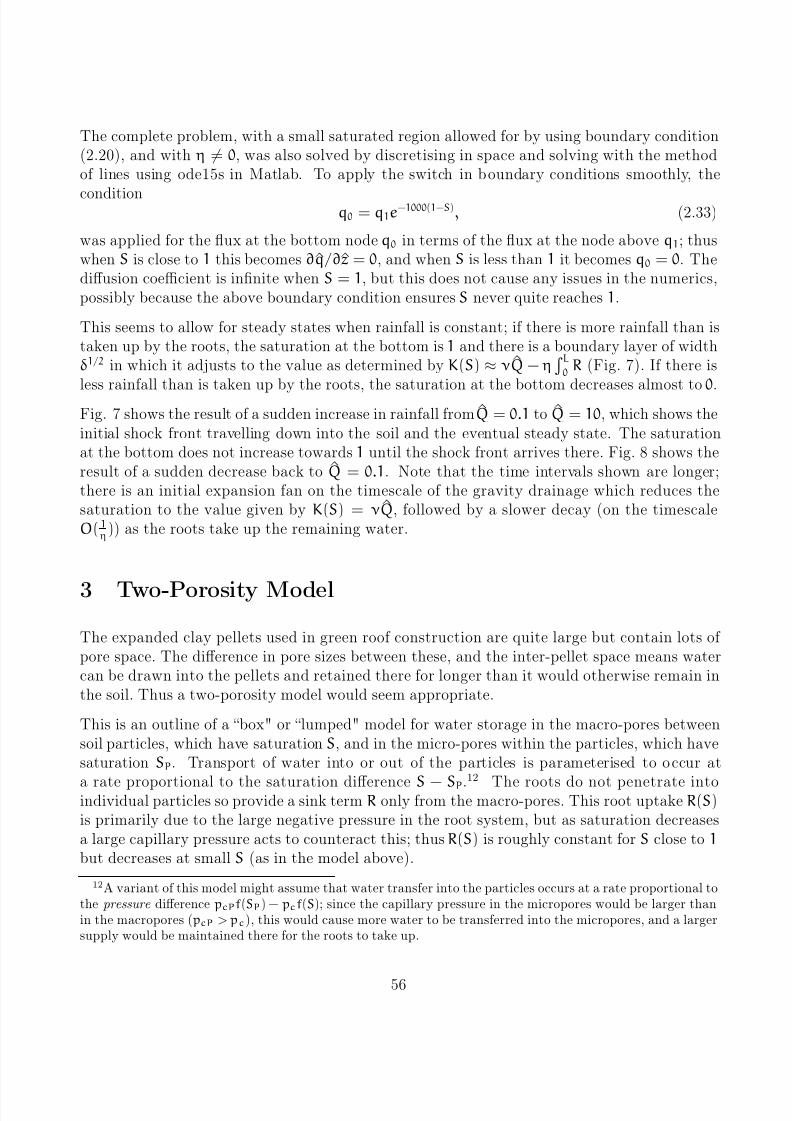
The complete problem, with a small saturated region allowed for by using boundary condition(2.20), and with η = 0, was also solved by discretising in space and solving with the methodof lines using ode15s in Matlab. To apply the switch in boundary conditions smoothly, the
conditionq0 = q1e−1000(1−S), (2.33)
was applied for the flux at the bottom node q0 in terms of the flux at the node above q1; thuswhen S is close to 1 this becomes ∂q/∂z = 0, and when S is less than 1 it becomes q0 = 0. Thediffusion coefficient is infinite when S = 1, but this does not cause any issues in the numerics,possibly because the above boundary condition ensures S never quite reaches 1.
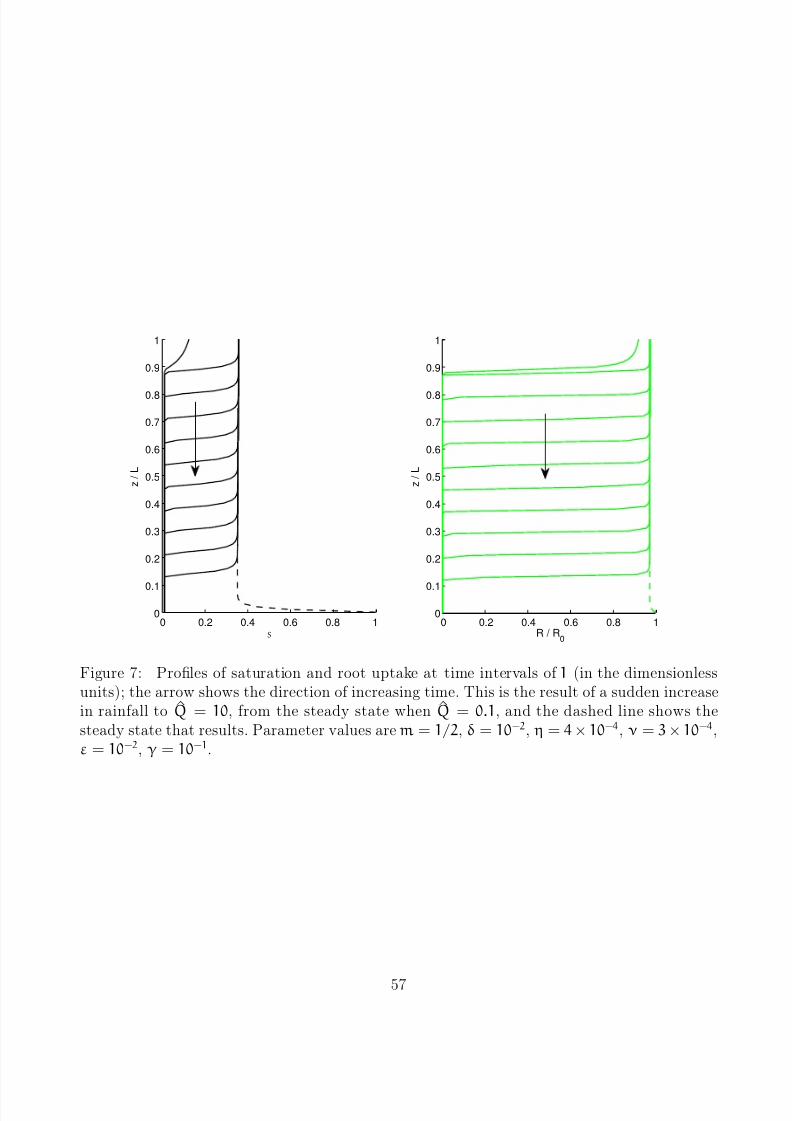
This seems to allow for steady states when rainfall is constant; if there is more rainfall than istaken up by the roots, the saturation at the bottom is 1 and there is a boundary layer of widthδ1/2 in which it adjusts to the value as determined by K(S) ≈ νQ − η
L
0R (Fig. 7). If there is
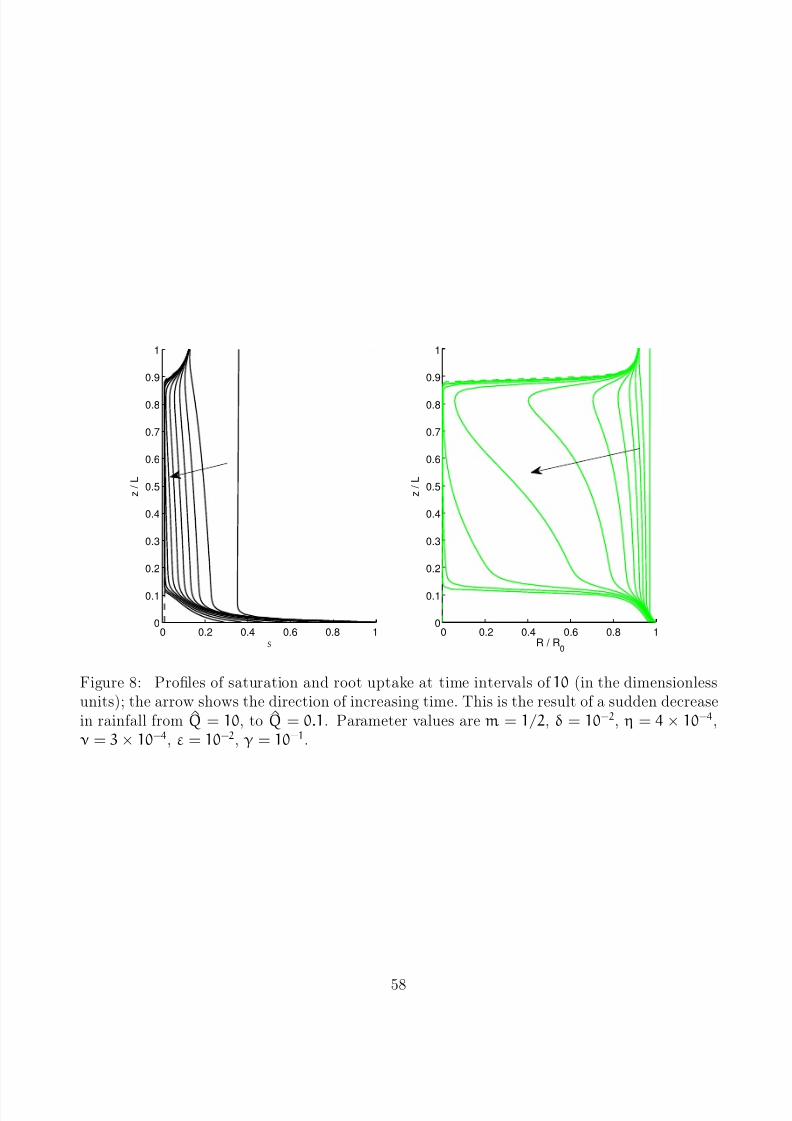
less rainfall than is taken up by the roots, the saturation at the bottom decreases almost to 0.Fig. 7 shows the result of a sudden increase in rainfall from Q = 0.1 to Q = 10, which shows theinitial shock front travelling down into the soil and the eventual steady state. The saturationat the bottom does not increase towards 1 until the shock front arrives there. Fig. 8 shows theresult of a sudden decrease back to Q = 0.1. Note that the time intervals shown are longer;there is an initial expansion fan on the timescale of the gravity drainage which reduces thesaturation to the value given by K(S) = νQ, followed by a slower decay (on the timescaleO( 1
η)) as the roots take up the remaining water.
3 Two-Porosity Model
The expanded clay pellets used in green roof construction are quite large but contain lots of pore space. The difference in pore sizes between these, and the inter-pellet space means watercan be drawn into the pellets and retained there for longer than it would otherwise remain inthe soil. Thus a two-porosity model would seem appropriate.
This is an outline of a “box" or “lumped" model for water storage in the macro-pores betweensoil particles, which have saturation S, and in the micro-pores within the particles, which havesaturation SP. Transport of water into or out of the particles is parameterised to occur at
a rate proportional to the saturation difference S − SP.12
The roots do not penetrate intoindividual particles so provide a sink term R only from the macro-pores. This root uptake R(S)
is primarily due to the large negative pressure in the root system, but as saturation decreasesa large capillary pressure acts to counteract this; thus R(S) is roughly constant for S close to 1but decreases at small S (as in the model above).
12A variant of this model might assume that water transfer into the particles occurs at a rate proportional tothe pressure difference pcPf(SP) − pcf(S); since the capillary pressure in the micropores would be larger thanin the macropores ( pcP > pc), this would cause more water to be transferred into the micropores, and a largersupply would be maintained there for the roots to take up.
56
8/3/2019 Ireland; Designing a Green Roof for Ireland
http://slidepdf.com/reader/full/ireland-designing-a-green-roof-for-ireland 13/20
0 0.2 0.4 0.6 0.8 10
0.1
0.2
0.3
0.4
0.5
0.6
0.7
0.8
0.9
1
z / L
0 0.2 0.4 0.6 0.8 10
0.1
0.2
0.3
0.4
0.5
0.6
0.7
0.8
0.9
1
R / R0
z / L
S
Figure 7: Profiles of saturation and root uptake at time intervals of 1 (in the dimensionlessunits); the arrow shows the direction of increasing time. This is the result of a sudden increasein rainfall to Q = 10, from the steady state when Q = 0.1, and the dashed line shows thesteady state that results. Parameter values are m = 1/2, δ = 10−2, η = 4×10− 4, ν = 3×10− 4,ε = 10−2, γ = 10−1.
57
8/3/2019 Ireland; Designing a Green Roof for Ireland
http://slidepdf.com/reader/full/ireland-designing-a-green-roof-for-ireland 14/20
0 0.2 0.4 0.6 0.8 10
0.1
0.2
0.3
0.4
0.5
0.6
0.7
0.8
0.9
1
z / L
0 0.2 0.4 0.6 0.8 10
0.1
0.2
0.3
0.4
0.5
0.6
0.7
0.8
0.9
1
R / R0
z / L
S
Figure 8: Profiles of saturation and root uptake at time intervals of 10 (in the dimensionlessunits); the arrow shows the direction of increasing time. This is the result of a sudden decreasein rainfall from Q = 10, to Q = 0.1. Parameter values are m = 1/2, δ = 10−2, η = 4× 10− 4,ν = 3× 10− 4, ε = 10−2, γ = 10−1.
58
8/3/2019 Ireland; Designing a Green Roof for Ireland
http://slidepdf.com/reader/full/ireland-designing-a-green-roof-for-ireland 15/20
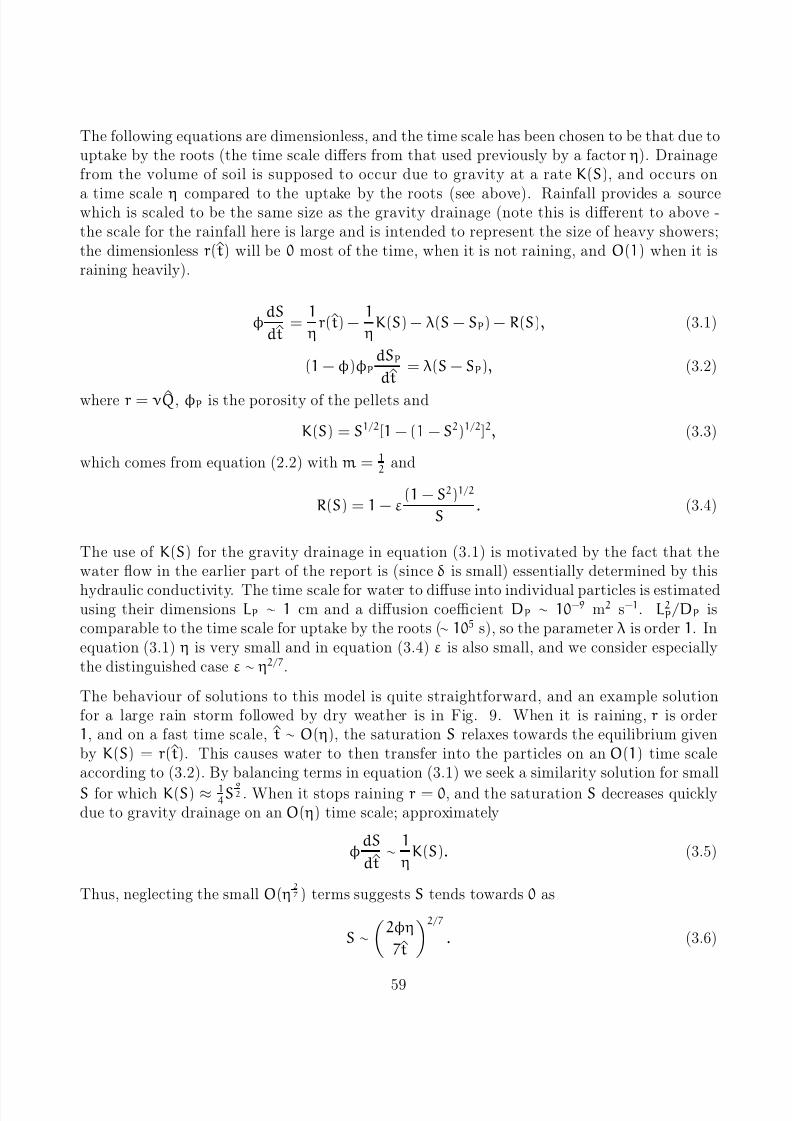
The following equations are dimensionless, and the time scale has been chosen to be that due touptake by the roots (the time scale differs from that used previously by a factor η). Drainagefrom the volume of soil is supposed to occur due to gravity at a rate K(S), and occurs on
a time scale η compared to the uptake by the roots (see above). Rainfall provides a sourcewhich is scaled to be the same size as the gravity drainage (note this is different to above -the scale for the rainfall here is large and is intended to represent the size of heavy showers;the dimensionless r(t) will be 0 most of the time, when it is not raining, and O(1) when it israining heavily).
φdS
dt=
1
ηr(t) −
1
ηK(S) − λ(S − SP) − R(S), (3.1)
(1 − φ)φP
dSP
dt= λ(S − SP), (3.2)
where r = νQ, φP is the porosity of the pellets and
K(S) = S1/2[1 − (1 − S2)1/2 ]2, (3.3)
which comes from equation (2.2) with m = 12
and
R(S) = 1 − ε(1 − S2)1/2
S. (3.4)
The use of K(S) for the gravity drainage in equation (3.1) is motivated by the fact that thewater flow in the earlier part of the report is (since δ is small) essentially determined by this
hydraulic conductivity. The time scale for water to diffuse into individual particles is estimatedusing their dimensions LP ∼ 1 cm and a diffusion coefficient DP ∼ 10−9 m2 s−1. L2
P/DP iscomparable to the time scale for uptake by the roots (∼ 105 s), so the parameter λ is order 1. Inequation (3.1) η is very small and in equation (3.4) ε is also small, and we consider especiallythe distinguished case ε ∼ η2/7.
The behaviour of solutions to this model is quite straightforward, and an example solutionfor a large rain storm followed by dry weather is in Fig. 9. When it is raining, r is order1, and on a fast time scale, t ∼ O( η), the saturation S relaxes towards the equilibrium givenby K(S) = r(t). This causes water to then transfer into the particles on an O(1) time scaleaccording to (3.2). By balancing terms in equation (3.1) we seek a similarity solution for small
S for which K(S) ≈ 1 4
S 92 . When it stops raining r = 0, and the saturation S decreases quickly
due to gravity drainage on an O( η) time scale; approximately
φdS
dt∼
1
ηK(S). (3.5)
Thus, neglecting the small O( η2
7 ) terms suggests S tends towards 0 as
S ∼
2φη
7t
2/7
. (3.6)
59
8/3/2019 Ireland; Designing a Green Roof for Ireland
http://slidepdf.com/reader/full/ireland-designing-a-green-roof-for-ireland 16/20
0 0.5 1 1.5 2 2.5 30
0.2
0.4
t / t0
r / r 0
0 0.5 1 1.5 2 2.5 30
0.2
0.4
0.6
0.8
1
t / t0
0 0.5 1 1.5 2 2.5 30
0.2
0.4
0.6
0.8
1
t / t0
p
0 0.5 1 1.5 2 2.5 30
0.2
0.4
0.6
0.8
1
t / t0
R
/ R 0
S
S
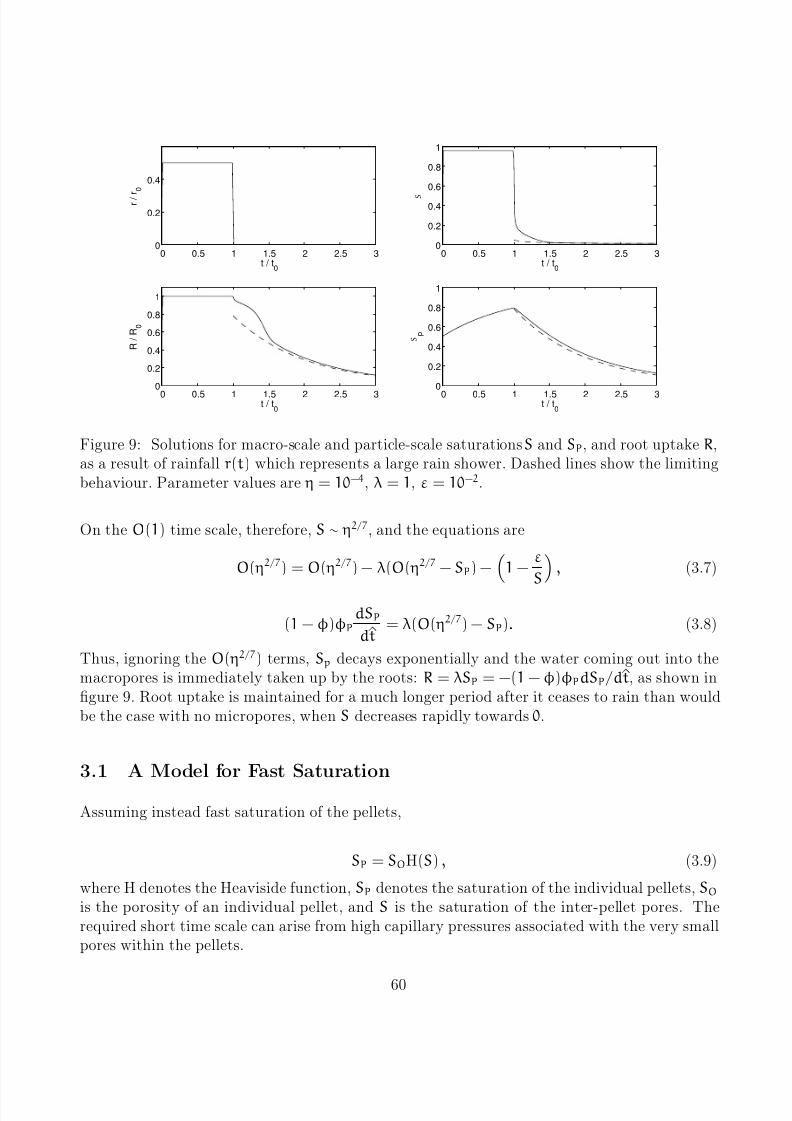
Figure 9: Solutions for macro-scale and particle-scale saturations S and SP, and root uptake R,as a result of rainfall r(t) which represents a large rain shower. Dashed lines show the limitingbehaviour. Parameter values are η = 10− 4, λ = 1, ε = 10−2.
On the O(1) time scale, therefore, S ∼ η2/7, and the equations are
O( η2/7) = O( η2/7) − λ(O( η2/7 − SP) − 1 −ε
S , (3.7)
(1 − φ)φP
dSP
dt= λ(O( η2/7) − SP). (3.8)
Thus, ignoring the O( η2/7) terms, S p decays exponentially and the water coming out into themacropores is immediately taken up by the roots: R = λSP = −(1 − φ)φPdSP/dt, as shown infigure 9. Root uptake is maintained for a much longer period after it ceases to rain than wouldbe the case with no micropores, when S decreases rapidly towards 0.
3.1 A Model for Fast Saturation
Assuming instead fast saturation of the pellets,
SP = SOH(S) , (3.9)
where H denotes the Heaviside function, SP denotes the saturation of the individual pellets, SO
is the porosity of an individual pellet, and S is the saturation of the inter-pellet pores. Therequired short time scale can arise from high capillary pressures associated with the very smallpores within the pellets.
60
8/3/2019 Ireland; Designing a Green Roof for Ireland
http://slidepdf.com/reader/full/ireland-designing-a-green-roof-for-ireland 17/20
Taking now φ = 1 4
to be the total proportion of space occupied by air and water within thesoil, and SO = 1
5, the inter-pellet porosity is ϕ = 1
16(given by ϕ + 1
5(1 − ϕ) = 1
4). Equation
(2.9) can then be replaced by
1
16
∂
∂t(S + 3H(S)) =
∂
∂z
K(S) + δD(S)
∂S
∂z
− ηR , (3.10)
with R ∼ 1, from (2.9) and (2.32). (Equation (3.10) might be better written in terms of the totalwater content, ST = 1
16(S + 3H(S)), so that S on the right-hand side is replaced by S(ST ) = 0
for 0 ≤ ST ≤3
16, S(ST ) = 16(ST − 3
16) for 3
16≤ ST ≤
1 4
.)
Where the pellets are saturated, S > 0 and H(S) = 1, the equations are as in Section 2. Here,for simplicity, an initially dry soil is considered, so that at t = 0, S ≡ SP ≡ 0. For t > 0, aregion W (t) < z < 1 has become wet:
S = H(S) = 0 in 0 < z < W , S > 0 and H(S) = 1 in W < z < 1 . (3.11)
To obtain an order-one sized wet region, the relevant time scale must be that for the rainfall(days) so that time has to be rescaled:
t = t/ν. (3.12)
Note that this time scale is similar to that for the up-take of water by the plants’ roots. It isalso appropriate, from the top boundary condition, to rescale the saturation:
S = ν2/9S , (3.13)
where, since we have assumed that m = 12
, K(S) ∼ 1 4
S9/2 and D(S) ∼ 1 4
S5/2 for small S.
Neglecting the time-derivative term (now effectively of order ν2/9), the partial differential equa-tion becomes
1
4
∂
∂z
S9/2 + δS5/2 ∂S
∂z
= ˜ ηR . (3.14)
Here ˜ η = η/ν ≈ 13
and δ = δ/ν2/9 ≈ 1600
, using the values of Section 2. Although the value of
δ is small here, because of the uncertainty in the values of the physical parameters describingwater transport through the soil, it could conceivably be of order one and it is therefore retained
in (3.14), for the present.
The differential equation is subject to the top boundary condition
1
4
S9/2 + δS5/2 ∂S
∂z
= Qin at z = 1 (3.15)
and, assuming that the diffusive, δ, term is retained, a lower boundary condition
S = 0 at z = W (t) . (3.16)
61
8/3/2019 Ireland; Designing a Green Roof for Ireland
http://slidepdf.com/reader/full/ireland-designing-a-green-roof-for-ireland 18/20
Finally, to fix the position of the free boundary z = W (t) between dry and wet soil, conservationof mass of water at this point, where SP jumps from 0 to SO, leads to
dW dt
= − 43
S9/2 + δS5/2 ∂S
∂z
at z = W (t) . (3.17)
(Since, for δ > 0, S = 0 at this point, the second term on the right-hand side should then be
interpreted as δ limz→W
S5/2 ∂S
∂z
.)
Of course, if the pellets were already partially saturated, (3.17) would be suitably modified,leading to a faster-moving free boundary.
Note also that if the diffusion can be neglected, (3.14) and (3.15) lead to 1 4
S9/2 = Qin + z − 1
so (3.17) gives
−dW
dt=
16
3
Qin + W − 1
. (3.18)
The free-boundary condition (3.17) only applies for an advancing wet region, dW/dt ≤ 0. Analternative form is needed for when this region contracts, which will happen when the rainfalldecreases sufficiently. In any part of the soil between the lowest location of the free boundaryand its current position, the roots can continue to remove water from the pellets, thereby re-ducing SP.
As described in this report we could could now have at least four types of region within thesoil layer:
1. Dry zone, where S = SP = 0;
2. Damp or moist (unsaturated) zone I, where S = 0, 0 < SP < SO;
3. Damp or moist (unsaturated) zone II, where 0 < S < 1, SP = SO;
4. Wet (saturated) zone, where S = 1, SP = SO.
4 Conclusions
In this report a one-dimensional time dependent mathematical model has been described forthe development of the saturation in the soil layer of a flat green roof. Our model suggests thata fully-saturated (S = 1) region forms at the base of the soil layer and this region can be thinrelative to the total soil thickness.
62
8/3/2019 Ireland; Designing a Green Roof for Ireland
http://slidepdf.com/reader/full/ireland-designing-a-green-roof-for-ireland 19/20
From an initial dry state and from the onset of persistent rain, fronts of saturation were com-puted to descend through the layer. The decrease of saturation from unity following a decreasein rainfall was also described. The end result is that most of the rainwater falls through the
soil layer and exits through the network of holes in the bottom supporting sheet.On a smaller scale, the pellets and soil particles are themselves porous and made up of microp-ores. The water flow in and out of a typical particle is modelled using the flux between (a) themacropores (whose saturation is as modelled above) and (b) the root system. This two-porositymodel suggests that during the time between spells of rain the micropores can retain (for longperiods of time) water that is available to be taken up by the roots.
Further work might include adapting the soil thickness L to rainfall at the site of the buildingwith the aim of making L as small as possible, while avoiding problems with saturation andaridity. A first step towards this goal would be to carry out experiments to more accurately
determine the values of the constants. Further simulations using more extensive rainfall datacould then be carried out to determine the optimum soil thickness. In addition small modifi-cations could be made to include the influence of a sloped roof.
AcknowledgementsWe acknowledge the support of the Mathematics Applications Consortium for Science andIndustry (www.macsi.ul.ie) funded by the Science Foundation Ireland mathematics initiativegrant 06/MI/005.
63

8/3/2019 Ireland; Designing a Green Roof for Ireland
http://slidepdf.com/reader/full/ireland-designing-a-green-roof-for-ireland 20/20
Bibliography
[1] M. T. Van Genuchten. A closed-form equation for predicting the hydraulic conductivityof unsaturated soil. Soil Sci. Soc. Am. J., 44:892-898, 1980.
[2] T. Roose and A.C. Fowler. A model for water uptake by plant roots. J. Theoret. Biol.,
228:155-171, 2004.
64