iroki: automatic customization and visualization of ...for tree visualization, addresses these...
TRANSCRIPT
Iroki: automatic customization and1
visualization of phylogenetic trees2
Ryan M. Moore1, Amelia O. Harrison2, Sean M. McAllister2, Shawn W.3
Polson1, and K. Eric Wommack14
1Center for Bioinformatics and Computational Biology, University of Delaware, Newark,5
DE, USA6
2School of Marine Science and Policy, University of Delaware, Newark, DE, USA7
Corresponding author:8
K. Eric Wommack19
Email address: [email protected]
ABSTRACT11
Phylogenetic trees are an important analytical tool for evaluating community diversity and evolutionaryhistory. In the case of microorganisms, the decreasing cost of sequencing has enabled researchers togenerate ever-larger sequence datasets, which in turn have begun to fill gaps in the evolutionary historyof microbial groups. However, phylogenetic analyses of these types of datasets create complex trees thatcan be challenging to interpret. Scientific inferences made by visual inspection of phylogenetic trees canbe simplified and enhanced by customizing various parts of the tree. Yet, manual customization is time-consuming and error prone, and programs designed to assist in batch tree customization often requireprogramming experience or complicated file formats for annotation. Iroki, a user-friendly web interfacefor tree visualization, addresses these issues by providing automatic customization of large trees basedon metadata contained in tab-separated text files. Iroki’s utility for exploring biological and ecologicaltrends in sequencing data was demonstrated through a variety of microbial ecology applications in whichtrees with hundreds to thousands of leaf nodes were customized according to extensive collections ofmetadata. The Iroki web application and documentation are available at https://www.iroki.net orthrough the VIROME portal (http://virome.dbi.udel.edu). Iroki’s source code is released underthe MIT license and is available at https://github.com/mooreryan/iroki.
12
13
14
15
16
17
18
19
20
21
22
23
24
25
26
INTRODUCTION27
Community and population ecology studies often use phylogenetic trees as a means to assess the diversity28
and evolutionary history of organisms. In the case of microorganisms, declining sequencing cost has29
enabled researchers to gather ever-larger sequence datasets from unknown microbial populations within30
environmental samples. While large sequence datasets have begun to fill gaps in the evolutionary history31
of microbial groups (Simister et al., 2012; Muller et al., 2015; Lan et al., 2016; Larkin et al., 2016; Wu32
et al., 2016), they have also posed new analytical problems, as extracting meaningful trends from high33
dimensional datasets can be challenging. In particular, scientific inferences made by visual inspection of34
phylogenetic trees can be simplified and enhanced by customizing various parts of the tree.35
Many solutions to this problem currently exist. Standalone tree visualization packages allowing36
manual or batch modification of trees are available (e.g., Archaeopteryx (Han and Zmasek, 2009),37
Dendroscope (Huson et al., 2007), FigTree (Rambaut, 2006), TreeGraph2 (Stover and Muller, 2010),38
Treevolution (Santamarıa and Theron, 2009)), but the process can be time consuming and error prone39
especially when dealing with trees containing many nodes. Some packages allow batch and programmatic40
customizations through the use of an application programming interface (API) or command line software41
(e.g., APE (Paradis et al., 2004), Bio::Phylo (Vos et al., 2011), Bio.Phylo (Talevich et al., 2012), ColorTree42
(Chen and Lercher, 2009), ETE (Huerta-Cepas et al., 2016), GraPhlAn (Asnicar et al., 2015), JPhyloIO43
(Stover et al., 2016), phytools (Revell, 2012), treeman (Bennett et al., 2017)). While these packages are44
powerful, they require substantial computing expertise, which can be an impediment for some scientists.45
Current web based tree viewers are convenient in that they do not require the installation of additional46
.CC-BY 4.0 International licenseis made available under aThe copyright holder for this preprint (which was not peer-reviewed) is the author/funder. It. https://doi.org/10.1101/106138doi: bioRxiv preprint

software and provide customization and management features (e.g., Evolview (He et al., 2016), IcyTree47
(Vaughan, 2017), iTOL (Letunic and Bork, 2016), PhyD3 (Kreft et al., 2017), Phylemon (Sanchez et al.,48
2011), PhyloBot (Hanson-Smith and Johnson, 2016), Phylo.io (Robinson et al., 2016)), but often have49
complex user interfaces or complicated file formats to enable complex annotations. Iroki strikes a balance50
between flexibility and usability by combining visualization of trees in a clean, user-friendly web interface51
with powerful automatic customization based on simple, tab-separated text files. Here, Iroki was used to52
customize large trees containing hundreds to thousands of leaf nodes according to extensive collections53
of metadata. These applications demonstrated the utility of Iroki for distilling biological and ecological54
insights from microbial community sequence data. The particular use cases included examinations of55
phage-host interactions, relative abundance of populations across sample types, and comparisons of viral56
community composition across environmental gradients.57
METHODS58
Iroki is a web application for visualizing and automatically customizing taxonomic and phylogenetic59
trees with associated qualitative and quantitative metadata. Iroki is particularly well suited to projects in60
microbial ecology and those that deal with microbiome data, as these types of studies generally have rich61
sample-associated metadata and represent complex community structures. The Iroki web application and62
documentation are available at the following web address: https://www.iroki.net, or through the63
VIROME portal (http://virome.dbi.udel.edu) (Wommack et al., 2012). Iroki’s source code is64
released under the MIT license and is available on GitHub: https://github.com/mooreryan/65
iroki.66
Implementation67
Iroki is built with the Ruby on Rails web application framework. The main features of Iroki are written68
entirely in JavaScript allowing all data processing to be done client-side. This provides the additional69
benefit of eliminating the need to transfer potentially private data to an online service.70
Iroki consists of two main modules: the tree viewer, which also handles customization with tab-71
separated text files (mapping files), and the color gradient generator, which creates mapping files to use in72
the tree viewer based on quantitative data (such as counts) from a tab-separated text file similar to the73
classic-style OTU tables exported from a JSON or hdf5 format biom file (McDonald et al., 2012)).74
Tree viewer75
Iroki uses JavaScript and Scalable Vector Graphics (SVG, an XML-based markup language for repre-76
senting vector graphics) for rendering trees. The Document Object Model (DOM) and SVG elements77
are manipulated with the D3.js library (Bostock et al., 2011). Rectangular, circular, and radial tree78
layouts are provided in the Iroki web application. Rectangular and circular layouts are generated using79
D3’s cluster layout API (d3.cluster). For radial layouts, Algorithm 1 from Bachmaier et al. (2005)80
was implemented in JavaScript. In addition to the SVG based tree viewer, Iroki also includes an HTML581
Canvas based viewer with a reduced set of features capable of displaying huge trees with millions of leaf82
nodes (Supplementary Materials Sec. 4).83
Iroki provides the option to automatically style aspects of the tree using a tab-separated text file84
(mapping file). Entries in the first column of this file are matched against all leaf labels in the tree85
using either exact or substring matching. If a leaf name matches a row in the mapping file, the styling86
options specified by the remaining columns are applied to that node. Inner nodes are styled to match87
their descendant nodes so that if all descendant nodes moving towards the inner parts of the tree have88
the same style, then quick identification of clades sharing the same metadata is possible. Aspects of the89
tree that can be automatically styled using the mapping file include leaf label color, font, size, and name,90
leaf dot color and size, branch width and color, as well as bar charts and arcs. In addition to automatic91
customization using a mapping file, various aspects of the tree can be adjusted directly through Iroki’s92
user interface.93
Color gradient generator94
Iroki’s color gradient generator accepts tab-separated text files (similar to the classic-style count tables95
exported by VIROME (Wommack et al., 2012) or QIIME 1 (Caporaso et al., 2010)) and converts the96
numerical data (e.g., counts/abundances) into a color gradient. Several single-, two-, and multi-color97
2/17
.CC-BY 4.0 International licenseis made available under aThe copyright holder for this preprint (which was not peer-reviewed) is the author/funder. It. https://doi.org/10.1101/106138doi: bioRxiv preprint

gradients are provided including cubehelix (Green, 2011) and those from ColorBrewer (Brewer et al.,98
2013).99
Iroki reads numerical data from tab-separated text files. Similar to the mapping file for the tree viewer,100
the first column should match leaf names in the tree, and the remaining columns describe whatever aspect101
of the data of interest to the researcher (e.g., counts or abundance). In a dataset with M observations and102
N variables, the input file will then have M+1 rows (the first row is the header) and N +1 columns (the103
first column specifies observation names). From this data, Iroki can generate color gradients in a variety104
of ways.105
Observation means A color gradient is generated based on the mean value of each observation across106
all variables. In this case, each observation i would be represented as µi = ∑Nj=1 ci j, where ci j is the value107
of observation (row) i for variable (column) j.108
Observation ”evenness” A color gradient is generated based on the ”evenness” of observation i across109
all N variables. Then, each observation i is represented by Pielou’s evenness index (Pielou, 1966)110
calculated across all variables:111
Ei = Hi/Hmax, (1)
where Hi is the Shannon entropy for observation i with respect to the N variables specified in the input112
file, and Hmax is the maximum theoretical value of Hi. In this case, Hmax occurs when observation i has113
equal values ci j across all N variables. Thus, we calculate Pielou’s evenness index for an observation i as114
Ei =−∑
Nj=1 pi j log2 (pi j)
log2 (N), (2)
where N is the number of variables and pi j is the proportion of observation i in variable j (i.e.,115
ci j/∑Nj=1 ci j).116
In this way, the user can map observations with high evenness (i.e., an observation with approximately117
the same value for each variable) to one side of the color gradient and observations with low evenness118
(i.e., an observation with high values in a few variables and low values in most others) to the other side of119
the gradient for easy identification.120
Observation projection Data reduction can be a powerful method for extracting meaningful trends121
in large, high-dimensional data sets. Given that microbiome or other studies in microbial ecology can122
have hundreds of samples and a rich set of metadata associated with those samples, data reduction often123
proves useful. Thus, Iroki provides a method to project the data into a single dimension and then map124
that projection onto a color gradient. For data reduction, Iroki conducts a principal components analysis125
(PCA) calculated via the singular value decomposition (SVD) using the LALOLib scientific computing126
library for JavaScript (Lauer, 2017). Briefly, performing singular value decomposition on the centered127
(and optionally scaled) count matrix X , with observations as rows and variables as columns, the following128
decomposition is obtained:129
X =USV T , (3)
where the columns of US are the principal component scores, S is the diagonal matrix of singular130
values, and the columns of V are the principal axes. In this way, the color gradient matches the first131
principal component, which maximizes the data variance.132
RESULTS AND DISCUSSION133
Bacteriophage proteomes, taxonomy, and host phyla134
Viruses are the most abundant biological entities on Earth, providing an enormous reservoir of genetic135
diversity, driving evolution of their hosts, influencing composition of microbial communities, and affecting136
global biogeochemical cycles (Suttle, 2007; Rohwer and Thurber, 2009). Due to their importance, there137
3/17
.CC-BY 4.0 International licenseis made available under aThe copyright holder for this preprint (which was not peer-reviewed) is the author/funder. It. https://doi.org/10.1101/106138doi: bioRxiv preprint
is a growing interest in connecting viruses with their hosts through the analysis of metagenome data.138
As such, researchers have used a variety of computational techniques to predict viral-host interactions139
including CRISPR-spacer (Roux et al., 2016; Coutinho et al., 2017; Nishimura et al., 2017a) and tRNA140
matches (Bellas et al., 2015; Roux et al., 2016; Coutinho et al., 2017; Nishimura et al., 2017a), sequence141
homology (Roux et al., 2016; Coutinho et al., 2017; Nishimura et al., 2017a), abundance correlation142
(Coutinho et al., 2017), and oligonucleotide profiles (Roux et al., 2015, 2016; Munson-McGee et al.,143
2018).144
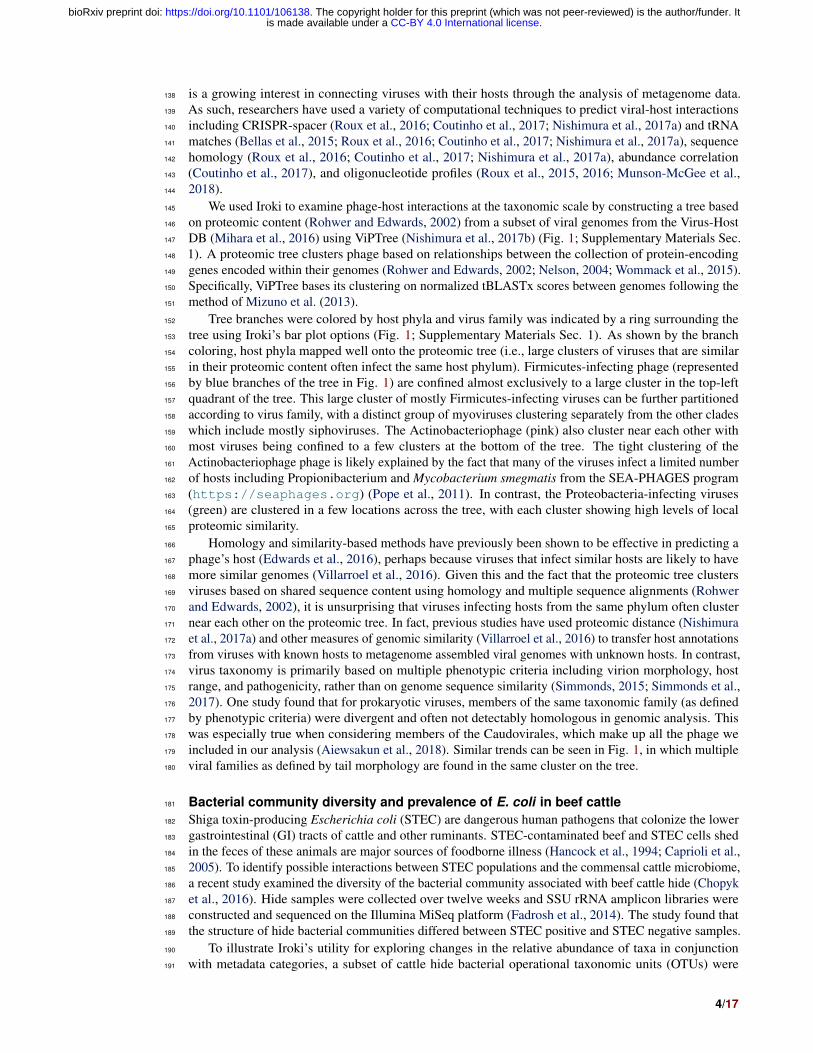
We used Iroki to examine phage-host interactions at the taxonomic scale by constructing a tree based145
on proteomic content (Rohwer and Edwards, 2002) from a subset of viral genomes from the Virus-Host146
DB (Mihara et al., 2016) using ViPTree (Nishimura et al., 2017b) (Fig. 1; Supplementary Materials Sec.147
1). A proteomic tree clusters phage based on relationships between the collection of protein-encoding148
genes encoded within their genomes (Rohwer and Edwards, 2002; Nelson, 2004; Wommack et al., 2015).149
Specifically, ViPTree bases its clustering on normalized tBLASTx scores between genomes following the150
method of Mizuno et al. (2013).151
Tree branches were colored by host phyla and virus family was indicated by a ring surrounding the152
tree using Iroki’s bar plot options (Fig. 1; Supplementary Materials Sec. 1). As shown by the branch153
coloring, host phyla mapped well onto the proteomic tree (i.e., large clusters of viruses that are similar154
in their proteomic content often infect the same host phylum). Firmicutes-infecting phage (represented155
by blue branches of the tree in Fig. 1) are confined almost exclusively to a large cluster in the top-left156
quadrant of the tree. This large cluster of mostly Firmicutes-infecting viruses can be further partitioned157
according to virus family, with a distinct group of myoviruses clustering separately from the other clades158
which include mostly siphoviruses. The Actinobacteriophage (pink) also cluster near each other with159
most viruses being confined to a few clusters at the bottom of the tree. The tight clustering of the160
Actinobacteriophage phage is likely explained by the fact that many of the viruses infect a limited number161
of hosts including Propionibacterium and Mycobacterium smegmatis from the SEA-PHAGES program162
(https://seaphages.org) (Pope et al., 2011). In contrast, the Proteobacteria-infecting viruses163
(green) are clustered in a few locations across the tree, with each cluster showing high levels of local164
proteomic similarity.165
Homology and similarity-based methods have previously been shown to be effective in predicting a166
phage’s host (Edwards et al., 2016), perhaps because viruses that infect similar hosts are likely to have167
more similar genomes (Villarroel et al., 2016). Given this and the fact that the proteomic tree clusters168
viruses based on shared sequence content using homology and multiple sequence alignments (Rohwer169
and Edwards, 2002), it is unsurprising that viruses infecting hosts from the same phylum often cluster170
near each other on the proteomic tree. In fact, previous studies have used proteomic distance (Nishimura171
et al., 2017a) and other measures of genomic similarity (Villarroel et al., 2016) to transfer host annotations172
from viruses with known hosts to metagenome assembled viral genomes with unknown hosts. In contrast,173
virus taxonomy is primarily based on multiple phenotypic criteria including virion morphology, host174
range, and pathogenicity, rather than on genome sequence similarity (Simmonds, 2015; Simmonds et al.,175
2017). One study found that for prokaryotic viruses, members of the same taxonomic family (as defined176
by phenotypic criteria) were divergent and often not detectably homologous in genomic analysis. This177
was especially true when considering members of the Caudovirales, which make up all the phage we178
included in our analysis (Aiewsakun et al., 2018). Similar trends can be seen in Fig. 1, in which multiple179
viral families as defined by tail morphology are found in the same cluster on the tree.180
Bacterial community diversity and prevalence of E. coli in beef cattle181
Shiga toxin-producing Escherichia coli (STEC) are dangerous human pathogens that colonize the lower182
gastrointestinal (GI) tracts of cattle and other ruminants. STEC-contaminated beef and STEC cells shed183
in the feces of these animals are major sources of foodborne illness (Hancock et al., 1994; Caprioli et al.,184
2005). To identify possible interactions between STEC populations and the commensal cattle microbiome,185
a recent study examined the diversity of the bacterial community associated with beef cattle hide (Chopyk186
et al., 2016). Hide samples were collected over twelve weeks and SSU rRNA amplicon libraries were187
constructed and sequenced on the Illumina MiSeq platform (Fadrosh et al., 2014). The study found that188
the structure of hide bacterial communities differed between STEC positive and STEC negative samples.189
To illustrate Iroki’s utility for exploring changes in the relative abundance of taxa in conjunction190
with metadata categories, a subset of cattle hide bacterial operational taxonomic units (OTUs) were191
4/17
.CC-BY 4.0 International licenseis made available under aThe copyright holder for this preprint (which was not peer-reviewed) is the author/funder. It. https://doi.org/10.1101/106138doi: bioRxiv preprint
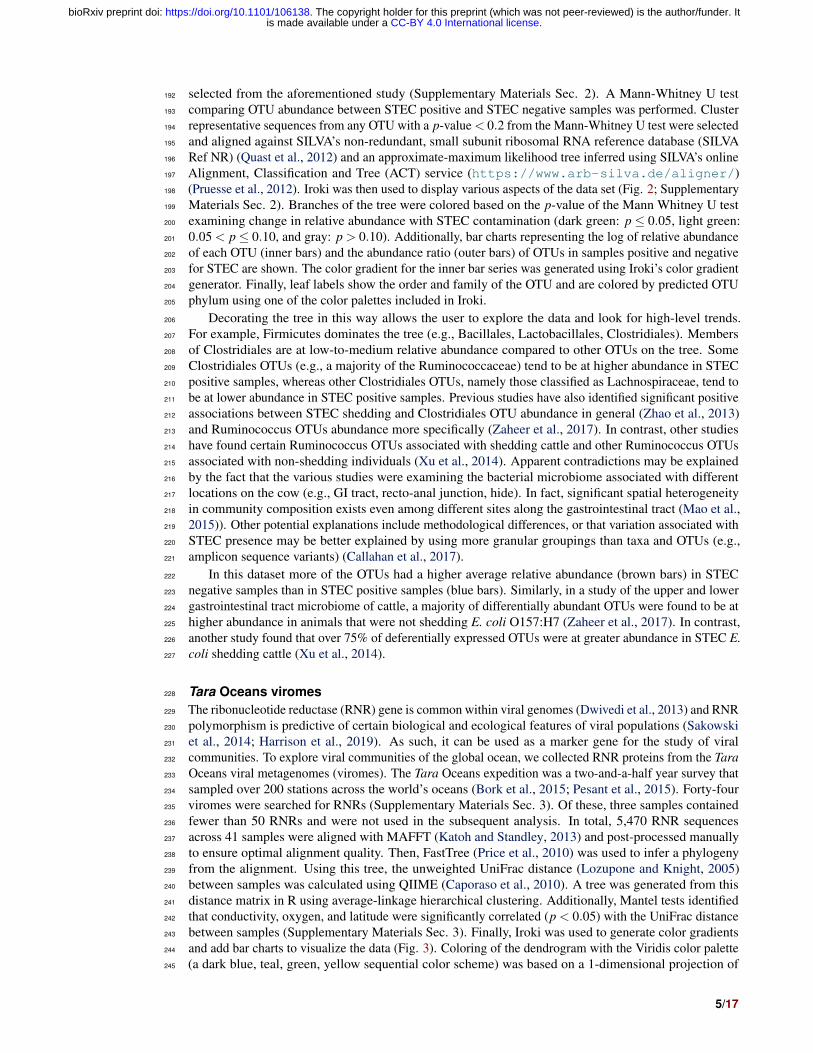
selected from the aforementioned study (Supplementary Materials Sec. 2). A Mann-Whitney U test192
comparing OTU abundance between STEC positive and STEC negative samples was performed. Cluster193
representative sequences from any OTU with a p-value < 0.2 from the Mann-Whitney U test were selected194
and aligned against SILVA’s non-redundant, small subunit ribosomal RNA reference database (SILVA195
Ref NR) (Quast et al., 2012) and an approximate-maximum likelihood tree inferred using SILVA’s online196
Alignment, Classification and Tree (ACT) service (https://www.arb-silva.de/aligner/)197
(Pruesse et al., 2012). Iroki was then used to display various aspects of the data set (Fig. 2; Supplementary198
Materials Sec. 2). Branches of the tree were colored based on the p-value of the Mann Whitney U test199
examining change in relative abundance with STEC contamination (dark green: p ≤ 0.05, light green:200
0.05 < p ≤ 0.10, and gray: p > 0.10). Additionally, bar charts representing the log of relative abundance201
of each OTU (inner bars) and the abundance ratio (outer bars) of OTUs in samples positive and negative202
for STEC are shown. The color gradient for the inner bar series was generated using Iroki’s color gradient203
generator. Finally, leaf labels show the order and family of the OTU and are colored by predicted OTU204
phylum using one of the color palettes included in Iroki.205
Decorating the tree in this way allows the user to explore the data and look for high-level trends.206
For example, Firmicutes dominates the tree (e.g., Bacillales, Lactobacillales, Clostridiales). Members207
of Clostridiales are at low-to-medium relative abundance compared to other OTUs on the tree. Some208
Clostridiales OTUs (e.g., a majority of the Ruminococcaceae) tend to be at higher abundance in STEC209
positive samples, whereas other Clostridiales OTUs, namely those classified as Lachnospiraceae, tend to210
be at lower abundance in STEC positive samples. Previous studies have also identified significant positive211
associations between STEC shedding and Clostridiales OTU abundance in general (Zhao et al., 2013)212
and Ruminococcus OTUs abundance more specifically (Zaheer et al., 2017). In contrast, other studies213
have found certain Ruminococcus OTUs associated with shedding cattle and other Ruminococcus OTUs214
associated with non-shedding individuals (Xu et al., 2014). Apparent contradictions may be explained215
by the fact that the various studies were examining the bacterial microbiome associated with different216
locations on the cow (e.g., GI tract, recto-anal junction, hide). In fact, significant spatial heterogeneity217
in community composition exists even among different sites along the gastrointestinal tract (Mao et al.,218
2015)). Other potential explanations include methodological differences, or that variation associated with219
STEC presence may be better explained by using more granular groupings than taxa and OTUs (e.g.,220
amplicon sequence variants) (Callahan et al., 2017).221
In this dataset more of the OTUs had a higher average relative abundance (brown bars) in STEC222
negative samples than in STEC positive samples (blue bars). Similarly, in a study of the upper and lower223
gastrointestinal tract microbiome of cattle, a majority of differentially abundant OTUs were found to be at224
higher abundance in animals that were not shedding E. coli O157:H7 (Zaheer et al., 2017). In contrast,225
another study found that over 75% of deferentially expressed OTUs were at greater abundance in STEC E.226
coli shedding cattle (Xu et al., 2014).227
Tara Oceans viromes228
The ribonucleotide reductase (RNR) gene is common within viral genomes (Dwivedi et al., 2013) and RNR229
polymorphism is predictive of certain biological and ecological features of viral populations (Sakowski230
et al., 2014; Harrison et al., 2019). As such, it can be used as a marker gene for the study of viral231
communities. To explore viral communities of the global ocean, we collected RNR proteins from the Tara232
Oceans viral metagenomes (viromes). The Tara Oceans expedition was a two-and-a-half year survey that233
sampled over 200 stations across the world’s oceans (Bork et al., 2015; Pesant et al., 2015). Forty-four234
viromes were searched for RNRs (Supplementary Materials Sec. 3). Of these, three samples contained235
fewer than 50 RNRs and were not used in the subsequent analysis. In total, 5,470 RNR sequences236
across 41 samples were aligned with MAFFT (Katoh and Standley, 2013) and post-processed manually237
to ensure optimal alignment quality. Then, FastTree (Price et al., 2010) was used to infer a phylogeny238
from the alignment. Using this tree, the unweighted UniFrac distance (Lozupone and Knight, 2005)239
between samples was calculated using QIIME (Caporaso et al., 2010). A tree was generated from this240
distance matrix in R using average-linkage hierarchical clustering. Additionally, Mantel tests identified241
that conductivity, oxygen, and latitude were significantly correlated (p < 0.05) with the UniFrac distance242
between samples (Supplementary Materials Sec. 3). Finally, Iroki was used to generate color gradients243
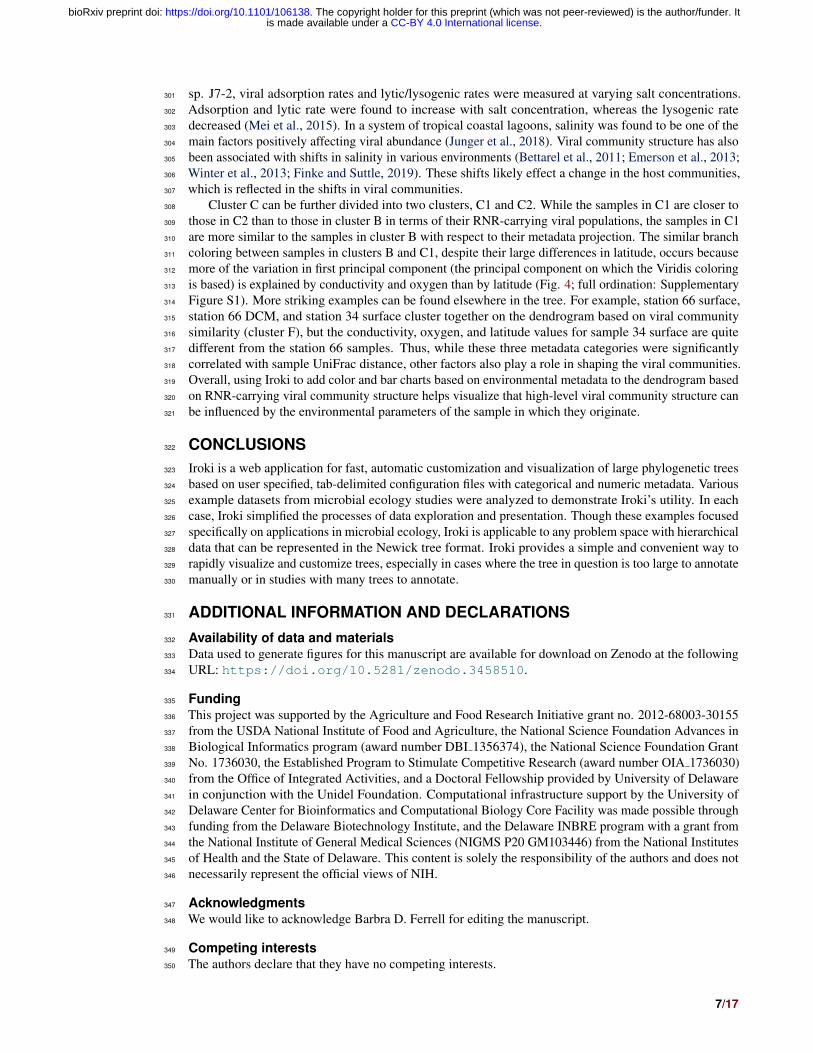
and add bar charts to visualize the data (Fig. 3). Coloring of the dendrogram with the Viridis color palette244
(a dark blue, teal, green, yellow sequential color scheme) was based on a 1-dimensional projection of245
5/17
.CC-BY 4.0 International licenseis made available under aThe copyright holder for this preprint (which was not peer-reviewed) is the author/funder. It. https://doi.org/10.1101/106138doi: bioRxiv preprint

sample conductivity, oxygen, and latitude calculated using Iroki’s color gradient generator. The color246
gradient generator was also used to make the color palettes used for the bar charts.247
Coloring the dendrogram based on a projection of the environmental conditions of the samples results248
in samples with similar environmental metadata being similar in color. For example, the station 66249
surface and deep chlorophyll maximum (DCM) samples are nearly identical to one another with respect to250
conductivity, oxygen, and latitude and have the same dark bluish branch color. In contrast, surface samples251
from stations 31 and 32 both have a lighter yellowish-green branch color. As the bar charts indicate, these252
two samples are very similar to one another with respect to the metadata (hence their similar coloring),253
but are rather different from the station 66 samples in branch color, reflecting the differences in metadata254
between the two groups.255
The combination of dendrogram coloring and bar charts assists in finding trends in the data. Since the256
dendrogram is based on UniFrac distance between samples based on RNR OTUs, samples that cluster257
together on the tree have more similar viral communities, according to RNR gene allele content, than258
samples that are far from one another. In contrast, dendrogram branch coloring and the bar charts show259
environmental information about the samples themselves (conductivity, oxygen, and latitude). Combining260
these two aspects of the samples enables visualization of the relationship between the similarity of261
RNR-containing viral communities and the environments in which they are found.262
For example, the samples in the bottom half of the tree are, in general, from northern latitudes,263
whereas samples towards the top tend to be from southern latitudes. In a previous study of the T4-264
like viral communities of Polar freshwater lakes, no significant correlation between latitude and viral265
community diversity was found in the Antarctic samples (Daniel et al., 2016). Though the Arctic lakes266
were not tested among themselves for significant associations between latitude and viral community267
richness (presumably due to the small latitudinal variation in Arctic sampling locations), Arctic and268
Antarctic lakes were tested against one another; however, no significant difference in viral diversity was269
seen with respect to pole of origin. The Antarctic samples from the study ranged from 67.84◦ S to 62.64◦270
S, whereas the Tara Oceans viromes used to build the tree in Fig. 3 ranged from 62.18◦ S to 41.18◦ N. The271
increased range of samples from the Tara survey may have enabled this shift in diversity to be detected.272
Additionally, the previous study used g23, the gene for major capsid protein, to survey the viral community.273
It is possible that a functional protein like RNR is more connected with environmental conditions than a274
structural protein such as the T4-like major capsid protein. RNRs reduce ribonucleotides, the rate-limiting275
step of DNA synthesis (Kolberg et al., 2004; Ahmad et al., 2012). There are several different types of276
RNR, each with specific biochemical mechanisms and nutrient requirements (Nordlund and Reichard,277
2006). Accordingly, the type of RNR carried by a cell or virus often reflects the environmental conditions278
in which DNA replication occurs (Reichard, 1993; Cotruvo and Stubbe, 2011; Sakowski et al., 2014;279
Srinivas et al., 2018; Harrison et al., 2019). A survey based on RNR, then, may provide more sensitivity in280
detecting environmental effects on viral community structure. A significant relationship between T4-like281
viral communities and bacterial assemblages was found however (Daniel et al., 2016), and numerous282
other studies have reported a significant relationship between bacterial community diversity and latitude283
(e.g., Ladau et al. (2013); Raes et al. (2018)), latitudinal variation in bacterial communities is likely linked284
to viral community variation.285
Certain clusters have been marked on the tree for further analysis. Cluster A (Station 85 DCM, Station286
67 surface) contains the samples with the most divergent RNR-containing viral populations (Fig. 3)287
according to the dendrogram. Station 85 DCM is also the sample with the lowest conductivity, highest288
dissolved oxygen, and most southerly latitude, suggesting that the divergent conditions of the sample with289
respect to the other included samples could be influencing the divergent RNR-containing viral population.290
Clusters B and C also offer a good point of comparison (Fig. 3). In addition to the similarity of their291
RNR-containing viral populations, samples in cluster B have highly similar conductivity, oxygen, and292
latitude (as shown by their highly similar branch color and bar charts), suggesting a close connection293
between sample composition and viral population. Cluster C is separate from cluster B on the dendrogram,294
implying their RNR-containing viral populations are less similar. The sample metadata between the two295
clusters is less similar as well, with Cluster B having on average a lower conductivity and higher dissolved296
oxygen content than samples from cluster C.297
Connections between viral community composition and environment have been seen before. Salinity,298
which can be estimated from measurements of electrical conductivity (Pawlowicz, 2012, 2019), has been299
shown to affect viral-host interactions. In a viral-host system of halovirus SNJ1 with its host, Natrinema300
6/17
.CC-BY 4.0 International licenseis made available under aThe copyright holder for this preprint (which was not peer-reviewed) is the author/funder. It. https://doi.org/10.1101/106138doi: bioRxiv preprint
sp. J7-2, viral adsorption rates and lytic/lysogenic rates were measured at varying salt concentrations.301
Adsorption and lytic rate were found to increase with salt concentration, whereas the lysogenic rate302
decreased (Mei et al., 2015). In a system of tropical coastal lagoons, salinity was found to be one of the303
main factors positively affecting viral abundance (Junger et al., 2018). Viral community structure has also304
been associated with shifts in salinity in various environments (Bettarel et al., 2011; Emerson et al., 2013;305
Winter et al., 2013; Finke and Suttle, 2019). These shifts likely effect a change in the host communities,306
which is reflected in the shifts in viral communities.307
Cluster C can be further divided into two clusters, C1 and C2. While the samples in C1 are closer to308
those in C2 than to those in cluster B in terms of their RNR-carrying viral populations, the samples in C1309
are more similar to the samples in cluster B with respect to their metadata projection. The similar branch310
coloring between samples in clusters B and C1, despite their large differences in latitude, occurs because311
more of the variation in first principal component (the principal component on which the Viridis coloring312
is based) is explained by conductivity and oxygen than by latitude (Fig. 4; full ordination: Supplementary313
Figure S1). More striking examples can be found elsewhere in the tree. For example, station 66 surface,314
station 66 DCM, and station 34 surface cluster together on the dendrogram based on viral community315
similarity (cluster F), but the conductivity, oxygen, and latitude values for sample 34 surface are quite316
different from the station 66 samples. Thus, while these three metadata categories were significantly317
correlated with sample UniFrac distance, other factors also play a role in shaping the viral communities.318
Overall, using Iroki to add color and bar charts based on environmental metadata to the dendrogram based319
on RNR-carrying viral community structure helps visualize that high-level viral community structure can320
be influenced by the environmental parameters of the sample in which they originate.321
CONCLUSIONS322
Iroki is a web application for fast, automatic customization and visualization of large phylogenetic trees323
based on user specified, tab-delimited configuration files with categorical and numeric metadata. Various324
example datasets from microbial ecology studies were analyzed to demonstrate Iroki’s utility. In each325
case, Iroki simplified the processes of data exploration and presentation. Though these examples focused326
specifically on applications in microbial ecology, Iroki is applicable to any problem space with hierarchical327
data that can be represented in the Newick tree format. Iroki provides a simple and convenient way to328
rapidly visualize and customize trees, especially in cases where the tree in question is too large to annotate329
manually or in studies with many trees to annotate.330
ADDITIONAL INFORMATION AND DECLARATIONS331
Availability of data and materials332
Data used to generate figures for this manuscript are available for download on Zenodo at the following333
URL: https://doi.org/10.5281/zenodo.3458510.334
Funding335
This project was supported by the Agriculture and Food Research Initiative grant no. 2012-68003-30155336
from the USDA National Institute of Food and Agriculture, the National Science Foundation Advances in337
Biological Informatics program (award number DBI 1356374), the National Science Foundation Grant338
No. 1736030, the Established Program to Stimulate Competitive Research (award number OIA 1736030)339
from the Office of Integrated Activities, and a Doctoral Fellowship provided by University of Delaware340
in conjunction with the Unidel Foundation. Computational infrastructure support by the University of341
Delaware Center for Bioinformatics and Computational Biology Core Facility was made possible through342
funding from the Delaware Biotechnology Institute, and the Delaware INBRE program with a grant from343
the National Institute of General Medical Sciences (NIGMS P20 GM103446) from the National Institutes344
of Health and the State of Delaware. This content is solely the responsibility of the authors and does not345
necessarily represent the official views of NIH.346
Acknowledgments347
We would like to acknowledge Barbra D. Ferrell for editing the manuscript.348
Competing interests349
The authors declare that they have no competing interests.350
7/17
.CC-BY 4.0 International licenseis made available under aThe copyright holder for this preprint (which was not peer-reviewed) is the author/funder. It. https://doi.org/10.1101/106138doi: bioRxiv preprint

Author contributions351
RMM and SMM conceived the project. RMM wrote the manuscript and implemented Iroki with assistance352
from AOH. KEW and SWP guided the project and edited the manuscript. All authors read, edited, and353
approved the final manuscript.354
8/17
.CC-BY 4.0 International licenseis made available under aThe copyright holder for this preprint (which was not peer-reviewed) is the author/funder. It. https://doi.org/10.1101/106138doi: bioRxiv preprint

Proteobacteria Actinobacteria Firmicutes Bacteroidetes Cyanobacteria
Branch color (Host phylum)
Ring color (Viral family)
Siphoviridae Myoviridae Podoviridae Ackermannviridae
5
Figure 1. Proteomic cladogram of viruses from Virus-Host DB. Proteomic cladogram of virusesinfecting Actinobacteria, Bacteroidetes, Cyanobacteria, Firmicutes, and Proteobacteria from theVirus-Host DB (Mihara et al., 2016). Branches are colored by host phylum. Outer ring colors representvirus taxonomic family.
9/17
.CC-BY 4.0 International licenseis made available under aThe copyright holder for this preprint (which was not peer-reviewed) is the author/funder. It. https://doi.org/10.1101/106138doi: bioRxiv preprint

Clostridiales_Lachnospiraceae
Clostridiales_LachnospiraceaeClostridiales_Lachnospiraceae
Clostridiales_LachnospiraceaeClostridiales_LachnospiraceaeClostridiales_LachnospiraceaeClostridiales_Lachnospiraceae
Clostridiales_Lachnospiraceae
Clostridiales_LachnospiraceaeClostridiales_Lachnospiraceae
Clostridiales_LachnospiraceaeClostridiales_Lachnospiraceae
Clostridiales_Lachnospiraceae
Clostridiales_Lachnospiraceae
Clostridiales_Lachnospiraceae
Clostridiales_Lachnospiraceae
Clostridiales_Lachnospiraceae
Clostridiales_Lachnospiraceae
Clostridiales_Lachnospiraceae
Clostridiales_Lachnospiraceae
Clostridiales_Lachnospiraceae
Clostridiales_Clostridiaceae 1
Clostridiales_Clostridiaceae 1
Clostridiales_Family XI
Clostridiales_Peptostreptococcaceae
Clostridiales_Family XI
Clostridiales_Family XIII
Clostridiales_Ruminococcaceae
Clostridiales_Family XI
Clostridiales_Family XI
Clostridiales_Family XIII
Clostridiales_Family XIII
Clostridiales_Ruminococcaceae
Clostridiales_Ruminococcaceae
Clostridiales_Christensenellaceae
Clostridiales_Peptococcaceae
Unclassified_U
nclassified
Clostridiales_R
uminococcaceae
Clos
tridi
ales
_Rum
inoc
occa
ceae
Clos
tridi
ales
_Rum
inoc
occa
ceae
Clostridiales_Christensenellaceae
Clostridiales_Christensenellaceae
Deinococcales_Deinococcaceae
Spirochaetales_Spirochaetaceae
Fibrobacterales_Fibrobacteraceae
Clo
strid
iale
s_R
umin
ococ
cace
ae
Clos
tridi
ales
_Rum
inoc
occa
ceae
Clos
tridia
les_R
umino
cocc
acea
e
Clostrid
iales
_Rum
inoco
ccac
eae
Selenomonadales_Acidaminococcaceae
Thermom
icrobiales_JG30-KF-CM
45
Rhodobacterales_Rhodobacteraceae Flav
obac
teria
les_
Wee
ksel
lace
ae
Micr
otric
hales
_unc
ultur
ed
Uncla
ssifie
d_Un
class
ified
Prop
ioniba
cteria
les_N
ocar
dioida
ceae
Clo
strid
iale
s_R
umin
ococ
cace
ae
Clos
tridi
ales
_Rum
inoc
occa
ceae
Clostrid
iales
_Rum
inoco
ccac
eae
Selenomonadales_Veillonellaceae
Erysipelotrichales_ErysipelotrichaceaeMollicutes RF39_Bacillales_Thermoactinomycetaceae
Thermom
icrobiales_JG30-KF-CM
45
Betaproteobacteriales_Neisseriaceae
Clo
strid
iale
s_R
umin
ococ
cace
ae
Clos
tridi
ales
_Rum
inoc
occa
ceae
Clos
tridi
ales
_Rum
inoc
occa
ceae
Clos
tridi
ales
_Rum
inoc
occa
ceae
Clos
tridia
les_R
umino
cocc
acea
e
Clos
tridia
les_R
umino
cocc
acea
e
Clos
tridial
es_R
umino
cocc
acea
e
Clos
tridial
es_C
lostrid
iales
Clostrid
iales
_Rum
inoco
ccac
eae
Selenomonadales_Veillonellaceae
Thermom
icrobiales_JG30-KF-CM
45
Pseudomonadales_M
oraxellaceae
Bact
eroi
dale
s_Ta
nner
ella
ceae
Microc
occa
les_In
trasp
orang
iacea
e
Clostrid
iales_
Rumino
cocca
ceae
Selenomonadales_VeillonellaceaeSelenomonadales_Veillonellaceae
Thermom
icrobiales_JG30-KF-CM
45Therm
omicrobiales_JG
30-KF-CM45
Pseudomonadales_M
oraxellaceae Pseu
dom
onad
ales
_Mor
axel
lace
aeBa
cter
oida
les_
Rike
nella
ceae
Uncla
ssifie
d_Un
class
ified
Bact
eroi
dale
s_Ri
kene
llace
aeBa
cter
oida
les_
Rike
nella
ceae
Bact
eroi
dale
s_Ba
cter
oida
ceae
Coryne
bacte
riales
_Diet
ziace
ae
Coryne
bacte
riales
_Diet
ziace
ae
Coryne
bacte
riales
_Cory
neba
cteria
ceae
Coryne
bacte
riales
_Cory
neba
cteria
ceae
Bacillales_Bacillaceae
Lactobacillales_Enterococcaceae
Lactobacillales_Aerococcaceae
Lactobacillales_Carnobacteriaceae
Bact
eroi
dale
s_un
cultu
red
Micrococca
les_Microbacte
riaceae
Micrococca
les_Microbacte
riaceae
Clostrid
iales_
Rumino
cocca
ceae
Clostridiales_Ruminococca
ceae
Bacillales_Family XII
Bacillales_Staphylococcaceae
Bacillales_Staphylococcaceae
Bacte
roida
les_P
revo
tella
ceae
Bacte
roida
les_P
revo
tella
ceae
Micrococca
les_Micrococca
ceae
Clostridiales_Ruminococca
ceae
Clostridiales_Ruminococca
ceae
Clostridiales_Ruminococcaceae
Clostridiales_Ruminococcaceae
Bacillales_Planococcaceae
Bacillales_Staphylococcaceae
Bacillales_Staphylococcaceae
Bacillales_Staphylococcaceae
Bacillales_Staphylococcaceae
Micrococcales_Micrococcaceae
Micrococcales_Micrococcaceae
Actinomycetales_Actinomycetaceae
Unclassified_Unclassified
Bacillales_Planococcaceae
Bacillales_Planococcaceae
Lactobacillales_Streptococcaceae
Lactobacillales_Streptococcaceae
Lactobacillales_Streptococcaceae
Lactobacillales_Leuconostocaceae
Lactobacillales_Carnobacteriaceae
Actinomycetales_Actinomycetaceae
Lactobacillales_Streptococcaceae
Lactobacillales_Streptococcaceae
Lactobacillales_Lactobacillaceae
Lactobacillales_Lactobacillaceae
Lactobacillales_Carnobacteriaceae
Lactobacillales_Carnobacteriaceae
Micrococcales_Brevibacteriaceae
Micrococcales_Bogoriellaceae
Micrococcales_Bogoriellaceae
Unclassified_Unclassified
Micrococcales_Brevibacteriaceae
Micrococcales_Brevibacteriaceae
Micrococcales_Micrococcales_Dermabacteraceae
Micrococcales_Dermabacteraceae
0.15
P ≤ 0.05P ≤ 0.10P > 0.10
GroupSignificance
ActinobacteriaBacteroidetesChloroflexi
Deinococcus-Thermus
Fibrobacteres
Firmicutes
Proteobacteria
SpirochaetesTenericutes
Unclassified
OTU Phylum
Log Abundance 4.96 Max abundanceMin. abundance
STEC +/- Ratio 3x Higher in STEC neg.Higher in STEC pos.
Figure 2. Changes in OTU abundance in two sample groups. Approximate-maximum likelihoodtree of hide SSU rRNA OTUs that showed differences in relative abundance between STEC positive andSTEC negative cattle hide samples. Branch and leaf dot coloring represents the p-value of aMann-Whitney U test (dark green: p ≤ 0.05, light green: 0.05 < p ≤ 0.1, gray: p > 0.1) testing forchanges in OTU abundance between STEC positive samples and STEC negative samples. Inner barheights represent log transformed OTU abundance, and outer bars represent the abundance ratio betweenSTEC positive and STEC negative samples (blue bars for higher abundance in STEC positive samplesand brown bars for OTUs with higher abundance in STEC negative samples). Taxa labels show thepredicted Order and Family of the OTU and are colored by the predicted phylum using the Paul TolMuted color palette included with Iroki.
10/17
.CC-BY 4.0 International licenseis made available under aThe copyright holder for this preprint (which was not peer-reviewed) is the author/funder. It. https://doi.org/10.1101/106138doi: bioRxiv preprint

Station 67Station 85Station 25Station 30Station 22Station 23Station 25Station 109Station 109
Station 41
Station 39Station 39
Station 34Station 42Station 18
Station 38Station 38Station 36Station 36
Station 46
Station 18
Station 41Station 42Station 65Station 65Station 70Station 34
Station 31Station 32
Station 66Station 66
Station 52Station 72
Station 72
Station 64Station 64Station 68Station 68
Station 78Station 76Station 76
0.2600 3300 60° S 60° N
Conductivity(mS/cm)
Oxygen(µmol/kg)
Latitude(deg)
0
Latitude (deg)Min: 62.18° S
Max: 42.18° N
Oxygen (µmol/kg)Min: 111.5Max: 327.7
Conductivity (mS/cm)Min: 27.94Max: 60.98
Station
SurfaceDCM
A
B
C
C1
C2
D
E
F
G
Cluster B
Cluster A
Cluster C2
Cluster C1
Cluster D
Cluster E
Cluster F
Cluster G
Figure 3. Tara Oceans virome similarity with associated metadata. Average-linkage hierarchicalclustering of sample UniFrac distance based on RNR sequences mined from 41 Tara Oceans viromes.Major and sub-clusters of samples (A-G) are labeled. Branch color is based on a scaled, 1-dimensionalprojection of sample conductivity, oxygen, and latitude onto the cubehelix color gradient. Samples thatare more similar to each other in branch color represent those that are more similar to each other withrespect to the environmental parameters in the ordination. The first bar series (purple) represents sampleconductivity (mS/cm), the second bar series (orange) represents sample dissolved oxygen levels(µmol/kg), and the third bar series (brown/green) represents sample latitude (degrees). For the first twobar series, shorter bars with lighter colors indicate lower values, while longer bars with darker colorsindicate higher values. For the third series, longer, dark brown bars indicate samples with extremenegative latitudes, whereas longer, dark blue bars indicate samples with extreme positive latitudes.Samples with intermediate latitudes are represented by shorter, light colored bars. Sample labelsrepresent the station from which the virome was acquired and are colored by sampling depth, with lightblue representing surface samples and dark blue representing samples from the deep chlorophyllmaximum at that station.
11/17
.CC-BY 4.0 International licenseis made available under aThe copyright holder for this preprint (which was not peer-reviewed) is the author/funder. It. https://doi.org/10.1101/106138doi: bioRxiv preprint

●
● ●●
●●
●
●
●●
●
●
●
●
●
TARA_085_DCM
TARA_067_SRFTARA_109_DCM
TARA_109_SRF
TARA_039_DCMTARA_039_SRF
TARA_038_SRF
TARA_038_DCM
TARA_036_SRFTARA_036_DCM
TARA_030_DCM
TARA_025_DCM
TARA_025_SRFTARA_022_SRF
TARA_023_DCM
Conductivity
Oxygen
Latitude
-2
0
2
-6PC1 (73%)
PC2
(22.
5%)
Cluster B
Cluster A
Cluster C
C1C2
-4 -2 0 2
Figure 4. PCA biplot of Tara Oceans virome clusters A, B, and C. Principal components analysisbiplot of Tara Oceans viromes based on sample oxygen, conductivity, and latitude. Ordination was doneon all viromes, but only those from clusters A, B, and C are shown here for clarity.
12/17
.CC-BY 4.0 International licenseis made available under aThe copyright holder for this preprint (which was not peer-reviewed) is the author/funder. It. https://doi.org/10.1101/106138doi: bioRxiv preprint

REFERENCES355
Ahmad, M. F., Kaushal, P. S., Wan, Q., Wijerathna, S. R., An, X., Huang, M., and Dealwis, C. G. (2012).356
Role of Arginine 293 and Glutamine 288 in Communication between Catalytic and Allosteric Sites in357
Yeast Ribonucleotide Reductase. Journal of Molecular Biology, 419(5):315–329.358
Aiewsakun, P., Adriaenssens, E. M., Lavigne, R., Kropinski, A. M., and Simmonds, P. (2018). Evaluation359
of the genomic diversity of viruses infecting bacteria, archaea and eukaryotes using a common bioinfor-360
matic platform: steps towards a unified taxonomy. The Journal of general virology, 99(9):1331–1343.361
Asnicar, F., Weingart, G., Tickle, T. L., Huttenhower, C., and Segata, N. (2015). Compact graphical362
representation of phylogenetic data and metadata with GraPhlAn. PeerJ, 3:e1029.363
Bachmaier, C., Brandes, U., and Schlieper, B. (2005). Drawing phylogenetic trees. (Extended abstract). In364
Deng, X. and Du, D.-Z., editors, ISAAC: 16th International Symposium on Algorithms and Computation,365
volume 3827 of Lecture Notes in Computer Science, pages 1110–1121. Springer.366
Bellas, C. M., Anesio, A. M., and Barker, G. (2015). Analysis of virus genomes from glacial environments367
reveals novel virus groups with unusual host interactions. Frontiers in Microbiology, 6(JUL):656.368
Bennett, D. J., Sutton, M. D., and Turvey, S. T. (2017). treeman: an R package for efficient and intuitive369
manipulation of phylogenetic trees. BMC Research Notes, 10(1):30.370
Bettarel, Y., Bouvier, T., Bouvier, C., Carre, C., Desnues, A., Domaizon, I., Jacquet, S., Robin, A., and371
Sime-Ngando, T. (2011). Ecological traits of planktonic viruses and prokaryotes along a full-salinity372
gradient. FEMS Microbiology Ecology, 76(2):360–372.373
Bork, P., Bowler, C., De Vargas, C., Gorsky, G., Karsenti, E., and Wincker, P. (2015). Tara Oceans studies374
plankton at Planetary scale. Science, 348(6237):873.375
Bostock, M., Ogievetsky, V., and Heer, J. (2011). D3 Data-Driven Documents. IEEE Transactions on376
Visualization and Computer Graphics, 17(12):2301–2309.377
Brewer, C., Harrower, M., and University, T. P. S. (2013). ColorBrewer2.378
Callahan, B. J., McMurdie, P. J., and Holmes, S. P. (2017). Exact sequence variants should replace379
operational taxonomic units in marker-gene data analysis. The Isme Journal, 11:2639.380
Caporaso, J. G., Kuczynski, J., Stombaugh, J., Bittinger, K., Bushman, F. D., Costello, E. K., Fierer,381
N., Pena, A. G., Goodrich, J. K., Gordon, J. I., Huttley, G. A., Kelley, S. T., Knights, D., Koenig,382
J. E., Ley, R. E., Lozupone, C. A., McDonald, D., Muegge, B. D., Pirrung, M., Reeder, J., Sevinsky,383
J. R., Turnbaugh, P. J., Walters, W. A., Widmann, J., Yatsunenko, T., Zaneveld, J., and Knight, R.384
(2010). QIIME allows analysis of high-throughput community sequencing data. Nature Methods,385
7(5):335–336.386
Caprioli, A., Morabito, S., Brugere, H., and Oswald, E. (2005). Enterohaemorrhagic Escherichia coli:387
emerging issues on virulence and modes of transmission. Veterinary Research, 36(3):289–311.388
Chen, W.-H. and Lercher, M. J. (2009). ColorTree: a batch customization tool for phylogenic trees. BMC389
Research Notes, 2(1):155.390
Chopyk, J., Moore, R. M., DiSpirito, Z., Stromberg, Z. R., Lewis, G. L., Renter, D. G., Cernicchiaro, N.,391
Moxley, R. A., and Wommack, K. E. (2016). Presence of pathogenic Escherichia coli is correlated with392
bacterial community diversity and composition on pre-harvest cattle hides. Microbiome, 4(1):9.393
Cotruvo, J. A. and Stubbe, J. (2011). Class I Ribonucleotide Reductases: Metallocofactor Assembly and394
Repair In Vitro and In Vivo. Annual Review of Biochemistry, 80(1):733–767.395
Coutinho, F. H., Silveira, C. B., Gregoracci, G. B., Thompson, C. C., Edwards, R. A., Brussaard, C. P. D.,396
Dutilh, B. E., and Thompson, F. L. (2017). Marine viruses discovered via metagenomics shed light on397
viral strategies throughout the oceans. Nature Communications, 8(May):1–12.398
Daniel, A. d. C., Pedros-Alio, C., Pearce, D. A., and Alcamı, A. (2016). Composition and Interactions399
among Bacterial, Microeukaryotic, and T4-like Viral Assemblages in Lakes from Both Polar Zones.400
Frontiers in microbiology, 7:337–337.401
Dwivedi, B., Xue, B., Lundin, D., Edwards, R. A., and Breitbart, M. (2013). A bioinformatic analysis402
of ribonucleotide reductase genes in phage genomes and metagenomes. BMC Evolutionary Biology,403
13(1):33.404
Edwards, R. A., McNair, K., Faust, K., Raes, J., and Dutilh, B. E. (2016). Computational approaches to405
predict bacteriophage-host relationships. FEMS Microbiology Reviews, 40(2):258–272.406
Emerson, J. B., Thomas, B. C., Andrade, K., Heidelberg, K. B., and Banfield, J. F. (2013). New407
Approaches Indicate Constant Viral Diversity despite Shifts in Assemblage Structure in an Australian408
Hypersaline Lake. Applied and Environmental Microbiology, 79(21):6755.409
13/17
.CC-BY 4.0 International licenseis made available under aThe copyright holder for this preprint (which was not peer-reviewed) is the author/funder. It. https://doi.org/10.1101/106138doi: bioRxiv preprint

Fadrosh, D. W., Ma, B., Gajer, P., Sengamalay, N., Ott, S., Brotman, R. M., and Ravel, J. (2014). An410
improved dual-indexing approach for multiplexed 16s rRNA gene sequencing on the Illumina MiSeq411
platform. Microbiome, 2(1):6.412
Finke, J. F. and Suttle, C. A. (2019). The Environment and Cyanophage Diversity: Insights From413
Environmental Sequencing of DNA Polymerase. Frontiers in Microbiology, 10:167.414
Green, D. A. (2011). A colour scheme for the display of astronomical intensity images. Bulletin of the415
Astronomical Society of India, 39(2):289–295.416
Han, M. V. and Zmasek, C. M. (2009). phyloXML: XML for evolutionary biology and comparative417
genomics. BMC Bioinformatics, 10(1):356.418
Hancock, D. D., Besser, T. E., Kinsel, M. L., Tarr, P. I .and Rice, D. H., and Paros, M. G. (1994). The419
prevalence of Escherichia coli O157.H7 in dairy and beef cattle in Washington State. Epidemiology420
and Infection, 113(2):199–207.421
Hanson-Smith, V. and Johnson, A. (2016). PhyloBot: A Web Portal for Automated Phylogenetics,422
Ancestral Sequence Reconstruction, and Exploration of Mutational Trajectories. PLoS Computational423
Biology, 12(7):1–10.424
Harrison, A. O., Moore, R. M., Polson, S. W., and Wommack, K. E. (2019). Reannotation of the425
Ribonucleotide Reductase in a Cyanophage Reveals Life History Strategies Within the Virioplankton.426
Frontiers in Microbiology, 10:134.427
He, Z., Zhang, H., Gao, S., Lercher, M. J., Chen, W. H., and Hu, S. (2016). Evolview v2: an online428
visualization and management tool for customized and annotated phylogenetic trees. Nucleic Acids429
Research, 44(W1):W236–W241.430
Huerta-Cepas, J., Serra, F., and Bork, P. (2016). ETE 3: Reconstruction, Analysis, and Visualization of431
Phylogenomic Data. Molecular Biology and Evolution, 33(6):1635–1638.432
Huson, D. H., Richter, D. C., Rausch, C., Dezulian, T., Franz, M., and Rupp, R. (2007). Dendroscope: An433
interactive viewer for large phylogenetic trees. BMC Bioinformatics, 8(1):460.434
Junger, P. C., Amado, A. M., Paranhos, R., Cabral, A. S., Jacques, S. M. S., and Farjalla, V. F. (2018).435
Salinity Drives the Virioplankton Abundance but Not Production in Tropical Coastal Lagoons. Microbial436
Ecology, 75(1):52–63.437
Katoh, K. and Standley, D. M. (2013). MAFFT multiple sequence alignment software version 7:438
Improvements in performance and usability. Molecular Biology and Evolution, 30(4):772–780.439
Kolberg, M., Strand, K. R., Graff, P., and Kristoffer Andersson, K. (2004). Structure, function, and mech-440
anism of ribonucleotide reductases. Biochimica et Biophysica Acta (BBA) - Proteins and Proteomics,441
1699(1):1–34.442
Kreft, L., Botzki, A., Coppens, F., Vandepoele, K., and Van Bel, M. (2017). PhyD3: A phylogenetic tree443
viewer with extended phyloXML support for functional genomics data visualization. Bioinformatics,444
33(18):2946–2947.445
Ladau, J., Sharpton, T. J., Finucane, M. M., Jospin, G., Kembel, S. W., O’Dwyer, J., Koeppel, A. F.,446
Green, J. L., and Pollard, K. S. (2013). Global marine bacterial diversity peaks at high latitudes in447
winter. The Isme Journal, 7:1669.448
Lan, Y., Rosen, G., and Hershberg, R. (2016). Marker genes that are less conserved in their sequences449
are useful for predicting genome-wide similarity levels between closely related prokaryotic strains.450
Microbiome, 4(1):18.451
Larkin, A. A., Blinebry, S. K., Howes, C., Lin, Y., Loftus, S. E., Schmaus, C. A., Zinser, E. R., and452
Johnson, Z. I. (2016). Niche partitioning and biogeography of high light adapted Prochlorococcus453
across taxonomic ranks in the North Pacific. The ISME Journal, 10:1555–1567.454
Lauer, F. (2017). MLweb: A toolkit for machine learning on the web. Neurocomputing, 282:74–77.455
Letunic, I. and Bork, P. (2016). Interactive tree of life (iTOL) v3: an online tool for the display and456
annotation of phylogenetic and other trees. Nucleic Acids Research, 44(W1):W242–W245.457
Lozupone, C. and Knight, R. (2005). UniFrac: a New Phylogenetic Method for Comparing Microbial458
Communities. Applied and Environmental Microbiology, 71(12):8228–8235.459
Mao, S., Zhang, M., Liu, J., and Zhu, W. (2015). Characterising the bacterial microbiota across the460
gastrointestinal tracts of dairy cattle: membership and potential function. Scientific Reports, 5:16116.461
McDonald, D., Clemente, J. C., Kuczynski, J., Rideout, J., Stombaugh, J., Wendel, D., Wilke, A., Huse,462
S., Hufnagle, J., Meyer, F., Knight, R., and Caporaso, J. (2012). The Biological Observation Matrix463
(BIOM) format or: how I learned to stop worrying and love the ome-ome. GigaScience, 1(1):7.464
14/17
.CC-BY 4.0 International licenseis made available under aThe copyright holder for this preprint (which was not peer-reviewed) is the author/funder. It. https://doi.org/10.1101/106138doi: bioRxiv preprint

Mei, Y., He, C., Huang, Y., Liu, Y., Zhang, Z., Chen, X., and Shen, P. (2015). Salinity Regulation of the465
Interaction of Halovirus SNJ1 with Its Host and Alteration of the Halovirus Replication Strategy to466
Adapt to the Variable Ecosystem. PLOS ONE, 10(4):e0123874.467
Mihara, T., Nishimura, Y., Shimizu, Y., Nishiyama, H., Yoshikawa, G., Uehara, H., Hingamp, P., Goto, S.,468
and Ogata, H. (2016). Linking Virus Genomes with Host Taxonomy. Viruses, 8(3):66–66.469
Mizuno, C. M., Rodriguez-Valera, F., Kimes, N. E., and Ghai, R. (2013). Expanding the marine virosphere470
using metagenomics. PLoS Genetics, 9(12):1–13.471
Munson-McGee, J. H., Peng, S., Dewerff, S., Stepanauskas, R., Whitaker, R. J., Weitz, J. S., and Young,472
M. J. (2018). A virus or more in (nearly) every cell: ubiquitous networks of virus–host interactions in473
extreme environments. The ISME Journal, 12(7):1706–1714.474
Muller, A. L., Kjeldsen, K. U., Rattei, T., Pester, M., and Loy, A. (2015). Phylogenetic and environmental475
diversity of DsrAB-type dissimilatory (bi)sulfite reductases. The ISME journal, 9(5):1152–1165.476
Nelson, D. (2004). Phage taxonomy: we agree to disagree. Journal of bacteriology, 186(21):7029–7031.477
Nishimura, Y., Watai, H., Honda, T., Mihara, T., Omae, K., Roux, S., Blanc-Mathieu, R., Yamamoto, K.,478
Hingamp, P., Sako, Y., Sullivan, M. B., Goto, S., Ogata, H., Yoshida, T., Viral, E., Shed, G., Nishimura,479
Y., Watai, H., Honda, T., Mihara, T., Omae, K., Roux, S., Blanc-Mathieu, R., Yamamoto, K., Hingamp,480
P., Sako, Y., Sullivan, M. B., Goto, S., Ogata, H., and Yoshida, T. (2017a). Environmental Viral481
Genomes Shed New Light on Virus-Host Interactions in the Ocean. mSphere, 2(2).482
Nishimura, Y., Yoshida, T., Kuronishi, M., Uehara, H., Ogata, H., and Goto, S. (2017b). ViPTree: the483
viral proteomic tree server. Bioinformatics, 33(15):2379–2380.484
Nordlund, P. and Reichard, P. (2006). Ribonucleotide Reductases. Annual Review of Biochemistry,485
75(1):681–706.486
Paradis, E., Claude, J., and Strimmer, K. (2004). APE: Analyses of phylogenetics and evolution in R487
language. Bioinformatics, 20(2):289–290.488
Pawlowicz, R. (2012). The electrical conductivity of seawater at high temperatures and salinities.489
Desalination, 300:32–39.490
Pawlowicz, R. (2019). Electrical Properties of Sea Water: Theory and Applications. In Cochran, J. K.,491
Bokuniewicz, H. J., and Yager, P. L., editors, Encyclopedia of Ocean Sciences (Third Edition), pages492
71–80. Academic Press, Oxford.493
Pesant, S., Not, F., Picheral, M., Kandels-Lewis, S., Le Bescot, N., Gorsky, G., Iudicone, D., Karsenti, E.,494
Speich, S., Trouble, R., Dimier, C., Searson, S., Coordinators, T. O. C., Acinas, S. G., Bork, P., Boss, E.,495
Bowler, C., De Vargas, C., Follows, M., Gorsky, G., Grimsley, N., Hingamp, P., Iudicone, D., Jaillon,496
O., Kandels-Lewis, S., Karp-Boss, L., Karsenti, E., Krzic, U., Not, F., Ogata, H., Pesant, S., Raes, J.,497
Reynaud, E. G., Sardet, C., Sieracki, M., Speich, S., Stemmann, L., Sullivan, M. B., Sunagawa, S.,498
Velayoudon, D., Weissenbach, J., and Wincker, P. (2015). Open science resources for the discovery and499
analysis of Tara Oceans data. Scientific Data, 2.500
Pielou, E. C. (1966). The measurement of diversity in different types of biological collections. Journal of501
Theoretical Biology, 13(C):131–144.502
Pope, W. H., Jacobs-Sera, D., Russell, D. A., Peebles, C. L., Al-Atrache, Z., Alcoser, T. A., Alexander,503
L. M., Alfano, M. B., Alford, S. T., Amy, N. E., Anderson, M. D., Anderson, A. G., Ang, A. A. S.,504
Ares, Jr., M., Barber, A. J., Barker, L. P., Barrett, J. M., Barshop, W. D., Bauerle, C. M., Bayles, I. M.,505
Belfield, K. L., Best, A. A., Borjon, Jr., A., Bowman, C. A., Boyer, C. A., Bradley, K. W., Bradley,506
V. A., Broadway, L. N., Budwal, K., Busby, K. N., Campbell, I. W., Campbell, A. M., Carey, A.,507
Caruso, S. M., Chew, R. D., Cockburn, C. L., Cohen, L. B., Corajod, J. M., Cresawn, S. G., Davis,508
K. R., Deng, L., Denver, D. R., Dixon, B. R., Ekram, S., Elgin, S. C. R., Engelsen, A. E., English,509
B. E. V., Erb, M. L., Estrada, C., Filliger, L. Z., Findley, A. M., Forbes, L., Forsyth, M. H., Fox,510
T. M., Fritz, M. J., Garcia, R., George, Z. D., Georges, A. E., Gissendanner, C. R., Goff, S., Goldstein,511
R., Gordon, K. C., Green, R. D., Guerra, S. L., Guiney-Olsen, K. R., Guiza, B. G., Haghighat, L.,512
Hagopian, G. V., Harmon, C. J., Harmson, J. S., Hartzog, G. A., Harvey, S. E., He, S., He, K. J., Healy,513
K. E., Higinbotham, E. R., Hildebrandt, E. N., Ho, J. H., Hogan, G. M., Hohenstein, V. G., Holz,514
N. A., Huang, V. J., Hufford, E. L., Hynes, P. M., Jackson, A. S., Jansen, E. C., Jarvik, J., Jasinto,515
P. G., Jordan, T. C., Kasza, T., Katelyn, M. A., Kelsey, J. S., Kerrigan, L. A., Khaw, D., Kim, J.,516
Knutter, J. Z., Ko, C.-C., Larkin, G. V., Laroche, J. R., Latif, A., Leuba, K. D., Leuba, S. I., Lewis,517
L. O., Loesser-Casey, K. E., Long, C. A., Lopez, A. J., Lowery, N., Lu, T. Q., Mac, V., Masters, I. R.,518
McCloud, J. J., McDonough, M. J., Medenbach, A. J., Menon, A., Miller, R., Morgan, B. K., Ng, P. C.,519
15/17
.CC-BY 4.0 International licenseis made available under aThe copyright holder for this preprint (which was not peer-reviewed) is the author/funder. It. https://doi.org/10.1101/106138doi: bioRxiv preprint

Nguyen, E., Nguyen, K. T., Nguyen, E. T., Nicholson, K. M., Parnell, L. A., Peirce, C. E., Perz, A. M.,520
Peterson, L. J., Pferdehirt, R. E., Philip, S. V., Pogliano, K., Pogliano, J., Polley, T., Puopolo, E. J.,521
Rabinowitz, H. S., Resiss, M. J., Rhyan, C. N., Robinson, Y. M., Rodriguez, L. L., Rose, A. C., Rubin,522
J. D., Ruby, J. A., Saha, M. S., Sandoz, J. W., Savitskaya, J., Schipper, D. J., Schnitzler, C. E., Schott,523
A. R., Segal, J. B., Shaffer, C. D., Sheldon, K. E., Shepard, E. M., Shepardson, J. W., Shroff, M. K.,524
Simmons, J. M., Simms, E. F., Simpson, B. M., Sinclair, K. M., Sjoholm, R. L., Slette, I. J., Spaulding,525
B. C., Straub, C. L., Stukey, J., Sughrue, T., Tang, T.-Y., Tatyana, L. M., Taylor, S. B., Taylor, B. J.,526
Temple, L. M., Thompson, J. V., Tokarz, M. P., Trapani, S. E., Troum, A. P., Tsay, J., Tubbs, A. T.,527
Walton, J. M., Wang, D. H., Wang, H., Warner, J. R., Weisser, E. G., Wendler, S. C., Weston-Hafer,528
K. A., Whelan, H. M., Williamson, K. E., Willis, A. N., Wirtshafter, H. S., Wong, T. W., Wu, P., Yang,529
Y. j., Yee, B. C., Zaidins, D. A., Zhang, B., Zuniga, M. Y., Hendrix, R. W., and Hatfull, G. F. (2011).530
Expanding the Diversity of Mycobacteriophages: Insights into Genome Architecture and Evolution.531
PLOS ONE, 6(1):e16329.532
Price, M. N., Dehal, P. S., and Arkin, A. P. (2010). FastTree 2 - Approximately maximum-likelihood trees533
for large alignments. PLoS ONE, 5(3).534
Pruesse, E., Glockner, F. O., and Peplies, J. (2012). SINA: Accurate high-throughput multiple sequence535
alignment of ribosomal RNA genes. Bioinformatics, 28(14):1823–1829.536
Quast, C., Pruesse, E., Yilmaz, P., Gerken, J., Schweer, T., Yarza, P., Peplies, J., and Glockner, F. O.537
(2012). The SILVA ribosomal RNA gene database project: improved data processing and web-based538
tools. Nucleic Acids Research, 41(D1):D590–D596.539
Raes, E. J., Bodrossy, L., van de Kamp, J., Bissett, A., and Waite, A. M. (2018). Marine bacterial richness540
increases towards higher latitudes in the eastern Indian Ocean. Limnology and Oceanography Letters,541
3(1):10–19.542
Rambaut, A. (2006). FigTree.543
Reichard, P. (1993). From RNA to DNA, why so many ribonucleotide reductases? Science,544
260(5115):1773.545
Revell, L. J. (2012). phytools: An R package for phylogenetic comparative biology (and other things).546
Methods in Ecology and Evolution, 3(2):217–223.547
Robinson, O., Dylus, D., and Dessimoz, C. (2016). Phylo.io: Interactive Viewing and Comparison of548
Large Phylogenetic Trees on the Web. Molecular Biology and Evolution, 33(8):2163–2166.549
Rohwer, F. and Edwards, R. (2002). The Phage Proteomic Tree: a genome-based taxonomy for phage.550
Journal of bacteriology, 184(16):4529–4535.551
Rohwer, F. and Thurber, R. V. (2009). Viruses manipulate the marine environment. Nature, 459(7244):207–552
212.553
Roux, S., Brum, J. R., Dutilh, B. E., Sunagawa, S., Duhaime, M. B., Loy, A., Poulos, B. T., Solonenko, N.,554
Lara, E., Poulain, J., Pesant, S., Kandels-Lewis, S., Dimier, C., Picheral, M., Searson, S., Cruaud, C.,555
Alberti, A., Duarte, C. M., Gasol, J. M., Vaque, D., Bork, P., Acinas, S. G., Wincker, P., and Sullivan,556
M. B. (2016). Ecogenomics and potential biogeochemical impacts of globally abundant ocean viruses.557
Nature, 537(7622):689–693.558
Roux, S., Hallam, S. J., Woyke, T., and Sullivan, M. B. (2015). Viral dark matter and virus–host559
interactions resolved from publicly available microbial genomes. eLife, 4:1–20.560
Sakowski, E. G., Munsell, E. V., Hyatt, M., Kress, W., Williamson, S. J., Nasko, D. J., Polson, S. W., and561
Wommack, K. E. (2014). Ribonucleotide reductases reveal novel viral diversity and predict biological562
and ecological features of unknown marine viruses. Proceedings of the National Academy of Sciences563
of the United States of America, 111(44):15786–15791.564
Santamarıa, R. and Theron, R. (2009). Treevolution: Visual analysis of phylogenetic trees. Bioinformatics,565
25(15):1970–1971.566
Simister, R. L., Deines, P., Botte, E. S., Webster, N. S., and Taylor, M. W. (2012). Sponge-specific567
clusters revisited: A comprehensive phylogeny of sponge-associated microorganisms. Environmental568
Microbiology, 14(2):517–524.569
Simmonds, P. (2015). Methods for virus classification and the challenge of incorporating metagenomic570
sequence data. Journal of General Virology, 96(6):1193–1206.571
Simmonds, P., Adams, M. J., Benko, M., Breitbart, M., Brister, J. R., Carstens, E. B., Davison, A. J.,572
Delwart, E., Gorbalenya, A. E., Harrach, B., Hull, R., King, A. M., Koonin, E. V., Krupovic, M., Kuhn,573
J. H., Lefkowitz, E. J., Nibert, M. L., Orton, R., Roossinck, M. J., Sabanadzovic, S., Sullivan, M. B.,574
16/17
.CC-BY 4.0 International licenseis made available under aThe copyright holder for this preprint (which was not peer-reviewed) is the author/funder. It. https://doi.org/10.1101/106138doi: bioRxiv preprint
Suttle, C. A., Tesh, R. B., van der Vlugt, R. A., Varsani, A., and Zerbini, F. M. (2017). Virus taxonomy575
in the age of metagenomics. Nature Reviews Microbiology, 15:161.576
Srinivas, V., Lebrette, H., Lundin, D., Kutin, Y., Sahlin, M., Lerche, M., Eirich, J., Branca, R. M. M., Cox,577
N., Sjoberg, B.-M., and Hogbom, M. (2018). Metal-free ribonucleotide reduction powered by a DOPA578
radical in Mycoplasma pathogens. Nature, 563(7731):416–420.579
Stover, B. C. and Muller, K. F. (2010). TreeGraph 2: Combining and visualizing evidence from different580
phylogenetic analyses. BMC Bioinformatics, 11:7.581
Stover, B. C., Wiechers, S., and Muller, K. F. (2016). JPhyloIO — A Java library for event-based reading582
and writing of different alignment and tree formats through one common interface Aims and concept583
Event based document reading Writing events using data adapters.584
Suttle, C. A. (2007). Marine viruses – major players in the global ecosystem. Nature Reviews Microbiology,585
5(10):801–812.586
Sanchez, R., Serra, F., Tarraga, J., Medina, I., Carbonell, J., Pulido, L., De Marıa, A., Capella-Gutıerrez,587
S., Huerta-Cepas, J., Gabaldon, T., Dopazo, J., and Dopazo, H. (2011). Phylemon 2.0: A suite of588
web-tools for molecular evolution, phylogenetics, phylogenomics and hypotheses testing. Nucleic589
Acids Research, 39:470–474.590
Talevich, E., Invergo, B. M., Cock, P. J., and Chapman, B. A. (2012). Bio.Phylo: A unified toolkit for591
processing, analyzing and visualizing phylogenetic trees in Biopython. BMC Bioinformatics, 13:209.592
Vaughan, T. G. (2017). IcyTree: Rapid browser-based visualization for phylogenetic trees and networks.593
Bioinformatics, 33(15):2392–2394.594
Villarroel, J., Kleinheinz, A. K., Jurtz, I. V., Zschach, H., Lund, O., Nielsen, M., Larsen, V. M., Kleinheinz,595
K. A., Jurtz, V. I., Zschach, H., Lund, O., Nielsen, M., and Larsen, M. V. (2016). HostPhinder: A596
Phage Host Prediction Tool. Viruses, 8(5):1–22.597
Vos, R. A., Caravas, J., Hartmann, K., Jensen, M. A., and Miller, C. (2011). BIO::Phylo-phyloinformatic598
analysis using perl. BMC Bioinformatics, 12:63.599
Winter, C., Matthews, B., and Suttle, C. A. (2013). Effects of environmental variation and spatial distance600
on Bacteria, Archaea and viruses in sub-polar and arctic waters. The Isme Journal, 7:1507.601
Wommack, K. E., Bhavsar, J., Polson, S. W., Chen, J., Dumas, M., Srinivasiah, S., Furman, M., Jamindar,602
S., and Nasko, D. J. (2012). VIROME: a standard operating procedure for analysis of viral metagenome603
sequences. Standards in Genomic Sciences, 6(3):421–433.604
Wommack, K. E., Nasko, D. J., Chopyk, J., and Sakowski, E. G. (2015). Counts and sequences,605
observations that continue to change our understanding of viruses in nature. Journal of Microbiology,606
53(3):181–192.607
Wu, Z., Yang, L., Ren, X., He, G., Zhang, J., Yang, J., Qian, Z., Dong, J., Sun, L., Zhu, Y., Du, J.,608
Yang, F., Zhang, S., and Jin, Q. (2016). Deciphering the bat virome catalog to better understand the609
ecological diversity of bat viruses and the bat origin of emerging infectious diseases. The ISME Journal,610
10(3):609–620.611
Xu, Y., Dugat-Bony, E., Zaheer, R., Selinger, L., Barbieri, R., Munns, K., McAllister, T. A., and Selinger,612
L. B. (2014). Escherichia coli O157:H7 Super-Shedder and Non-Shedder Feedlot Steers Harbour613
Distinct Fecal Bacterial Communities. PLOS ONE, 9(5):e98115.614
Zaheer, R., Dugat-Bony, E., Holman, D., Cousteix, E., Xu, Y., Munns, K., Selinger, L. J., Barbieri,615
R., Alexander, T., McAllister, T. A., and Selinger, L. B. (2017). Changes in bacterial community616
composition of Escherichia coli O157:H7 super-shedder cattle occur in the lower intestine. PloS one,617
12(1):e0170050–e0170050.618
Zhao, L., Tyler, P., Starnes, J., Bratcher, C., Rankins, D., McCaskey, T., and Wang, L. (2013). Correlation619
analysis of Shiga toxin–producing Escherichia coli shedding and faecal bacterial composition in beef620
cattle. Journal of Applied Microbiology, 115(2):591–603.621
17/17
.CC-BY 4.0 International licenseis made available under aThe copyright holder for this preprint (which was not peer-reviewed) is the author/funder. It. https://doi.org/10.1101/106138doi: bioRxiv preprint