iron & steel -11th nov - indiaenvironmentportaltechnology compendium on energy saving...
TRANSCRIPT
Technology Compendium
On
Energy saving Opportunities
Iron & Steel Sector
August 2013

1 1 Technology Compendium on Energy Saving Opportunities – Iron & Steel
Disclaimer
This report is part of Shakti Sustainable Energy Foundation (SSEF) and Confederation of Indian
Industry, CII – Godrej GBC’s effort to assist the Indian industry achieve greater energy efficiency
levels and to facilitate designated consumers meet their Perform, Achieve & Trade (PAT) targets
set by Bureau of Energy Efficiency (BEE), Government of India.
The views expressed in this document do not necessarily reflect the view of Shakti Sustainable
Energy Foundation. While every care has been taken in compiling this report, CII-Godrej GBC and
Shakti Sustainable Energy Foundation accept no claim for any kind of compensation, if any entry is
wrong, abbreviated, omitted or inserted incorrectly either as to the wording space or position in
the booklet. The report is only an attempt to highlight energy efficiency improvement
opportunities and designated consumers meet their Perform Achieve & Trade (PAT) targets.
Published by
Confederation of Indian Industry
CII – Sohrabji Green Business Centre
Survey # 64, Kothaguda Post,
RR District, Hyderabad – 500 084, India
1 2 Technology Compendium on Energy Saving Opportunities – Iron & Steel
Foreword by Director General – Bureau of Energy Efficiency
With the growth of economy, the demand for energy has grown substantially.
Further, the high level of energy intensity in certain major industrial sectors,
and more so, the variation between the most & least efficient facility within
them is a matter of concern. In such scenario, efficient use of energy resources and their
conservation assume tremendous significance and become imperative for sustainable growth of
the industrial economy and the country at large.
The efficient use of energy and its conservation is the best option to meet the increasing energy
demand, Government of India has enacted the Energy Conservation Act, 2001. The Act provides
for institutionalizing and strengthening delivery mechanism for energy efficiency services in the
country and provides the much-needed coordination between the various entities.
The Ministry of Power and Bureau of Energy Efficiency (BEE) are entrusted with the task of
preparing the implementation for the National Mission on Enhanced Energy Efficiency (NMEEE)
under National Action Plan on Climate Change (NAPCC). This mission has a component which
deals with the market based mechanism to improve the energy efficiency in energy intensive large
industries and facilities by certification of energy savings which could be traded.
This scheme known as Perform, Achieve and Trade (PAT) is expected to save about 6.686 million
metric tonne of oil equivalent (mMtoe) by 2014-15. Eight industrial sectors namely Power, Iron &
Steel, Fertilizer, Cement, Aluminium, Pulp & Paper, Textile and Chlor-alkali have been included in
this scheme where in about 478 industries (known as Designated Consumers (DCs)) are covered.
In the ensuing PAT scheme, all the DCs will be required to achieve a reduction of Specific Energy
Consumption (SEC) from their baseline SEC within 3 years time (2012-13 to 2014-15).
These industry specific technology compendiums will provide ready-to-use information on
national & international energy conservation opportunities, Best Operating Practices (BOP), Best
Available Technologies (BAT), with their techno-economic considerations. These compendiums
will be helpful for DCs to prepare their energy efficiency action plans and to achieve their SEC
reduction targets set by BEE.
I am sure that this Technology Compendium manual will receive an overwhelming response from
the cross section of the industry. I take this opportunity to thank Shakti Sustainable Energy
Foundation (a part of Climate Works Foundation) for supporting this initiative.

1 3 Technology Compendium on Energy Saving Opportunities – Iron & Steel
CONTENTS
Chapter No. Description Page No.
Executive Summary 6
Methodology 7
1.0 Indian Iron & Steel Industry 8
1.1 Capacity 8
1.2 World Steel Production 10
1.3 Production trend: Public and Private Sector (India) 12
2.0 Energy Consumption in Indian Iron & Steel Industry 14
2.1 Cost of Steel making & Financial Strength of the sector 16
2.2 Future growth opportunities 17
2.3 Challenges faced by the Iron & Steel Industry 21
2.4 Policies favoring energy activities 22
2.5 Environmental Issues faced by the Sector 23
2.6 Energy Consumption trends in Indian Steel Industry 24
3.0 Mapping Stakeholder Initiatives 25
4.0 Action Plan for Energy Efficiency 29
4.1 Energy Efficiency Options for Indian Iron & Steel Industry 32
5.0 Future technology options 64
6.0 Cost Abatement Curve 67
7.0 Conclusion 69
Annexure 1 : GHG Inventorization & trend analysis 70
Annexure 2 : Basis of Savings Estimations/Sample Calculation 73
Annexure 3 : List of Equipment/Technology Suppliers 77
Abbreviations 78
Bibliography 80

1 4 Technology Compendium on Energy Saving Opportunities – Iron & Steel
List of Tables
Table 1: Crude Steel Capacity & Production........................................................................................8
Table 2: Production of Sponge Iron in India ......................................................................................10
Table 3: Production of Sponge Iron from 1980 in India ....................................................................10
Table 4: Major Indian Iron & Steel Industries....................................................................................12
Table 5: Steel production: Public sector & private sector.................................................................12
Table 6: Top Steel Producers .............................................................................................................13
Table 7: Crude steel capacity of major Indian Steel Producers.........................................................13
Table 8: Capacity Utilization Details ..................................................................................................14
Table 9: Specific Energy Consumption figures of major Iron & Steel Industries in India..................15
Table 10: Captive Power Plant capacities of major Iron & Steel Industries in India .........................15
Table 11: Production and share of different routes of crude steel in India......................................16
Table 12: Projected Steel Growth......................................................................................................18
Table 13: Projected Steel Growth......................................................................................................19
Table 14: Growth projections of Indian Steel industry .....................................................................21
Table 15: PAT Target for Iron & Steel Sector.....................................................................................31
Table 16: Sample CDQ operating data...............................................................................................46
Table 17: Energy savings comparisons ..............................................................................................57
Table 18: Priority Table......................................................................................................................66
Table 19: Cost Abatement Curve.......................................................................................................66

1 5 Technology Compendium on Energy Saving Opportunities – Iron & Steel
List of Figures
Figure 1: Crude Steel Capacity & Production ......................................................................................9
Figure 2: World Crude Steel Production............................................................................................11
Figure 3: World Crude Steel Production Region Wise.......................................................................11
Figure 4: Variable cost percentage....................................................................................................17
Figure 5: Per capita Consumption .....................................................................................................17
Figure 6: Green Rating Project 2009, Centre for Science and Environment, New Delhi ..................19
Figure 7: CII Estimate on steel industry growth projection...............................................................20
Figure 8: Historical Trend...................................................................................................................24
Figure 9: Iron & Steel Process............................................................................................................31
Figure 10: Waste Heat Recovery from Sinter Bed.............................................................................35
Figure 11: Improvement in segregated charging of sintering materials...........................................37
Figure 12: Schematic diagram of sensible heat recovery from sintering machine...........................39
Figure 13 Schematic layout of moisture control in coal....................................................................42
Figure 14: Automation combustion control of coke ovens...............................................................43
Figure 15: CDQ Process Flow .............................................................................................................45
Figure 16: Preheating through WHR from Hot stoves of Blast Furnace............................................48
Figure 17: Top pressure recovery turbine .........................................................................................49
Figure 18: Pulverized coal injection...................................................................................................51
Figure 19: Hot Charging and direct rolling mill..................................................................................54
Figure 20: Systematic diagram of Plunger Pump ..............................................................................56
Figure 21: Structure of a rapid heating surface.................................................................................58
Figure 22: Regenerative Furnace.......................................................................................................60
Figure 23: Coherent vs Conventional Supersonic jet ........................................................................62
Figure 24: Cost Abatement Curve......................................................................................................67

1 6 Technology Compendium on Energy Saving Opportunities – Iron & Steel
EXECUTIVE SUMMARY
Economic growth is contingent upon the growth of steel industry. Consumption of steel is taken
to be an indicator of economic development. The greater the infrastructure growth of a country,
greater will be the consumption of steel.
The iron & steel industry in India is one of the important industries in the country from several
points of view. This sector, since independence has been focused as one of the basic sectors
which would contribute to the “development journey” of the country.
From a one million tonne capacity at the time of independence, the iron & steel industry has
come a long way and India has now risen to be the 4th
largest crude steel producer in the world 1
and the largest producer of sponge iron. From a negligible global presence, the Indian steel
industry is now globally acknowledged for its product quality.
The iron and steel industry presents one of the most energy intensive sectors within the Indian
economy and is therefore of particular interest in the context of energy, environment and
sustainable development discussions.
Iron & Steel industry account for 36 million MTOE, about 15% of Indian industrial energy
consumption. Under PAT scheme, there are 67 designated consumers, both from integrated steel
plants and sponge iron. They are mandated to improve their present energy efficiency levels and
save 1.4 million MTOE, accounting for about 22% of overall reduction anticipated from first PAT
cycle (ending FY 2014-15)
With this background, this Technology Compendium, which comprises of various technologies and
best practices to save energy, has been prepared. This compendium is expected to assist the
designated consumers to improve their energy efficiency levels and finally to achieve the targets
under PAT scheme.
However, implementation of these technologies calls for a sustained effort from the designated
consumers. Some of the technologies mentioned in this report are capital intensive and time
consuming to implement. But implementation of these projects can surely be beneficial.
1 World steel association

1 7 Technology Compendium on Energy Saving Opportunities – Iron & Steel
METHODOLOGY
Formation of Technical Advisory Committee
A core technical advisory committee was formed to assess the progress made in the sector.
Mr C S Gupta (formerly of RINL), T K Chakravaty (Steel Expert) ,Mr Prakash Bapat (Steel Expert) &
Mr Ramani Iyer (Forbes Marshall) constituted the advisory committee for iron & steel sector. The
advisory committee supported the project by assessing the findings of the project and providing
the necessary guidance.
Secondary Research
Secondary research formed an important activity in this project. Secondary research was
conducted for sectoral information, identification of international best practices and the major
technological advancement in the sector.
Annual report of Ministry of Steel, India, Energy Efficiency opportunities in iron & steel sector,
LBNL, Japanese Technologies for Energy Savings/GHG Emissions Reduction, NEDO, Energy
Efficiency opportunities in iron & steel sector, PCRA, Energy Transition For Industry: India And The
Global Context, IEA were the documents referred for the secondary research.
Stakeholder Interactions:
The compendium was sent to the stakeholders to get their views. The draft compendium was sent
to Dr Siddiqui (NEDO), Nippon Steel Engineering India, Mr Nimish Parikh (ESSAR Steel India
Limited), Mr J P N Singh (Energy Manager, TATA Steel), Mr M V Rao (Energy Manager, RINL), Mr C
P Sharma (Rourkela Steel Plant), Dr Mohanty (Torsteel Research Foundation India). The comments
received from them were incorporated into this report.
Review and Analysis:
All the information derived from the secondary research and stakeholder consultation phases
were studied and analyzed. The analyzed data was incorporated in the report.
1 8 Technology Compendium on Energy Saving Opportunities – Iron & Steel
1.0 INDIAN IRON & STEEL INDUSTRY
India had only three steel plants – the Tata Iron & Steel Company, the Indian Iron and Steel
Company and Visveswaraya Iron & Steel Ltd and a few electric arc furnace-based plants before
independence in the year 1947. However after independence the iron and steel industry saw an
exponential growth and has a strong global presence. India produces almost 5% of the world’s
total crude steel production1.
The iron & steel industry is dominated by the Government owned public sector undertaking (in
terms of no. of units) of SAIL, followed by the few other private sector players such as TATA steel,
Jindal, ESSAR & JSW.
India’s per capita consumption of steel is 56.3 Kg, compared to the world average of 220.8 Kg2.
The massive infrastructure growth as well as the growth in automobile & engineering sector is
expected to further accelerate its growth.
The basic hot metal production is predominantly through the blast furnace route in the large
integrated steel plants and through direct reduction route in the smaller sponge iron plants
distributed across the country.
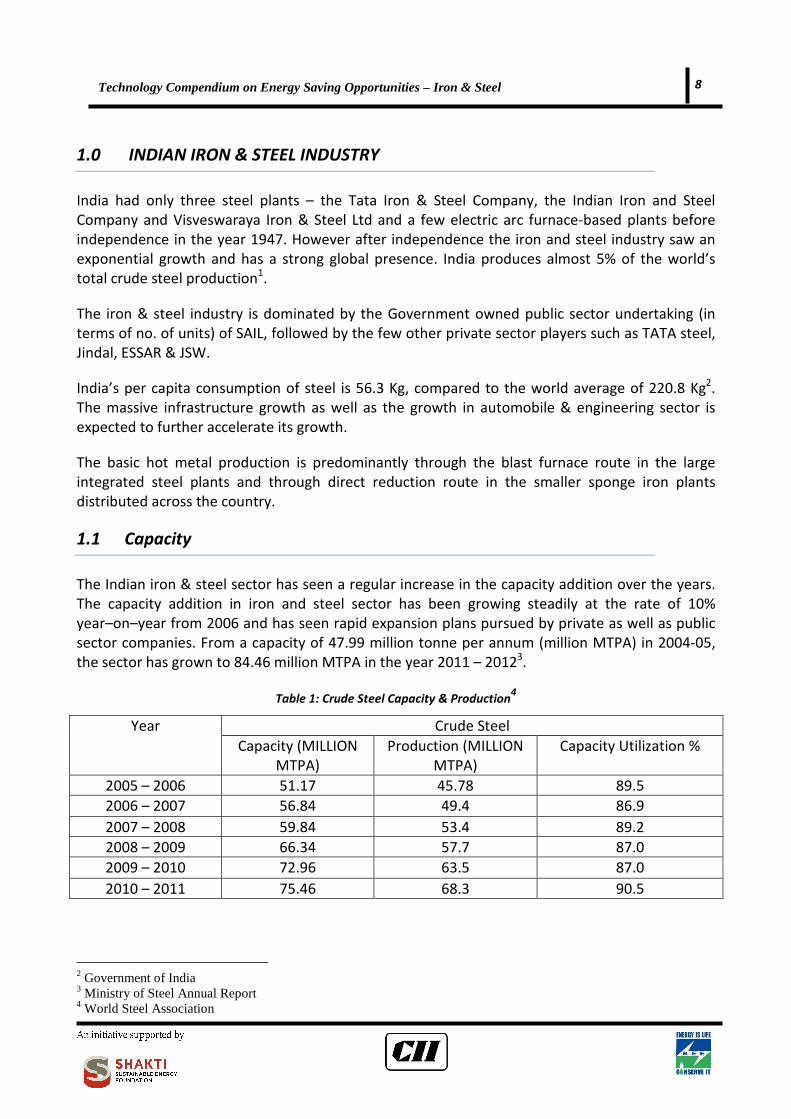
1.1 Capacity
The Indian iron & steel sector has seen a regular increase in the capacity addition over the years.
The capacity addition in iron and steel sector has been growing steadily at the rate of 10%
year–on–year from 2006 and has seen rapid expansion plans pursued by private as well as public
sector companies. From a capacity of 47.99 million tonne per annum (million MTPA) in 2004-05,
the sector has grown to 84.46 million MTPA in the year 2011 – 20123.
Table 1: Crude Steel Capacity & Production4
Crude Steel Year
Capacity (MILLION
MTPA)
Production (MILLION
MTPA)
Capacity Utilization %
2005 – 2006 51.17 45.78 89.5
2006 – 2007 56.84 49.4 86.9
2007 – 2008 59.84 53.4 89.2
2008 – 2009 66.34 57.7 87.0
2009 – 2010 72.96 63.5 87.0
2010 – 2011 75.46 68.3 90.5
2 Government of India 3 Ministry of Steel Annual Report 4 World Steel Association
1 9 Technology Compendium on Energy Saving Opportunities – Iron & Steel
Crude Steel Capacity & Production
0
10
20
30
40
50
60
70
80
2005 -2006
2006 -2007
2007 -2008
2008 -2009
2009 -2010
2010 -2011
Year
MT
PA Crude Steel Capacity (MTPA)
Crude Steel Production (MTPA)
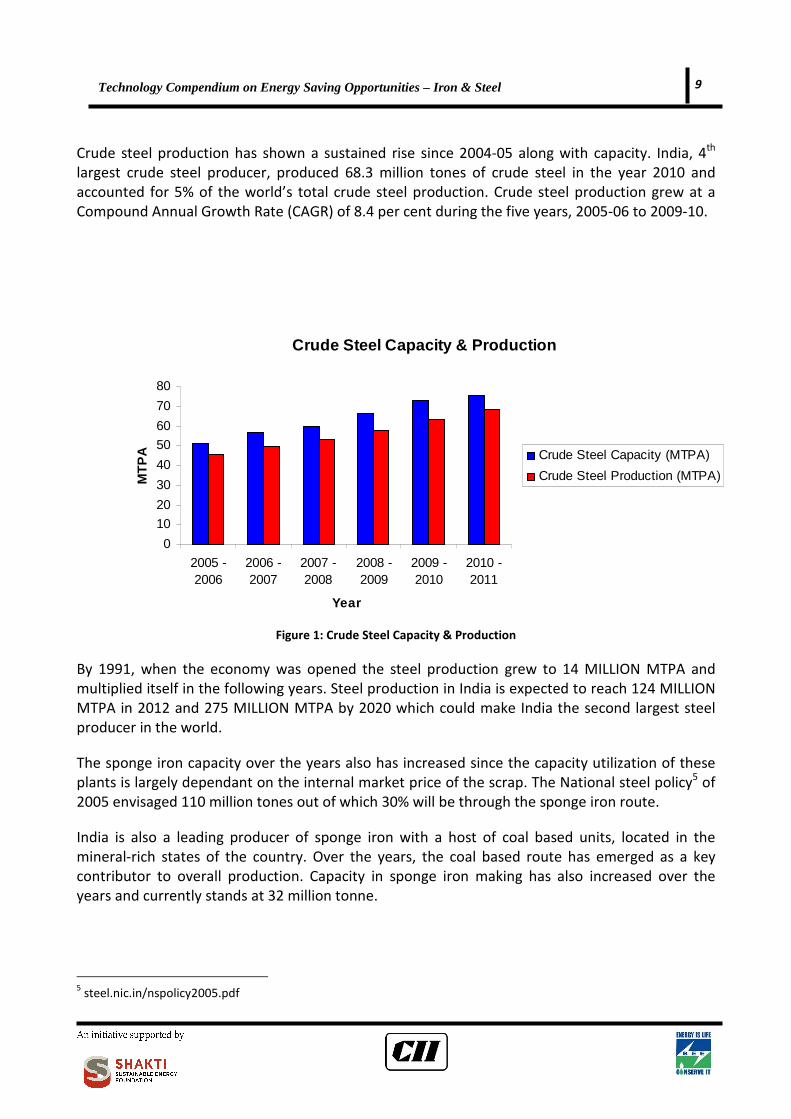
Crude steel production has shown a sustained rise since 2004-05 along with capacity. India, 4th
largest crude steel producer, produced 68.3 million tones of crude steel in the year 2010 and
accounted for 5% of the world’s total crude steel production. Crude steel production grew at a
Compound Annual Growth Rate (CAGR) of 8.4 per cent during the five years, 2005-06 to 2009-10.
Figure 1: Crude Steel Capacity & Production
By 1991, when the economy was opened the steel production grew to 14 MILLION MTPA and
multiplied itself in the following years. Steel production in India is expected to reach 124 MILLION
MTPA in 2012 and 275 MILLION MTPA by 2020 which could make India the second largest steel
producer in the world.
The sponge iron capacity over the years also has increased since the capacity utilization of these
plants is largely dependant on the internal market price of the scrap. The National steel policy5 of
2005 envisaged 110 million tones out of which 30% will be through the sponge iron route.
India is also a leading producer of sponge iron with a host of coal based units, located in the
mineral-rich states of the country. Over the years, the coal based route has emerged as a key
contributor to overall production. Capacity in sponge iron making has also increased over the
years and currently stands at 32 million tonne.
5 steel.nic.in/nspolicy2005.pdf
1 10 Technology Compendium on Energy Saving Opportunities – Iron & Steel
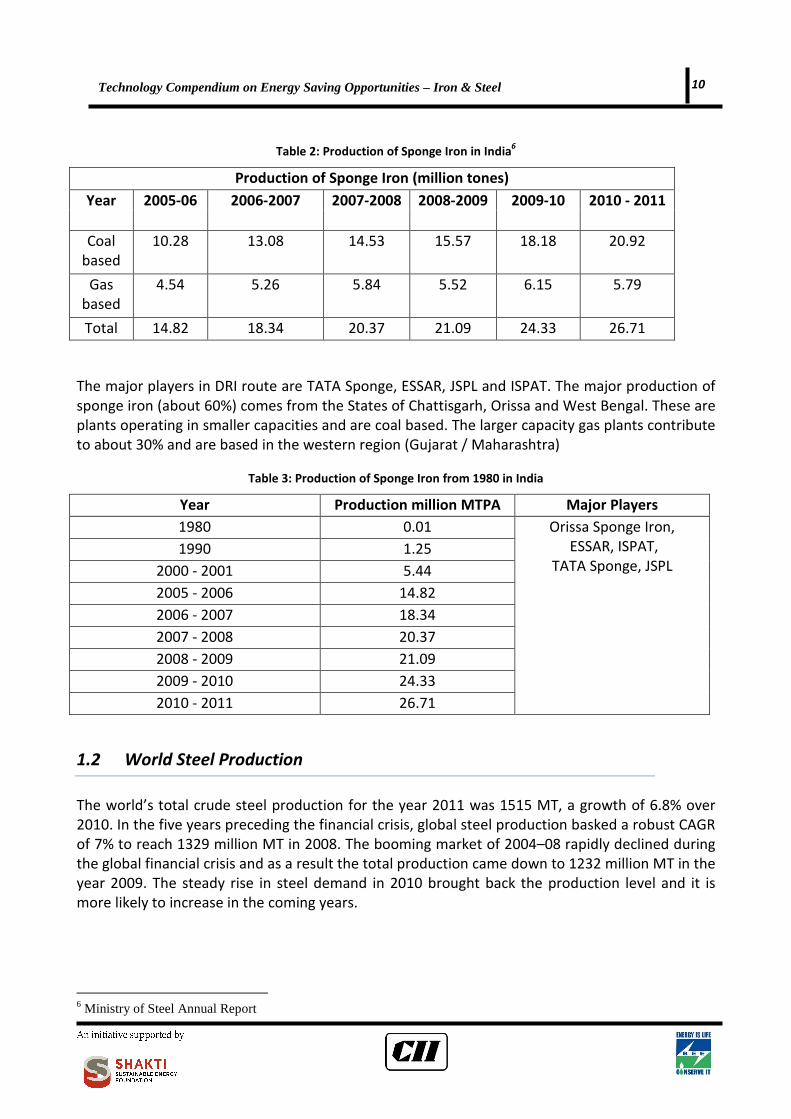
Table 2: Production of Sponge Iron in India6
Production of Sponge Iron (million tones)
Year 2005-06 2006-2007 2007-2008 2008-2009 2009-10 2010 - 2011
Coal
based
10.28 13.08 14.53 15.57 18.18 20.92
Gas
based
4.54 5.26 5.84 5.52 6.15 5.79
Total 14.82 18.34 20.37 21.09 24.33 26.71
The major players in DRI route are TATA Sponge, ESSAR, JSPL and ISPAT. The major production of
sponge iron (about 60%) comes from the States of Chattisgarh, Orissa and West Bengal. These are
plants operating in smaller capacities and are coal based. The larger capacity gas plants contribute
to about 30% and are based in the western region (Gujarat / Maharashtra)
Table 3: Production of Sponge Iron from 1980 in India
Year Production million MTPA Major Players
1980 0.01
1990 1.25
2000 - 2001 5.44
2005 - 2006 14.82
2006 - 2007 18.34
2007 - 2008 20.37
2008 - 2009 21.09
2009 - 2010 24.33
2010 - 2011 26.71
Orissa Sponge Iron,
ESSAR, ISPAT,
TATA Sponge, JSPL
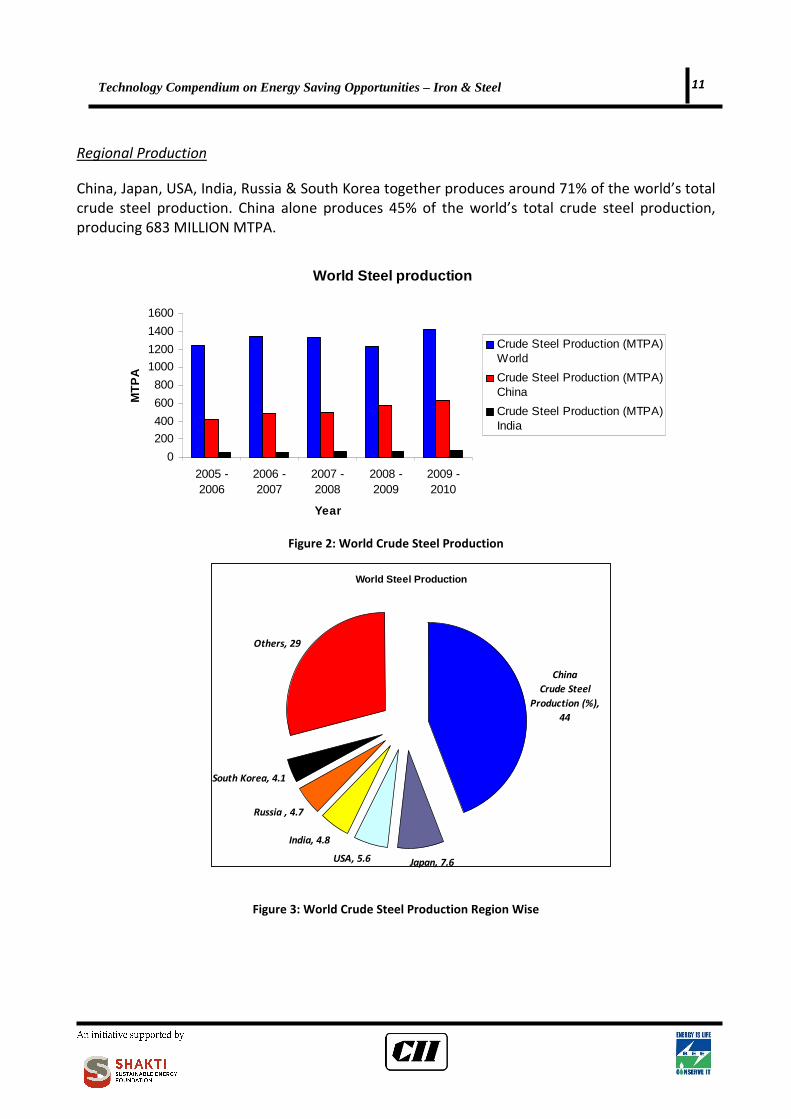
1.2 World Steel Production
The world’s total crude steel production for the year 2011 was 1515 MT, a growth of 6.8% over
2010. In the five years preceding the financial crisis, global steel production basked a robust CAGR
of 7% to reach 1329 million MT in 2008. The booming market of 2004–08 rapidly declined during
the global financial crisis and as a result the total production came down to 1232 million MT in the
year 2009. The steady rise in steel demand in 2010 brought back the production level and it is
more likely to increase in the coming years.
6 Ministry of Steel Annual Report
1 11 Technology Compendium on Energy Saving Opportunities – Iron & Steel
World Steel Production
China
Crude Steel
Production (%),
44
Japan, 7.6USA, 5.6
India, 4.8
Russia , 4.7
South Korea, 4.1
Others, 29
Regional Production
China, Japan, USA, India, Russia & South Korea together produces around 71% of the world’s total
crude steel production. China alone produces 45% of the world’s total crude steel production,
producing 683 MILLION MTPA.
World Steel production
0
200
400
600
800
1000
1200
1400
1600
2005 -2006
2006 -2007
2007 -2008
2008 -2009
2009 -2010
Year
MT
PA
Crude Steel Production (MTPA)World
Crude Steel Production (MTPA)China
Crude Steel Production (MTPA)India
Figure 2: World Crude Steel Production
Figure 3: World Crude Steel Production Region Wise
1 12 Technology Compendium on Energy Saving Opportunities – Iron & Steel
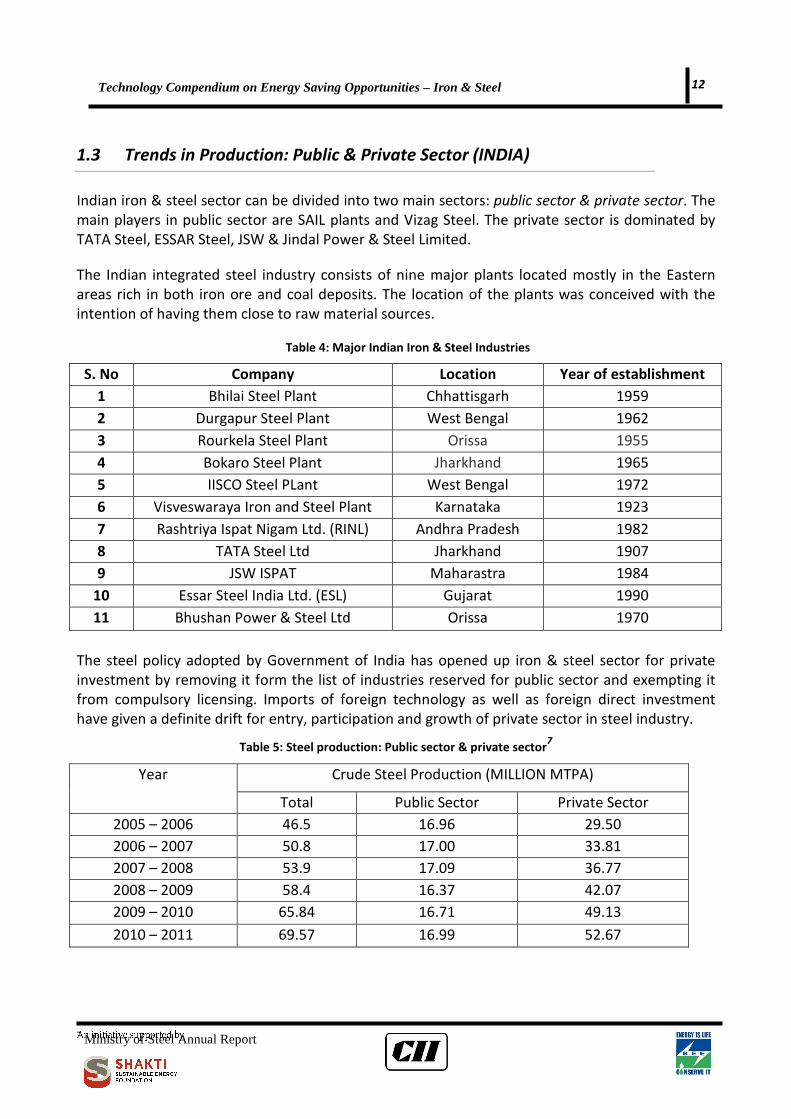
1.3 Trends in Production: Public & Private Sector (INDIA)
Indian iron & steel sector can be divided into two main sectors: public sector & private sector. The
main players in public sector are SAIL plants and Vizag Steel. The private sector is dominated by
TATA Steel, ESSAR Steel, JSW & Jindal Power & Steel Limited.
The Indian integrated steel industry consists of nine major plants located mostly in the Eastern
areas rich in both iron ore and coal deposits. The location of the plants was conceived with the
intention of having them close to raw material sources.
Table 4: Major Indian Iron & Steel Industries
S. No Company Location Year of establishment
1 Bhilai Steel Plant Chhattisgarh 1959
2 Durgapur Steel Plant West Bengal 1962
3 Rourkela Steel Plant Orissa 1955
4 Bokaro Steel Plant Jharkhand 1965
5 IISCO Steel PLant West Bengal 1972
6 Visveswaraya Iron and Steel Plant Karnataka 1923
7 Rashtriya Ispat Nigam Ltd. (RINL) Andhra Pradesh 1982
8 TATA Steel Ltd Jharkhand 1907
9 JSW ISPAT Maharastra 1984
10 Essar Steel India Ltd. (ESL) Gujarat 1990
11 Bhushan Power & Steel Ltd Orissa 1970
The steel policy adopted by Government of India has opened up iron & steel sector for private
investment by removing it form the list of industries reserved for public sector and exempting it
from compulsory licensing. Imports of foreign technology as well as foreign direct investment
have given a definite drift for entry, participation and growth of private sector in steel industry.
Table 5: Steel production: Public sector & private sector7
Crude Steel Production (MILLION MTPA) Year
Total Public Sector Private Sector
2005 – 2006 46.5 16.96 29.50
2006 – 2007 50.8 17.00 33.81
2007 – 2008 53.9 17.09 36.77
2008 – 2009 58.4 16.37 42.07
2009 – 2010 65.84 16.71 49.13
2010 – 2011 69.57 16.99 52.67
7 Ministry of Steel Annual Report

1 13 Technology Compendium on Energy Saving Opportunities – Iron & Steel
The percentage share of production from private sector units has been steadily increasing over
the years. This is because of the aggressive approach adopted by the private sector to constantly
increase its production capacity and to introduce new units.
Some of the key players in the Indian iron & steel sector have been a permanent feature in the list
of world’s top steel manufactures.
Table 6: Top Steel Producers8
World Rank Company Production (MILLION
MTPA)
7 Tata Steel (India) 23.2
18 SAIL 13.6
33 JSW Steel 6.4
35 Essar Steel (India) 6
46 RINL 3.2
The major share of the steel production in India is from the strong major players in the
industry. These major players constitute 77% of the total production of steel in India.
Table 7: Crude steel capacity of major Indian Steel Producers
Crude Steel Capacity (million tones) 2007 2008 2009 2010
Tata Steel (India) 5.0 5.0 6.8 6.8
Essar Steel (India) 4.6 4.6 4.6 4.6
Ispat, Dolvi 3.6 3.6 3.6 3.6
JSW Steel 3.8 3.8 3.8 7.8
RINL 3.5 3.5 3.5 3.5
JSPL 2.9 2.9 2.9 2.9
SAIL 13.8 13.8 13.8 13.8
Bhushan Steel 03 03 03 03
Bhushan Power & Steel 1.4 1.4 1.4 1.4
Others 17.9 20.9 25.6 28.1
8 World Steel Association
1 14 Technology Compendium on Energy Saving Opportunities – Iron & Steel
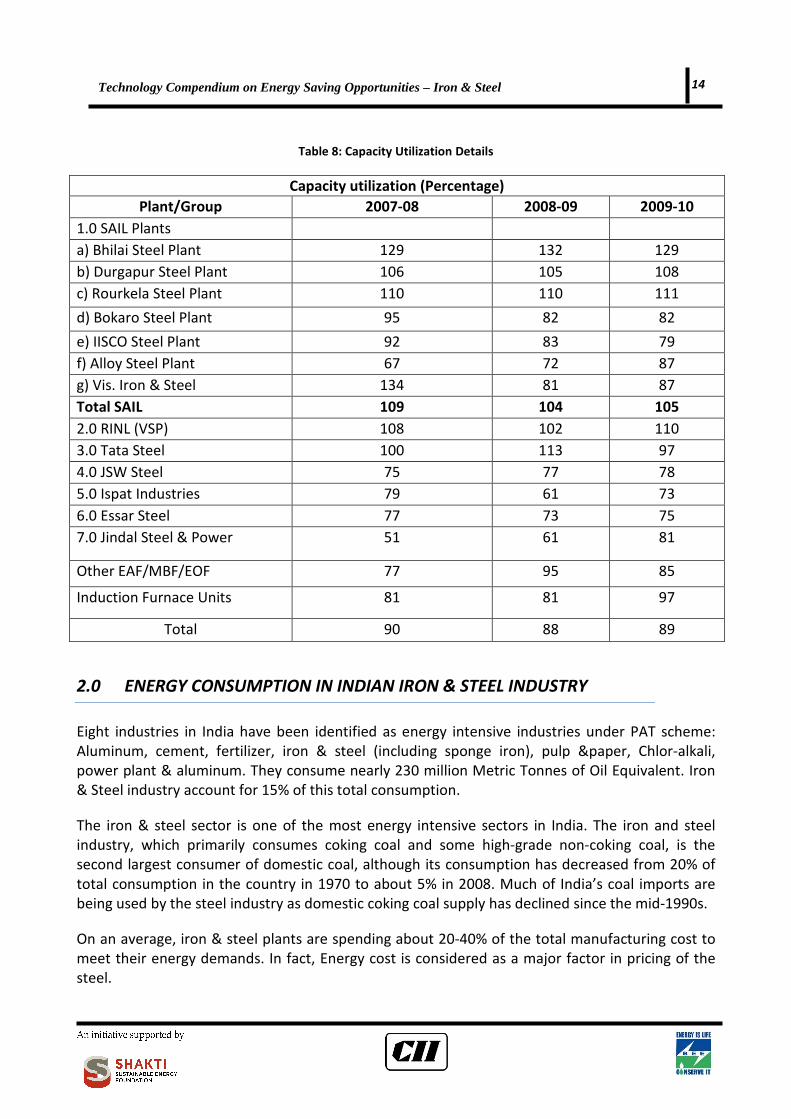
Table 8: Capacity Utilization Details
Capacity utilization (Percentage)
Plant/Group 2007-08 2008-09 2009-10
1.0 SAIL Plants
a) Bhilai Steel Plant 129 132 129
b) Durgapur Steel Plant 106 105 108
c) Rourkela Steel Plant 110 110 111
d) Bokaro Steel Plant 95 82 82
e) IISCO Steel Plant 92 83 79
f) Alloy Steel Plant 67 72 87
g) Vis. Iron & Steel 134 81 87
Total SAIL 109 104 105
2.0 RINL (VSP) 108 102 110
3.0 Tata Steel 100 113 97
4.0 JSW Steel 75 77 78
5.0 Ispat Industries 79 61 73
6.0 Essar Steel 77 73 75
7.0 Jindal Steel & Power 51 61 81
Other EAF/MBF/EOF 77 95 85
Induction Furnace Units 81 81 97
Total 90 88 89
2.0 ENERGY CONSUMPTION IN INDIAN IRON & STEEL INDUSTRY
Eight industries in India have been identified as energy intensive industries under PAT scheme:
Aluminum, cement, fertilizer, iron & steel (including sponge iron), pulp &paper, Chlor-alkali,
power plant & aluminum. They consume nearly 230 million Metric Tonnes of Oil Equivalent. Iron
& Steel industry account for 15% of this total consumption.
The iron & steel sector is one of the most energy intensive sectors in India. The iron and steel
industry, which primarily consumes coking coal and some high-grade non-coking coal, is the
second largest consumer of domestic coal, although its consumption has decreased from 20% of
total consumption in the country in 1970 to about 5% in 2008. Much of India’s coal imports are
being used by the steel industry as domestic coking coal supply has declined since the mid-1990s.
On an average, iron & steel plants are spending about 20-40% of the total manufacturing cost to
meet their energy demands. In fact, Energy cost is considered as a major factor in pricing of the
steel.
1 15 Technology Compendium on Energy Saving Opportunities – Iron & Steel
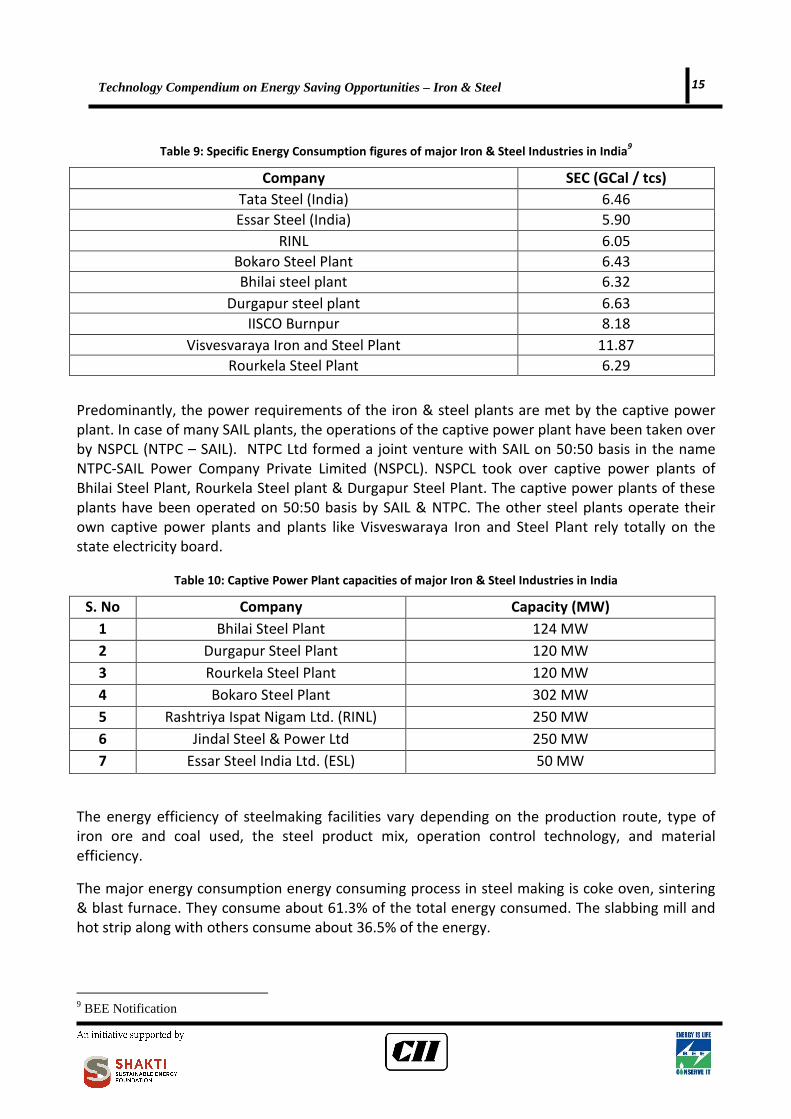
Table 9: Specific Energy Consumption figures of major Iron & Steel Industries in India9
Company SEC (GCal / tcs)
Tata Steel (India) 6.46
Essar Steel (India) 5.90
RINL 6.05
Bokaro Steel Plant 6.43
Bhilai steel plant 6.32
Durgapur steel plant 6.63
IISCO Burnpur 8.18
Visvesvaraya Iron and Steel Plant 11.87
Rourkela Steel Plant 6.29
Predominantly, the power requirements of the iron & steel plants are met by the captive power
plant. In case of many SAIL plants, the operations of the captive power plant have been taken over
by NSPCL (NTPC – SAIL). NTPC Ltd formed a joint venture with SAIL on 50:50 basis in the name
NTPC-SAIL Power Company Private Limited (NSPCL). NSPCL took over captive power plants of
Bhilai Steel Plant, Rourkela Steel plant & Durgapur Steel Plant. The captive power plants of these
plants have been operated on 50:50 basis by SAIL & NTPC. The other steel plants operate their
own captive power plants and plants like Visveswaraya Iron and Steel Plant rely totally on the
state electricity board.
Table 10: Captive Power Plant capacities of major Iron & Steel Industries in India
S. No Company Capacity (MW)
1 Bhilai Steel Plant 124 MW
2 Durgapur Steel Plant 120 MW
3 Rourkela Steel Plant 120 MW
4 Bokaro Steel Plant 302 MW
5 Rashtriya Ispat Nigam Ltd. (RINL) 250 MW
6 Jindal Steel & Power Ltd 250 MW
7 Essar Steel India Ltd. (ESL) 50 MW
The energy efficiency of steelmaking facilities vary depending on the production route, type of
iron ore and coal used, the steel product mix, operation control technology, and material
efficiency.
The major energy consumption energy consuming process in steel making is coke oven, sintering
& blast furnace. They consume about 61.3% of the total energy consumed. The slabbing mill and
hot strip along with others consume about 36.5% of the energy.
9 BEE Notification

1 16 Technology Compendium on Energy Saving Opportunities – Iron & Steel
Steel producing routes:
The integrated steelmaking route, based on the blast furnace (BF) and basic oxygen furnace (BOF),
uses raw materials including iron ore, coal, and limestone. On average, this route uses 1,400 kg of
iron ore, 770 kg of coal, 150 kg of limestone, and 120 kg of recycled steel to produce a tonne of
crude steel.
In BF – BOF route, energy is consumed in coke making, sintering, in blast furnace and for casting.
The electric arc furnace (EAF) route, based on the EAF, uses primarily recycled steels and/or direct
reduced iron (DRI) and electricity. On average, the recycled steel-EAF route uses 880 kg of
recycled steel, 150 kg of coal and 43 kg of limestone to produce a tonne of crude steel.
In the coal DRI – EAF route, energy is consumed as coal to produce sponge iron. Electricity is
consumed for steel making. Electricity is consumed in the electric arc furnace for steel making.
The process route-wise production of crude steel in the country during 2005-06, 2009-10 and
2010-11 are shown in the table below and indicates the emergence of the electric route of
production compared to the oxygen route:
Table 11: Production and share of different routes of crude steel in India10
Crude steel production by Process Route Percentage Share (%)
2005-06 2009-10 2010 - 11
Basic Oxygen Furnace (BOF) 52 45 45
Electric Arc Furnace (EAF) 18 24 23
Induction Furnace (IF) 30 31 32
Total 100 100 100
The specific energy consumption (SEC) of Indian steel plants ranges from 6.09 GCal/tcs (25.3
GJ/tcs) to 8.17 GCal/tcs (34.2 GJ/tcs) . On an average the SEC is 30 GJ/tcs in India which is almost
twice the world’s leading plants.
The variation in SEC among the steel plants is mainly because of different processes, quality of
coal, types of products and different energy efficiency levels.
2.1 Cost of Steel Making & Financial Strength
India is one of the most cost effective manufactures of steel in the world. The main reason behind
this is India houses one of the largest iron ore deposits in the world. India is one of the main
exporters of iron ore. The other reason behind cost effective production is that, labor cost
associated with steel production is very less in India.
10 Ministry of Steel Annual Report
1 17 Technology Compendium on Energy Saving Opportunities – Iron & Steel
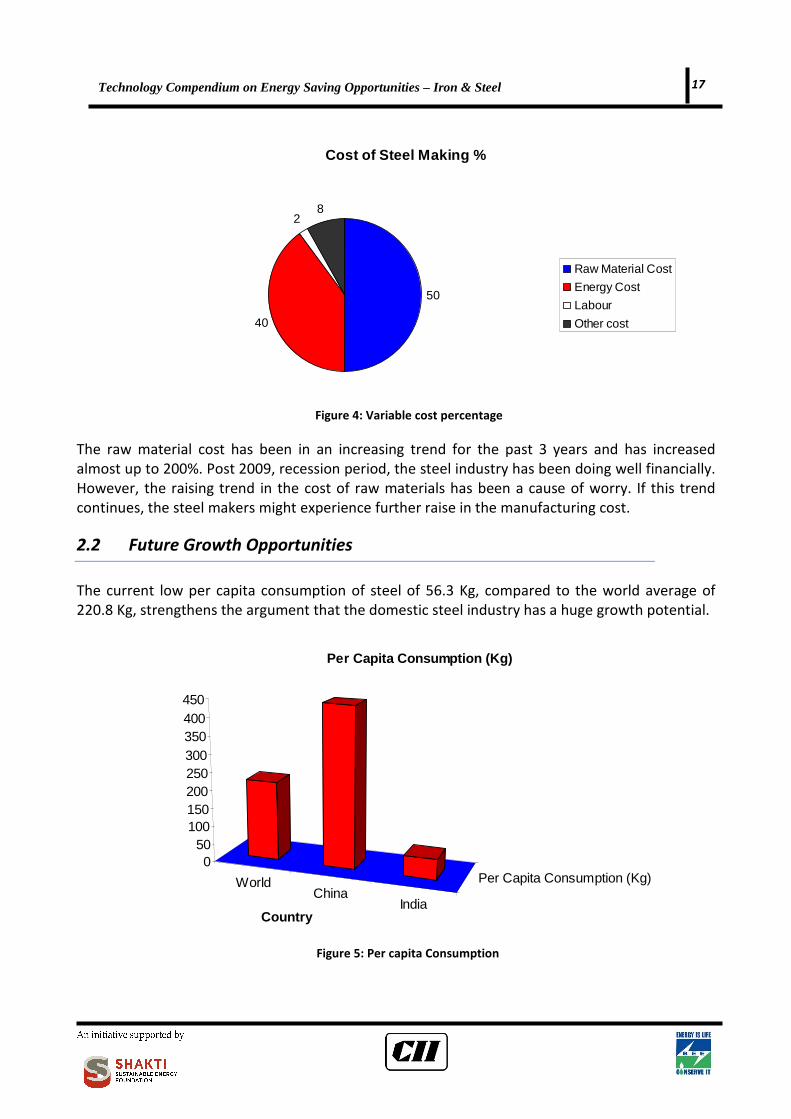
Cost of Steel Making %
50
40
28
Raw Material Cost
Energy Cost
Labour
Other cost
Figure 4: Variable cost percentage
The raw material cost has been in an increasing trend for the past 3 years and has increased
almost up to 200%. Post 2009, recession period, the steel industry has been doing well financially.
However, the raising trend in the cost of raw materials has been a cause of worry. If this trend
continues, the steel makers might experience further raise in the manufacturing cost.
2.2 Future Growth Opportunities
The current low per capita consumption of steel of 56.3 Kg, compared to the world average of
220.8 Kg, strengthens the argument that the domestic steel industry has a huge growth potential.
WorldChina
India
Per Capita Consumption (Kg)0
50100150200250300350400450
Country
Per Capita Consumption (Kg)
Figure 5: Per capita Consumption
1 18 Technology Compendium on Energy Saving Opportunities – Iron & Steel
India is heading to catch up with the world average of per capita income which will increase the
growth of the iron & steel sector. India’s GDP is constantly growing at the rate of 8 -9 % and to
sustain this growth rate India will require to invest heavily in infrastructure. This in turn will have a
positive effect in the growth of iron & steel sector.
The Indian steel industry has made significant progress in recent years backed by strong
fundamentals. Even during the economic slowdown, the industry succeeded in sustaining positive
growth, driven by strong domestic demand from the construction, automobile and infrastructure
sectors and export of steel from India is less which has shielded it from international market
fluctuations. The progress made by private sector players in brownfield expansions is significant.
There is much upside in per capita consumption of steel in the country from its low base of
around 56kg, with the increasing demand expected to lift per capita consumption to far higher
levels.
The growth projections by several agencies unanimously predict that there would be significant
growth in Indian steel industry. The projections by E&Y, IEA, CSE and CII are given below:
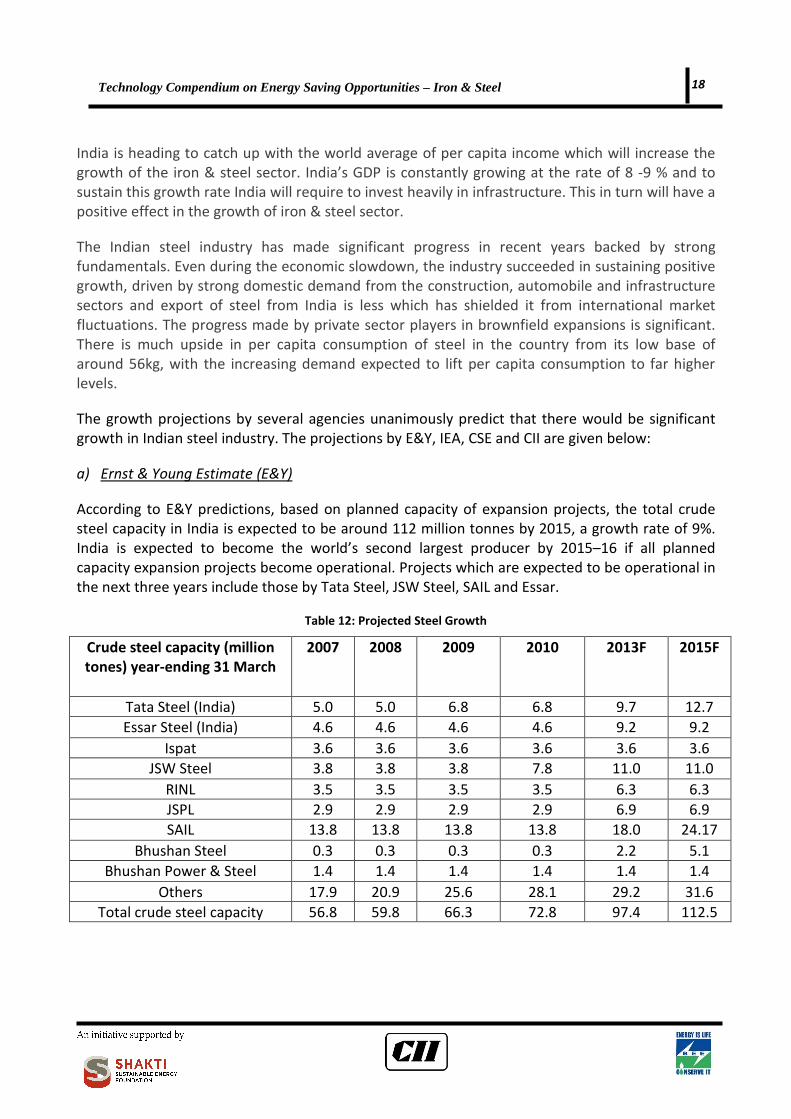
a) Ernst & Young Estimate (E&Y)
According to E&Y predictions, based on planned capacity of expansion projects, the total crude
steel capacity in India is expected to be around 112 million tonnes by 2015, a growth rate of 9%.
India is expected to become the world’s second largest producer by 2015–16 if all planned
capacity expansion projects become operational. Projects which are expected to be operational in
the next three years include those by Tata Steel, JSW Steel, SAIL and Essar.
Table 12: Projected Steel Growth
Crude steel capacity (million
tones) year-ending 31 March
2007 2008 2009 2010 2013F 2015F
Tata Steel (India) 5.0 5.0 6.8 6.8 9.7 12.7
Essar Steel (India) 4.6 4.6 4.6 4.6 9.2 9.2
Ispat 3.6 3.6 3.6 3.6 3.6 3.6
JSW Steel 3.8 3.8 3.8 7.8 11.0 11.0
RINL 3.5 3.5 3.5 3.5 6.3 6.3
JSPL 2.9 2.9 2.9 2.9 6.9 6.9
SAIL 13.8 13.8 13.8 13.8 18.0 24.17
Bhushan Steel 0.3 0.3 0.3 0.3 2.2 5.1
Bhushan Power & Steel 1.4 1.4 1.4 1.4 1.4 1.4
Others 17.9 20.9 25.6 28.1 29.2 31.6
Total crude steel capacity 56.8 59.8 66.3 72.8 97.4 112.5

1 19 Technology Compendium on Energy Saving Opportunities – Iron & Steel
b) IEA Estimate
International Energy Agency (IEA) has done a study on the Indian steel industry considering two
scenarios for a 2050 perspective. One is the Baseline Scenario which reflects the developments
that are expected on the basis of the energy policies that have been implemented or that have
been approved and are to be implemented. Second is the BLUE Scenario which is target-driven
and aims to achieve total emissions from the industry that are 28% lower in 2050 than the 2007
level. The BLUE Scenario, developed by the International Energy Agency, examines the least-cost
pathways for meeting the goal of reducing global energy-related CO2 emissions to 50% of 2005
levels by 2050 while also proposing measures to overcome technical and policy barriers. The BLUE
Scenario is consistent with a long-term global rise in temperatures of 2.0°C, but only if the
reduction in energy-related CO2 emissions is combined with deep cuts in other GHG emissions.
In each scenario considered, the demand of the steel under low and high demand is also taken
into consideration. Despite India’s strong growth in demand for steel in recent years, the 2007
consumption of 53 kg/cap is well below the global average of 220 kg/cap.
Table 13: Projected Steel Growth
2007 Baseline – 2050 BLUE - 2050
Low
demand
high
demand
Strong
growth
Low
demand
High
demand
Strong
growth
Crude steel
production
(million MT)
53 266 355 550 266 355 550
c) Centre for Science and Environment Estimate
The total steel production in India is expected to be around 300 million MILLION MTPA in the
year 2030 -31. The total production through BOF route is expected to grow to 90 million
MILLION MTPA in the year 2030 -31.
Figure 6: Green Rating Project 2009, Centre for Science and Environment, New Delhi

1 20 Technology Compendium on Energy Saving Opportunities – Iron & Steel
Growth Projection
67
158
374
0
50
100
150
200
250
300
350
400
2010 - 2011 2020 - 2021 2030 - 2031
Year
MT
PA
MTPAc
d) CII Growth Projection
CII’s growth projection is based on the assumption that the GDP of India will grow at the rate of
8% till 2030. It is also based on the fact that the steel consumption’s elasticity with respect to GDP
is 1.33%.
Elasticity of 1.33% is taken, considering the fact that steel industry growth has been 1.33% more
than that of GDP’s growth for a period of last ten years.
Assuming an elasticity of 1%, steel production will be:
� 2020 : 158 MILLION MTPA
� 2030 : 374 MILLION MTPA
Figure 7: CII Estimate on steel industry growth projection
Growth projections for sponge iron industry:
� Growth projection for the year 2020:
� Planning Commission Interim report : 45 million MTPA of crude steel
� CSE : 68 million MTPA of crude steel
� Growth projection for the year 2030:
� IEA : 79 million MTPA of crude steel
� CSE : 176 million MTPA of crude steel

1 21 Technology Compendium on Energy Saving Opportunities – Iron & Steel
Table 14: Growth projections of Indian Steel industry
2.3 Challenges Faced By the Iron & Steel Industry
Indian iron & steel faces some serious challenges which affect the energy efficiency of the
industry. Though certain problems can be solved by the industry itself, some factors are beyond
the control of the industry.
Factors which are beyond the control of the industry and which affects the energy efficiency to a
large extent are:
i. Low quality of iron ore
Higher alumina content in iron ore will reduce the productivity of blast furnace. Due to
higher alumina content, the quantity of slag produced will be higher and thus higher
quantity of ore has to be added for achieving same quantity of output. For every 1%
increase in alumina content, coke rate in BF increases by 20 – 25 kg/thm11
ii. Inferior quality of coal
Quality of coal, in terms of calorific value and ash percentage, available to iron & steel
industry is deteriorating by day which in turn decreases the energy efficiency of the
industry
iii. Scarcity of coking coal
The availability of coking coal is a key issue for the Indian steel industry. The scarcity of the
resource in the country will have a huge impact on the production target. Majority of the
coking coal is presently being imported. China continues to be the world leader in coking
coal production and consumption. China has imposed several regulations on the export of
coking coal in order to meet its ever growing domestic steel production. This has caused an
imbalance in the world’s coking coal market and this is also affecting the Indian steel
industry.
11 thm – tons of hot metal
Year
Growth Projections (million
MTPA)
2020 1) CSE - 143
2) CII - 158
2030 1) CSE - 302
2) CII - 374
2050 1) IEA - 550
1 22 Technology Compendium on Energy Saving Opportunities – Iron & Steel
iv. Raw material price volatility
The price of raw materials has become a major factor of concern for the Indian steel
producers. All the major steel producers in India are trying to secure raw material for their
future needs by acquiring mines or entering into joint ventures. Strict land acquisition laws
can slow the process. The volatility in price of raw materials has also increased the cost of
steel making.
The other factors which affect energy efficiency are detailed below.
v. Retrofitting
Projects like coke dry quenching, top pressure turbine and sinter bed heat recovery are
found to be suffering on account of space availability. Plants which do not have these
projects by design find it very difficult to retrofit within the available space. Therefore
retrofitting of these projects is almost non-existent in Indian steel plants.
vi. Vintage of the plants
Vintage of the plants has a key role in higher energy consumption of Indian steel plants.
Many of the public sector units are old plants with vintage technologies. Introduction of
new technologies in these plants proves to be very tedious and thus hindering the progress
of energy efficiency activities.
vii. Cost of energy efficiency
Any modification in the process for energy efficiency activities in steel plant is capital
intensive. Therefore, several plants are apprehensive to go ahead with energy efficiency
activities. The industrial lending rates of the banks are very high in India and thus the
Internal Rate of Return (IRR) is also high. This makes projects less attractive. In addition to
this, there are no separate funds available for energy efficiency activities.
2.4 Policies favouring energy activities:
i. Pollution Control Board’s stand on Coke Dry Quenching:
Jharkand, one of the states with several iron and steel plants in India, has made it
mandatory for all new installation of coke oven batteries to be with coke dry quenching.
Indian iron & steel industry is in the midst of an expansion stage. This ruling of the
pollution control board will force all new installations to be with CDQ. This may also
motivate the other steel intensive states to come out with a similar ruling and may make
the CDQ common in the Indian Iron and Steel industry.
1 23 Technology Compendium on Energy Saving Opportunities – Iron & Steel
ii. PAT Mechanism:
Under PAT mechanism all the designated consumer are required to reduce their energy
consumption by a certain percentage. This policy is sure to drive the energy efficiency
activities of the industry on a longer run.
2.5 Environmental Issued Faced by the Sector
Environmental protection in Iron & Steel plants is essentially linked to technology adopted for iron
& steel making, adoption of cleaner technologies and efficient disposal/re-use of generated bye-
products and waste.
Despite significant progress and intent by stake holders, environmental issues in Steel sector still
continue to be the focus of policy debates, legislation and regulation.
Issues prevalent in sector
� Air emissions include contributions from every stage of the process:
� Coke making is a major source of VOCs12
and carbon monoxide emissions
� Blast furnace iron making generates large quantities of sulfur and nitrogen oxides
and carbon monoxide
� Downstream processes such as casting and rolling account for significant releases
of sulfur oxides as sulfur is liberated from the metal surface
� Wastewater
� Wastewater from coke making has high contaminant levels, requiring extensive
removal and treatment before disposal.
� Wastewater generation from iron making, steelmaking, and downstream
processes, much of which results from cooling. water and from wet scrubbers, is
somewhat mitigated by significant rates of reuse and recycling
� Solid waste produced are of high quantity
� The sector is a very large consumer of energy, and as such is a major contributor to
greenhouse gas emissions.
12 Volatile Organic Compound

1 24 Technology Compendium on Energy Saving Opportunities – Iron & Steel
2.6 Energy Consumption Trends in Indian Steel Industry
India produces around 68.3 MT of crude steel per annum contributing 4% of the total world crude
steel production. Indian iron & steel industry has one of the highest SEC figures in the world.
Decline in Energy Consumption:
Historically, energy consumption is on the declining trend
� 1990 : 10 GCal / tcs
� 1995 : 8.69 GCal / tcs
� 2010 - 11 : 6.9 GCal / tcs
Historical Trend
0
2
4
6
8
10
12
1980 - 1995 - 2008 -
Year
GC
al/t
cs
SEC
Figure 8: Historical Trend13
From the historical data it can be decoded that the decline in the energy intensity has been in the
range of 2.5 percent annually. 1990’s saw a drastic increase in capacity addition and production in
the iron & steel industry. Majority of the addition came from the private sector. The private sector
went in with advanced technologies which reduced the energy consumption to a large extent. This
had a direct bearing on the SEC figures of the industry.
13 SAIL Presentation

1 25 Technology Compendium on Energy Saving Opportunities – Iron & Steel
3.0 MAPPING STAKE HOLDER INITIATIVES
Indian iron & steel industry contributes 4% of the total steel produced in the world and are
considered to be the next biggest thing in world steel industry. However, the energy efficiency
levels of the Indian steel industry are low compared to its global counter parts.
Several initiatives have been taken by the sector by itself in terms of energy efficiency and GHG
emission reduction opportunities. In case of integrated steel plants, there has been a continuous
interaction among the plants and the best practices are being shared throughout the sector.
However, what the sector as a whole lacks is the support from external agencies in terms of
mitigation opportunities. The cost of mitigation in steel industry has traditionally been very high
and assistance from the external agencies in terms of financial and technical help would be highly
appreciated. External agencies can help the industry in terms of technology transfer, cross
pollination of ideas, financial and technical aid.
There exists a contrary scenario in the case of sponge iron plants. Most of the sponge iron plants
in India are entrepreneur style and the interactions within the sector is very low. Best practices in
the sector are not shared, expect for a very few cases like waste heat recovery from kiln.
Awareness creation and energy efficiency financing in this sector would be highly appreciated.
This section deals with various stake holders and their initiatives in iron and steel sector
International agencies actively participating in efficiency improvements
� NEDO : New Energy and Industrial Technology Development Organization, Japan
� APP : Asia Pacific Partnership
� UNIDO : United Nations Industrial Development Organization
� IFC : International Financial Corporation
� WSA : World Steel Association
National agencies in efficiency improvement of steel industry
� Ministry of Steel
� BEE : Bureau of Energy Efficiency
� Perform Achieve and Trade
� JPC : Joint Plant Committee, Government of India
� CII : Confederation of Indian Industry

1 26 Technology Compendium on Energy Saving Opportunities – Iron & Steel
a) NEDO: New Energy and Industrial Technology Development Organization
NEDO is one of the most active players in the Indian iron and steel industry. NEDO has
helped in implementation of several energy saving measures in Indian steel plant.
NEDO's Role
� Promotion of research and development of energy, environmental and industrial
technologies as well as acquisition of emission reduction credits through the Kyoto
Mechanisms.
� Development, demonstration and introduction of promising technologies that private sector
enterprises cannot transfer to the practical application stage by themselves due to the high
risk and long development period required.
� Efficient project management making the best use of the R&D capabilities and know-how of
industry, academia and government.
NEDO’s projects in India
� Coke dry quenching and waste gas recovery from hot stove for TATA Steel, Jhamshedpur
� Waste heat recovery from sinter bed
� Projected power generation is 20 MW
The mode of operation of NEDO is that technology and all the equipment necessary to set up an
energy saving measure would be given to the plant by NEDO. The expenses of installation have to
be borne by the plant.
b) Asia Pacific Partnership
The Asia-Pacific Partnership on Clean Development and Climate is an innovative new effort to
accelerate the development and deployment of clean energy technologies. It is an International
public-private partnership among Australia, Canada, India, Japan, China, South Korea and the
United States.
The partnership aimed at deployment of best available technologies, practices and environmental
management systems in partnership countries.
c) UNIDO
UNIDO is a specialized agency of United Nations which supports industrial development for
inclusive globalization and environmental sustainability.

1 27 Technology Compendium on Energy Saving Opportunities – Iron & Steel
UNIDO’s mandate is to promote and accelerate sustainable industrial development in developing
countries and economies in transition. UNIDO promotes sustainable patterns of industrial
consumption and production.
As a leading provider of services for improved industrial energy efficiency and sustainability,
UNIDO assists developing countries and transition economies in implementing multilateral
environmental agreements and in simultaneously reaching their economic and environmental
goals
d) IFC
IFC, a member of the World Bank Group, is the largest global development institution focused
exclusively on the private sector in developing countries.
IFC aim to increase investments in the efficient use of energy, water, and materials leading to
reduced costs for businesses, less waste and measurable reductions in greenhouse gas emissions.
IFC supports development of profitable and environmentally sound projects, business models, and
sector wide engagements to change market behavior and support more environmentally
sustainable, low carbon economic growth.
IFC’s projects in India
IFC has funded Kalyani Gerdau Steels, India for the waste heat recovery project from coke oven
e) WSA
The World Steel Association is one of the largest industry associations in the world. WSA members
produce around 85% of the world's steel.
WSA acts as the focal point for the steel industry, providing global leadership on all major strategic
issues affecting the industry, particularly focusing on economic, environmental and social
sustainability.
WSA has recently launched CO2 Breakthrough Program which creates a platform for exchanging
information on innovative technologies
f) Confederation of Indian Industry (CII)
CII is a non-government, not-for-profit, industry led and industry managed organization founded
over 117 years ago plays a proactive role in India's development process. It works to create and
sustain an environment conducive to the growth of industry in India, partnering industry and
government alike through advisory and consultative processes. It plays a proactive role in
promoting the Latest Technologies, Energy Efficiency and GHG inventorisation in the Indian
industry.

1 28 Technology Compendium on Energy Saving Opportunities – Iron & Steel
CII is actively involved in promoting energy efficiency improvement in Indian Iron & Steel industry.
CII National Committee on Steel is represented by all segments of Steel and its allied industries
across India. “Steel Summit” is an annual event which is organized under the aegis of CII National
Committed on Steel in partnership with the Government of India, which discusses and deliberates
on issues pertaining to the Steel Industry and makes recommendations to the Government.
g) Ministry of Steel
Ministry of steel plans and coordinates the growth and development of steel industry in both
public and private sector. Ministry of steel formulates policies in the areas of:
� Pricing & production
� Import and export of iron and steel
Ministry of steel works relentlessly to make steel industry to be the most sustainable industry in
India and aligns policies to transform India into leader in Steel sector
h) BEE & Perform Achieve & Trade
Perform Achieve, and Trade (PAT), a market-based mechanism to make improvements in energy
efficiency in energy-intensive large industries and facilities more cost-effective by certification of
energy savings that could be traded.
The PAT scheme is expected to act as a catalyst for all the energy efficiency activities in India.
Under PAT mechanism all the designated consumer are required to reduce their energy
consumption by certain percentage. This policy is sure to drive the energy efficiency activities of
the industry on a longer run.
i) Joint plant committee
JPC was constituted by the Government of India to formulate guidelines for the production,
allocation, costing and supply of iron and steel materials. JPC has a comprehensive and impartial
data bank on the industry.

1 29 Technology Compendium on Energy Saving Opportunities – Iron & Steel
4.0 ACTION PLAN FOR ENERGY EFFICIENY
Present Status
Indian steel industry is one of the oldest industries in India. Several integrated iron & steel
industry are almost 40 – 50 years old.
Newer technology adoption has taken longer time in steel industry as compared to other
industries. Traditionally, Indian steel industries have been in plug and forget approach. For
example, in some integrated steel plants, Russian technologies installed during installation stage
of the plant are still in operation.
Around 60% of the plants are public sector plants. Though energy Efficiency in design is adopted in
certain cases, further energy efficient activities are time consuming. Energy efficiency activities
are not moving at the desired pace.
The following are some of the main factors affecting the energy efficiency activities in Indian iron
& steel industry.
Reasons for high operating SEC:
� Inferior raw material
� High alumina and silica content in iron ore
� Poor quality of coal
� Vintage of plants
� Most plants operate outdated technologies
� Mostly set up in 60s – 70s
� Problems in retrofitting
� Reluctant to go for higher technology because of higher investments
� Lower levels of recycling
� Life of steel in India is high

1 30 Technology Compendium on Energy Saving Opportunities – Iron & Steel
Approach for Energy Efficiency:
The Sector activities should be focus on:
� Reducing gap between present Indian and global average SEC figures
� Indian plants : 6.9 GCal/tcs
� World average : 4.5 GCal/tcs
� System driven energy efficiency activities
• ISO 50001
� Equipment level efficiency improvement
� Complete recovery of waste heat from furnaces, coke oven & sinter plants
� Higher level of technological adoption throughout the sector
� Complete utilization of waste heat recovery in sponge iron plants
From the SEC figures mentioned above, it is very clear that the opportunities for energy savings
are very high.
Perform, Achieve & Trade Act (PAT):
Under PAT mechanism all the designated consumer are required to reduce their energy
consumption by certain percentage. This policy is sure to drive the energy efficiency activities of
the industry on a longer run.
Iron & Steel industry account for 36 million MTOE about 15% of Indian industrial energy
consumption. Mmajority of the iron & steel industry has started taking initiatives in identifying the
best ways of achieving and exceeding the PAT targets set by BEE. The minimum and maximum
targets set for the iron & a steel industry is given below.

1 31 Technology Compendium on Energy Saving Opportunities – Iron & Steel
Table 15: PAT Target for Iron & Steel Sector
The target has been given to each of the designated consumers (67 in total) and total iron and
steel sector has target of reducing 1.48 million MTOE14
.
Steel making: Major Sections
There are five major sections in an integrated steel plant. They are:
� Iron ore preparation - Sinter making
� Coke making
� Iron making - Blast furnace
� Steel making - Basic oxygen furnace
� Casting
Figure 9: Iron & Steel Process
14 BEE Notification
Sector Minimum Target (%) Maximum Target (%)
Iron & Steel 2.52 9.07

1 32 Technology Compendium on Energy Saving Opportunities – Iron & Steel
4.1 Energy Efficiency Options for Indian Iron & Steel Industry
List of Energy Efficiency Projects
The reduction opportunities in each of the section are mentioned below:
� Sinter Making
� Improvement in segregated charging of sintering materials
� Exhaust heat recovery system for sintered ore cooling
� Sensible heat recovery from main exhaust gas of sintering machine
� Arresting air leakages in Sinter plant
� Coke Making
� Coal moisture control
� Optimizing efficiency of ovens by arresting air leakages
� Variable speed drives for coke oven gas compressors
� Iron Making
� Preheating through waste heat recovery from Hot stoves of Blast Furnace
� Computer-aided Hot stove operation for optimization of BF gas
� SNORT valve operation
� Blast furnace optimization via modeling using CFD
� BOF Steel Making
� BOF gas and Sensible heat recovery
� Secondary Steel Making
� Energy saving operation of electric arc furnace
� CoJet (Coherent Jet Gas Injection Technology)

1 33 Technology Compendium on Energy Saving Opportunities – Iron & Steel
� Casting
� Adoption of continuous casting
� Thin slab casting
� Efficient ladle preheating
� Heat balance of Furnace
� Hot Rolling
� Hot charging and direct rolling mill
� Waste heat recovery from cooling water
� Cold Rolling and Finishing
� Heat recovery from Annealing line
� Reduced Steam use in Pickling line
� ‘Convectional’ heating type heat treatment furnace of wire rod coil
� Low temperature forge welded pipe production method
� Others
� VFD for coke oven gas compressors
� VFD for ventilation fans
� Oxygen level control and variable speed drives for combustion air fans
� Waste heat recovery from sponge iron kilns
� Descaling pump (conversion to plunger pump)
� Preventive maintenance, energy monitoring and management system

1 34 Technology Compendium on Energy Saving Opportunities – Iron & Steel
List of Best Available Technologies (BATs) for Iron & Steel
� Sinter Making
� Multi – slit burner for sinter furnace
� Coke Making
� Coke dry quenching (CDQ)
� Automatic combustion control for coke ovens
� Iron Making
� Top pressure recovery turbine (TRT) for BF top gas
� Pulverized coal injection (PCI) system for BF
� Others
� Recuperative burner
1 35 Technology Compendium on Energy Saving Opportunities – Iron & Steel
Technology No.1
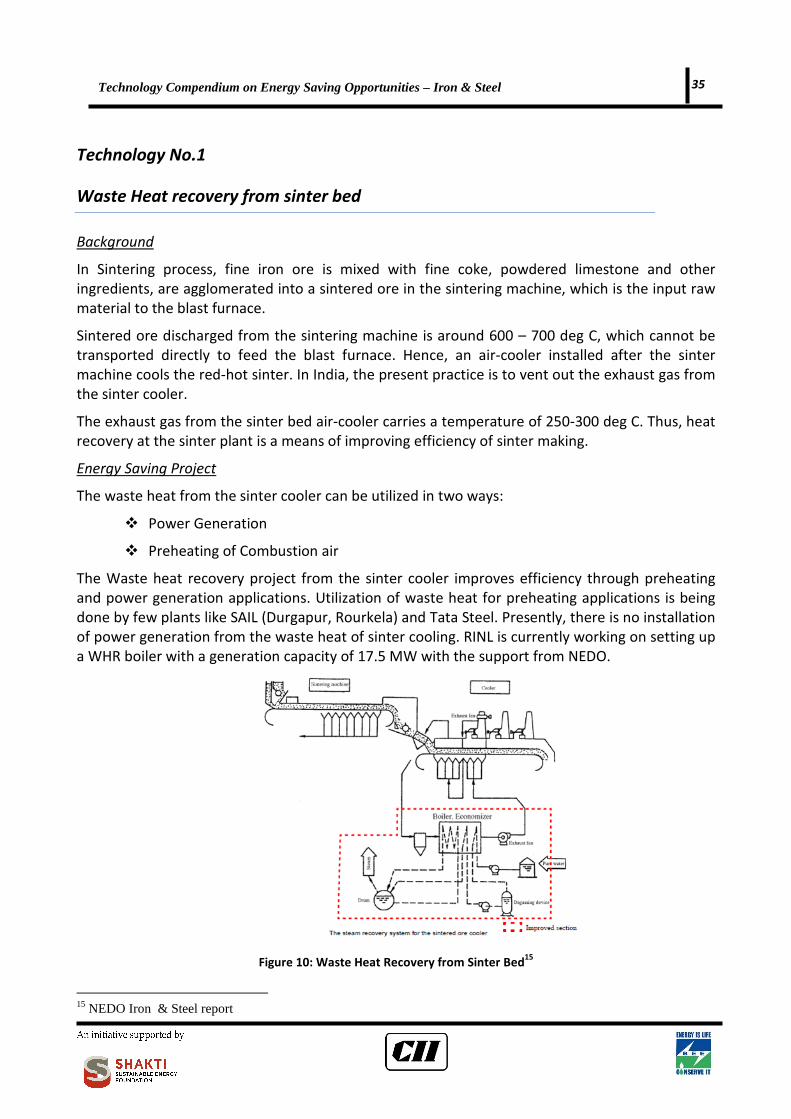
Waste Heat recovery from sinter bed
Background
In Sintering process, fine iron ore is mixed with fine coke, powdered limestone and other
ingredients, are agglomerated into a sintered ore in the sintering machine, which is the input raw
material to the blast furnace.
Sintered ore discharged from the sintering machine is around 600 – 700 deg C, which cannot be
transported directly to feed the blast furnace. Hence, an air-cooler installed after the sinter
machine cools the red-hot sinter. In India, the present practice is to vent out the exhaust gas from
the sinter cooler.
The exhaust gas from the sinter bed air-cooler carries a temperature of 250-300 deg C. Thus, heat
recovery at the sinter plant is a means of improving efficiency of sinter making.
Energy Saving Project
The waste heat from the sinter cooler can be utilized in two ways:
� Power Generation
� Preheating of Combustion air
The Waste heat recovery project from the sinter cooler improves efficiency through preheating
and power generation applications. Utilization of waste heat for preheating applications is being
done by few plants like SAIL (Durgapur, Rourkela) and Tata Steel. Presently, there is no installation
of power generation from the waste heat of sinter cooling. RINL is currently working on setting up
a WHR boiler with a generation capacity of 17.5 MW with the support from NEDO.
Figure 10: Waste Heat Recovery from Sinter Bed15
15 NEDO Iron & Steel report

1 36 Technology Compendium on Energy Saving Opportunities – Iron & Steel
Barriers in Implementing
� High Investment cost for installing power generation plant
� Space availability for installing waste heat recovery boiler in existing plants
Cost Benefit Analysis
Reference Plant (1 MILLION MTPA)
Without PAT With PAT benefit
Energy savings Rs. 33.60 million Rs. 33.60 million
MTOE equivalent 2800 2800
PAT benefit16
-- Rs. 28.00 million
Total benefit Rs. 4.88 million Rs. 61.60 million
Investment Rs. 134.4 million Rs. 134.40 million
Payback period 48 months 26 months
Replication Potential
Saving potential 0.028 GCal / tcs17
Number of plants 95% of the plants
Sector savings 150000 Mtoe
16 PAT benefits calculated based on the MTOE Savings. One MTOE equals Rs.10154 for the year
2011-12 as per the PAT notification. Refer Annexure 2 for detailed calculation. 17 Energy Efficiency and Carbon Dioxide Emissions Reduction Opportunities in the Iron and Steel Sector
– LBNL
1 37 Technology Compendium on Energy Saving Opportunities – Iron & Steel
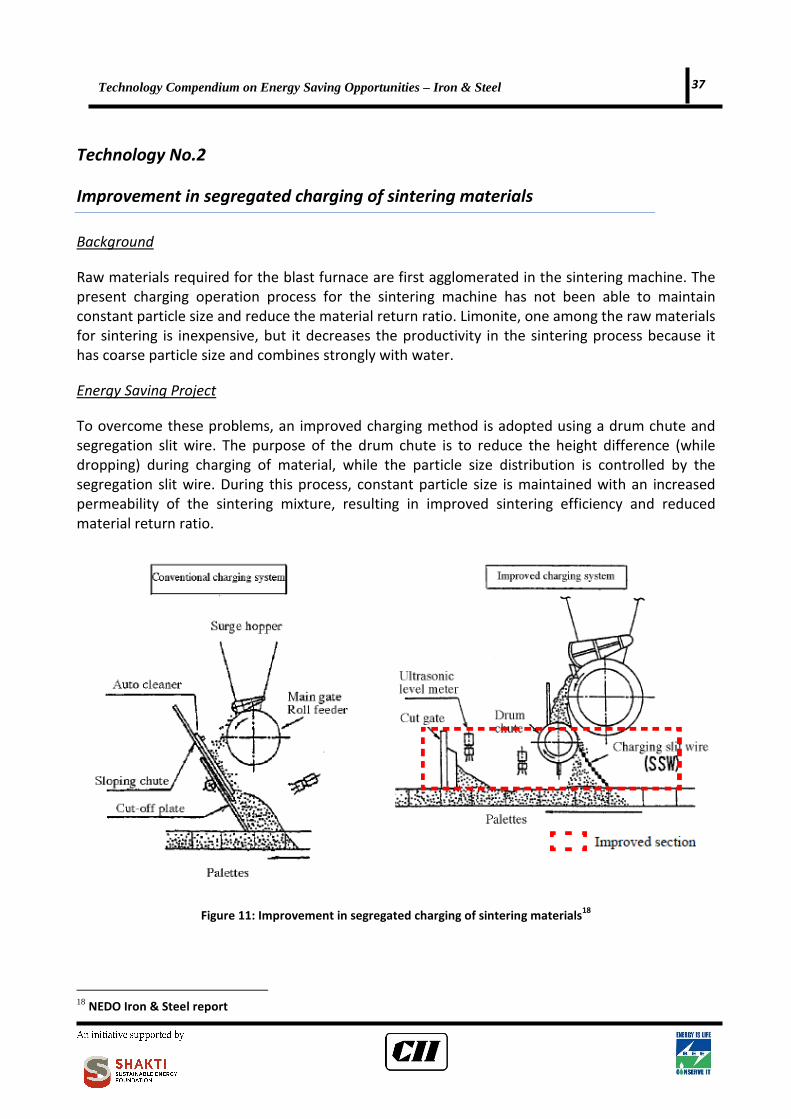
Technology No.2
Improvement in segregated charging of sintering materials
Background
Raw materials required for the blast furnace are first agglomerated in the sintering machine. The
present charging operation process for the sintering machine has not been able to maintain
constant particle size and reduce the material return ratio. Limonite, one among the raw materials
for sintering is inexpensive, but it decreases the productivity in the sintering process because it
has coarse particle size and combines strongly with water.
Energy Saving Project
To overcome these problems, an improved charging method is adopted using a drum chute and
segregation slit wire. The purpose of the drum chute is to reduce the height difference (while
dropping) during charging of material, while the particle size distribution is controlled by the
segregation slit wire. During this process, constant particle size is maintained with an increased
permeability of the sintering mixture, resulting in improved sintering efficiency and reduced
material return ratio.
Figure 11: Improvement in segregated charging of sintering materials18
18 NEDO Iron & Steel report
1 38 Technology Compendium on Energy Saving Opportunities – Iron & Steel
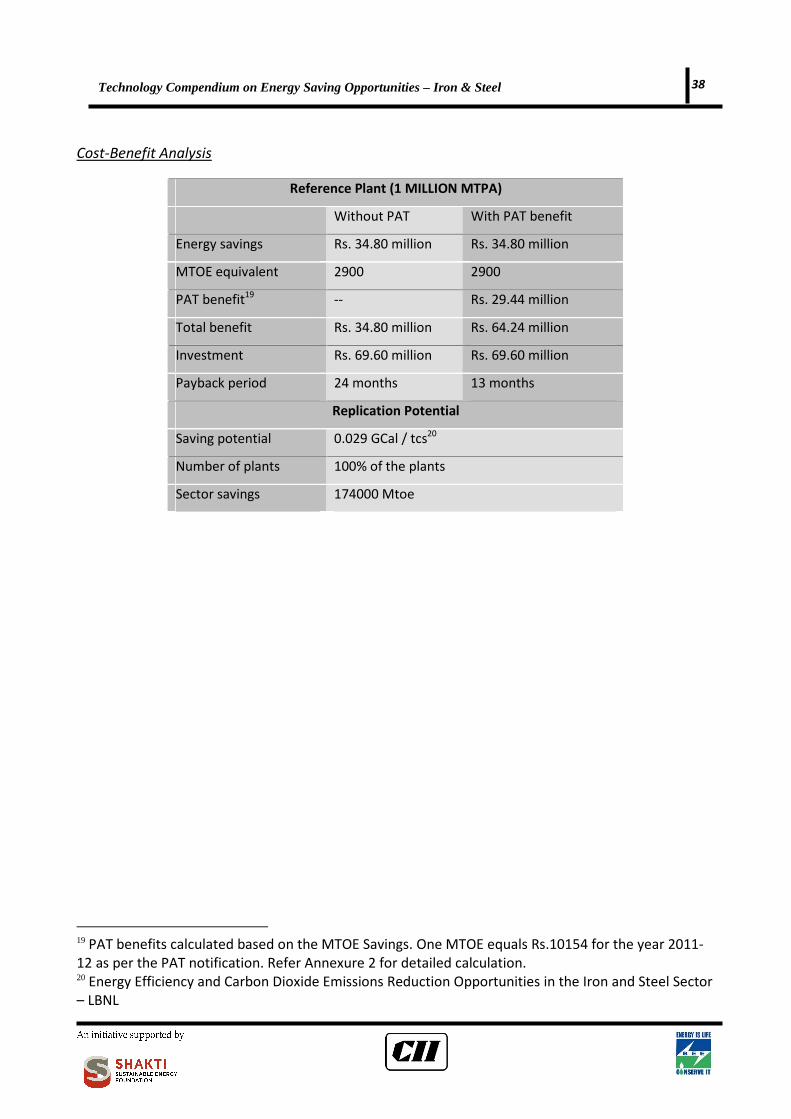
Cost-Benefit Analysis
Reference Plant (1 MILLION MTPA)
Without PAT With PAT benefit
Energy savings Rs. 34.80 million Rs. 34.80 million
MTOE equivalent 2900 2900
PAT benefit19
-- Rs. 29.44 million
Total benefit Rs. 34.80 million Rs. 64.24 million
Investment Rs. 69.60 million Rs. 69.60 million
Payback period 24 months 13 months
Replication Potential
Saving potential 0.029 GCal / tcs20
Number of plants 100% of the plants
Sector savings 174000 Mtoe
19 PAT benefits calculated based on the MTOE Savings. One MTOE equals Rs.10154 for the year 2011-
12 as per the PAT notification. Refer Annexure 2 for detailed calculation. 20 Energy Efficiency and Carbon Dioxide Emissions Reduction Opportunities in the Iron and Steel Sector
– LBNL
1 39 Technology Compendium on Energy Saving Opportunities – Iron & Steel
Technology No.3
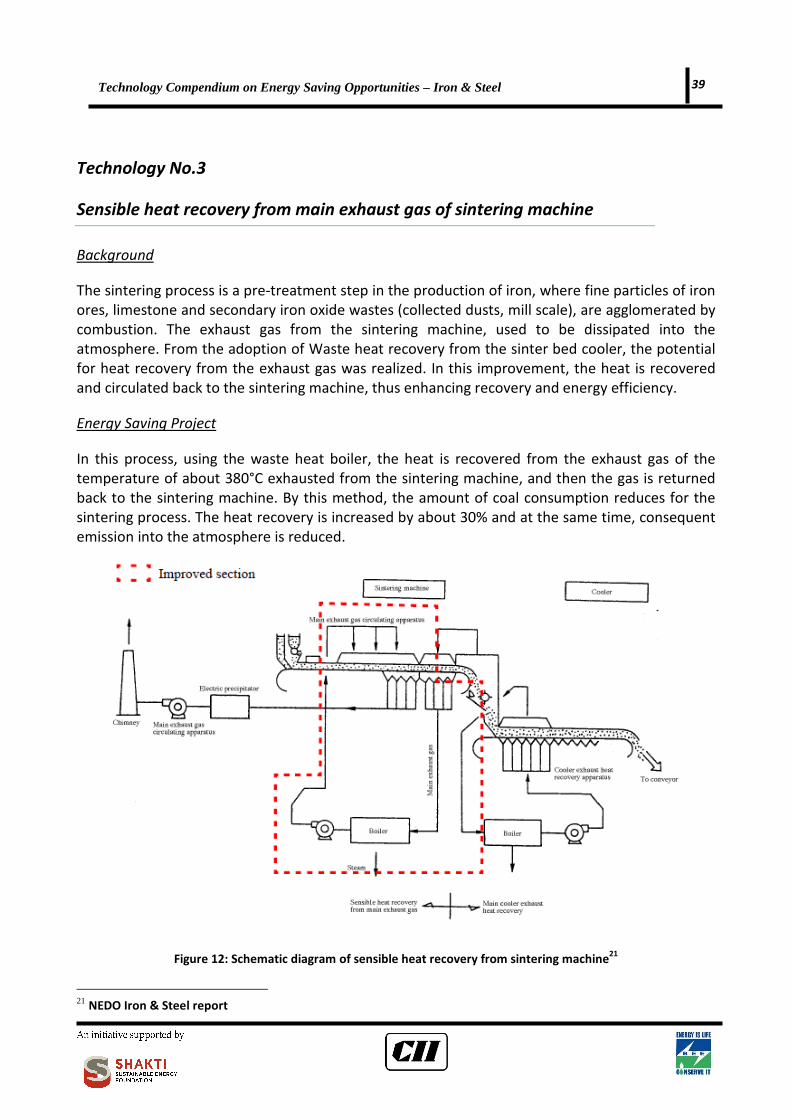
Sensible heat recovery from main exhaust gas of sintering machine
Background
The sintering process is a pre-treatment step in the production of iron, where fine particles of iron
ores, limestone and secondary iron oxide wastes (collected dusts, mill scale), are agglomerated by
combustion. The exhaust gas from the sintering machine, used to be dissipated into the
atmosphere. From the adoption of Waste heat recovery from the sinter bed cooler, the potential
for heat recovery from the exhaust gas was realized. In this improvement, the heat is recovered
and circulated back to the sintering machine, thus enhancing recovery and energy efficiency.
Energy Saving Project
In this process, using the waste heat boiler, the heat is recovered from the exhaust gas of the
temperature of about 380°C exhausted from the sintering machine, and then the gas is returned
back to the sintering machine. By this method, the amount of coal consumption reduces for the
sintering process. The heat recovery is increased by about 30% and at the same time, consequent
emission into the atmosphere is reduced.
Figure 12: Schematic diagram of sensible heat recovery from sintering machine21
21 NEDO Iron & Steel report

1 40 Technology Compendium on Energy Saving Opportunities – Iron & Steel
Cost-Benefit Analysis
Reference Plant (1 MILLION MTPA)
Without PAT With PAT benefit
Energy savings Rs. 45.00 million Rs. 45.00 million
MTOE equivalent 4500 4500
PAT benefit22
-- Rs. 45.00 million
Total benefit Rs. 45.00 million Rs. 90.00 million
Investment Rs. 135.00 million Rs. 135.00million
Payback period 36 months 18 months
Replication Potential
Saving potential 0.045 GCal / tcs 23
Number of plants 70% of the plants
Sector savings 189000 Mtoe
22 PAT benefits calculated based on the MTOE Savings. One MTOE equals Rs.10154 for the year 2011-
12 as per the PAT notification. Refer Annexure 2 for detailed calculation. 23 Energy Efficiency and Carbon Dioxide Emissions Reduction Opportunities in the Iron and Steel Sector
– LBNL
1 41 Technology Compendium on Energy Saving Opportunities – Iron & Steel
Technology No.4
Coal Moisture Control
Background
Coal is the major source of energy for an Iron & Steel industry. Majority of the coal is fed into the
coke oven batteries for producing coke, which is required for the iron making process. In general,
there is not much control on the moisture content of the coal before entering the process. This
leads to loss of energy, as energy will be spent to evaporate the water content in the input coal.
The methods for providing heat through external sources for vaporizing the water content in the
coal before entering the process is not economical in nature. Hence, the Coal Moisture Control
(CMC) which was started by the Iron & Steel industries of Japan, is a method to control the
moisture content of the input coal, thus reducing the energy spent in the coke ovens.
Energy Saving Project
Coal moisture control uses the waste heat from the coke oven gas for drying the input coal for
coke making. Generally, the moisture content in coke varies from 8 - 13% for good coking quality
coal. Drying can further reduce its moisture content to a consistent 6.5% then controlled to 6%
before entering the coke oven by belt conveyer. After drying, the coal material will be classified
and separated according to granularity grade.
After moisture control and separation, the coal material of fine granules will be conveyed to coal
tower through transportation system and coal material of coarse granules will be fed into the
pulverizer to be pulverized and then conveyed to coal tower. The exhaust gas out of moist control
will be gathered at the main pipe and dust-removed by dust remover and then discharged into the
air. The coal dust collected from each dust remover will be formed through forming machine and
then conveyed to coal tower.
This method reduces the heat consumption for carbonization and utilizes a large amount of non-
coking coal. Thus, the reduction of moisture of coal before entering coke ovens can reduce the
fuel consumption, increase productivity and quality of coke.

1 42 Technology Compendium on Energy Saving Opportunities – Iron & Steel
Figure 13 Schematic layout of moisture control in coal
Cost Benefits Analysis
Reference Plant (1 MILLION MTPA)
Without PAT With PAT benefit
Energy savings Rs. 64.60million Rs. 64.60million
MTOE equivalent 6460 6460
PAT benefit24
-- Rs. 65.00 million
Total benefit Rs. 64.60 million Rs. 129.00 million
Investment Rs. 193.80 million Rs. 193.80 million
Payback period 36 months 18 months
Replication Potential
Saving potential 0.065 GCal / tcs25
Number of plants 70% of the plants
Sector savings 273000 Mtoe
24 PAT benefits calculated based on the MTOE Savings. One MTOE equals Rs.10154 for the year 2011-
12 as per the PAT notification. Refer Annexure 2 for detailed calculation. 25 Energy Efficiency and Carbon Dioxide Emissions Reduction Opportunities in the Iron and Steel Sector
– LBNL
1 43 Technology Compendium on Energy Saving Opportunities – Iron & Steel
Technology No.5
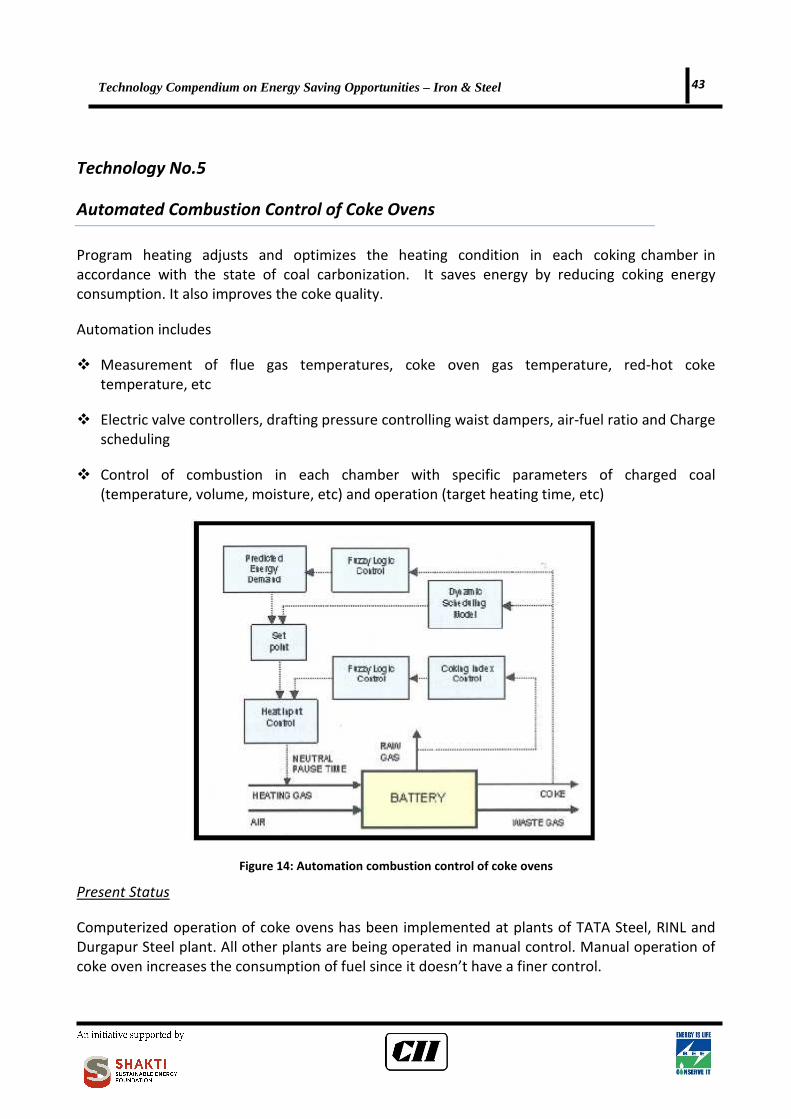
Automated Combustion Control of Coke Ovens
Program heating adjusts and optimizes the heating condition in each coking chamber in
accordance with the state of coal carbonization. It saves energy by reducing coking energy
consumption. It also improves the coke quality.
Automation includes
� Measurement of flue gas temperatures, coke oven gas temperature, red-hot coke
temperature, etc
� Electric valve controllers, drafting pressure controlling waist dampers, air-fuel ratio and Charge
scheduling
� Control of combustion in each chamber with specific parameters of charged coal
(temperature, volume, moisture, etc) and operation (target heating time, etc)
Figure 14: Automation combustion control of coke ovens
Present Status
Computerized operation of coke ovens has been implemented at plants of TATA Steel, RINL and
Durgapur Steel plant. All other plants are being operated in manual control. Manual operation of
coke oven increases the consumption of fuel since it doesn’t have a finer control.
1 44 Technology Compendium on Energy Saving Opportunities – Iron & Steel
RINL has implemented computerized control for coke ovens for one of their new batteries. The
savings of RINL is in around 70 kCal / kg of coke produced.
Barriers in Implementing
1) No wide knowledge of benefits of automation
2) Investment cost is very high
3) Retrofitting options are limited
4) Shut down of coke oven plants has to be taken for retrofitting options
Potential to scale up
Several plants have gone for computerized operation of coke ovens. TATA steel, RINL, Durgapur
steel plant has gone for computerized operation. Other plants are still operating with manual
control. Computerized operation of coke oven can be implemented in at least 5 plants in the
remaining plants.
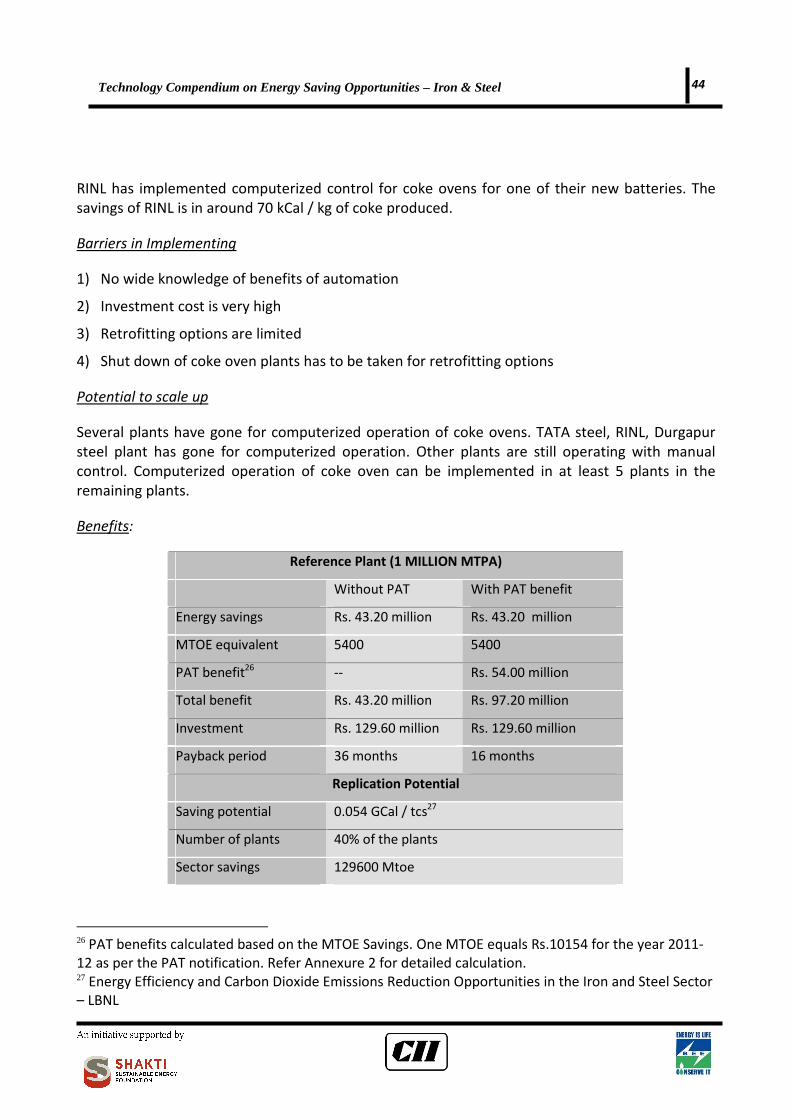
Benefits:
Reference Plant (1 MILLION MTPA)
Without PAT With PAT benefit
Energy savings Rs. 43.20 million Rs. 43.20 million
MTOE equivalent 5400 5400
PAT benefit26
-- Rs. 54.00 million
Total benefit Rs. 43.20 million Rs. 97.20 million
Investment Rs. 129.60 million Rs. 129.60 million
Payback period 36 months 16 months
Replication Potential
Saving potential 0.054 GCal / tcs27
Number of plants 40% of the plants
Sector savings 129600 Mtoe
26 PAT benefits calculated based on the MTOE Savings. One MTOE equals Rs.10154 for the year 2011-
12 as per the PAT notification. Refer Annexure 2 for detailed calculation. 27 Energy Efficiency and Carbon Dioxide Emissions Reduction Opportunities in the Iron and Steel Sector
– LBNL

1 45 Technology Compendium on Energy Saving Opportunities – Iron & Steel
Technology No.6
Coke Dry Quenching (CDQ) Technology
In an integrated steel plant, huge quantity of heat gets wasted in direct and indirect cooling. In the
conventional coke making process in steel plants, red hot coke is pushed out of coke ovens and
quenched with large quantity of water resulting in evaporation of water into the atmosphere.
Naturally the heat energy is lost in the process. In addition, quenching of coke results in air and
water pollution. Wet coke quenching is the conventional process in Indian Iron & Steel sector.
Coke dry quenching (CDQ) is an alternative to the traditional wet quenching of coke. This process
offers distinct advantages of sensible heat recovery, conservation of water and zero air and water
pollution. This is an established technology, popular in the more advanced countries. The dry coke
produced in the process enhances the productivity of blast furnaces, the work horses of
integrated steel plants.
In the CDQ system, the red-hot coke is cooled by an inert gas circulating in an enclosed chamber,
thereby preventing the release of coke dust into atmosphere. The thermal energy of the red-hot
coke is captured by the inert gas and is then used for generating steam and thus power.
Presently, CDQ installations are successfully executed at RINL, NINL ( Neelachal Ispat Nigam
Limited) and Tata Steel. RINL has implemented CDQ at design and generate 15MW of energy
from the set-up. Tata Steel has retrofitted their existing wet quenching process to CDQ with the
support of NEDO.
Figure 15: CDQ Process Flow
1 46 Technology Compendium on Energy Saving Opportunities – Iron & Steel
Barriers in Implementing
� Investment cost is very high & Space availability for installing in existing plants
Replication Potential
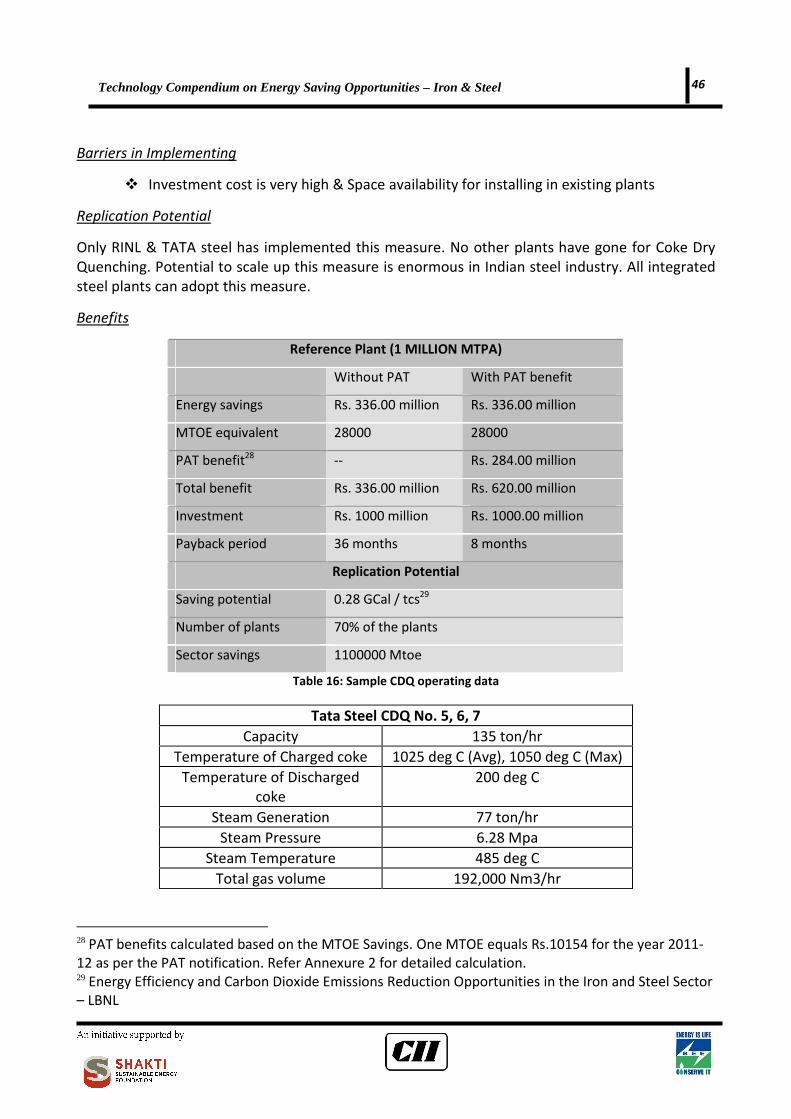
Only RINL & TATA steel has implemented this measure. No other plants have gone for Coke Dry
Quenching. Potential to scale up this measure is enormous in Indian steel industry. All integrated
steel plants can adopt this measure.
Benefits
Reference Plant (1 MILLION MTPA)
Without PAT With PAT benefit
Energy savings Rs. 336.00 million Rs. 336.00 million
MTOE equivalent 28000 28000
PAT benefit28
-- Rs. 284.00 million
Total benefit Rs. 336.00 million Rs. 620.00 million
Investment Rs. 1000 million Rs. 1000.00 million
Payback period 36 months 8 months
Replication Potential
Saving potential 0.28 GCal / tcs29
Number of plants 70% of the plants
Sector savings 1100000 Mtoe
Table 16: Sample CDQ operating data
Tata Steel CDQ No. 5, 6, 7
Capacity 135 ton/hr
Temperature of Charged coke 1025 deg C (Avg), 1050 deg C (Max)
Temperature of Discharged
coke
200 deg C
Steam Generation 77 ton/hr
Steam Pressure 6.28 Mpa
Steam Temperature 485 deg C
Total gas volume 192,000 Nm3/hr
28 PAT benefits calculated based on the MTOE Savings. One MTOE equals Rs.10154 for the year 2011-
12 as per the PAT notification. Refer Annexure 2 for detailed calculation. 29 Energy Efficiency and Carbon Dioxide Emissions Reduction Opportunities in the Iron and Steel Sector
– LBNL
1 47 Technology Compendium on Energy Saving Opportunities – Iron & Steel
Technology No.7
Preheating through WHR from Hot stoves of Blast Furnace
Background
The exhaust from the heat stoves is around 275°C. This heat can be recovered and can be used for
some other application. By recovering heat from the flue gas generated in heating the hot stoves
and using this heat for preheating the fuel and stove combustion air, the overall thermal efficiency
of the hot stoves can be improved resulting in substantial energy savings and optimized operating
costs.
Presently, this project has been implemented in Tata Steel, Durgapur Steel plant and RINL for
preheating the combustion air to the stove. In Tata steel, the project is supported by NEDO.
Energy Saving Project
This device recovers the sensible heat of the flue gas generated in heating the hot stoves which
supply hot blast to the blast furnace and uses this heat in preheating fuel and combustion air for
the hot stoves. Installation of this device improves the combustion efficiency of the hot stoves,
thereby saving energy.
This device (system) comprises two heat exchangers.
� One is a heat-receiving side heat exchanger which receives the flue gas discharged from the
hot stove
� The second is a heating side heat exchanger which preheats the combustion air and fuel using
the sensible heat of the flue gas received by the heat-receiving side heat exchanger.
The preheated combustion air and fuel gas are supplied to the hot stoves. Heat exchange
methods are classified as (1) rotary type, (2) plate type, and (3) heat pipe type, depending on the
type of heat exchanger.

1 48 Technology Compendium on Energy Saving Opportunities – Iron & Steel
Figure 16: Preheating through WHR from Hot stoves of Blast Furnace
Cost Benefits Analysis
Reference Plant (1 MILLION MTPA)
Without PAT With PAT benefit
Energy savings Rs. 39.60 million Rs. 39.60 million
MTOE equivalent 3300 3300
PAT benefit30
-- Rs. 33.50 million
Total benefit Rs. 39.60 million Rs. 73.10 million
Investment Rs. 118.8 million Rs. 118.80 million
Payback period 38 months 20 months
Replication Potential
Saving potential 0.033 GCal / tcs31
Number of plants 50% of the plants
Sector savings 99000 Mtoe
30 PAT benefits calculated based on the MTOE Savings. One MTOE equals Rs.10154 for the year 2011-
12 as per the PAT notification. Refer Annexure 2 for detailed calculation. 31 Energy Efficiency and Carbon Dioxide Emissions Reduction Opportunities in the Iron and Steel Sector
– LBNL

1 49 Technology Compendium on Energy Saving Opportunities – Iron & Steel
Technology No.8
Top Pressure Recovery Turbine
This is a power generating system which utilizes and converts the physical energy of high-pressure
blast furnace top gas into electrical energy using an expansion turbine. Although the pressure
difference is low, due to high volume of blast furnace gas generated, power generation is feasible
by expansion through a turbine. In general, without the top pressure recovery turbine, the blast
furnace gas is treated which decreases leads to decrease in its pressure and temperature. The key
technology of TRT is to secure the stable and high-efficiency operation of the expansion turbine in
dusty gas conditions without hindering the blast furnace operations.
The TRT system provides excellent operational reliability with a feature of abrasive resistance. The
electricity generated by this system covers about 20 % of electricity necessary for all equipments
attached to the blast furnace including air blowers.
Figure 17: Top pressure recovery turbine
Present Status
RINL, JSW Bellary and TATA steel has installed top pressure turbine. Out of these installations,
TATA steel has retrofitted top pressure turbine for its existing blast furnace and the other
installations are by design.
RINL and TATA Steel generate 24 MW of energy through top pressure turbine (TRT) system.
Barriers in Implementing
� Space constraint for retrofitting
� Needs shut down for retrofitting
� Widely acknowledged that retrofitting not possible
� Higher cost of investment

1 50 Technology Compendium on Energy Saving Opportunities – Iron & Steel
Benefits
Reference Plant (1 MILLION MTPA)
Without PAT With PAT benefit
Energy savings Rs. 63.00 million Rs. 63.00 million
MTOE equivalent 6000 6000
PAT benefit32
-- Rs. 60.00 million
Total benefit Rs. 63.00 million Rs. 123.00 million
Investment Rs. 252.00 million Rs. 252.00 million
Payback period 48 months 24 months
Replication Potential
Saving potential 0.07GCal / tcs33
Number of plants 75% of the plants
Sector savings 315000 Mtoe
32 PAT benefits calculated based on the MTOE Savings. One MTOE equals Rs.10154 for the year 2011-
12 as per the PAT notification. Refer Annexure 2 for detailed calculation. 33 Energy Efficiency and Carbon Dioxide Emissions Reduction Opportunities in the Iron and Steel Sector
– LBNL
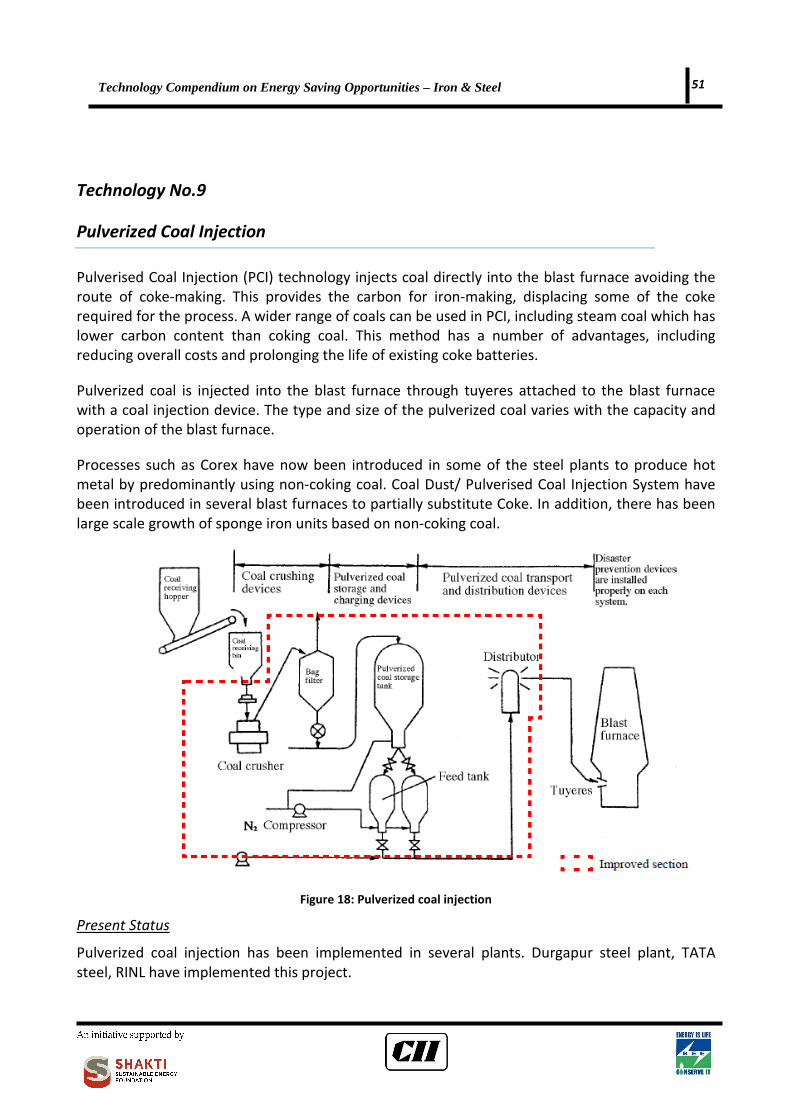
1 51 Technology Compendium on Energy Saving Opportunities – Iron & Steel
Technology No.9
Pulverized Coal Injection
Pulverised Coal Injection (PCI) technology injects coal directly into the blast furnace avoiding the
route of coke-making. This provides the carbon for iron-making, displacing some of the coke
required for the process. A wider range of coals can be used in PCI, including steam coal which has
lower carbon content than coking coal. This method has a number of advantages, including
reducing overall costs and prolonging the life of existing coke batteries.
Pulverized coal is injected into the blast furnace through tuyeres attached to the blast furnace
with a coal injection device. The type and size of the pulverized coal varies with the capacity and
operation of the blast furnace.
Processes such as Corex have now been introduced in some of the steel plants to produce hot
metal by predominantly using non-coking coal. Coal Dust/ Pulverised Coal Injection System have
been introduced in several blast furnaces to partially substitute Coke. In addition, there has been
large scale growth of sponge iron units based on non-coking coal.
Figure 18: Pulverized coal injection
Present Status
Pulverized coal injection has been implemented in several plants. Durgapur steel plant, TATA
steel, RINL have implemented this project.

1 52 Technology Compendium on Energy Saving Opportunities – Iron & Steel
However, the rate of injection is very low in India. The average injection rates is around
50 – 75 kg/ ton of hot metal in India and the highest being in TATA steel where the injection rate is
125 kg/ton of hot metal. With improvement in operation and technology, the injection range of
pulverized coal can be 50 – 200 kg/ ton of hot metal.
Barriers in Implementing
� Quality of raw materials used in the blast furnace determines the rate of injection.
Since the quality of raw materials used is low, achieving higher levels of injection might
not be possible in India
Benefits
Reference Plant (1 MILLION MTPA)
Without PAT With PAT benefit
Energy savings Rs. 34.00 million Rs. 34.00 million
MTOE equivalent 3500 3500
PAT benefit34
-- Rs. 35.00 million
Total benefit Rs. 34.00 million Rs. 69.00 million
Investment Rs. 115.00 million Rs. 115.00 million
Payback period 40 months 20 months
Replication Potential
Saving potential 0.035GCal / tcs35
Number of plants 80% of the plants
Sector savings 168000 Mtoe
34 PAT benefits calculated based on the MTOE Savings. One MTOE equals Rs.10154 for the year 2011-
12 as per the PAT notification. Refer Annexure 2 for detailed calculation. 35 Energy Efficiency and Carbon Dioxide Emissions Reduction Opportunities in the Iron and Steel Sector
– LBNL
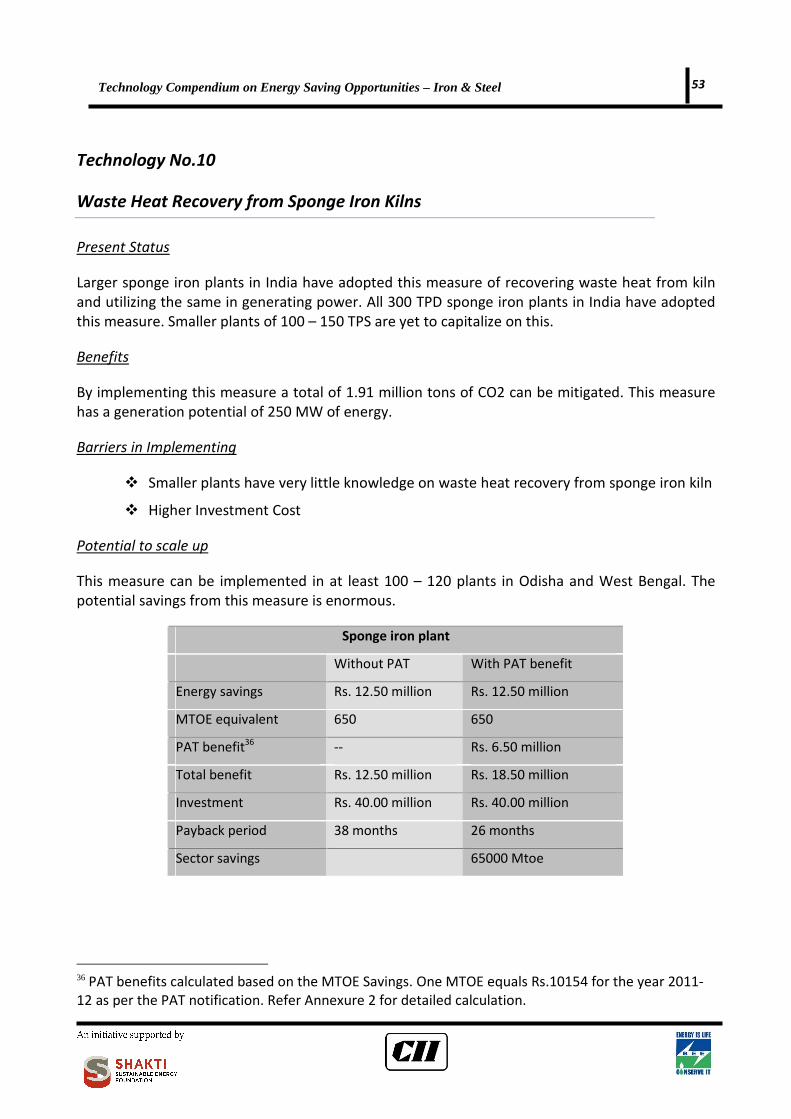
1 53 Technology Compendium on Energy Saving Opportunities – Iron & Steel
Technology No.10
Waste Heat Recovery from Sponge Iron Kilns
Present Status
Larger sponge iron plants in India have adopted this measure of recovering waste heat from kiln
and utilizing the same in generating power. All 300 TPD sponge iron plants in India have adopted
this measure. Smaller plants of 100 – 150 TPS are yet to capitalize on this.
Benefits
By implementing this measure a total of 1.91 million tons of CO2 can be mitigated. This measure
has a generation potential of 250 MW of energy.
Barriers in Implementing
� Smaller plants have very little knowledge on waste heat recovery from sponge iron kiln
� Higher Investment Cost
Potential to scale up
This measure can be implemented in at least 100 – 120 plants in Odisha and West Bengal. The
potential savings from this measure is enormous.
Sponge iron plant
Without PAT With PAT benefit
Energy savings Rs. 12.50 million Rs. 12.50 million
MTOE equivalent 650 650
PAT benefit36
-- Rs. 6.50 million
Total benefit Rs. 12.50 million Rs. 18.50 million
Investment Rs. 40.00 million Rs. 40.00 million
Payback period 38 months 26 months
Sector savings 65000 Mtoe
36 PAT benefits calculated based on the MTOE Savings. One MTOE equals Rs.10154 for the year 2011-
12 as per the PAT notification. Refer Annexure 2 for detailed calculation.

1 54 Technology Compendium on Energy Saving Opportunities – Iron & Steel
Technology No.11
Hot Charging and direct rolling mill
High-temperature semi-finished materials (slab, bloom, or billet) just after continuous casting (CC)
is charged into the heating furnace with the temperature maintained as high as possible, thus
reducing the fuel consumption at the heating.
Further, by improving the measures for preventing the temperature drop of the semis after CC,
the semis are directly sent to the rolling mill without going through the heating furnace,
eliminating the heating process and substantially reducing the fuel consumption.
The temperature drop of the semis is prevented by various measures: optimal temperature
control in CC, hot surface defect inspection, shortened transportation and handling time,
strengthened heat-retaining, etc. By the hot charging into the heating furnace and direct rolling
made possible by these measures, the fuel for the heating furnace is saved.
In order to charge the high-temperature semis into the heating furnace with the temperature
maintained as high as possible, various measures were incorporated as follows.
1. To shorten the time for transportation and handling.
2. To strengthen the heat-retaining measures.
3. To expand the flawless casting.
4. To synchronize the CC process and the hot-rolling process through appropriate scheduling.
5. To make the temperature of the semis as high as possible.
In order to perform direct rolling, following measures are required in addition to the above:
strengthened heat-retaining measures at CC, higher CC speed, higher rolling speed, low-
temperature rolling, etc. Low-temperature rolling is a technology to roll at a temperature as low
as possible. One such technology put into practice is an in-line edge-heater.
Figure 19: Hot Charging and direct rolling mill

1 55 Technology Compendium on Energy Saving Opportunities – Iron & Steel
Benefits
Hot Charging and direct rolling mill
Without PAT With PAT benefit
Energy savings Rs. 12.00 million Rs. 12.00 million
MTOE equivalent 300 300
PAT benefit37
-- Rs. 3.00 million
Total benefit Rs. 12.00 million Rs. 15.00 million
Investment Rs. 20 million Rs. 20.00 million
Payback period 20 months 16 months
Replication Potential
Number of plants 80% of the plants
Sector savings 30000 Mtoe
37 PAT benefits calculated based on the MTOE Savings. One MTOE equals Rs.10154 for the year 2011-
12 as per the PAT notification. Refer Annexure 2 for detailed calculation.
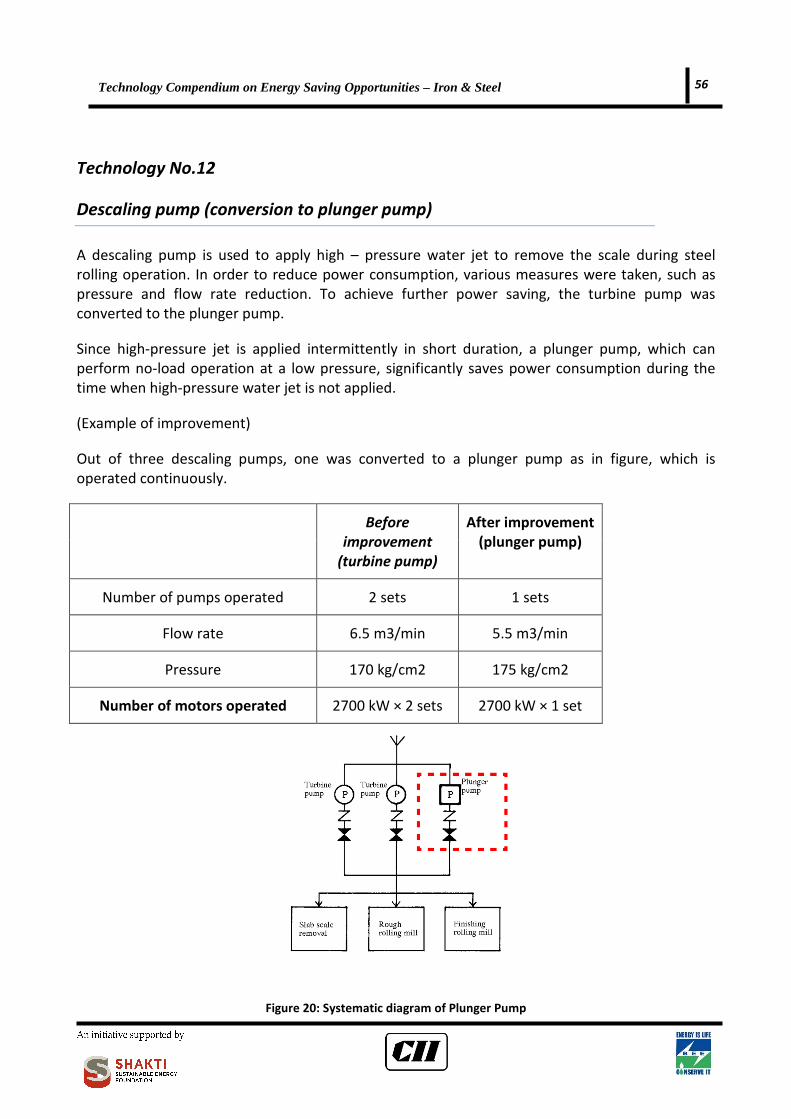
1 56 Technology Compendium on Energy Saving Opportunities – Iron & Steel
Technology No.12
Descaling pump (conversion to plunger pump)
A descaling pump is used to apply high – pressure water jet to remove the scale during steel
rolling operation. In order to reduce power consumption, various measures were taken, such as
pressure and flow rate reduction. To achieve further power saving, the turbine pump was
converted to the plunger pump.
Since high-pressure jet is applied intermittently in short duration, a plunger pump, which can
perform no-load operation at a low pressure, significantly saves power consumption during the
time when high-pressure water jet is not applied.
(Example of improvement)
Out of three descaling pumps, one was converted to a plunger pump as in figure, which is
operated continuously.
Before
improvement
(turbine pump)
After improvement
(plunger pump)
Number of pumps operated 2 sets 1 sets
Flow rate 6.5 m3/min 5.5 m3/min
Pressure 170 kg/cm2 175 kg/cm2
Number of motors operated 2700 kW × 2 sets 2700 kW × 1 set
Figure 20: Systematic diagram of Plunger Pump

1 57 Technology Compendium on Energy Saving Opportunities – Iron & Steel
Benefits
Table 17: Energy savings comparisons
Before
improvement
After
Improvement
Savings/Improve
ment
Loaded 1930 kW 1890 kW 40 kW Power
Consumption Unloaded 1210 kW 180 kW 1030 kW
Annual energy consumption 9456 MWh/y 3948 MWh/y 5508 MWh/y
Reduction in crude oil
equivalent
1338 kl/y
Descaling pump
Without PAT With PAT benefit
Energy savings Rs. 19.00 million Rs. 19.00 million
MTOE equivalent 450 450
PAT benefit38
-- Rs. 4.50 million
Total benefit Rs. 19.00 million Rs. 23.50 million
Investment Rs. 45 million Rs. 45.00 million
Payback period 30 months 23 months
Replication Potential
Number of plants 40% of the plants
Sector savings 42700 Mtoe
38 PAT benefits calculated based on the MTOE Savings. One MTOE equals Rs.10154 for the year 2011-
12 as per the PAT notification. Refer Annexure 2 for detailed calculation.

1 58 Technology Compendium on Energy Saving Opportunities – Iron & Steel
Technology No.13
Convection heating type heat treatment furnace for wire rod coil
In order to shorten the time required for spheroidizing annealing of wire rod coils, a forced
circulation fan was installed, which blows a large amount of hot air into the coils from inside, and
performs forced convection heat transfer cooling, which improves the heat transfer efficiency and
shortens the treatment time.
The outside of the wire rod coils is heated by the radiation from the radiant tube heat source as
well as by the convection heat transfer by the forced circulation fan installed at the top cover. Hot
air is forced into the inside of the coils by the fan. It passes through among the individual strands
of the coils, and heats up the coils. Forced convection heat transfer by the fan improves the heat
transfer efficiency, shortens the treatment time, and saves energy. At the time of cooling, an
indirect gas cooler is employed for rapid cooling, instead of the radiant tubes.
In a conventional heat treatment of wire rod coils, a heat source is installed along the outer
periphery of the coils, and the outside of the coils is kept at a designated temperature. Figure
shows the cross section of a heat treatment furnace equipped with a rapid heating device. Hot air
is forced into the inside of the coils by the forced circulation fan installed at the top cover. It
rapidly passes through among the individual strands of the coils, and heats up the coils. The hot
air which exchanged its heat with the coils passes through the hot air circulation duct equipped
with radiant tubes, is given the required heat, and returns to the forced circulation fan.
Thus, the coils are rapidly heated by the forced convection heat transfer within the coils. At the
time of forced cooling, an indirect gas cooler is employed for rapid cooling, instead of the radiant
tubes.
Figure 21: Structure of a rapid heating surface

1 59 Technology Compendium on Energy Saving Opportunities – Iron & Steel
Benefits
Heating time reduced by approximately 2.5 hours and cooling time reduced by approximately 3
hours.
Convection heating type heat treatment furnace for wire rod coil
Without PAT With PAT benefit
Energy savings Rs. 1.00 million Rs. 1.00 million
MTOE equivalent 100 100
PAT benefit39
-- Rs. 1.00 million
Total benefit Rs. 1.00 million Rs. 2.00 million
Investment Rs. 3.00 million Rs. 3.00 million
Payback period 36 months 12 months
Replication Potential
Number of plants 50% of the plants
Sector savings 9300 Mtoe
39 PAT benefits calculated based on the MTOE Savings. One MTOE equals Rs.10154 for the year 2011-
12 as per the PAT notification. Refer Annexure 2 for detailed calculation.

1 60 Technology Compendium on Energy Saving Opportunities – Iron & Steel
Technology No.14
Regenerative Furnace
Regenerative burner is a high performance burner for heating furnace use. This burner has a
unitary composition comprising a combustion section (burner) and heat storage section
(regenerator). Two burners are used as a pair. While one burner is in the combustion phase, heat
storage is performed by the burner on the opposite site. Approximately 85% of waste or higher
can be recovered by this alternate switching between combustion and heat storage.
Regenerative Burner:
Figure 22: Regenerative Furnace
As shown in figure, when burner A in 1 pair is in the combustion phase, the combustion gas
generated by burner A is taken into the burner section of burner B, heat exchange is performed in
the heat storage section, and the gas is then discharged out of the system.
When the heat storage section in burner B has stored sufficient heat by heat exchange with the
combustion exhaust gas, a combustion switching device switches operation to burner B, and
burner B begins combustion. Waste heat can be efficiently used by performing this operation,
repeatedly alternating between A and B.

1 61 Technology Compendium on Energy Saving Opportunities – Iron & Steel
Benefits:
Regenerative Furnace (Reference plant : 100 t-steel/h billet heating furnace)
Without PAT With PAT benefit
Energy savings Rs. 28.00 million Rs. 28.00 million
MTOE equivalent 700 700
PAT benefit40
-- Rs. 7.00 million
Total benefit Rs. 28.00 million Rs. 35.00 million
Investment Rs. 90.00 million Rs. 90.00 million
Payback period 39 months 31 months
Replication Potential
Number of plants 90% of the plants
Sector savings 61200 Mtoe
40 PAT benefits calculated based on the MTOE Savings. One MTOE equals Rs.10154 for the year 2011-
12 as per the PAT notification. Refer Annexure 2 for detailed calculation.

1 62 Technology Compendium on Energy Saving Opportunities – Iron & Steel
Technology No.15
CoJet (Coherent Jet Gas Injection Technology)
CoJet® Coherent Jet Gas Injection Technology is a state-of-the-art oxygen injection system that
lowers costs and improves productivity of electric arc furnace (EAF) and Twin Shell Furnace
operations. The technology provides an easily operated method for lancing/decarburization, post-
combustion, and burner operation in a single, integrated system using oxygen
CoJet® Coherent Jet Gas Injection Technology
An injector nozzle delivers a 3 to 5-foot (0.9-1.5 meters) laser-like coherent jet of oxygen at
supersonic speeds into the molten bath. The fixed, wall-mounted injector nozzle retains the
original diameter and velocity of the oxygen jet, delivering precise amounts of oxygen to the steel
bath with less cavity formation and splash compared to traditional manipulators.
Once the oxygen jet impinges on the steel bath, the concentrated momentum of the oxygen beam
dissipates in the steel as fine bubbles, providing deep penetration and effective slag-metal mixing.
The nozzle also operates as a conventional sidewall burner to melt scrap and as a supplemental
oxygen source for post-combustion, improving furnace productivity and decreasing power
consumption.
Figure 23: Coherent vs Conventional Supersonic jet
1 63 Technology Compendium on Energy Saving Opportunities – Iron & Steel
Benefits
� Lancing with fixed injectors is completely automated, not operator dependent. No need to
move lances in and out of the furnace
� Chemical energy of all forms (burners + lancing + PC) is supplied uniformly around the furnace
by the injectors -- not concentrated near slag door area.
� Less splashing/furnace damage because oxygen flow per injector is lower than a traditional
door lance and coherent jets inherently produce less splash.
� Faster decarburization and lower overall oxygen consumption due to more effective and
efficient use of oxygen in the furnace.
� Improved and continuous slag foaming with significantly less carbon injection.
� Slag door can be kept closed — air infiltration is reduced.
� Reduced refractory wear

1 64 Technology Compendium on Energy Saving Opportunities – Iron & Steel
5.0 FUTURE TECHNOLOGY OPTIONS
About 90% of the steel produced world wide is through blast furnace route. Alternate methods of
steel making are being explored for reduce the burden on raw materials, such as coke & coal,
used.
Production of non – liquid iron also known as direct reduced iron (DRI) through EAF & MIDREX and
production of liquid iron through COREX & FINEX are the some of the technologies considered for
alternate iron making.
� Direct Reduced Iron making (DRI Process)
� EAF
An Electric Arc Furnace (EAF) is a furnace that heats charged material by means of an electric arc.
This process reduces the burden on coal and coke, the resources which are scare in India. Electric
arc furnace is already in use for melting scraps in India.
� MIDREX
A MIDREX Direct Reduction (DR) Plant is composed of two main facilities: the Shaft Furnace,
where iron ore is reduced, and the Reformer which generates the reforming gas to be charged
into the Shaft Furnace. The MIDREX DR Process is able to use both lump and pellet as the raw
material and recycles the used gas, therefore the process has both low energy consumption and
low environmental impact, making it an environmentally friendly process.
MIDREX DR has been highly evaluated throughout the world in response to the need for new iron
making resources, in lieu of the Blast Furnace route.
� Production of liquid iron
� COREX
The highlight of the process is it does not require coking coal. The process differs from the
conventional blast furnace route; where un-treated non-coking coal can be directly used for ore
reduction and melting work, eliminating the need for coking plants. The use of lump ore or pellets
also dispenses with the need for sinter plants.
� FINEX
It is an optimized fine-ore reduction process for the direct utilization of the low-cost iron ore
fines for the production of iron. In this process fine iron ore is preheated and reduced to fine
direct reduced iron (DRI) in a three or four stage fluidized bed reactor system. The fine DRI will be
compacted and then charged in the form of hot compacted iron (HCI) into the melter gasifier. The
charged HCI is subsequently reduced to metallic iron and melted.

1 65 Technology Compendium on Energy Saving Opportunities – Iron & Steel
Prioritizing the projects:
The projects can be categorized into three heads namely, Level 1,
Level 2, Level 3 based on the simplicity of implementation level 1 being the easiest and level 3
being the most difficult to implement.
Level 1: Low investment and easier to implement
Level 2: Medium investment and moderate level of difficulty in implementation
Level 3: High investment and high level of difficulty in implementation
Level 1:
a) Variable Frequency Drive for centrifugal equipments
b) Preventive Maintenance
c) Sinter Plant Air Leakages
d) Energy efficiency improvements in captive power plant
The above measures are easier to implement and can be taken up as Kaizen activity.
Level 2:
a) Multi slit burner – Sintering furnace
b) Coal Moisture Control
c) Hot stove waste heat recovery
d) Blast Furnace Gas Sensible Heat Recovery
e) Continuous casting
f) Sensible heat recovery from main exhaust gas of sintering machine
Level 3:
a) Waste heat recovery form sinter bed
b) Coke Dry Quenching
c) Top Pressure Turbine
d) Computerized Operation of Coke Ovens
e) Pulverized Coal Injection
f) Waste heat recovery from sponge iron kiln

1 66 Technology Compendium on Energy Saving Opportunities – Iron & Steel
Table 18: Priority Table
Ease of Implementation Priority of Activity Opportunities
Easy Moderate Difficult Short Medium Long
Waste heat recovery form sinter bed x x
Coke Dry Quenching x x
Top Pressure Turbine x x
Captive Power Plant x x
Variable Frequency Drive x x
Preventive Maintenance x x
Multi slit burner – Sintering furnace
Sinter Plant Air Leakages x
x
Computerized Operation of Coke
Ovens
x x
Coal Moisture Control x x
Pulverized Coal Injection x x
Hot stove waste heat recovery x x
Blast Furnace Gas Sensible Heat
Recovery
x x
continuous casting
Sensible heat recovery from main
exhaust gas of sintering machine
x x
Waste heat recovery form Kiln x x
Table 19: Cost Abatement Curve
Description of proposal Investment,
Rs/MTOE
savings,
MTOE
A) Improvement in segregated charging of sintering materials 24000 2900
B) Automated Combustion Control of Coke Ovens 24000 5400
C) Sensible heat recovery from main exhaust gas of sintering
machine
30000 4500
D) Coal Moisture Control 30000 6460
E) Pulverized Coal Injection 33000 3500
F) Convection heating type heat treatment furnace for wire
rod coil
33000 100
G) Coke Dry Quenching (CDQ) Technology 36000 28000
H) Preheating through WHR from Hot stoves of Blast Furnace 36000 3300
I) Top Pressure Recovery Turbine 42000 6000
J) Waste Heat recovery from sinter bed 48000 2800
K) Waste Heat Recovery from Sponge Iron Kilns 62000 650
L) Hot Charging and direct rolling mill 66000 300
M) Descaling pump (conversion to plunger pump) 100000 450
N) Regenerative Furnace 125000 700
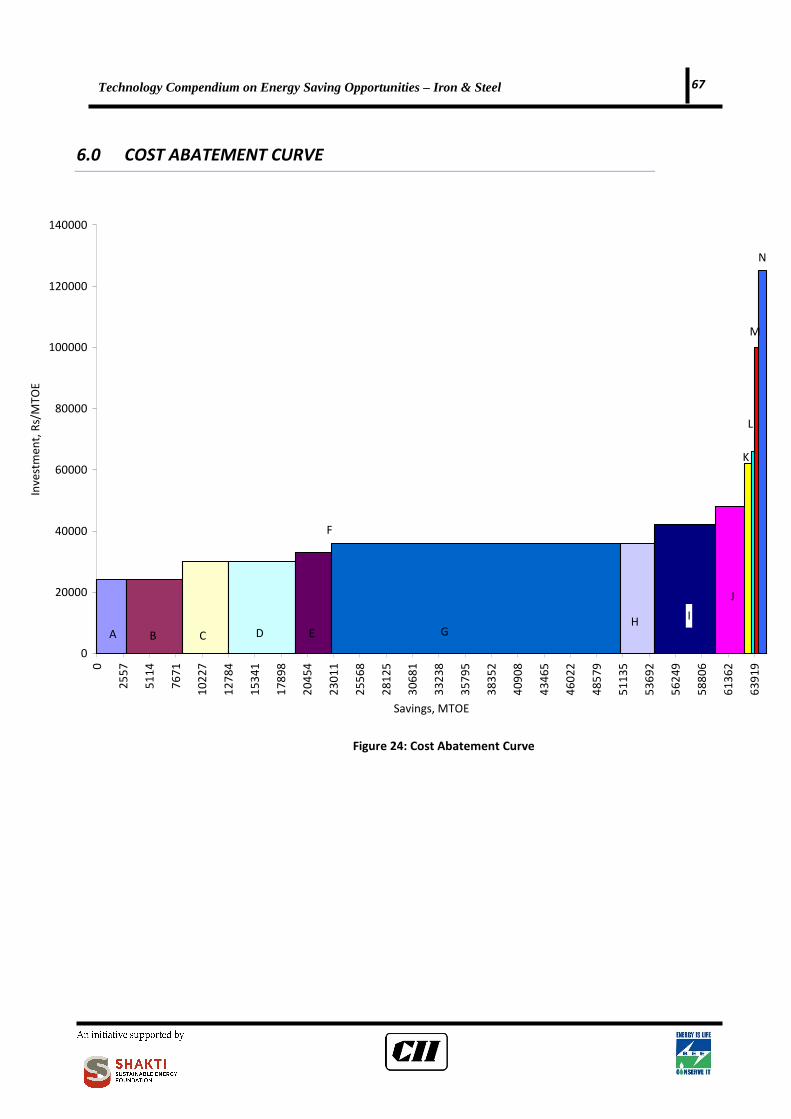
1 67 Technology Compendium on Energy Saving Opportunities – Iron & Steel
A B C D E
F
GH
I
J
K
L
M
N
0
20000
40000
60000
80000
100000
120000
140000
0
25
57
51
14
76
71
10
22
7
12
78
4
15
34
1
17
89
8
20
45
4
23
01
1
25
56
8
28
12
5
30
68
1
33
23
8
35
79
5
38
35
2
40
90
8
43
46
5
46
02
2
48
57
9
51
13
5
53
69
2
56
24
9
58
80
6
61
36
2
63
91
9
Savings, MTOE
Inv
est
me
nt,
Rs/
MT
OE
6.0 COST ABATEMENT CURVE
Figure 24: Cost Abatement Curve

1 68 Technology Compendium on Energy Saving Opportunities – Iron & Steel
Description of proposal
A) Improvement in segregated charging of sintering materials
B) Automated Combustion Control of Coke Ovens
C) Sensible heat recovery from main exhaust gas of sintering machine
D) Coal Moisture Control
E) Pulverized Coal Injection
F) Convection heating type heat treatment furnace for wire rod coil
G) Coke Dry Quenching (CDQ) Technology
H) Preheating through WHR from Hot stoves of Blast Furnace
I) Top Pressure Recovery Turbine
J) Waste Heat recovery from sinter bed
K) Waste Heat Recovery from Sponge Iron Kilns
L) Hot Charging and direct rolling mill
M) Descaling pump (conversion to plunger pump)
N) Regenerative Furnace

1 69 Technology Compendium on Energy Saving Opportunities – Iron & Steel
7.0 CONCLUSION
The technologies and best practices presented here is only a small effort to help the designated
consumers to achieve their PAT targets. Apart from this, several activities like regular
maintenance, equipment level energy efficiency, i.e.., efficiency testing of pumps, fans,
compressors, motors, can result in energy savings. Effective utilization of by product gases,
instead of flaring, is another step towards saving of conventional energy sources.
Indian iron & steel industry is bound to grow for the next few decades, thanks to the strong
demand from the domestic and international market. On the flip side, it would place a huge
burden on the energy market. This compendium is an effort towards this direction discussing not
only on the efficient use of energy but also the utilization of waste energy.
Iron & Steel industry account for 36 million MTOE (15% of the total consumption) of Indian
industrial energy consumption. Under PAT scheme, there are about 67 designated consumers,
both from integrated steel plants and sponge iron. They are mandated to improve their present
energy efficiency levels and save about 1.4 million ton of oil equivalent which is 22% of the overall
industrial target. We believe that this compendium would help designated consumers to choose
appropriate technology and achieve PAT targets.

1 70 Technology Compendium on Energy Saving Opportunities – Iron & Steel
Annexure 1: GHG INVENTORIZATION & TREND ANALYSIS
Present Status
Iron & Steel industry is one of the major industries releasing appreciable quantity of Green House
Gases. From 90.53 million tonnes of CO2 in the year 1994, the direct emissions from iron & steel
process has increased to 184 million tonnes of CO2 in the year 2009-201041
.
Emission intensity for steel industry is given below:
Emission for BOF route:
� Indian plants : 2.7 MT CO2 / tcs
� World average : 1.6 MT CO2 / tcs
Emission for Sponge Iron route:
� Indian plants : 3.1 MTCO2 / tcs
� World average : 2.5 MTCO2 / tcs
Indian iron & steel industry is more emission intensive than global average. CO2 emissions from
steel making are from intense consumption of fossil fuel. Emission analysis:
� 60% from fossil fuel
� 40% from process fuel
Future Emissions Scenario
The growth in iron & steel industry is projected to reach new heights. As per CII estimate, steel
production will reach 158 MTPA in 2020 and would be 374 MTPA in 2030. The emission from iron
& steel industry would also increase with respect to the increase in production.
The future emission scenario projected by various agencies is listed below:
� Low Carbon Strategies for inclusive growth
� Planning Commission of India
� CII projections
41 Steel Authority of India

1 71 Technology Compendium on Energy Saving Opportunities – Iron & Steel
1) Low carbon strategies for inclusive growth:
The report, Low carbon strategies for inclusive growth, by Planning Commission of India projects
the growth of the industry for 2020 by considering two scenarios. The growth projections are
based on the assumptions that India’s GDP grows at 9% each year and the elasticity factor for
sectors growth as 1.5%.
a) Determined Effort
Implementation of policies that are already in place or contemplated are pursued vigorously and
implemented effectively up to 2020
� Emission intensity by 2020 will be 2.03 MT CO2 / tcs
� Overall emissions will be 406 MT CO2
b) Aggressive Effort
In addition to the determined effort it includes implementation of new policies, new technologies
and additional finance
� Emission intensity by 2020 will be 1.83 MT CO2 / tcs
� Over all emissions at 366 MT CO2
2) CII GHG Projection:
Future projections are based on two scenarios:
a) Business as Usual Scenario (BAU):
In BAU, it is considered that the present energy efficiency activities will continue and energy will
keep reducing by 2.5% annually. The present emission intensity is considered to be 2.7 MT CO2 /
tcs. By this, the emission scenario would be:
• Emission intensity will be:
� 2020 : 2.6 MT CO2 / tcs
� 2030 : 2.5 MT CO2 / tcs
• Corresponding emission for CII’s projected growth rate of 158 MTPA for 2020 and 374
MTPA for 2030
� 2020 : 410 MT CO2
� 2030 : 935 MT CO2
b) Determined steps to improve energy efficiency:
This scenario is based on the consideration that determined steps for reducing energy
consumption will be taken. In this scenario, the emission intensity would be:

1 72 Technology Compendium on Energy Saving Opportunities – Iron & Steel
• 2020 : 2.3 MT CO2 / tcs
• 2030 : 2.2 MT CO2 / tcs
Corresponding emission for CII’s projected growth rate of 158 MTPA for 2020 and 374 MTPA for
2030
• 2020 : 363 MT CO2
• 2030 : 860 MT CO2
GHG mitigation potential for the projects specified in the report is as follows:
* GHG savings indicated is calculated only for the reference plant of 1 MTPA. Projects
explained in this compendium should be seen individually for its applicability in a
particularplant.
* The reader is advised not to sum up individual GHG emission savings and
extrapolate for the sector as it might be misleading
Description of proposal
Savings
MTOE
Sector
savings
MTOE
Thermal /
Electrical
savings
Multiplication
factor
Sectoral savings
tons of CO2
saved
Improvement in segregated
charging of sintering materials 2900 174000 Thermal 4.1 713,400
Automated Combustion Control of
Coke Ovens 5400 129600 Thermal 4.1 531,360
Sensible heat recovery from main
exhaust gas of sintering machine 4500 189000 Thermal 4.1 774,900
Coal Moisture Control 6460 273000 Thermal 4.1 1,119,300
Pulverized Coal Injection 3500 168000 Thermal 4.1 688,800
Convection heating type heat
treatment furnace for wire rod coil 100 9300 Thermal 4.1 38,130
Coke Dry Quenching (CDQ)
Technology 28000 1100000 Electrical 10.6 11,660,000
Preheating through WHR from Hot
stoves of Blast Furnace 3300 99000 Thermal 4.1 405,900
Top Pressure Recovery Turbine 6000 315000 Electrical 10.6 3,339,000
Waste Heat recovery from sinter
bed 2800 150000 Electrical 10.6 1,590,000
Waste Heat Recovery from Sponge
Iron Kilns 650 65000 Electrical 10.6 689,000
Hot Charging and direct rolling mill 300 30000 Thermal 4.1 123,000
Descaling pump (conversion to
plunger pump) 450 42700 Electrical 10.6 452,620
Regenerative Furnace 700 61200 Thermal 4.1 250,920

1 73 Technology Compendium on Energy Saving Opportunities – Iron & Steel
Annexure 2: BASIS OF SAVINGS ESTIMATIONS/SAMPLE CALCULATION
Basis for calculation:
Operating hours of the plant = 8000 hrs
Plant size = 1 MTPA
Cost of electrical energy = Rs. 3.50 / kWh
1 MTOE value = Rs. 10,154
Sample Calculation:
Savings without PAT
Energy saved = 500 kWh
Annual savings = 500 kWh X Rs. 3.50 / kWh X 8000 hrs
= Rs. 14.00 million / annum
Investment = Rs. 20.00 million
Payback = Rs. 20.00 million X 12 months
Rs. 14.00 million
= 18 months
Savings with PAT
Energy saved = 500 kWh
Annual savings = 500 kWh X Rs. 3.50 / kWh X 8000 hrs
= Rs. 14.00 million / annum
MTOE saved = 344
MTOE savings = 344 X Rs. 10, 154 / MTOE
= Rs. 3.40 million
Total savings = Rs. 14.00 million + Rs. 3.40 million
= Rs. 17.40 million
Investment = Rs. 20.00 million
Payback = Rs. 20.00 million X 12 months
Rs. 17.40 million
= 14 months
1 74 Technology Compendium on Energy Saving Opportunities – Iron & Steel
Miscellaneous:
1 kWh = 860 kCal
1 MTOE = 107 kCal
Cost of heat (sample calculation):
1 Mtoe = 1 * 107 kcal
1 Mtoe = Rs. 1015442
Annual coal savings = 5000 kg
Calorific value = 6000 kcal / kg
Kcal savings = 5000 kg * 6000 kcal / kg
= 30000000 kcal
Mtoe savings = 30000000 kcal / 1 * 107 kcal
= 3 Mtoe
Annual cost savings = Rs. 10154 / Mtoe * 3 Mtoe
= Rs. 30462
42 BEE PAT notification
1 75 Technology Compendium on Energy Saving Opportunities – Iron & Steel
Calculation of GHG emissions:
GHG emission depends on the type of fuel being used i.e.., coking coal, diesel, furnace oil or
electricity. Emission reduction for a particular project has been arrived on the basis of CO2 emitted
per MTOE.
If a process runs only with electricity, then CO2 emitted per MTOE is calculated as follows:
Electricity (1 kwh) = 860 kcal
Electricity emission factor = 0.91 kg of CO2/kwh43
1 MTOE = 10^7 kcal
kwh / MTOE = 10^7 kcal / 860 kcal
= 11627.9 kwh / MTOE
Tons of CO2 / MTOE = 0.91 kg of CO2/kwh * 11627.9 kwh /
MTOE
= 10.6 MT of CO2 / MTOE
Similarly, if a process uses only coking coal, then tons of CO2 / MTOE would be 4.1 considering,
calorific value of coking coal to be 6900 kcal / kg and emission factor of coking coal to be 2.8 ton
of CO2/ ton of coking coal44
.
Emission per MTOE is listed below for other fuel types:
Diesel = 2.7 MT of CO2 / MTOE
Natural gas = 2.2 MT of CO2 / MTOE
As mentioned before, emissions depend on the type of fuel being burnt / used and composition of
fuel. Generally, no process runs on single fuel. Usually, a fuel mixture will be used. In that case,
the emission multiplication factor has to be calculated based on the fuel mixture.
In order to calculate the GHG emission savings, the projects have been classified based on the
type of savings it achieves. For example, if a project gives coking coal savings, the MTOE savings
has been multiplied with the corresponding coking coal CO2 emission / MTOE and the value is
arrived.
43 Central Electricity Authority 44 IPCC emission factor

1 76 Technology Compendium on Energy Saving Opportunities – Iron & Steel
Example 1,
Type of project = Thermal
Fuel saved = coking coal
MTOE saved = 100 MTOE
tons of CO2 / MTOE = 4.1
GHG savings = 100 MTOE * 4.1 tons of CO2 / MTOE
= 410 tons of CO2
Example 2,
Type of project = Electrical
Fuel saved = electricity
MTOE saved = 100 MTOE
tons of CO2 / MTOE = 10.6
GHG savings = 100 MTOE * 10.6 tons of CO2 / MTOE
= 1060 tons of CO2

1 77 Technology Compendium on Energy Saving Opportunities – Iron & Steel
Annexure 3: LIST OF EQUIPMENT/TECHNOLOGY SUPPLIERS
1) Ardee Business Services Pvt.Ltd
� www.ardeebusiness.info
2) FLSmidth Private limited
� www.flsmith.com
3) Honeywell International Private (I) Ltd
� www.honeywell.com
4) Mettalon Holdings Limited
5) Siemens India Limited
� www.siemens.com
6) Stork HKB India PVT Limited
� www.storkindia.com
7) Thermax Limited
� www.thermaxindia.com
8) Transparent Energy Systems PVT Limited
9) Encon Thermal Engineers
� www.encon.co.in
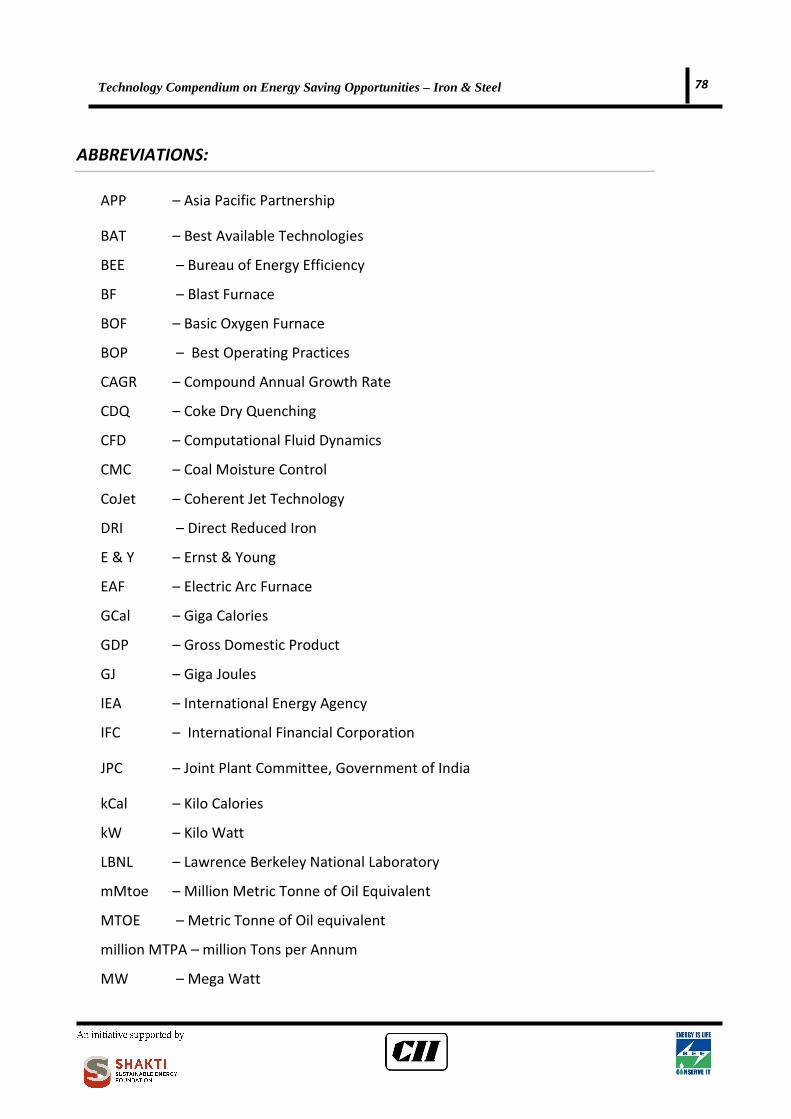
1 78 Technology Compendium on Energy Saving Opportunities – Iron & Steel
ABBREVIATIONS:
APP – Asia Pacific Partnership
BAT – Best Available Technologies
BEE – Bureau of Energy Efficiency
BF – Blast Furnace
BOF – Basic Oxygen Furnace
BOP – Best Operating Practices
CAGR – Compound Annual Growth Rate
CDQ – Coke Dry Quenching
CFD – Computational Fluid Dynamics
CMC – Coal Moisture Control
CoJet – Coherent Jet Technology
DRI – Direct Reduced Iron
E & Y – Ernst & Young
EAF – Electric Arc Furnace
GCal – Giga Calories
GDP – Gross Domestic Product
GJ – Giga Joules
IEA – International Energy Agency
IFC – International Financial Corporation
JPC – Joint Plant Committee, Government of India
kCal – Kilo Calories
kW – Kilo Watt
LBNL – Lawrence Berkeley National Laboratory
mMtoe – Million Metric Tonne of Oil Equivalent
MTOE – Metric Tonne of Oil equivalent
million MTPA – million Tons per Annum
MW – Mega Watt
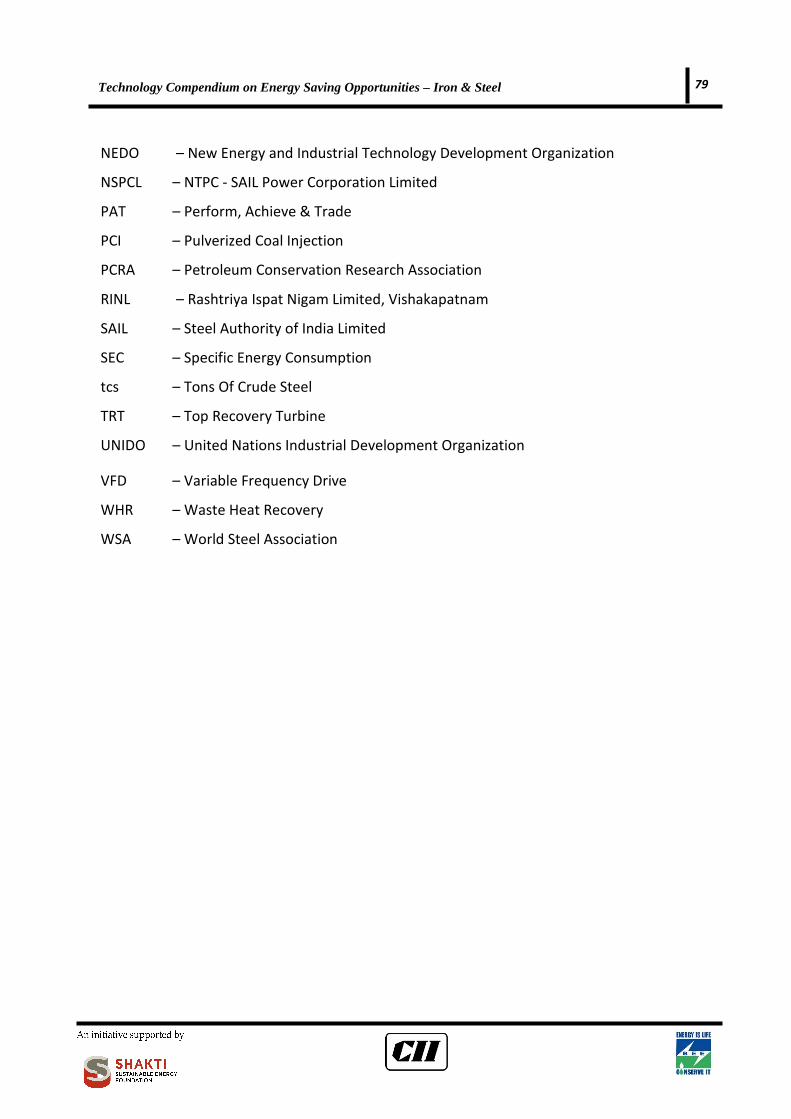
1 79 Technology Compendium on Energy Saving Opportunities – Iron & Steel
NEDO – New Energy and Industrial Technology Development Organization
NSPCL – NTPC - SAIL Power Corporation Limited
PAT – Perform, Achieve & Trade
PCI – Pulverized Coal Injection
PCRA – Petroleum Conservation Research Association
RINL – Rashtriya Ispat Nigam Limited, Vishakapatnam
SAIL – Steel Authority of India Limited
SEC – Specific Energy Consumption
tcs – Tons Of Crude Steel
TRT – Top Recovery Turbine
UNIDO – United Nations Industrial Development Organization
VFD – Variable Frequency Drive
WHR – Waste Heat Recovery
WSA – World Steel Association
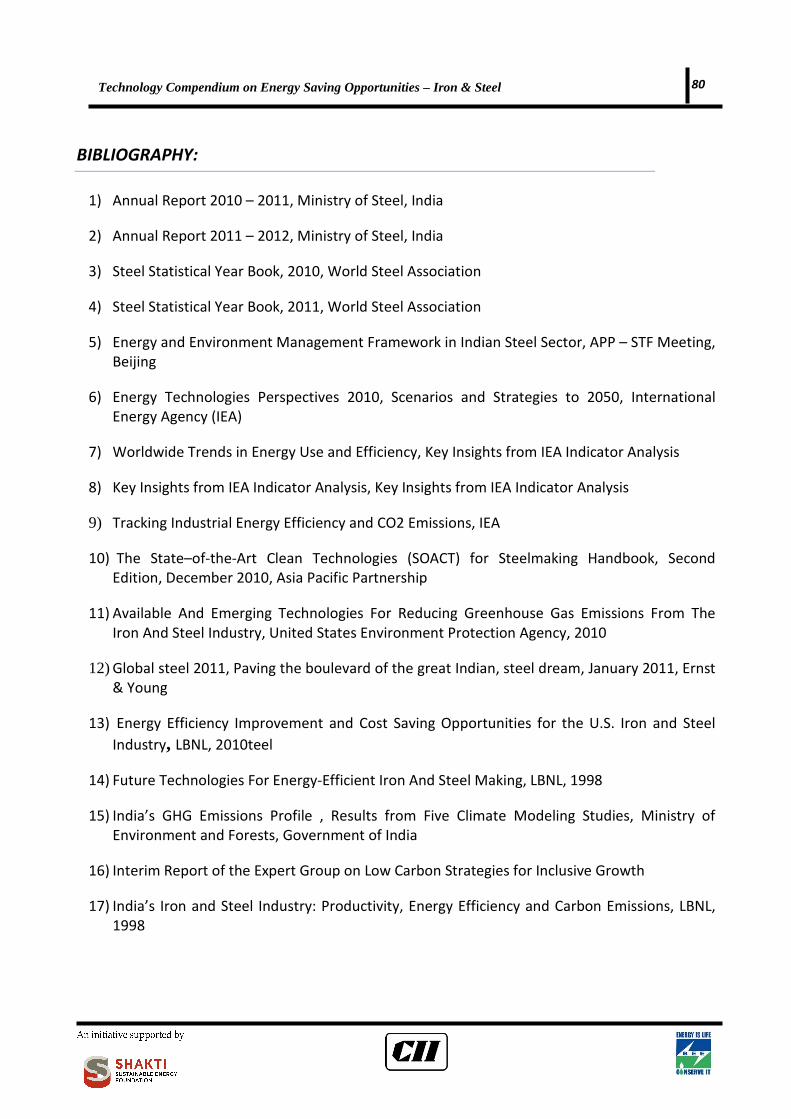
1 80 Technology Compendium on Energy Saving Opportunities – Iron & Steel
BIBLIOGRAPHY:
1) Annual Report 2010 – 2011, Ministry of Steel, India
2) Annual Report 2011 – 2012, Ministry of Steel, India
3) Steel Statistical Year Book, 2010, World Steel Association
4) Steel Statistical Year Book, 2011, World Steel Association
5) Energy and Environment Management Framework in Indian Steel Sector, APP – STF Meeting,
Beijing
6) Energy Technologies Perspectives 2010, Scenarios and Strategies to 2050, International
Energy Agency (IEA)
7) Worldwide Trends in Energy Use and Efficiency, Key Insights from IEA Indicator Analysis
8) Key Insights from IEA Indicator Analysis, Key Insights from IEA Indicator Analysis
9) Tracking Industrial Energy Efficiency and CO2 Emissions, IEA
10) The State–of-the-Art Clean Technologies (SOACT) for Steelmaking Handbook, Second
Edition, December 2010, Asia Pacific Partnership
11) Available And Emerging Technologies For Reducing Greenhouse Gas Emissions From The
Iron And Steel Industry, United States Environment Protection Agency, 2010
12) Global steel 2011, Paving the boulevard of the great Indian, steel dream, January 2011, Ernst
& Young
13) Energy Efficiency Improvement and Cost Saving Opportunities for the U.S. Iron and Steel
Industry, LBNL, 2010teel
14) Future Technologies For Energy-Efficient Iron And Steel Making, LBNL, 1998
15) India’s GHG Emissions Profile , Results from Five Climate Modeling Studies, Ministry of
Environment and Forests, Government of India
16) Interim Report of the Expert Group on Low Carbon Strategies for Inclusive Growth
17) India’s Iron and Steel Industry: Productivity, Energy Efficiency and Carbon Emissions, LBNL,
1998

1 81 Technology Compendium on Energy Saving Opportunities – Iron & Steel
18) Japanese Technologies for Energy Savings/ GHG Emissions Reduction, NEDO, 2008
19) India: Greenhouse Gas Emissions 2007, Ministry of Environment and Forests, Government of
India
20) Pulverized Coal Injection: Optimizing Blast Furnace Operation, Danieli Corus
21) Energy Saving Opportunities in Iron & Steel Industry, Petroleum Conservation Research
Association (PCRA)
22) Energy Efficiency in Steel and Clean Development Mechanism (CDM), Steel Authority of
Indian Limited (SAIL)
23) Sponge Iron industry, Central Pollution Control Board, Ministry of Environment & Forests
24) Steel Industry Technology Roadmap Barriers and Pathways for Yield Improvements, by
Energetics, Inc. for the American Iron and Steel Institute

1 82 Technology Compendium on Energy Saving Opportunities – Iron & Steel
Shakti Sustainable Energy Foundation
Shakti Sustainable Energy Foundation is the only funding agency in the country that commits its
resources exclusively in the clean energy policy space.
It works to strengthen the energy security of India by aiding the design and implementation of
policies that support the efficient use of existing resources and, the development of cleaner
alternatives. The organisation works in areas that can most contribute to energy security –
demand side management, transport, energy efficiency, climate policy and renewable energy.
Shakti belongs to an association of technical and policy experts called the ClimateWorks Network
that works on similar issues across the globe. This collaboration enables Shakti to facilitate the
inflow of knowledge and expertise from across the world into the India clean energy policy space.
Bureau of Energy Efficiency (BEE)
The Government of India set up Bureau of Energy Efficiency (BEE) on 1st March 2002 under the
provisions of the Energy Conservation Act, 2001. The mission of the Bureau of Energy Efficiency is
to assist in developing policies and strategies with a thrust on self-regulation and market
principles, within the overall framework of the Energy Conservation Act, 2001 with the primary
objective of reducing energy intensity of the Indian economy. This will be achieved with active
participation of all stakeholders, resulting in accelerated and sustained adoption of energy
efficiency in all sectors. BEE co-ordinates with designated consumers, designated agencies and
other organizations and recognize, identify and utilize the existing resources and infrastructure, in
performing the functions assigned to it under the Energy Conservation Act. www.beeindia.in
Confederation of Indian Industry (CII)
The Confederation of Indian Industry (CII) works to create and sustain an environment conducive
to the growth of industry in India, partnering industry and government alike through advisory and
consultative processes. CII is a non-government, not-for-profit, industry led and industry managed
organization, playing a proactive role in India's development process. Founded over 116 years
ago, it is India's premier business association, with a direct membership of over 8,100
organizations from the private as well as public sectors, including Small and Medium Enterprises
(SMEs) and multinationals, and an indirect membership of over 90,000 companies from around
400 national and regional sectoral associations. www.cii.in
CII - Sohrabji Godrej Green Business Centre (CII - Godrej GBC), a division of CII is India's premier
developmental institution, offering advisory services to the industry on environmental aspects
and works in the areas of green buildings, energy efficiency, water management, environment
management, renewable energy, green business incubation and climate change activities.
www.greenbusinesscentre.com