irpc investor update
TRANSCRIPT

INVESTOR UPDATE
August 2020

2
AGENDA
Fight against COVID-19
Performance Highlight
Projects Update
Company Profile
Strategic Direction
Industry Outlook
47.55%
6.00%
10.27%
36.17%
Others
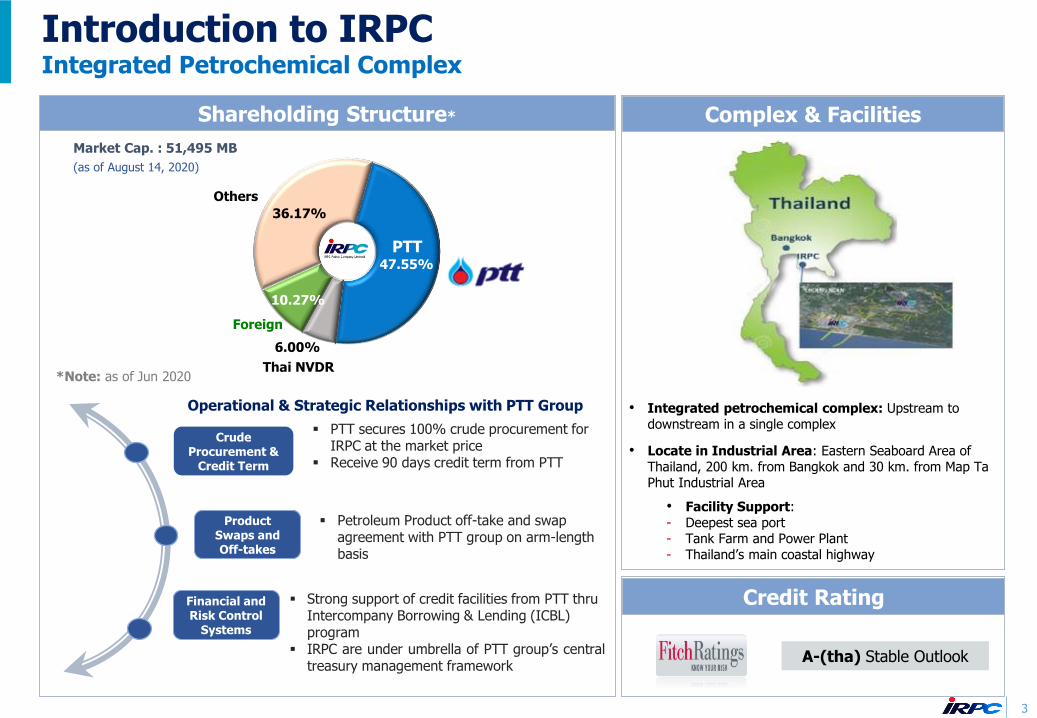
Introduction to IRPCIntegrated Petrochemical Complex
3
Shareholding Structure*
PTT secures 100% crude procurement for IRPC at the market price
Receive 90 days credit term from PTT
Petroleum Product off-take and swap agreement with PTT group on arm-length basis
Strong support of credit facilities from PTT thru Intercompany Borrowing & Lending (ICBL) program
IRPC are under umbrella of PTT group’s centraltreasury management framework
PTT
Crude Procurement &
Credit Term
Product Swaps and Off-takes
Financial and Risk Control
Systems
Operational & Strategic Relationships with PTT Group
Complex & Facilities
*Note: as of Jun 2020
• Integrated petrochemical complex: Upstream to downstream in a single complex
• Locate in Industrial Area: Eastern Seaboard Area of Thailand, 200 km. from Bangkok and 30 km. from Map Ta Phut Industrial Area
• Facility Support:- Deepest sea port- Tank Farm and Power Plant- Thailand’s main coastal highway
Market Cap. : 51,495 MB
(as of August 14, 2020)
Credit Rating
Thai NVDR
Foreign
A-(tha) Stable Outlook

4
Petroleum and Petrochemical Capacity
Petroleum
Port and Tank Services
Utilities307 MW Power plant
Facilities & Utilities
Refinery• LPG• Naphtha• Gasoline• Diesel• Fuel Oil
Lube Base• Lube Base Oil• Asphalt
Olefins• Ethylene• Propylene• Butadiene
Aromatics• Benzene• Toluene• Mixed Xylene
Styrenics• EBSM
Polyolefins• HDPE• PP
Polystyrenics• ABS• PS• EPS
Petrochemical Capacity• Monomer 1,848 KTA• Polymer 1,267 KTA
3,115 KTA
Crude Refining Capacity
215 KBD
Freehold Land~4,000 Acres
(~10,000 Rais)
1,221
367
915
352
920
215
Unit: KTA
Unit: KBD
Unit: KTA260
5 Depots
Petrochemical

5
IRPC’s Profile
Refinery Capacity : 215 KBD (crude distillation unit)
Petrochemical Capacity : 3,115 KTA (Olefins, Aromatics, Styrenics,
Polyolefins, Polystyrenics)
1
PP’s leading producer in South-East Asia: 775 KTA
HDPE pipe grade 140 KTA
ABS 179 KTA: The Largest producer in Thailand
2
Lube base oil : 320 KTA
Asphalt : 600 KTA
3
55% of specialty petrochemical portfolio
PPC to add more specialty Petrochemical Products
Specialty : 10-20% higher margin vs Commodity
5
Integrated
Petrochemical Complex &
Product Diversification
Remarkable Position
in ASEAN
Polymer Market
The largest lube base oil capacity
in Thailand
Power & Utility business : ~ 1.0 $/bbl to GIM
Additional contribution from utility JV starting from 2018
Stable income from Port and Tank business
4 Sustained earnings
from facility
and utility businesses
Specialty Petrochemical
to capture
higher margin

6
Petroleum and Petrochemical Value Chain Optimized Configuration & Product Diversification
Olefins Plant PropyleneEthyleneAcetylene Butadiene
180 KTA360 KTA6 KTA56 KTA
Vacuum Gas Oil (VGO)
PP
PS
ABS/SAN
EPS
CCM
Acetylene Black
HDPEEthylene
Acetylene
Propylene
Benzene
TolueneMixed Xylene
Butadiene
CD1
Ethylene
EBSM
4 KTA
140 KTA
775 KTA
Ethylene Rich Gas
DCC
Propylene 132 KTA
ADU1 65 KBD
ADU2 150 KBD
215 KBD
Naphtha
Reformate
UHV
Ethylene Propylene 320 KTA
73 KTA
Lube BaseLube Base Oil Asphalt
320 KTA600 KTA
BTX Benzene TolueneMixed Xylene
114 KTA132 KTA121 KTA 31 KTA
57 KTA
179 KTA
125 KTA
48 KTA
260 KTAStyrene Monomer
Acrylonitrile
Feed (Crude Oil / Condensate)Transportation FuelDiesel/JetGasolineFuel Oil
PRP
HS ATB
Propylene 100 KTA
Pyrolysis Gasoline Raffinate
Styrene Monomer
LS ATB
For sale
HS ATB
68% 17% 6% 9%
2019 Crude/Condensate Portfolio
Middle east Far east Domestic Others

Polyolefins Products
7
PP Polypropylene has medium transparency. It features such significant properties as high stiffness, high surface hardness, high heat and medium impact strength. It can be used for the manufacture of kitchenware, household items, stretch tape, electrical parts, fertilizer bags, sugar bags, woven bags, hot fill bags, etc.
Resin Appearance Sample
PE High Density Polyethylene (HDPE) has an opaque appearance. Products exhibit high tensile, impact strength and high chemical resistance.

Styrenics Products
8
Acrylonitrile Butadiene Styrene (ABS) features such significant properties as high impact strength, high heat and chemical resistance, high stiffness and high gloss including weather resistance. It is mainly used for the manufacturing of electrical parts, automotive parts, bicycle parts, household items, kitchenware, office supplies, toy, etc
Polystyrene (PS) can be divided into 2 types as follows; General Purpose Polystyrene (GPPS) has significant properties of transparency, rigidity, and process ability which are ideal for production of products, such as electrical parts, cassette tapes, CD boxes, household items, including foam boxes, food tray, etc. High Impact Polystyrene (HIPS) has significant properties of high impact strength, and process ability which are suitable for producing electrical parts, frame of TV, air conditioner, computers, toys, sanitary wares, office suppliers, plastic cup and tray, etc.
ABS
PS
Resin Appearance Sample

9
AGENDA
Fight against COVID-19
Performance Highlight
Projects Update
Company Profile
Strategic Direction
Industry Outlook

10
Key Drivers
Gross Refining Margin (GRM) Product to Feed Margin (PTF)Unit: $/bbl Unit: $/bbl
5.20
2.45 2.31 1.71 2.70
0.84
2.57
2018 2019 1H19 1H20 2Q19 1Q20 2Q20
7.32
5.06 5.43 4.65
5.19 4.70 4.66
2018 2019 1H19 1H20 2Q19 1Q20 2Q20
YoY 53% YoY 31%
30
31
32
33
15
25
35
45
55
65
75
Brent Dubai
Crude Oil Price (avg) Foreign Exchange (avg)
Unit: $/bbl Unit : THB/USD
2Q20 (End 31.07)
31.78
Dubai QoQ 40%
Dubai YoY 55%
QoQ depreciated 2%
YoY depreciated 1%
31.76
1Q19 2Q19 3Q19 4Q19 1Q20 2Q20
Brent 63.20 68.85 61.94 63.21 50.26 29.20
Dubai 63.53 67.36 61.16 62.05 50.74 30.551Q19 2Q19 3Q19 4Q19 1Q20 2Q20
30.88 30.45 31.45 32.12
1Q20 (End 32.83)
4Q19 (End 30.33)
QoQ - Unchanged
YoY 5%
QoQ 206%
YoY 10%
YoY 26% YoY 14%
18,344
5,940 4,659
(4,932)
2,304
(6,436)
1,505
69.42 63.53 65.45
40.64
67.3650.74
30.55
11
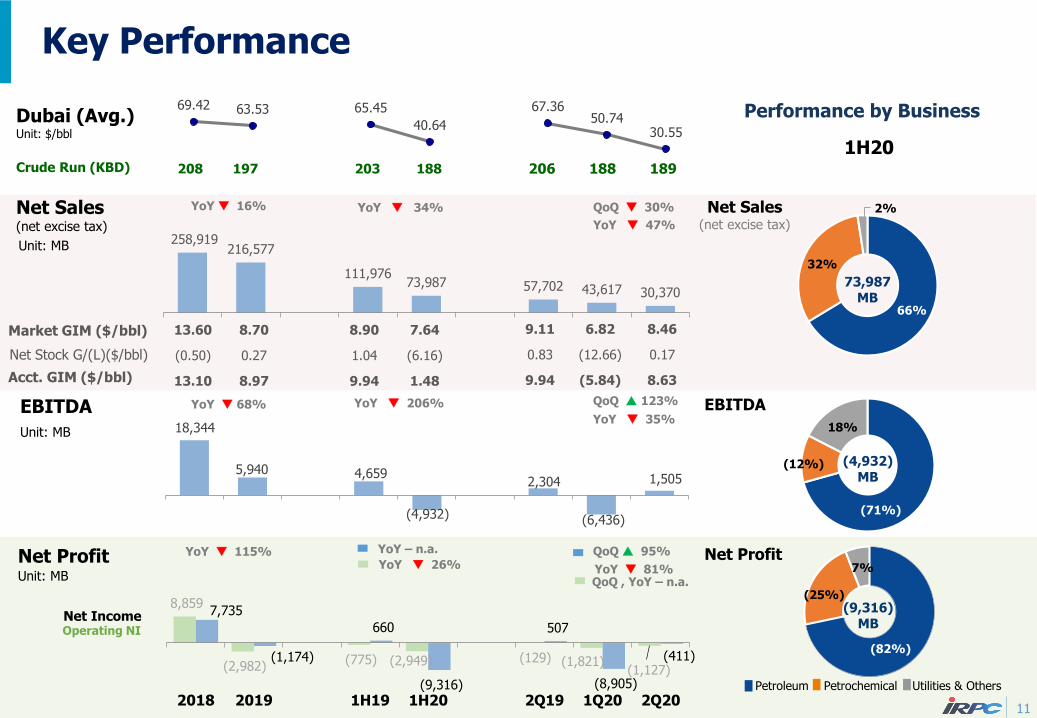
Key Performance
Net Sales (net excise tax)
Unit: MB
EBITDA
Unit: MB
Performance by Business
Net ProfitUnit: MB
Petroleum Petrochemical Utilities & Others
Net Sales(net excise tax)
Dubai (Avg.)Unit: $/bbl
258,919 216,577
111,976 73,987 57,702 43,617 30,370
Crude Run (KBD)
EBITDA
Net Profit
Market GIM ($/bbl)
Acct. GIM ($/bbl)
Net Stock G/(L)($/bbl)
YoY 115%
YoY 68%
YoY 16%
Operating NINet Income
8,859
(2,982)(775) (2,949) (129) (1,821)
(1,127)
7,735
(1,174)
660
(9,316)
507
(8,905)
(411)
2018 2019 1H19 1H20 2Q19 1Q20 2Q20
1H20206 188 189203 188
8.90 7.64
1.04 (6.16)
9.94 1.48
208 197
13.60 8.70
(0.50) 0.27
13.10 8.97
9.11 6.82 8.46
0.83 (12.66) 0.17
9.94 (5.84) 8.63
QoQ 30%
YoY 47%
YoY 34%
QoQ 123%YoY 206%
YoY 35%
YoY 81%
QoQ 95%
QoQ , YoY – n.a.
YoY – n.a.
YoY 26%
(82%)
(25%)
7%
(71%)
(12%)
18%
66%
32%
2%
73,987MB
(4,932)MB
(9,316)MB

12
Maintaining crude run and market position against COVID- 19 crisis
Maintained Refinery U-Rate during COVID-19 outbreak Production volume while Petrochemical sales volume
Improved MKT GIM as lower crude premium while spread
Recurring OPEX => 7%,QoQ following cost cut measures
Non-Recurring OPEX 325 MB => adj. capex to OPEX
Utilization Rate
MKT GIM Net Stock gain/(Loss)
OPEX
(13.26)
(1.00)
0.60 1.17
1Q20 2Q20
Hedging Stock G/(L) & LCM
Production Volume & Sales Volume
12.83 $/bbl
MKT GIM1Q20
MKT GIM2Q20
Crude Premium
Unit: $/bbl
Premium on sales
Fuel loss & Internal
Use
Projects
2Q19 1Q20 2Q20 1H19 1H20
Refinery
96% 87% 88% 94% 88%
Lube
82% 79% 87% 83% 83%
2Q19 1Q20 2Q20 1H19 1H20
Olefins
99% 95% 91% 94% 93%
Aromatics & Styrenics
99% 94% 95% 91% 95%
Petroleum Petrochemical
2Q19 1Q20 2Q20 1H19 1H20
Production (M.bbl)
15.13 13.55 13.40 29.23 26.95
Sales Volume (M.bbl)
16.63 15.16 14.45 32.60 29.61
Petroleum
2Q19 1Q20 2Q20 1H19 1H20
Production (KMT)
471 450 437 882 886
Sales Volume (KMT)
449 429 450 912 879
Petrochemical
Margin
64.3 54.2
33.7 20.4
30.5 40.8 Dubai Price
($/bbl)
(12.66)
0.17
ST Loan18%
LT Loan (USD)
8%LT Loan (THB)
64%
Bond (THB)10%
Leasing0.4%
13
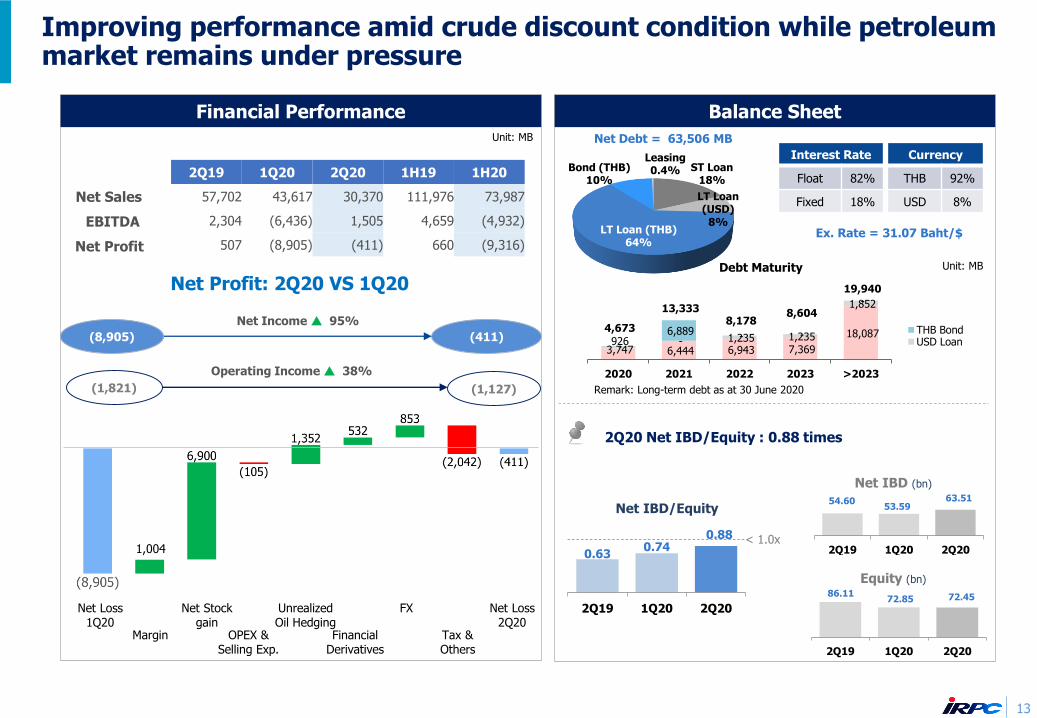
Improving performance amid crude discount condition while petroleum market remains under pressure
Financial Performance
3,747 6,444 6,943 7,369
18,087 926 - 1,235 1,235
1,852
-
6,889 - -
-
4,673
13,333 8,178
8,604
19,940
2020 2021 2022 2023 >2023
THB BondUSD Loan
Remark: Long-term debt as at 30 June 2020
Debt Maturity
0.630.74
0.88
2Q19 1Q20 2Q20
< 1.0x
Net IBD/Equity54.60
53.59 63.51
2Q19 1Q20 2Q20
86.11 72.85 72.45
2Q19 1Q20 2Q20
Net IBD (bn)
Equity (bn)
2Q20 Net IBD/Equity : 0.88 times
Balance Sheet
2Q19 1Q20 2Q20 1H19 1H20
57,702 43,617 30,370 111,976 73,987
2,304 (6,436) 1,505 4,659 (4,932)
507 (8,905) (411) 660 (9,316)
Net Sales
EBITDA
Net Profit
1,004
Net Loss 1Q20
Margin
Net Stock gain
OPEX & Selling Exp.
UnrealizedOil Hedging
Financial Derivatives
FX
Tax & Others
Net Loss 2Q20
Operating Income 38%
Net Income 95%
(8,905) (411)
(1,821) (1,127)
Unit: MB
Unit: MB
Net Profit: 2Q20 VS 1Q20
Net Debt = 63,506 MB
Ex. Rate = 31.07 Baht/$
Interest Rate Currency
Float 82% THB 92%
Fixed 18% USD 8%

14
AGENDA
Fight against COVID-19
Performance Highlight
Projects Update
Company Profile
Strategic Direction
Industry Outlook

15
Projects UpdatedFloating Solar Project with Electricity 12.5 MW ABS Expansion: Increasing ABS specialty by 6,000 MTA
Construction ProgressABS Expansion
Project Objective : Increase 6,000 MTA of Specialty
ABS Powder. Recovery Vapor Butadiene
278 MTA from Flare.
CAPEX : ~ 430 MB
IRR : ~ 17%
Project Objective : To produce electricity 12.5 MW Floating Support material by
own HDPE BOI Privilege
Area: Reservoir in Industrial Park
Usage: Internal use at PP Plant
CAPEX : ~ 550 MB
IRR : ~ 17%
Floating Solar Construction Progress
April 2020
COD 5 June 2020
COD
MC
MC
Installing equipment
and Piping work
under progression
3Q20
4Q20Project ProgressAs of July 2020 : 89% of Target

Ultra Clean Fuel (UCF) ProjectEnforcement of the Euro 5 diesel regulation in Thailand
16
10% 9%
46%
91%
45%
Je
t
As Is To Be
HS
GO
100%
LS
GO
Diesel Portfolio Changed
▪ Low sulfur Diesel
(50 ppm 10 ppm)
▪ To implement Euro 5 in Thailand
in 2024
▪ Cambodia & Vietnam to adopt
Euro 5 fuel standard
Capacity : 75 KBD
CAPEX : 14,400 MB (~ 450 M$)
IRR : ~ 14 %
2019 2020 2021 2022 2023COD,Q4
2024
Basic Design & FEED (BOI/EIA)
Engineering & Construction
Implement Euro 5 in Thailand

17
AGENDA
Fight against COVID-19
Performance Highlight
Projects Update
Company Profile
Strategic Direction
Industry Outlook

Impact of the outbreak of COVID-19 and mitigation strategies
Spunbond
Face Shield
Alcohol
Key Actions for supporting the COVID-19 outbreak Our Survival Mode
Modular room
Negative-pressure Bed
Business Continuity Management (BCM)
Employees Protection
Social Contribution
Liquidity management
Production and marketing strategies alignment
Tighten Operating expenses (OPEX)
Capital spending plan (CAPEX) Reconsideration
Strengthen IRPC projects
18

1919
CSR “The Fight Against COVID-19”
“One Stop Service Clinic”
Designed by IRPC’s Engineer And Signed the MOU with Rayong Hospitals
Modular Diagnosis Room / ARI Clinic Room

2020
CSR “The Fight Against COVID-19”
IRPC & Navamindradhiraj University(NMU) Collaboration to establish the testing services center
Signed MOU between IRPC and NMU on May7, 2020
Collaboration Model
• Technical experience
• Knowledge in polymer
• Business and marketing experience
• Knowledge on medical requirement
• Partial utilization through student usage
Testing Services Center
• Testing Services Center
• Clean room
• To Test & Certify PPE medical products
Objectives:
• Establish a central laboratory providing
• Inspection and certification of medical equipment
• Co-operation of further development for other medical equipment

21
Survival Mode
1. Maintain Market Position
2. CAPEX & OPEX Reduction
3. Strengthen IRPC

22
1. Maintain Market PositionRelationship-based strategies and Portfolio management
Key challenges and mitigation: Protect domestic market share and search for new territories
Petrochemical ProductsPetroleum Products
-1.0 -0.5 0.0
Diesel
Gasoline
Jet
Lube
IRPC MKT
-30%
-20%
Overall reduction in demand, decline across Petroleum products portfolio especially gasoline and jet
-100%
-50%
-40%
-30%
-10%
Impact across petrochemical, some sectors harder hit especially automotive, electronic and industrial while packaging and consumer remains strong
Key challenges and mitigation: Closely monitor customer’s inventory & adjust proportion export
%Market demand decline (2Q20F)
▪ Keep contract of domestic demand based on market decline to maintain market share
▪ Export sales to countries those are not lockdown or partial lockdown
▪ Jet is only 4-5% of refinery portfolio, swap to diesel pool
▪ Lube products group : maintain South East Asia and China customers
▪ Demand decline both domestic and export
▪ Demand decline both domestic and export
Key challenges Mitigation Key challenges Mitigation
No impact
▪ Secure order with contract customer
▪ Review and negotiate with strategic partner to ensure order
▪ Spot order move to focus area
▪ Closely monitor and follow up customer’s inventory to immediate response after lock down
-0.5 -0.3 0.0
Polystyrenics
Polyolefins
IRPC MKT
-30%
-20%
-30%
-25%
%Market demand decline (2Q20F)
Stress case Stress case

23
2. CAPEX & OPEX ReductionTotal 5 years CAPEX plan decreased ̴ 48% and OPEX decreased ̴ 13% after review
41,598
16,533
12,355
9,356
2,176
2020-2024Plan
2020-2024Review
53,953
28,065
-48%
Strengthen IRPC
General CAPEX
4,010 3,371
2,952
1,164254
2020 Plan
6,962
254
2020 Review
4,789-31%
CAPEX Reduction 2020-2024 (MB)
CAPEX 2020 (MB)
OPEX Reduction 2020 (MB)
2020 Plan 2020 Review2020 Plan 2020 Review
Projects
-13%

24
CAPEX Plan in 2020 – 2024
6,962
9,097
20,590
12,707
4,597
2020 2021 2022 2023 2024
E4E, IRPC 4.0
MARS project
General & MaintenanceProject
Others
UCF Project
Unit: MB
10,555 , 19%
458 , 1%
32,472 , 60%
8,989 , 17%
1,480 , 3%
IRPC 5 year CAPEX Plan
General & Maintenance Project
E4E, IRPC 4.0
Others
Total *
53,953 MB
UCF Project
MARS Project
* Excluding study projects for investment opportunities of 14,108 MB
Remark: Data as of Dec, 2019
4,789
8,617
10,549
2,463 1,646
2020 2021 2022 2023 2024
E4E, IRPC 4.0
MARS project
General &Maintenance Project
Others
UCF Project
9,356 , 33%
429 , 2%
472 , 2%14,400 , 51%
2,176 , 8%
1,232 , 4%
IRPC 5 year CAPEX Plan
General & Maintenance Project
E4E, IRPC 4.0
Others
Total
28,065 MB
UCF Project
MARS Project
Strengthen
Remark: Data as of June, 2020
As-is To-beUnit: MB

25
3. Strengthen IRPCDriven performance by “Strengthen IRPC” program to deliver benefit
Significant EBITDA impact (total value estimated at 4,600+ MB)
▪ “Strengthen core business IRPC”
▪ Cross functional team from Operation , Commercial , Business development , ISC M&R and RD to
– Safety
– Reliability
– Productivity
– Increase specialties products
– Conversion cost reduction
– Enhance value of idle asset
– Inventory management
– Increase distribution channel
▪ Project governance by IRPC ourselves
Benefit Forecasted for 2020 ≈ 1,904 MB (Off PL 640 MB)
MB
Overview of impact and capital required
254
1,530
392
2,1761,904
7731,069
855
4,600
20222020 2021 2023 total
CAPEX
Benefit
886
1,904
329
E4E
Breakthrough Project
IRPC 4.0
total
MB
689
26
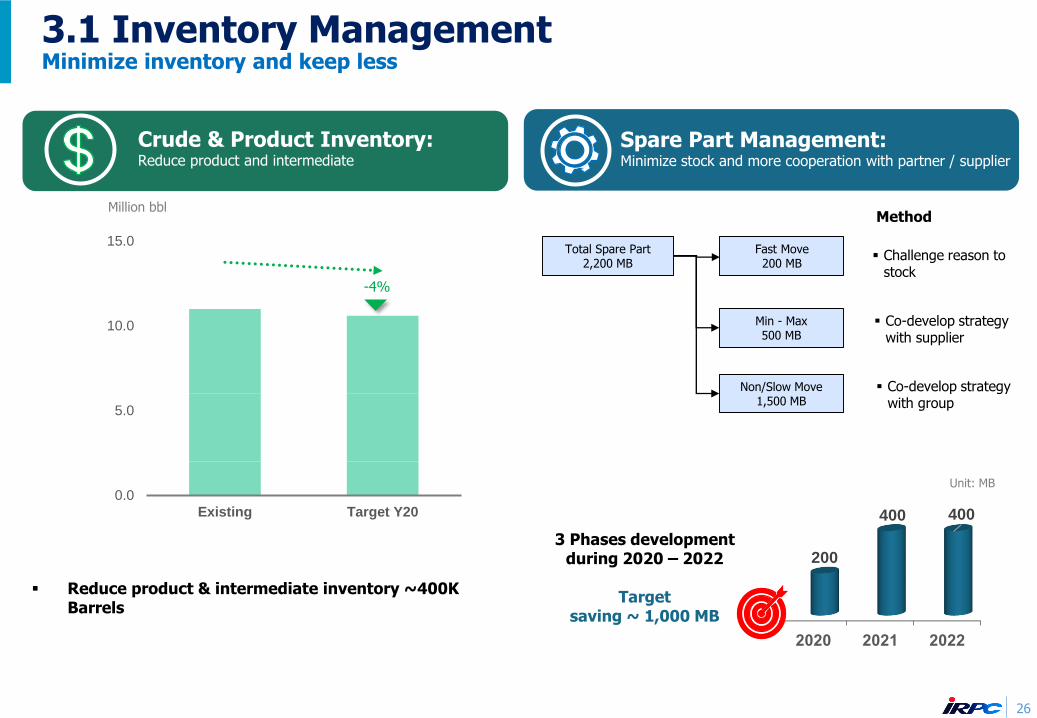
3.1 Inventory ManagementMinimize inventory and keep less
Spare Part Management:Minimize stock and more cooperation with partner / supplier
Total Spare Part2,200 MB
Fast Move200 MB
Min - Max500 MB
Non/Slow Move1,500 MB
Method
Challenge reason to stock
Co-develop strategy with supplier
Co-develop strategy with group
Crude & Product Inventory:Reduce product and intermediate
2020 2021 2022
200
400 400
3 Phases development during 2020 – 2022
Targetsaving ~ 1,000 MB
11.010.6
0.0
5.0
10.0
0.0
5.0
10.0
15.0
Existing Target Y20
Reduce product & intermediate inventory ~400K Barrels
-4%
Million bbl
Unit: MB

27
3.2 STARGATE
Project description :
Provide strategic gateway for domestic market via pipeline system
Support UCF project
Scope:
Margin improvement
Increase competitive advantage in domestic oil market
CAPEX : Minimal or none
Margin Improvement : 500 - 600 MB
COD : 2Q2023
STARGATE
Future Opportunity

28
AGENDA
Fight against COVID-19
Performance Highlight
Projects Update
Company Profile
Strategic Direction
Industry Outlook

29
IRPC Way Forward
1
2
Costs Competitive
Cash is a King
Shape and Focus
Value Creation
Short-term
Long-term
Survive
Strong Market Position
Opportunistic Investment
Direct Integration
Potential Portfolio
Short-term
Long-term
Resilience
4
3

30
Portfolio shift to high value added product and Seeking opportunity for growth
Seeking opportunity for growth
Commodity Plus42%
Specialty13%
Commodity45%
Commodity Plus42%
Specialty30%
Commodity28%
Target 2024As IS
Automotive
Medical/ Hygiene
Electronic Appliance
Expedite Specialty Product in focusing area
“ANT” Program - cross-function pilot teams
Medical/ Hygiene▪ Increase sales volume and benefit▪ Develop sales plan▪ Study business model (add more scope on
Healthcare & hygiene)
▪ Increase sales volume and benefit▪ Develop sales plan▪ Maintain existing customer▪ Find new customer▪ Study business model
▪ Increase sales volume and benefit▪ Develop sales plan▪ Target market, customer, volume▪ Study business model
Medical
Expand existing PP random grade to
new market & new application
Hygiene
Development of new PP Meltblow resin
- N95 mask
- Protective suit
- Hair/shoe cover
~ 1,000 - 2,000 MB/yr

NOAH: New Organization with Agile Human Further enhance business strategies after digital transformation
The most cost-efficientoperating model at speed
New Organization with Agile Human (NOAH) is the implementation phase to
“Transform Organization Capability-to-Perform”
• Different Work• Different Way• Work differently
• Upskill• Reskill• New skill
• Measure what matter • Competency-based growth• Pay for performance
• BAU Talent• Talent on journey• Near-term catalysts• Tomorrow’s talent
New
Organization
Agile
Human
A
B
C
D
Future Skill Development
New Performance Management and Rewarding
Talent acquisition
Choices of Life Through Package• Aspiring Separation Program (ASP)
• Mutual Separation Program (MSP)
E Benefit: Cost saving
Staff cost(without “NOAH”)
Staff cost(with “NOAH”)
Base line
average~ 1,000 MBY2020
Y2025

32
AGENDA
Fight against COVID-19
Performance Highlight
Projects Update
Company Profile
Strategic Direction
Industry Outlook

FO
+ Lockdown restrictions are lifted in various parts of the world+ Strong Naphtha demand from Naphtha cracker- The refineries are ramping up runs after turnaround
GAS Oil
33
2H20 Market Outlook
ULG 95
FODriving Determinants : Petrochemical
Crude Oil
ULG 95
ABS
PP
HDPE (Pipe)
PS
KeyProducts
Price (2Q20)
Spread(2Q20)
Refinery ($/bbl) ($/bbl)
Dubai 30.6
ULG 95 33.1 2.6
Gas Oil 36.3 5.7
FO 28.9 -1.6
Polymer ($/T) ($/T)
PP 859 585
HDPE(Pipe)
903 629
PS 923 649
ABS 1,193 919
Driving Determinants : Petroleum
+ Manufacturing in China start consumption amid COVID-19 easing+ Higher demand during winter+ International flights resume after lockdown easing- The refineries are ramping up runs after turnaround
+ Higher demand for power generation during summer in Middle East.+ Limited storage capacity as it was turn to LSFO (S 0.5%) tank- Less bunker oil demand due to bearish economic sentiment
+ Improve demand in Asia after COVID-19 Crisis has eased+ Narrow PE Pipe- ethylene spread may force high-cost producers to reduce operating rate- Slow demand during rainy and winter season
+ Improving demand in Asia after lockdown easing + Manufacturing season + Food-packaging and medical demand remain healthy- Surge supply from Malaysian new capacity
+ Weaker feedstock cost and extra demand. (New One Helmet, One Belt policysince 1 June in China)+ Shifting demand in hygiene and appliance due to consumer behavior changes.+ The Automotive producers in Asia have return to the market
+ Recovery demand in the manufacturing industry in Asia after COVID-19 haseased- Soft demand from the alternative plastics
+ OPEC+ supply remains low following the extend cut and greater level ofcompliance+ Improving demand as industrial activities pick up momentum post lockdown- The strong growth of new Covid-19 cases may weaken the recovery in demand- Prices could experience downside pressure as high crude stockpiles

34
Crude Oil Outlook
Source: Platts
Global refinery runs recover but remain below 2019 implying low utilization rates
Oil demand continued to recover from 3Q20 onward & Supply is on the rise after bottoming in June.Supply catching up with demand improvements, demand for oil grows faster than production.

Huge drop in demand but now see positive growth sign
35
Singapore Crack Spread on Dubai
Gasoline demand had recovered along with other products after demand to bottom out in 2Q20
Source: Platts
The bottom of the demand

36
Petrochemical Outlook : Polypropylene
Polypropylene world operating rate
Previous forecast
World : Addition Capacity
Regional Polypropylene Net Trade Polypropylene Per Capita Consumption
>80%
World’s per capita Consumption at 9.9 kg up from 9.6 kg in 2018Is expected to reach 11.6 kg by 2024
World
Mainly export from ME to Asia
Global operating rates averaged 86% for 2019-2024Strong demand by NEA, SEA, India due to continued urbanization

37
Petrochemical Outlook : HDPE
HDPE world operating rate World : Addition Capacity
Regional HDPE Net Trade Southeast Asia : HDPE Trade
>80%
Mainly export from ME to Asia
Global operating rates averaged 84% for 2019-2024Low-cost producers MDE, NAM is pressuring high-cost producers
Southeast Asia : Net import

38
Petrochemical Outlook: ABS
World : ABS Supply & Demand
World: 2019 ABS Demand by Region
World : ABS Capacity Addition by Region
World : ABS Demand by Application

Appendix
0.31
0.19
-0.04
0.04
-0.26
0.46 0.48
0.56
0.38
-0.06
0.08 0.10 0.08
0.22 0.230.29
0.10
0.08 0.08 0.10
0.100.04
0.09
0.180.12
0.19
2010 2011 2012 2013 2014 2015 2016 2017 2018 2019
EPS
Year Dividend
1H Dividend
2H Dividend
40
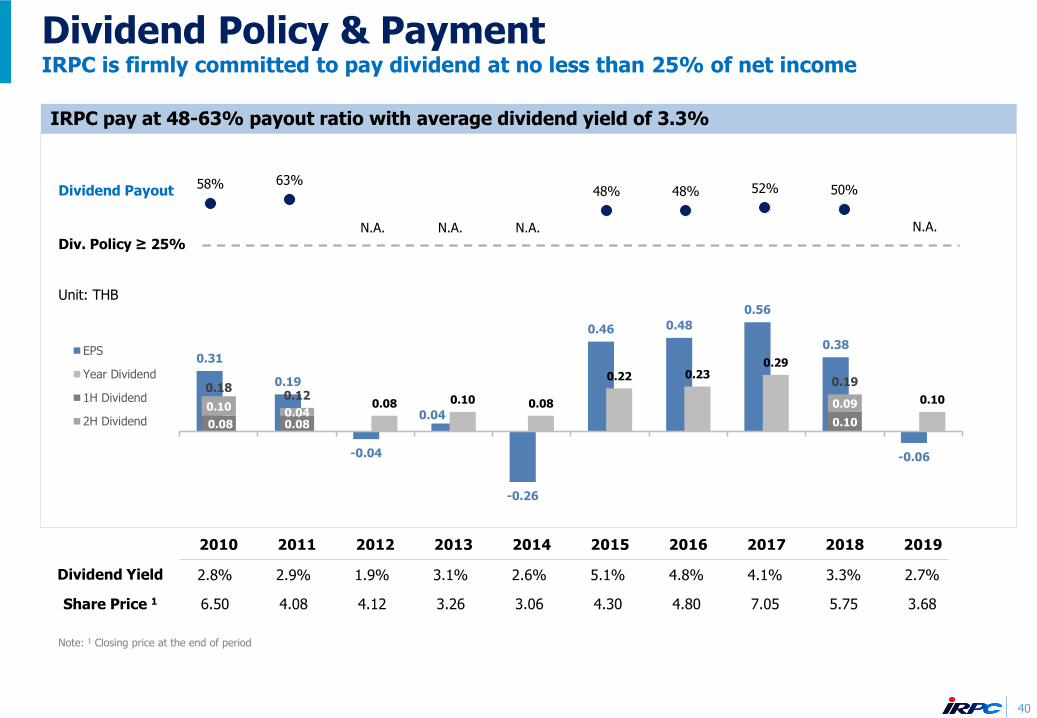
Dividend Policy & PaymentIRPC is firmly committed to pay dividend at no less than 25% of net income
58% 63%
25% 25% 25%
48% 48% 52% 50%
25%
Dividend Yield 2.8% 2.9% 1.9% 3.1% 2.6% 5.1% 4.8% 4.1% 3.3% 2.7%
Share Price 1 6.50 4.08 4.12 3.26 3.06 4.30 4.80 7.05 5.75 3.68
IRPC pay at 48-63% payout ratio with average dividend yield of 3.3%
Dividend Payout
Unit: THB
Div. Policy ≥ 25%
Note: 1 Closing price at the end of period
N.A.N.A.N.A. N.A.
41
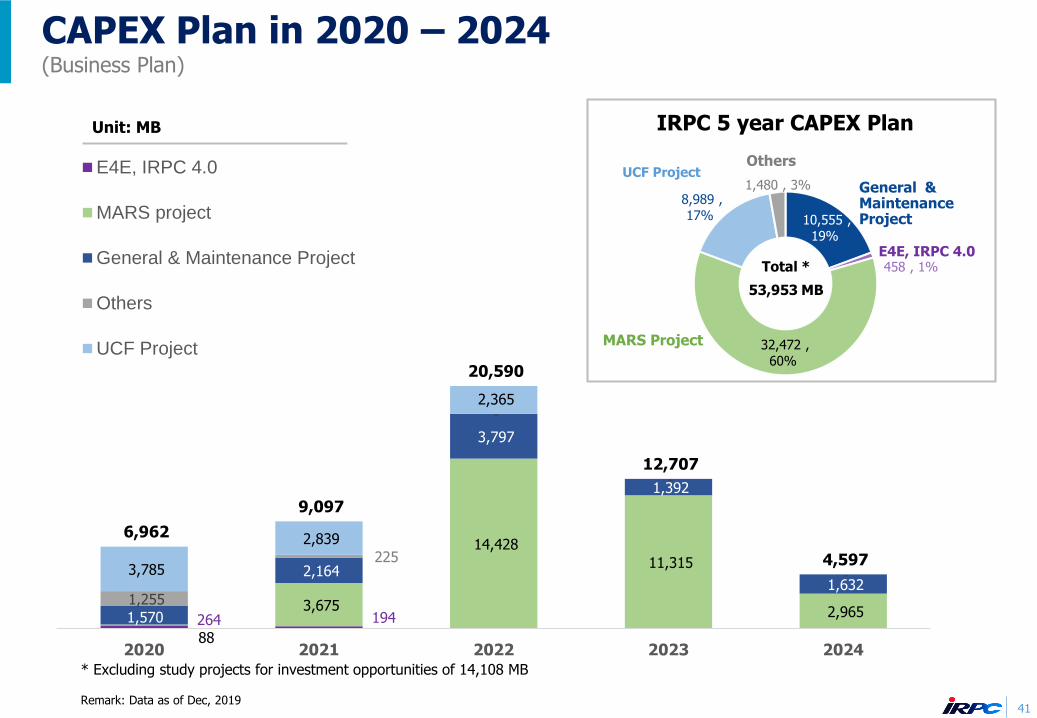
CAPEX Plan in 2020 – 2024(Business Plan)
264 194
88
3,675
14,428
11,315
2,965 1,570
2,164
3,797
1,392
1,632 1,255
225
-
-
-3,785
2,839
2,365
6,962
9,097
20,590
12,707
4,597
2020 2021 2022 2023 2024
E4E, IRPC 4.0
MARS project
General & Maintenance Project
Others
UCF Project
Unit: MB
10,555 ,
19%
458 , 1%
32,472 ,
60%
8,989 ,
17%
1,480 , 3%
IRPC 5 year CAPEX Plan
General & Maintenance Project
E4E, IRPC 4.0
Others
Total *
53,953 MB
UCF Project
MARS Project
* Excluding study projects for investment opportunities of 14,108 MB
Remark: Data as of Dec, 2019
42
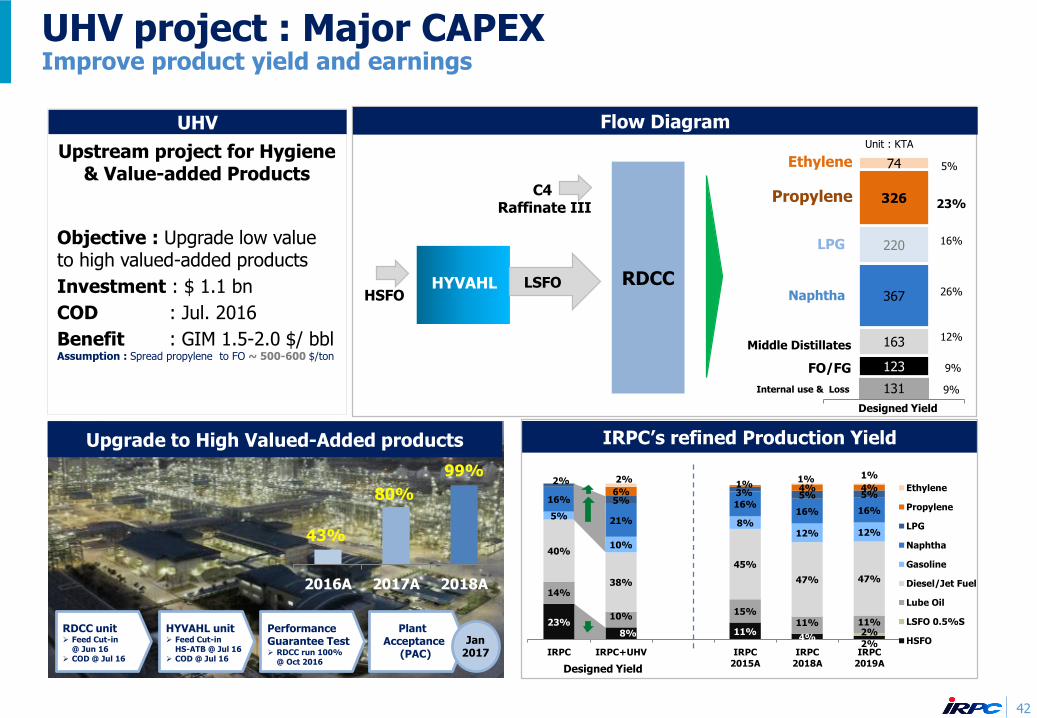
UHV project : Major CAPEXImprove product yield and earnings
IRPC’s refined Production Yield
Upstream project for Hygiene & Value-added Products
Objective : Upgrade low value to high valued-added products
Investment : $ 1.1 bn
COD : Jul. 2016
Benefit : GIM 1.5-2.0 $/ bblAssumption : Spread propylene to FO ~ 500-600 $/ton
RDCC unit Feed Cut-in
@ Jun 16 COD @ Jul 16
HYVAHL unit Feed Cut-in
HS-ATB @ Jul 16 COD @ Jul 16
Performance Guarantee Test RDCC run 100%
@ Oct 2016
Plant Acceptance
(PAC)
Jan 2017
43%
80%
99%
2016A 2017A 2018A
Upgrade to High Valued-Added products
131
123
163
367
220
326
74
HSFO
LPG
Ethylene
HYVAHL
Propylene
Naphtha
FO/FG
Middle Distillates
RDCC
C4 Raffinate III
Internal use & Loss
Unit : KTA
16%
5%
23%
9%
9%
26%
12%
Flow Diagram
LSFO
UHV
Designed Yield
23%8% 11%
4%2%
2%
14%
10%15%
11% 11%
40%
38%
45%
47% 47%
5%
10%
8%12% 12%
16%
21%
16%16% 16%
2%
5%3% 5% 5%6%1% 4% 4%
2% 1% 1%
IRPC IRPC+UHV IRPC2015A
IRPC2018A
IRPC2019A
Ethylene
Propylene
LPG
Naphtha
Gasoline
Diesel/Jet Fuel
Lube Oil
LSFO 0.5%S
HSFO
Designed Yield

CompoundingHouse
PP inline compound
43
PPE&PPC Benefit EnhancementFulfill UHV benefits thru higher margin on PPE & PPC
Random PP• Pipe grade• Hygiene
Super Clear PP• Container box• Medical Device
Block-CO PP• Household Material• Heavy-duty
HOMO PP• Film application• Fiber grade
PP Specialty•Frozen food packaging•Lamination•Health care
PP Compound• Automotive:
pumper, instrument panel, etc
PPE 160 KTA PPC 140 KTA
Total PP 775 KTA in 2017
PP Existing 475 KTA
PP Expansion and PP Compound Project
Lower cost : PPC production by Inline process technology
Note: Cost Saving • No Packing & Logistic• No 2nd Extruder Process
PP Marketing Strategy : Sales Plan
Y2017
Volume: 600 Ktons
Y2022
Volume: 760 Ktons
PP Expansion Project (PPE) Licensor : Novolen Capacity : 160 KTA PMC : Foster Wheeler EPC : Sinopec
• CAPEX : $ 236 mn• GIM 0.8-1.0 $/bbl• COD : 4Q17
Random PP4%
Homo PP
75%
Block-CO PP21%
PP Compound11%
Random PP10%
Homo PP
58%
Block-CO PP21%
PP Compound & Specialties (PPC) Licensor : JPP Capacity : 140 KTA PMC : Foster Wheeler EPC : Sinopec

(46)
13
(22)
34
(4)
27 42
2018 2019 1H19 1H20 2Q19 1Q20 2Q20
44
Petroleum Spread
518 490 478 529 473 536 524
2018 2019 1H19 1H20 2Q19 1Q20 2Q20
447 321 308 371
287 370 372
2018 2019 1H19 1H20 2Q19 1Q20 2Q20
(2.6) (4.9)(0.9)
(4.5) (2.3)(7.4)
(1.6)
2018 2019 1H19 1H20 2Q19 1Q20 2Q20
14.6 13.7 12.6 8.4
12.4 11.0 5.7
2018 2019 1H19 1H20 2Q19 1Q20 2Q20
10.5 9.0 5.6 4.6
7.5 6.7 2.6
2018 2019 1H19 1H20 2Q19 1Q20 2Q20
500SN – FO 180 3.5%S Spread
150 BS – FO 180 3.5%S Spread
Asphalt – FO 180 3.5%S Spread
$/BBL
$/BBL
$/BBL
Lube Base SpreadRefinery Spread
Gas oil - Dubai
ULG 95 - Dubai
HSFO - Dubai
(2.4)(6.6) (8.3)
(3.0)(9.1)
(2.9) (3.0)
2018 2019 1H19 1H20 2Q19 1Q20 2Q20
Naphtha - Dubai$/BBL
$/TON
$/TON
$/TON
YoY 28%
YoY 5%
YoY 128%
YoY 88%
YoY 6%
YoY 14%
YoY – N/A
QoQ 61%
QoQ 48%
QoQ 78%
QoQ 3%
YoY – n.a.
YoY 33%
YoY 18%
YoY 64%YoY 20%
YoY 11%
YoY 255%
QoQ 1%
QoQ 2%
QoQ 56%

60.83 57.99
29.08 26.13 14.92 13.42 12.72
7.01 6.88
3.52 3.48 1.71 1.74 1.73
67.84 64.87
32.60 29.61 16.63 15.16 14.45
2018 2019 1H19 1H20 2Q19 1Q20 2Q20
Lube Base
Refinery
2Q20 Market GRM was $2.57/bbl QoQ: $1.73/bbl increase as sharply decrease in crude premium YoY: $0.13/bbl decline as lower products spread VS lower crude premium
45
Petroleum Business2019: Dropping products spread led to lower GRM1H20 : Weaker products spread during COVID-19 pandemic led to lower Mkt GRM
Refinery ProductionCrude Intake
Unit : Mbbl
3.52 1.14 1.15
0.23 1.47
(0.85)
1.29
1.68
1.31 1.16 1.48 1.23
1.69 1.28
5.20 2.45 2.31 1.71
2.70
0.84 2.57
2018 2019 1H19 1H20 2Q19 1Q20 2Q20
Lube Base
Refinery
Crude intake (Mbbl)
Market GRMSales Volume & Revenue
Unit : $/bbl
Sales Volume
Revenue
66% 69% 69% 72% 71% 72% 72%
34% 31% 31% 28% 29% 28% 28%
2018 2019 1H19 1H20 2Q19 1Q20 2Q20
Sweet Crude
Sour Crude
208 197
163,724 136,670 70,341 42,450 37,005 26,384 16,066
19,229 16,781
8,899 6,576 4,462 3,860 2,716
182,953 153,451
79,240 49,026 41,467 30,244 18,782
2018 2019 1H19 1H20 2Q19 1Q20 2Q20
Lube Base
Refinery
YoY 38% (price 29%, volume 9% )
206 188 189 Crude Run (KBD)
97% 92%
2019 MKT GRM was $2.45/bbl: $2.75/bbl decrease as lower petroleum spread, especially Diesel and Gasoline
3.23 3.46 2.45 2.09 2.79 5.31 (0.81)Premium over Dubai ($/bbl)
YoY 5%
63% 68% 67% 71% 69% 71% 72%
15% 17% 16% 17% 11% 16% 18%8% 6% 6% 5%6%
5% 4%14% 9% 11% 7%
14%8% 5% Others
Domestic
Far East
Middle East
96% 87% 88% % Utilization
YoY 4%
YoY 55%(price 42%, volume 13%)
YoY 4%
YoY 16% (price 12%, volume 4%)
Unit : Mbbl
Unit : MB
YoY 13%
QoQ 5%
YoY 9%
YoY 11%
QoQ 1% YoY 8%
36.75 34.2918.78 17.10 17.18
1H20 MKT GRM was $1.71/bbl: $0.60/bbl decrease as lower petroleum spread, especially Diesel and Gasoline, amid COVID-19 outbreak
QoQ 38%(price 33%, volume 5%)
YoY 5%
QoQ 206%YoY 53%
203 188
89% 87%
YoY 9%
QoQ 0.4% YoY 7%
97% 92% 94% 88% 96% 87% 88% % Utilization
85% 82% 83% 83% 82% 79% 87% Lube Base
99% 102% 92% 86% 114% 93% 79% RDCC
YoY 26%
76.05 72.00

Petrochemical Spread
1,272 934 977 905 955 892 919
2018 2019 1H19 1H20 2Q19 1Q20 2Q20
123 121 101 100 108 123 76
2018 2019 1H19 1H20 2Q19 1Q20 2Q20
526 301 346 261 283 240 283
360
298 329 331 395 315 346
886
599 675 592 678 555 629
2018 2019 1H19 1H20 2Q19 1Q20 2Q20
Ethylene-NP HDPE-Ethylene
196 169 159 136 164 148 124
2018 2019 1H19 1H20 2Q19 1Q20 2Q20
912724 775 663 763 678 649
2018 2019 1H19 1H20 2Q19 1Q20 2Q20
375 316 287 359 255 347 370
278 256 314 197 337 180 215
653 572 601 556 592 527 585
2018 2019 1H19 1H20 2Q19 1Q20 2Q20
Propylene-NP PP-Propylene
HDPE-Ethylene –Naphtha Spread
PP-Propylene –Naphtha Spread
MX – Naphtha SpreadToluene – Naphtha Spread
PS –Naphtha SpreadABS –Naphtha Spread
Ole
fin
sS
tyre
nic
sA
rom
ati
cs
46
YoY 32%
YoY 2%
YoY 27%
$/TON
YoY 12%
YoY 14%
YoY 21%
$/TON
$/TON
YoY 7%
YoY 14%
YoY 14%
QoQ 13% QoQ 11%
QoQ 38%
QoQ 4% QoQ 3%
QoQ 16%
YoY 12%
YoY 1%
YoY 7%

2.64 1.53 1.56 1.22 1.68 1.20 1.23
4.68 3.53 3.87 3.43 3.51 3.40 3.43
7.32
5.06 5.43 4.65 5.19 4.60 4.66
2018 2019 1H19 1H20 2Q19 1Q20 2Q20
Olefins &Polyolefins
Aromatics &Styrenics
28,760 21,985 11,456 8,543 5,813 4,407 4,136
43,980 37,671
19,523 14,687 9,536 8,090 6,597
72,740
59,656
30,979 23,230
15,349 12,497 10,733
2018 2019 1H19 1H20 2Q19 1Q20 2Q20
Olefins &Polyolefins
Aromatics &Styrenics
47
Petrochemical Group2019 : According to Trade War, products spread dropped caused the decrease PTF1H20 : Mkt PTF dropped as low products spread according to the COVID-19 outbreak
Production
Market PTF
Sales Volume and Revenue
728 702 359 344 178 155 188
1,107 1,117
553 535 270 274 262
1,835 1,819
912 879
449 429 450
2018 2019 1H19 1H20 2Q19 1Q20 2Q20
Olefins &Polyolefins
Aromatics &Styrenics
Revenue
YoY 1%
Unit : KMT
Crude intake (Mbbl)
Unit : $/bbl
400 395 208 192 100 92 100
28 9
3 9 3 8 1
338 300
134 164 84 81 83
295 246
132 119 64 60 59
807 828
405 402
219 209 193
1,868 1,777
882 886
471 450 437
2018 2019 1H19 1H20 2Q19 1Q20 2Q20
Polyolefins
Olefins
Polystyrenics
Styrenics
Aromatics
Unit : KMT Sales Volume
Unit : MB
YoY 5%
YoY 31%
YoY 30%(price 30%)
QoQ 14%(price 19%, volume 5%)
YoY 18%(price 17%, volume 1%)
YoY 1 %
YoY 4%
YoY 25%(price 21%, volume 4%)
YoY 14%
1H20 : Petrochemical revenue was Bt 23 bn YoY : 25% decrease from 21% price decrease & 4% volume decrease
1H20 Market PTF was $4.65/bbl: YoY : $0.78/bbl decrease as lower products spread through the COVID-19 outbreak
94% 95% 94% 93% 99% 95% 91% % Utilization
90% 92% 90% 88% 97% 92% 85% Polyolefins
100% 98% 99% 99% 101% 99% 98% Olefins
101% 93% 91% 95% 99% 94% 95% % Utilization
93% 83% 79% 87% 88% 88% 85% Polystyrenics
110% 94% 82% 104% 107% 105% 102% Styrenics
103% 101% 106% 96% 105% 93% 100% Aromatics
2Q20 : Petrochemical revenue was Bt 11 bn QoQ : 14% decrease from 19% price decrease VS 5% vol. increase YoY : 30% decrease from 30% price decrease
2Q20 Market PTF was $4.66/bbl:
QoQ : Unchanged as higher Olefins products spread VS lower Aromatics products spread
YoY : $0.53/bbl decrease as lower products spread
2019 : Petrochemical revenue was Bt 60 bn YoY : 18% decrease from 17% price decrease & 1% vol. decrease
2019 Market PTF was $5.06/bbl: YoY : $2.26/bbl decrease as lower products spread through trade war tension
YoY 7%
QoQ 3%
QoQ 5%
YoY - n.a.
76.05 72.0036.75 34.29
18.78 17.10 17.18
QoQ - Unchanged
YoY 10%

1,947 2,071
1,045 1,010
511 505 505
1,034 1,153
587 603
311 308 295
245
246
126 118
64 63 55
3,226 3,470
1,758 1,731
886 876 855
2018 2019 1H19 1H20 2Q19 1Q20 2Q20
Other
Steam
Electricity
48
Power & Utility
Utilization Rate
GIM
Revenue
YoY 2%
1.08 1.19
1.16 1.28
1.22 1.32
1.23
2018 2019 1H19 1H20 2Q19 1Q20 2Q20
Power &Utility
Unit : $/bbl
Unit : MB
79% 71% 71% 70% 74% 71% 70%
2018 2019 1H19 1H20 2Q19 1Q20 2Q20
Electricity
79%60% 61% 65% 63% 66% 63%
2018 2019 1H19 1H20 2Q19 1Q20 2Q20
Steam
YoY 10%
YoY 19%
YoY 8%
YoY 4%
YoY 1%
QoQ 7%YoY 10%
QoQ 2%
YoY 3%
YoY 8%
YoY 1%
2019 U-Rate of Steam was 60%; 19%2019 U-Rate of Electricity was 71%; 8% YoY : decrease due to the planned shutdown of RDCC plant
2019 : Power & Utility revenue was 3,470 MB YoY : 8% increase from higher electricity sales vol. & avg. selling prices of steam
YoY - Unchanged
QoQ 3%
YoY 4%
QoQ 1%
1H20 U-Rate of Steam was 65%; 4% YoY : increase after industrial area customers return to normal operations
1H20 U-Rate of Electricity was 70%; 1% 1H20 : Power & Utility revenue was 1,731 MB YoY : 2% decrease from lower electricity sales vol. to EGAT
2Q20 U-Rate of Steam was 63%; 3% QoQ, Unchanged YoY QoQ : decrease due to planned maintenance shutdown of the industrial area
customers 2Q20 U-Rate of Electricity was 70%; 1% QoQ, 4% YoY
YoY : decrease owing to lower u-Rate of refinery 2Q20 : Power & Utility revenue was 855 MB; 2% QoQ, 3% YoY QoQ & YoY : decrease owing to lower selling price of steam and electricity
following lower fuel price

Accounting GIM
2019 Acct GIM was $9.0/bbl, YoY: $4.1/bbl due to $0.3/bbl net stock gain compared to net stock loss of $0.5/bbl in
2018 & $4.9/bbl lower market GIM
1H20 Acct GIM was $1.48/bbl,
YoY: $8.46/bbl due to $6.16/bbl net stock loss compared to net stock gain of $1.04/bbl in 1H19 and $1.26/bbl lower market GIM
2Q20 Acct GIM was $8.63/bbl,
QoQ: $14.47/bbl due to $0.17/bbl net stock gain compared to net stock loss of $12.66/bblin 1Q20 and $1.64/bbl higher of market GIM
YoY: $1.31/bbl due to $0.66/bbl lower net stock gain and $0.65/bbl lower market GIM
2.64 1.53 1.56 1.22 1.68 1.22 1.23
4.68 3.53 3.86 3.43 3.51 3.44 3.43
7.32 5.06 5.42 4.65 5.19 4.66 4.66
Aromatics&Styrenics Olefins
13.60 8.70 8.90 7.64 9.11 6.82 8.46
(0.51) (0.03)
0.64
(7.05)
0.05
(13.26)
(1.00)
0.01 0.30 0.40
0.89 0.78
0.60 1.17
13.10 8.97 9.94 1.48 9.94
(5.84)
8.63
Market GIM Stk G/(L) & LCM Hedging
5.20 2.45 2.31 1.71 2.70 0.84 2.57
7.32 5.06 5.43 4.65 5.19 4.66 4.66
1.08
1.19 1.16 1.28 1.22 1.32 1.23
13.60
8.70 8.90 7.64 9.11 6.82 8.46
Petroleum Petrochem Power & Utility
3.52 1.14 1.15
0.23 1.47
(0.85) 1.29
1.68
1.31 1.16 1.48 1.23
1.69 1.28
5.20
2.45 2.31 1.71 2.70
0.84 2.57
2018 2019 1H19 1H20 2Q19 1Q20 2Q20
Refinery Lube Base
12,858 5,504 2,695 1,864 1,610 449 1,415
18,085
11,379 6,336 5,080 3,090 2,503 2,577
2,663
2,672
1,356 1,390 729 713 677
33,607
19,555
10,387 8,334 5,429 3,665 4,669
2018 2019 1H19 1H20 2Q19 1Q20 2Q20
33,607 19,555
10,387 8,334 5,429
3,665 4,669
(1,268) (62)
747
(7,689)28
(7,134)(555)
30
676 464 967 463 323 644
32,370
20,169 11,598 1,612
5,920
(3,146)
4,758
2018 2019 1H19 1H20 2Q19 1Q20 2Q20
Market GIM
Unit: $/bbl
Accounting GIM
Unit: $/bbl
Unit: MB
Market GIM by business
Unit: $/bblPetrochemical
Petroleum
Unit: MB
49
Gross Integrated Margin (GIM)2019: The market downturn towards global threaten had led to the decline in MKT GIM1H20 : Lower Mkt GIM & net stock loss led to a decrease in A/C GIM
YoY 36%
YoY 32%
YoY 42%
YoY 38%
YoY 7%
QoQ 24% YoY 14%
YoY 14%
QoQ 27%YoY 20%
YoY 85%
YoY 86%
Market GIM
2019 Market GIM was $8.70/bbl, YoY: $4.9/bbl due to lower products spread
1H20 Market GIM was $7.64/bbl, YoY: $1.26/bbl due to lower products spread
2Q20 Market GIM was $8.46/bbl, QoQ: $1.64/bbl due to lower crude premium vs lower products spread YoY: $0.65/bbl due to lower products spread vs lower crude premium
YoY 13%
QoQ 248%
YoY 20%
QoQ 251%

50
Net Profit: 2Q20 VS 1Q20Better net stock gain improved less net loss
1,004
Net Loss 1Q20
Margin Net Stock gain
OPEX & Selling
Exp.
UnrealizedOil
Hedging
Financial Derivatives
FX Tax & Others
Net Loss 2Q20
Operating Income 38%
Net Income 95%(8,905) (411)
(1,821) (1,127)
Unit: MB

51
Net Profit: 1H20 VS 1H19Net Stock loss, loss on CCS and unrealized Oil hedging resulted in net loss
(2,053)
Net Gain 1H19
Margin Net Stock Loss
OPEX & Selling
Exp.
UnrealizedOil
Hedging
Financial Derivatives
FX Tax & Others
Net Loss 1H20
Operating Income 281%
Net Income – n.a.660 (9,316)
(775) (2,949)
Unit: MB
ST Loan18%
LT Loan (USD)8%
LT Loan (THB)64%
Bond (THB)10%
Leasing0.4%
3,747 6,444 6,943 7,369
18,087 926 - 1,235 1,235
1,852
-
6,889 - -
-
4,673
13,333
8,178 8,604
19,940
2020 2021 2022 2023 >2023
THB BondUSD LoanTHB Loan
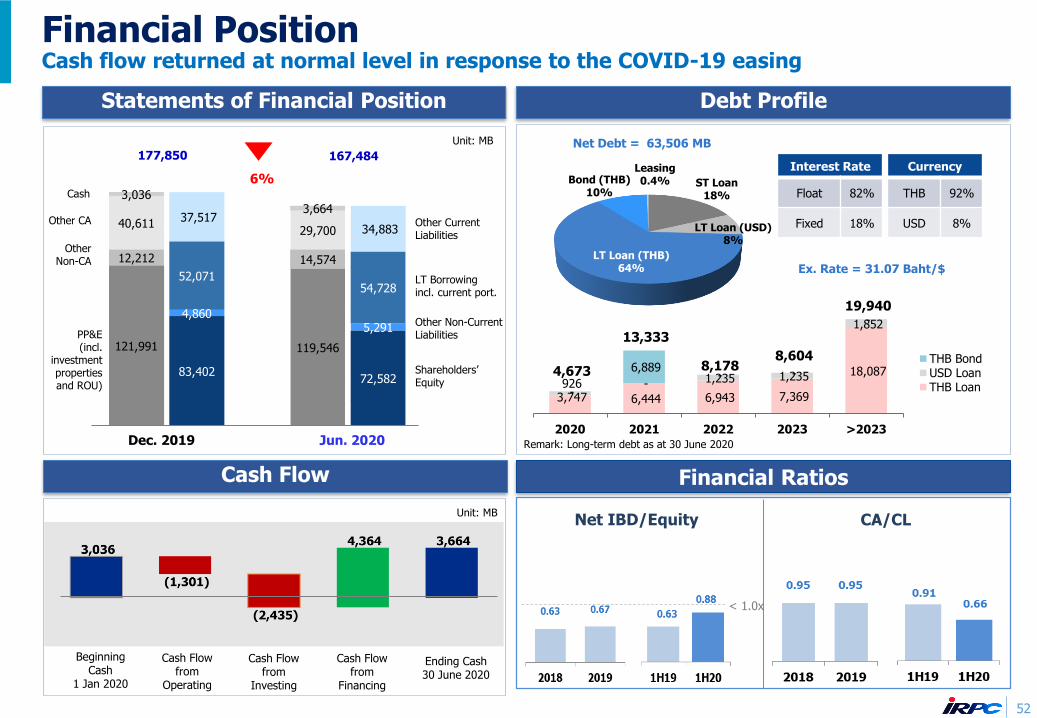
52
Financial PositionCash flow returned at normal level in response to the COVID-19 easing
121,991 119,546
12,212 14,574
40,611 29,700
3,036 3,664
83,402 72,582
4,860 5,291
52,071 54,728
37,517 34,883
Debt ProfileStatements of Financial Position
Cash Flow
Remark: Long-term debt as at 30 June 2020
Unit: MB
PP&E(incl.
investment properties and ROU)
Other Non-CA
Cash
Other CurrentLiabilities
LT Borrowing incl. current port.
Shareholders’Equity
Jun. 2020Dec. 2019
Other CA
Other Non-CurrentLiabilities
Beginning Cash
1 Jan 2020
Ending Cash30 June 2020
Cash Flow from
Operating
Unit: MB
Cash Flow from
Investing
Cash Flow from
Financing
Net Debt = 63,506 MB
Ex. Rate = 31.07 Baht/$
Financial Ratios
177,850 167,484Interest Rate Currency
Float 82% THB 92%
Fixed 18% USD 8%
6%
< 1.0x
Net IBD/Equity CA/CL

53
Important Events in History
2009 2011 2013 2015 2016
HISTORY
KEY MILESTONES OF THE DECADE
• Increased refinery capacity from 65 kbd to 215 kbd
• Entered Rehabilitation Plan
Successful Rehabilitation new major shareholders:
Founded by “Leophairatana” Family as TPI
IPO Restructuring Plan was approved
Exited from Rehabilitation
plan and Registered as
IRPC Plc.
Operated first LDPE plant in
SEA
Debt Moratorium
MOF was appointed as plan
administrator
1978 1982 1995 1997 2000 2003 2004 2005 2006
Efficiency improvement#1 under “DELTA” Project
Capacity Increase: ABS/SAN to 179 KTA
Efficiency improvement#2 :
Launched “EVEREST” project
Business Improvement under Phoenix
Project
Commenced operation of
Combined Heat and Power Project
(CHP I)
• Commenced UHV project in July 2016
• PTT 31.5%• Gov’t (Vayupak) Fund
10%• Gov’t Saving Bank 10%• Gov’t Pension Fund
Group 10%
UHV: Upstream Project for Hygiene and Value Add Products
2017
• Commenced PPE project in Sept. 2017
• Commenced PPC project in Dec. 2017
2018
• Launched “GDP” project : Growth, Digital, People

Plant
2020
Jan Feb Mar Apr May Jun Jul Aug Sep Oct Nov Dec Total
Pe
tro
leu
m
ADU1 0
ADU2 0
Hyvahl 31 31
RDCC 0
LUBE 0
Pe
tro
ch
em
ica
l
EBSM 0
HDPE 6 6 12
PP 20 20
ABS/SAN 23 23
PS 13 13
54
Maintenance Shutdown Plan 2020

This presentation material has been prepared solely for informational purposes only. IRPC is furnishing it solely for use by prospective investors / analysts in the
proposed event. IRPC makes no representations or warranties as to the accuracy or completeness of such information. By accepting this material each recipient
agrees that IRPC shall not have any liability for any representations (express or implied) contained in, or for any omissions from this presentation.
The information contained herein does not purport to be all-inclusive or to contain all of the Information that may be material to the recipient’s decision. Each recipient
of the information and data contained herein should perform its own independent investigation and analysis of the transaction and the creditworthiness of IRPC . Reference in this Disclaimer to this shall include references to the Appendices (if any) hereto.
Investor Relations Contact: [email protected]
Tel. +662-765-7380, Fax. +662-765-7379
Thank You
Disclaimers