irrigated sunflowers in northwest kansas: …
TRANSCRIPT
Proceedings of the 29th Annual Central Plains Irrigation Conference, Burlington, Colorado, Feb. 21-22, 2017
Available from CPIA, 760 N. Thompson, Colby, Kansas
143
IRRIGATED SUNFLOWERS IN NORTHWEST KANSAS: PRODUCTIVITY AND CANOPY FORMATION
Freddie R. Lamm
Research Agricultural Engineer Kansas State University
Northwest Research—Extension Center Colby, Kansas
Voice: 785-462-6281 Fax: 785-462-2315
Email: [email protected]
Robert M. Aiken Research Crop Scientist Kansas State University
Northwest Research—Extension Center Colby, Kansas
Voice: 785-462-6281 Fax: 785-462-2315
Email: [email protected]
Abdrabbo A. AbouKheira Assoc. Res. Prof. and Dept. Head
Agricultural Water Management and Irrigation Systems
Water Management Research Institute National Water Research Center
Barrage, Kaliobiya, Egypt Voice: +202-4218-9563 Fax: +202-4218-9561
Email: [email protected]
Gerald J. Seiler Research Botanist
Sunflower & Plant Biology Research Unit USDA-ARS, Northern Crop Science
Laboratory Fargo, North Dakota Voice: 701-239-1380 Fax: 701-239- 1346
Email: [email protected]
ABSTRACT
Sunflower was grown in a three year study (2009, 2010, and 2012) at the KSU Northwest Research-Extension Center at Colby, Kansas under a lateral move sprinkler irrigation system. Irrigation capacities were limited to not more than 1 inch every 4, 8, or 12 days but were scheduled only as needed as determined with a weather-based water budget. Achene (sunflower seed) yields and oil yield generally plateaued at the medium irrigation level. Dormant preseason irrigation increased achene yield and oil yield by 2% with most of this increase occurring in the extreme drought year, 2012. The optimum harvest plant population for sunflower in this study in terms of achene yield and oil yield was approximately 19,000 to 20,000 plants/acre.
INTRODUCTION
Sunflower is a crop of interest in the Ogallala Aquifer region because of its shorter growing season and thus lower overall irrigation needs. Sunflowers are thought to better withstand short periods of crop water stress than corn and soybeans and the timing of critical sunflower water needs is also displaced from those of corn and soybeans. Thus, sunflowers might be a good choice for marginal
144
sprinkler systems and for situations where the crop types are split within the center pivot sprinkler land area.
Center pivot sprinkler irrigation (CP), the predominant irrigation method in the Ogallala region, presents unique challenges when used for deficit irrigation. Center pivot sprinkler irrigation cannot be effectively used to apply large amounts of water timed to a critical growth stage as can be done with surface irrigation methods. The CP systems also cannot efficiently use small frequent events to alleviate water stress as is the case with subsurface drip irrigation (SDI). Thus with CP systems, it is important that available soil water in storage be correctly managed temporally in terms of additions and withdrawals so that best crop production can be achieved both economically and water-wise. Three easy ways to control irrigation water additions are irrigation capacity, preseason management, and the season initiation date. Withdrawals can be partially managed by plant population. This study examined sunflower production using the three methods of controlling irrigation additions for three different targeted plant populations.
PROCEDURES
The study was conducted from 2009 through 2012 at the KSU Northwest Research-Extension Center at Colby, Kansas under a lateral move sprinkler irrigation system. However, data from 2011 is excluded due to a devastating hail storm that destroyed the crop. Key agronomic characteristics of the annual tests are shown in Table 1.
Whole plot treatments were sprinkler irrigation capacities of 1 inch every 4, 8, or 12 days as limited by ET-based water budget irrigation scheduling. An additional whole plot irrigation factor was the addition or no addition of dormant preseason irrigation resulting in a total of 6 different irrigation treatments. The target preseason irrigation amount for those plots receiving it was 5 inches, but in 2012 a total of 9.2 inches of preseason irrigation was applied due to an application error. Three targeted plant populations 18,000, 23,000, or 28,000 plants/acre were superimposed on the whole plots for a grand total of 108 subplots. Irrigation amounts were 1 inch applied as needed, but limited by the imposed capacity and the water budget irrigation schedule. The whole plots (6 reps) were in a randomized complete block (RCB) design.
Table 1. Agronomic characteristics of an irrigated sunflower study conducted at the KSU Northwest Research-Extension Center, Colby, Kansas, 2009-2012. Data from 2011 are excluded due to devastating hail storm.
Characteristic 2009 2010 2012
Hybrid Triumph S6711 Triumph S671 Triumph S671
Planting date June 18 June 16 June 13
Emergence date June 25 June 24 June 26
Harvest date October 16 October 13 October 8
Rainfall, emergence to maturity (inches) 9.89 7.32 5.25
Preseason irrigation (inches) 5.0 5.0 9.2
First seasonal irrigation July 27 July 25 July 25
Last seasonal irrigation September 15 September 15 September 23
145
Soil water was measured periodically in each plot each crop season with a neutron probe to a depth of 8 feet in one foot increments. Crop water use was calculated as the sum of changes in soil water between emergence and physiological maturity, precipitation and irrigation amount. Crop water productivity (WP, also known as water use efficiency) was calculated as the achene yield in lbs/acre divided by the total crop water use in inches.
At R6 development stage and to maturity (R9 development stage), sunflower achene moisture content, dry mass and oil content were measured by collecting six achenes from each of five representative plants, semi-weekly. At maturity, sunflower heads were hand harvested from a representative sample area and threshed for yield and yield component determinations.
Leaf area index (LAI) was quantified, approximately bi-weekly, by a non-destructive light transmission technique (Welles, 1991; LAI-2000 Plant Canopy Analyzeri). Three sets of four below-canopy measurements were each referenced to an above-canopy measurement, minimizing sensor exposure to direct (beam) irradiance. Readings were screened against apparent transmittance ratios exceeding 1 using the manufacturer’s software, FV2000. An inverse solution to a model of light transmission through a vegetative canopy, provided by the manufacturer, was used to quantify apparent LAI.
Growing degree days (GDD) were calculated from daily temperature extremes (Equation 1) recorded at the NWREC weather station, using a mercury thermometer.
𝐺𝐷𝐷 = 𝑇𝑚𝑎𝑥−𝑇𝑚𝑖𝑛
2− 𝑇𝑏 Equation 1
Upper and lower limits to temperature extremes were 34 oC and 4 oC (93 oF and 39 oF), respectively. Cumulative GDD (cGDD) was computed by summation of GDD, commencing from planting date.
Statistical analysis utilized analysis of variance (ANOV) and analysis of covariance (ANCOV). Repeated measure of LAI and maximum LAI observed in a year were analyzed by ANOV, using Proc GLM from SAS Institute. Seasonal trends in LAI and were analyzed by ANCOV using third order linear terms of cGDD or days after planting (DAP) as covariates.
RESULTS
Weather Conditions
The crop year 2009 was very cool and wet and irrigation needs were low. In-season irrigation amounts for the 1 inch every 4 and 8 days treatments were 7.68, 6.72, and 4.80 inches, respectively. During the period April through October every month had above normal precipitation and between crop emergence and crop maturity the total precipitation was 9.89 inches.
The early portion of the crop year 2010 was wet and irrigation needs were lower than normal. However, later in season, it was extremely dry with only 1.08 inches of precipitation occurring between August 4 and crop maturity on October 11. Precipitation during the sunflower growing period totaled 7.32 inches. In-season irrigation amounts were 11.52, 6.72, and 4.8 inches for the irrigation capacities limited to 1 inch/4 days, 1 inch/8 days, and 1 inch/12 days, respectively. The 2010 sunflower irrigation amounts appear to be approximately 1 inch less than normal as estimated from long term (1972-2005) irrigation scheduling simulations conducted at Colby, Kansas.
146
Extreme drought conditions existed for all of 2012 and only 5.25 inches of precipitation occurred during the sunflower growing period. Additionally, temperatures of 100°F or greater occurred on 20 days between June 26 and August 15. Crop establishment may have been negatively affected by excessively hot temperatures (99 to 104°F) that occurred for the entire period between planting and emergence even though small amounts of irrigation kept sufficient amounts of water in the seed zone. Sunflower plant populations at harvest in 2012 averaged approximately 75% of levels that occurred in 2009 and 2010. In-season irrigation amounts were 13.94, 8.18, and 6.26 inches for the irrigation capacities limited to 1 inch/4 days, 1 inch/8 days and 1 inch/12 days, respectively.
Summarizing the weather conditions, the crop year 2009 was cooler and wetter than normal, the crop year 2010 was approximately normal though a severe drought began in early August, and the crop year 2012 was extremely hot and dry.
Crop Yields and Yield Components
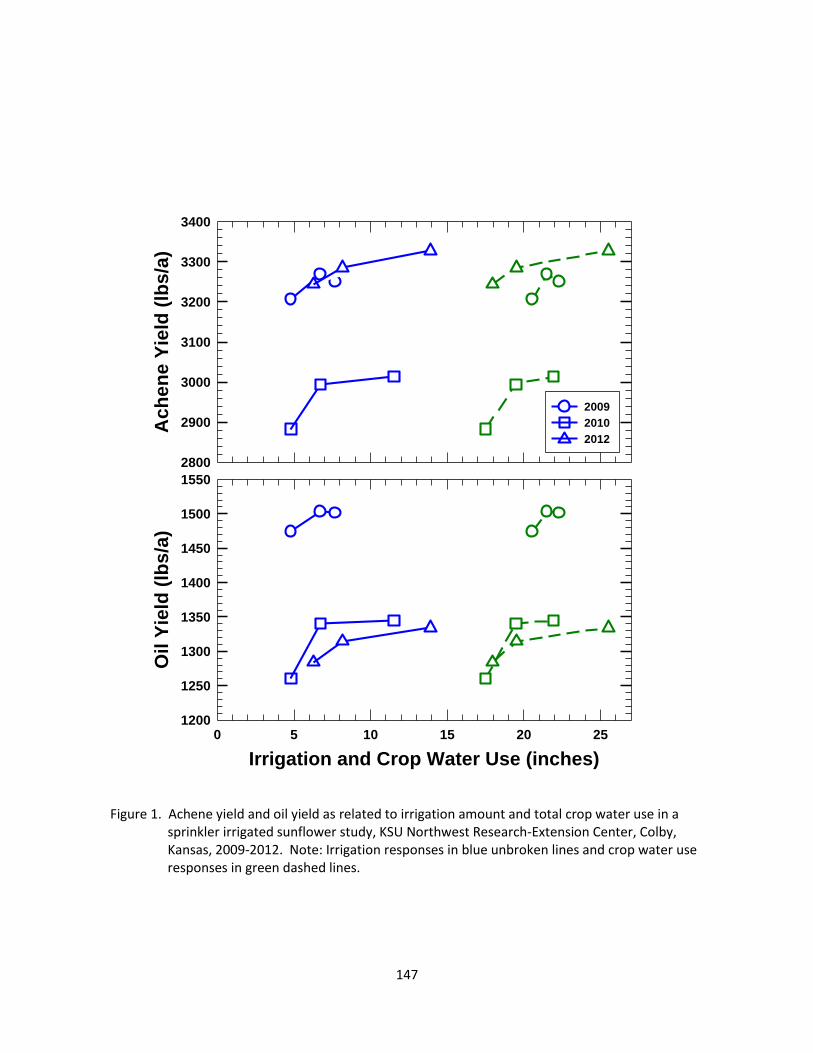
The addition of dormant preseason irrigation did not significantly increase yields in any of the three years (Tables 2, 3, and 4), but did increase achene yield and oil yield by 2%, when all years were analyzed together. Most of the increase in yield for preseason irrigation occurred in the extreme drought year, 2012. Preseason irrigation did significantly increase heads/plant in 2009 and harvest plant population in 2010, but these differences were only about 3% greater. There were no statistically significant differences in yield attributable to irrigation capacity in 2009 and 2012, but increased irrigation capacity did increase achene yield in 2010. Increased irrigation capacity tended to numerically increase achene and oil yield in all three years up through the 1 inch/8 day irrigation capacity but tended to have less or no response above that level. (Figure 1). Achene yields were lower in 2010 than in 2009 and 2012, but still were towards the upper range of yields for the region.
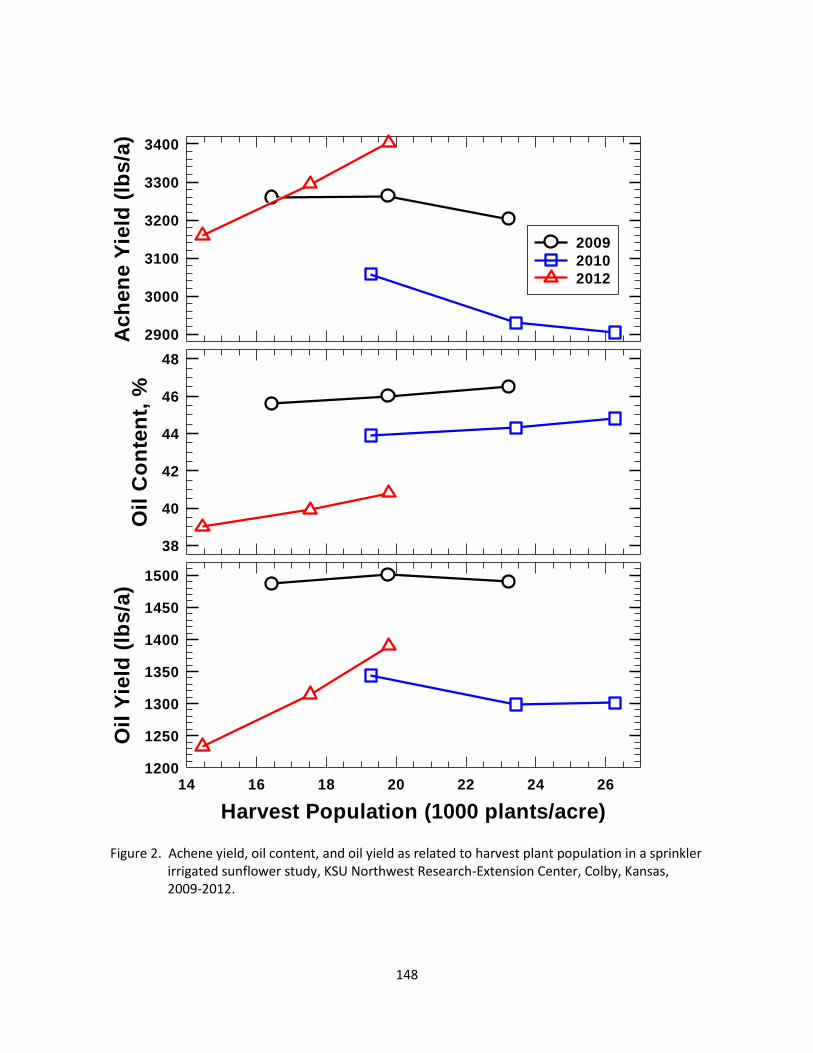
There were no plant population effects on achene yield in 2009, but increased plant population decreased achene yield in 2010 and increased achene yield in 2012 (Tables 2, 3 and 4). The difference between 2010 and 2012 responses is probably related to the differences in harvest plant populations between the two years. As indicated in earlier section, crop establishment was poor in 2012. Harvest plant populations in 2010 averaged 19,263, 23,426, and 26,257 plants/acre for the three respective targets as compared to the much lower 2012 values of 14,452, 17,530, and 19,781 plants/acre. Increasing plant population significantly decreased achenes/head in both 2009 and 2010 but had no consistent effect in 2012, once again probably because harvest plant populations were so low (Tables 2, 3 and 4). Increasing plant population significantly decreased achene mass and significantly increased achene oil content (percentage) in all three years. Within a given year average differences in oil content ranged from 1 to 2% as affected by plant population. Harvest plant populations above 19,000 to 20,000 plants/acre resulted in reduced achene yields and oil yields, but oil content was greatest at the greatest plant population in all three years (Figure 2).
Crop Water Use and Water Productivity
In-season crop water use was significantly increased by increased irrigation in all three years (Tables 2, 3, and 4 and Figure 1). However, crop water productivity (WP) was significantly reduced by increased irrigation in all three years. Irrigation amounts ranged from 4.80 to 7.68 inches in 2009, 4.80 to 11.52 inches in 2010, and 6.26 to 13.94 inches in 2012. Soil water depletion decreased with irrigation capacity (data not shown).
147
Figure 1. Achene yield and oil yield as related to irrigation amount and total crop water use in a sprinkler irrigated sunflower study, KSU Northwest Research-Extension Center, Colby, Kansas, 2009-2012. Note: Irrigation responses in blue unbroken lines and crop water use responses in green dashed lines.
Ac
he
ne
Yie
ld (
lbs
/a)
2800
2900
3000
3100
3200
3300
3400
2009
2010
2012
Irrigation and Crop Water Use (inches)
0 5 10 15 20 25
Oil
Yie
ld (
lbs
/a)
1200
1250
1300
1350
1400
1450
1500
1550
148
Ac
he
ne
Yie
ld (
lbs
/a)
2900
3000
3100
3200
3300
3400
2009
2010
2012
Harvest Population (1000 plants/acre)
14 16 18 20 22 24 26
Oil
Yie
ld (
lbs
/a)
1200
1250
1300
1350
1400
1450
1500
Oil
Co
nte
nt,
%
38
40
42
44
46
48
Figure 2. Achene yield, oil content, and oil yield as related to harvest plant population in a sprinkler irrigated sunflower study, KSU Northwest Research-Extension Center, Colby, Kansas, 2009-2012.
149
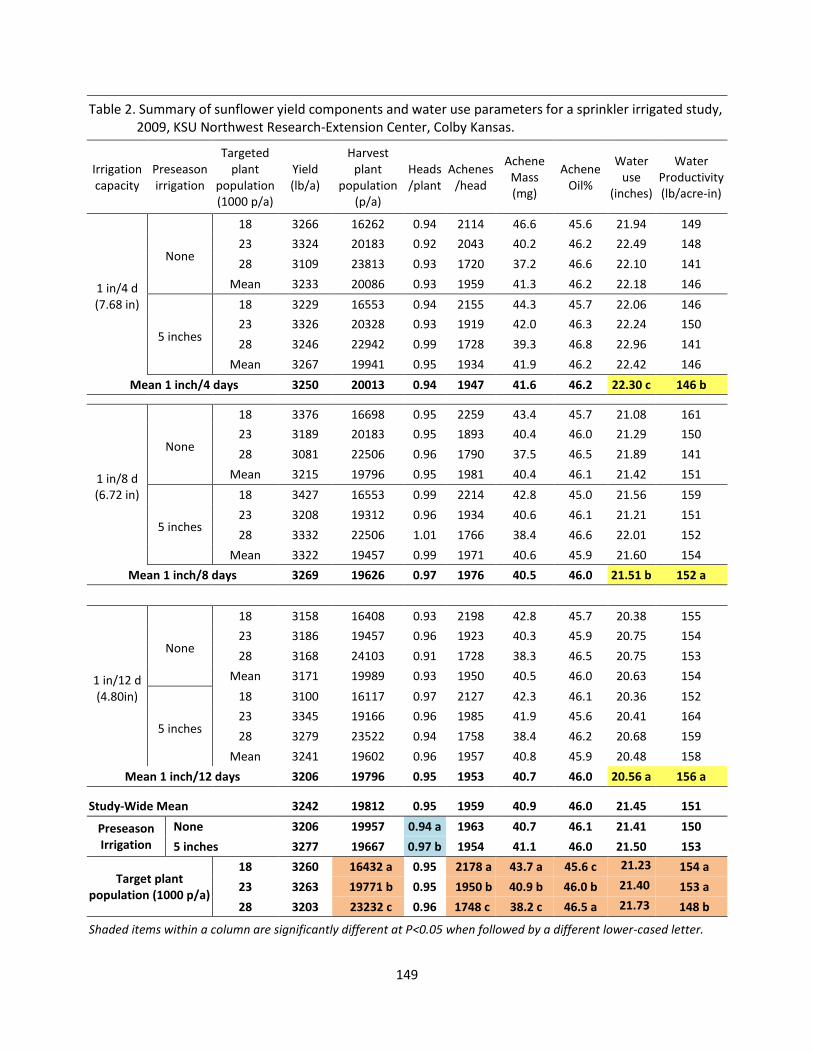
Table 2. Summary of sunflower yield components and water use parameters for a sprinkler irrigated study, 2009, KSU Northwest Research-Extension Center, Colby Kansas.
Irrigation capacity
Preseason irrigation
Targeted plant
population (1000 p/a)
Yield (lb/a)
Harvest plant
population (p/a)
Heads /plant
Achenes /head
Achene Mass (mg)
Achene Oil%
Water use
(inches)
Water Productivity (lb/acre-in)
1 in/4 d (7.68 in)
None
18 3266 16262 0.94 2114 46.6 45.6 21.94 149
23 3324 20183 0.92 2043 40.2 46.2 22.49 148
28 3109 23813 0.93 1720 37.2 46.6 22.10 141
Mean 3233 20086 0.93 1959 41.3 46.2 22.18 146
5 inches
18 3229 16553 0.94 2155 44.3 45.7 22.06 146
23 3326 20328 0.93 1919 42.0 46.3 22.24 150
28 3246 22942 0.99 1728 39.3 46.8 22.96 141
Mean 3267 19941 0.95 1934 41.9 46.2 22.42 146
Mean 1 inch/4 days 3250 20013 0.94 1947 41.6 46.2 22.30 c 146 b
1 in/8 d (6.72 in)
None
18 3376 16698 0.95 2259 43.4 45.7 21.08 161
23 3189 20183 0.95 1893 40.4 46.0 21.29 150
28 3081 22506 0.96 1790 37.5 46.5 21.89 141
Mean 3215 19796 0.95 1981 40.4 46.1 21.42 151
5 inches
18 3427 16553 0.99 2214 42.8 45.0 21.56 159
23 3208 19312 0.96 1934 40.6 46.1 21.21 151
28 3332 22506 1.01 1766 38.4 46.6 22.01 152
Mean 3322 19457 0.99 1971 40.6 45.9 21.60 154
Mean 1 inch/8 days 3269 19626 0.97 1976 40.5 46.0 21.51 b 152 a
1 in/12 d (4.80in)
None
18 3158 16408 0.93 2198 42.8 45.7 20.38 155
23 3186 19457 0.96 1923 40.3 45.9 20.75 154
28 3168 24103 0.91 1728 38.3 46.5 20.75 153
Mean 3171 19989 0.93 1950 40.5 46.0 20.63 154
5 inches
18 3100 16117 0.97 2127 42.3 46.1 20.36 152
23 3345 19166 0.96 1985 41.9 45.6 20.41 164
28 3279 23522 0.94 1758 38.4 46.2 20.68 159
Mean 3241 19602 0.96 1957 40.8 45.9 20.48 158
Mean 1 inch/12 days 3206 19796 0.95 1953 40.7 46.0 20.56 a 156 a
Study-Wide Mean 3242 19812 0.95 1959 40.9 46.0 21.45 151
Preseason Irrigation
None 3206 19957 0.94 a 1963 40.7 46.1 21.41 150
5 inches 3277 19667 0.97 b 1954 41.1 46.0 21.50 153
Target plant population (1000 p/a)
18 3260 16432 a 0.95 2178 a 43.7 a 45.6 c 21.23 a
154 a
23 3263 19771 b 0.95 1950 b 40.9 b 46.0 b 21.40 a
153 a
28 3203 23232 c 0.96 1748 c 38.2 c 46.5 a 21.73 b
148 b
Shaded items within a column are significantly different at P<0.05 when followed by a different lower-cased letter.
150
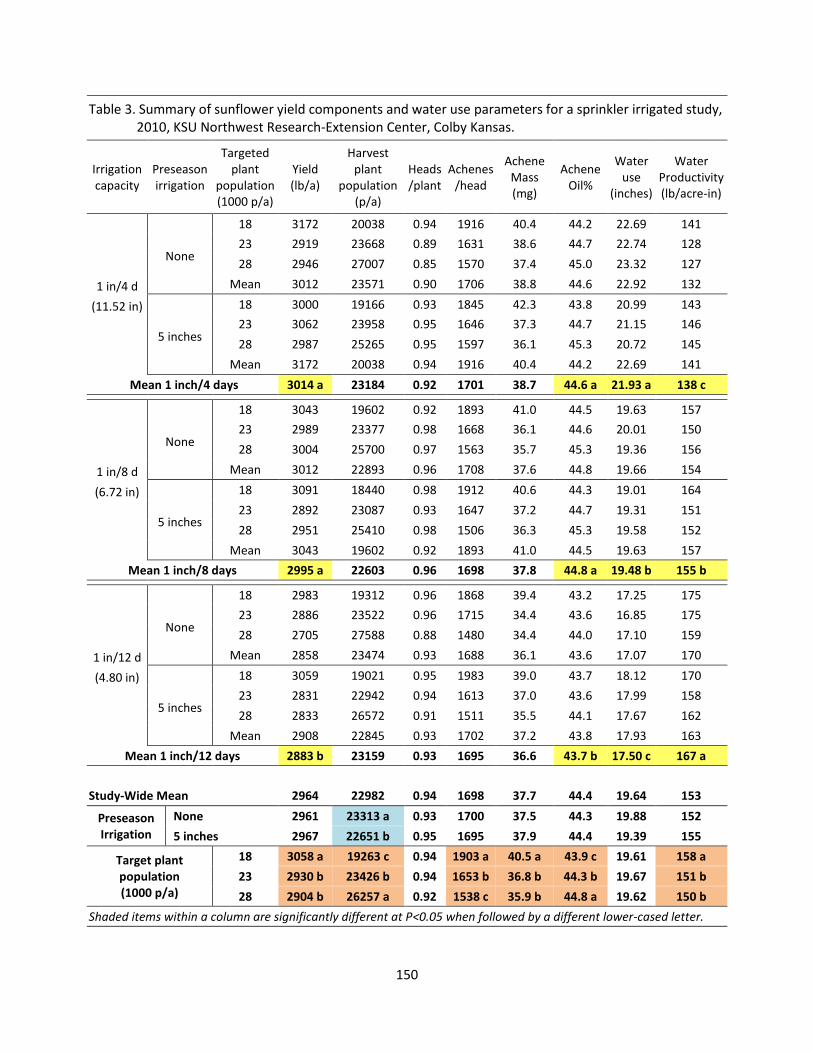
Table 3. Summary of sunflower yield components and water use parameters for a sprinkler irrigated study, 2010, KSU Northwest Research-Extension Center, Colby Kansas.
Irrigation capacity
Preseason irrigation
Targeted plant
population (1000 p/a)
Yield (lb/a)
Harvest plant
population (p/a)
Heads /plant
Achenes /head
Achene Mass (mg)
Achene Oil%
Water use
(inches)
Water Productivity (lb/acre-in)
1 in/4 d
(11.52 in)
None
18 3172 20038 0.94 1916 40.4 44.2 22.69 141
23 2919 23668 0.89 1631 38.6 44.7 22.74 128
28 2946 27007 0.85 1570 37.4 45.0 23.32 127
Mean 3012 23571 0.90 1706 38.8 44.6 22.92 132
5 inches
18 3000 19166 0.93 1845 42.3 43.8 20.99 143
23 3062 23958 0.95 1646 37.3 44.7 21.15 146
28 2987 25265 0.95 1597 36.1 45.3 20.72 145
Mean 3172 20038 0.94 1916 40.4 44.2 22.69 141
Mean 1 inch/4 days 3014 a 23184 0.92 1701 38.7 44.6 a 21.93 a 138 c
1 in/8 d
(6.72 in)
None
18 3043 19602 0.92 1893 41.0 44.5 19.63 157
23 2989 23377 0.98 1668 36.1 44.6 20.01 150
28 3004 25700 0.97 1563 35.7 45.3 19.36 156
Mean 3012 22893 0.96 1708 37.6 44.8 19.66 154
5 inches
18 3091 18440 0.98 1912 40.6 44.3 19.01 164
23 2892 23087 0.93 1647 37.2 44.7 19.31 151
28 2951 25410 0.98 1506 36.3 45.3 19.58 152
Mean 3043 19602 0.92 1893 41.0 44.5 19.63 157
Mean 1 inch/8 days 2995 a 22603 0.96 1698 37.8 44.8 a 19.48 b 155 b
1 in/12 d
(4.80 in)
None
18 2983 19312 0.96 1868 39.4 43.2 17.25 175
23 2886 23522 0.96 1715 34.4 43.6 16.85 175
28 2705 27588 0.88 1480 34.4 44.0 17.10 159
Mean 2858 23474 0.93 1688 36.1 43.6 17.07 170
5 inches
18 3059 19021 0.95 1983 39.0 43.7 18.12 170
23 2831 22942 0.94 1613 37.0 43.6 17.99 158
28 2833 26572 0.91 1511 35.5 44.1 17.67 162
Mean 2908 22845 0.93 1702 37.2 43.8 17.93 163
Mean 1 inch/12 days 2883 b 23159 0.93 1695 36.6 43.7 b 17.50 c 167 a
Study-Wide Mean 2964 22982 0.94 1698 37.7 44.4 19.64 153
Preseason Irrigation
None 2961 23313 a 0.93 1700 37.5 44.3 19.88 152
5 inches 2967 22651 b 0.95 1695 37.9 44.4 19.39 155
Target plant population (1000 p/a)
18 3058 a 19263 c 0.94 1903 a 40.5 a 43.9 c 19.61 158 a
23 2930 b 23426 b 0.94 1653 b 36.8 b 44.3 b 19.67 151 b
28 2904 b 26257 a 0.92 1538 c 35.9 b 44.8 a 19.62 150 b
Shaded items within a column are significantly different at P<0.05 when followed by a different lower-cased letter.
151
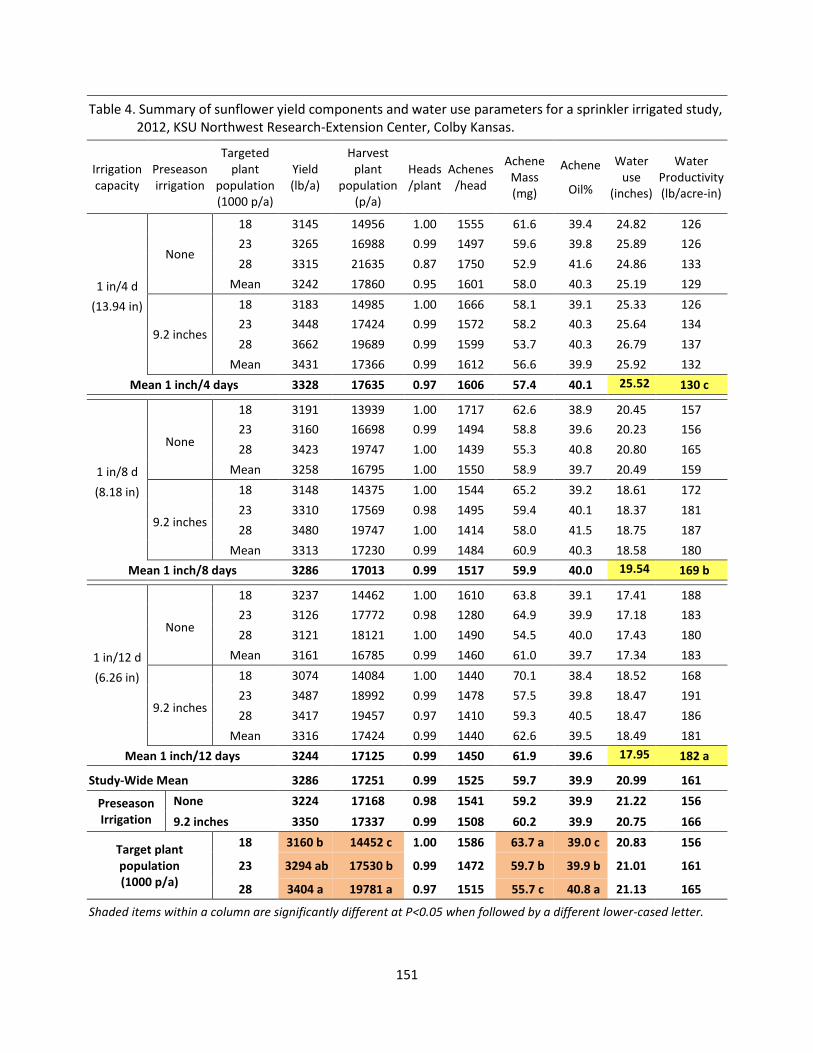
Table 4. Summary of sunflower yield components and water use parameters for a sprinkler irrigated study, 2012, KSU Northwest Research-Extension Center, Colby Kansas.
Irrigation capacity
Preseason irrigation
Targeted plant
population (1000 p/a)
Yield (lb/a)
Harvest plant
population (p/a)
Heads /plant
Achenes /head
Achene Mass (mg)
Achene
Oil%
Water use
(inches)
Water Productivity (lb/acre-in)
1 in/4 d
(13.94 in)
None
18 3145 14956 1.00 1555 61.6 39.4 24.82 126
23 3265 16988 0.99 1497 59.6 39.8 25.89 126
28 3315 21635 0.87 1750 52.9 41.6 24.86 133
Mean 3242 17860 0.95 1601 58.0 40.3 25.19 129
9.2 inches
18 3183 14985 1.00 1666 58.1 39.1 25.33 126
23 3448 17424 0.99 1572 58.2 40.3 25.64 134
28 3662 19689 0.99 1599 53.7 40.3 26.79 137
Mean 3431 17366 0.99 1612 56.6 39.9 25.92 132
Mean 1 inch/4 days 3328 17635 0.97 1606 57.4 40.1 25.52 a
130 c
1 in/8 d
(8.18 in)
None
18 3191 13939 1.00 1717 62.6 38.9 20.45 157
23 3160 16698 0.99 1494 58.8 39.6 20.23 156
28 3423 19747 1.00 1439 55.3 40.8 20.80 165
Mean 3258 16795 1.00 1550 58.9 39.7 20.49 159
9.2 inches
18 3148 14375 1.00 1544 65.2 39.2 18.61 172
23 3310 17569 0.98 1495 59.4 40.1 18.37 181
28 3480 19747 1.00 1414 58.0 41.5 18.75 187
Mean 3313 17230 0.99 1484 60.9 40.3 18.58 180
Mean 1 inch/8 days 3286 17013 0.99 1517 59.9 40.0 19.54 b
169 b
1 in/12 d
(6.26 in)
None
18 3237 14462 1.00 1610 63.8 39.1 17.41 188
23 3126 17772 0.98 1280 64.9 39.9 17.18 183
28 3121 18121 1.00 1490 54.5 40.0 17.43 180
Mean 3161 16785 0.99 1460 61.0 39.7 17.34 183
9.2 inches
18 3074 14084 1.00 1440 70.1 38.4 18.52 168
23 3487 18992 0.99 1478 57.5 39.8 18.47 191
28 3417 19457 0.97 1410 59.3 40.5 18.47 186
Mean 3316 17424 0.99 1440 62.6 39.5 18.49 181
Mean 1 inch/12 days 3244 17125 0.99 1450 61.9 39.6 17.95 c
182 a
Study-Wide Mean 3286 17251 0.99 1525 59.7 39.9 20.99 161
Preseason Irrigation
None 3224 17168 0.98 1541 59.2 39.9 21.22 156
9.2 inches 3350 17337 0.99 1508 60.2 39.9 20.75 166
Target plant population (1000 p/a)
18 3160 b 14452 c 1.00 1586 63.7 a 39.0 c 20.83 156
23 3294 ab 17530 b 0.99 1472 59.7 b 39.9 b 21.01 161
28 3404 a 19781 a 0.97 1515 55.7 c 40.8 a 21.13 165
Shaded items within a column are significantly different at P<0.05 when followed by a different lower-cased letter.
152
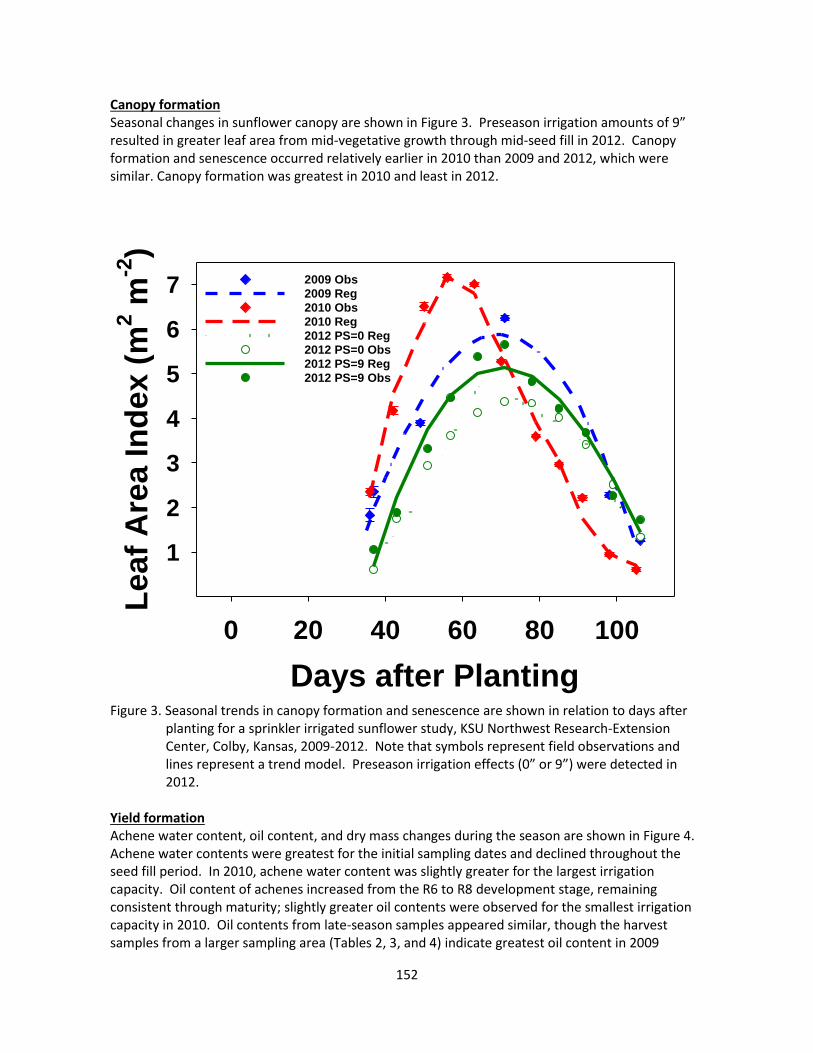
Canopy formation Seasonal changes in sunflower canopy are shown in Figure 3. Preseason irrigation amounts of 9” resulted in greater leaf area from mid-vegetative growth through mid-seed fill in 2012. Canopy formation and senescence occurred relatively earlier in 2010 than 2009 and 2012, which were similar. Canopy formation was greatest in 2010 and least in 2012.
Figure 3. Seasonal trends in canopy formation and senescence are shown in relation to days after
planting for a sprinkler irrigated sunflower study, KSU Northwest Research-Extension Center, Colby, Kansas, 2009-2012. Note that symbols represent field observations and lines represent a trend model. Preseason irrigation effects (0” or 9”) were detected in 2012.
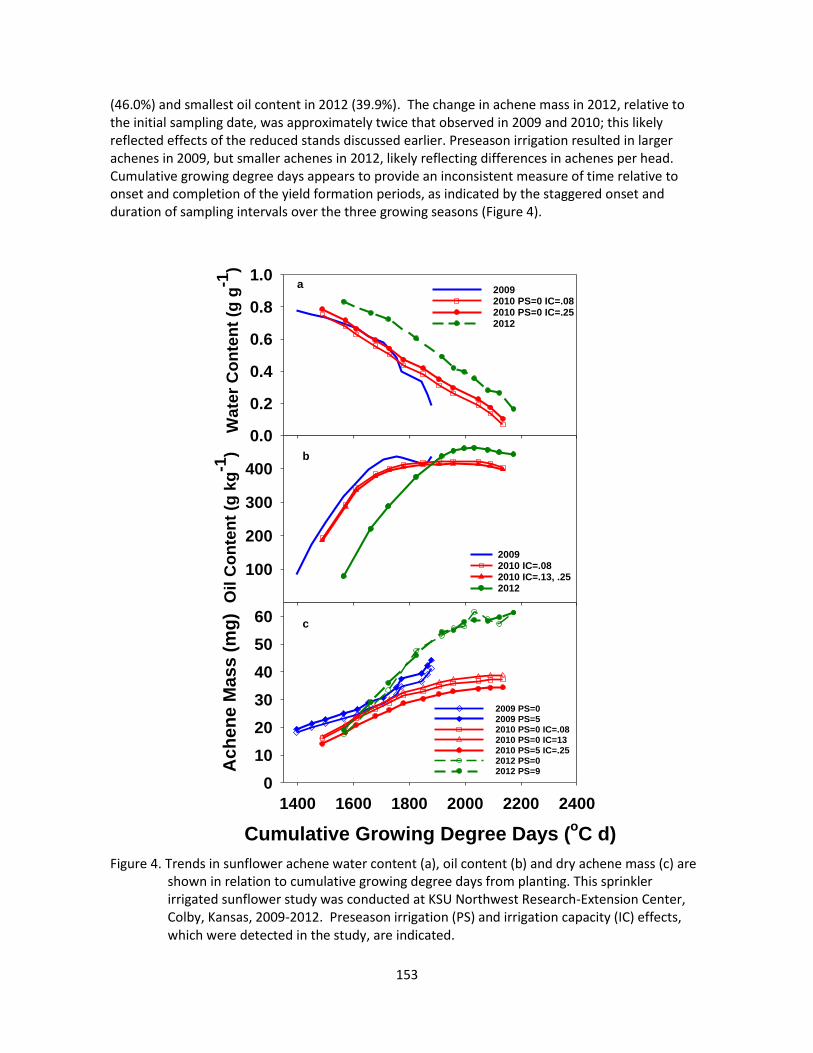
Yield formation Achene water content, oil content, and dry mass changes during the season are shown in Figure 4. Achene water contents were greatest for the initial sampling dates and declined throughout the seed fill period. In 2010, achene water content was slightly greater for the largest irrigation capacity. Oil content of achenes increased from the R6 to R8 development stage, remaining consistent through maturity; slightly greater oil contents were observed for the smallest irrigation capacity in 2010. Oil contents from late-season samples appeared similar, though the harvest samples from a larger sampling area (Tables 2, 3, and 4) indicate greatest oil content in 2009
Days after Planting
0 20 40 60 80 100
Le
af
Are
a I
nd
ex
(m
2 m
-2)
1
2
3
4
5
6
7 2009 Obs
2009 Reg
2010 Obs
2010 Reg
2012 PS=0 Obs
2012 PS=0 Reg
2012 PS=9 Reg
2012 PS=9 Obs
153
(46.0%) and smallest oil content in 2012 (39.9%). The change in achene mass in 2012, relative to the initial sampling date, was approximately twice that observed in 2009 and 2010; this likely reflected effects of the reduced stands discussed earlier. Preseason irrigation resulted in larger achenes in 2009, but smaller achenes in 2012, likely reflecting differences in achenes per head. Cumulative growing degree days appears to provide an inconsistent measure of time relative to onset and completion of the yield formation periods, as indicated by the staggered onset and duration of sampling intervals over the three growing seasons (Figure 4).
Figure 4. Trends in sunflower achene water content (a), oil content (b) and dry achene mass (c) are shown in relation to cumulative growing degree days from planting. This sprinkler irrigated sunflower study was conducted at KSU Northwest Research-Extension Center, Colby, Kansas, 2009-2012. Preseason irrigation (PS) and irrigation capacity (IC) effects, which were detected in the study, are indicated.
Cumulative Growing Degree Days (oC d)
1400 1600 1800 2000 2200 2400
Ach
en
e M
ass (
mg
)
0
10
20
30
40
50
60
2009 PS=02009 PS=52010 PS=0 IC=.082010 PS=0 IC=132010 PS=5 IC=.252012 PS=02012 PS=9
Oil
Co
nte
nt
(g k
g-1
)
100
200
300
400
20092010 IC=.082010 IC=.13, .252012
Wa
ter
Co
nte
nt
(g g
-1)
0.0
0.2
0.4
0.6
0.8
1.020092010 PS=0 IC=.082010 PS=0 IC=.252012
a
b
c
154
SUMMARY AND CONCLUSION
Sunflower was grown under sprinkler irrigation in Colby, Kansas for three very different crop years (2009, cool and wet year; 2010 near normal overall but very dry after flowering; and 2012, a severe drought year with high temperatures). Irrigation capacities were limited to not more than 1 inch every 4, 8, or 12 days but irrigation events were scheduled only as needed as determined with a weather-based water budget. Seasonal trends indicated earlier canopy formation, greatest canopy extent, and earliest senescence in 2010; least canopy extent developed in 2012. Seasonal trends were similar for achene water content (decreasing through maturity), oil content, and achene mass (increasing through R8 development stage). Achene yield was only statistically increased by irrigation in 2010, but tended to increase numerically up through the medium irrigation level (1 inch/8 days) in all three years. Similarly, oil yield plateaued at the medium irrigation level. Dormant preseason irrigation increased achene yield and oil yield by 2%. The optimum harvest plant population for sunflower in this study in terms of achene yield and oil yield was approximately 19,000 to 20,000 plants/acre.
ACKNOWLEDGEMENTS This work was partially supported by the Ogallala Aquifer Program administered by the USDA- ARS and also by the National Sunflower Association.
REFERENCES Welles, J.M. and Norman, J.M. (1991). An instrument for indirect measurement of canopy architecture. Agronomy J., 83:818-825
i Mention of tradenames is for informational purposes only and does not constitute endorsement by the authors or by the institutions they serve.