irrigation well impact analysis - wisconsin dnr
TRANSCRIPT

Always a better plan
100 Camelot Drive • Fond du Lac, WI 54935 • 920.926.9800 office • 920.926.9801 faxwww.excelengineer.com
Irrigation Well Impact Analysis
For
Proposed Golf Course – Town of Wilson
Town of Wilson, Wisconsin Job No: 1402630
March 25, 2015 Prepared By: Excel Engineering Inc. 100 Camelot Drive Fond du Lac, WI 54935 920-926-9800

2
Table of Contents
I. Executive Summary
II. Introduction
III. Irrigation Requirements
IV. Field Study
V. Analysis
VI. Conclusions
Attachments
Figure 1: Well Study Map
Figure 2: 72-Hour Drawdown Contour Map Figure 3: 190,000 GPD Drawdown Contour Map Figure 4: 334,000 GPD Drawdown Contour Map Appendix A: On-Site Well Logs Appendix B: Regional Well Logs Appendix C: Calculation Output

3
EXECUTIVE SUMMARY
Kohler Company has completed an irrigation well impact analysis to determine the potential for impacts to nearby residential wells and to the hydrology of nearby wetlands associated with a golf course irrigation system. Based upon the field investigation and pumping test completed the following conclusions have been drawn:
1) The drawdown associated with a 72-hour pumping test at 450 gallons per minute (gpm) does not exceed the average allowable drawdown in the neighboring wells.
2) The impact associated with pumping during an average year or drought year similar to 2012 is not anticipated to adversely impact the surrounding neighborhood.
3) The regional wetlands are not anticipated to be impacted by the drawdown associated with the irrigation well. Similarly, any domestic wells installed within the shallow aquifer (such as sand point wells) are not anticipated to be impacted.
4) In the event that an adjacent well exists that was constructed with far less than the average allowable drawdown, it may become necessary to lower the pump elevation within the existing well casing to provide additional allowable drawdown. Due to the artesian nature of the aquifer and the depth necessary to construct a well within the bedrock aquifer, this is considered a minor modification that would not necessitate additional drilling.
INTRODUCTION
Kohler Company has proposed construction of an 18-hole golf course in the Town of Wilson, Wisconsin. The golf course is proposed to be constructed immediately north of Kohler-Andrea State Park along Lake Michigan. The Kohler property does not have access to a municipal water supply and will require a private well be installed to provide water for irrigation. The purpose of this study is to determine what, if any, impacts could be associated with providing the irrigation water required for the golf course on nearby residential wells and on hydrology of the nearby wetlands.
IRRIGATION REQUIREMENTS
Based on the 18-hole historical irrigation records at the Kohler owned Blackwolf Run and Whistling Straits Golf Courses, long term average volumes of 15,000,000 to 25,000,000 gallons per year can be anticipated. The average pumping volume during the peak months of the last seven years at the Kohler golf courses was 190,000 gallons per day (gpd) per 18 holes, with a peak of 334,000 gpd during the driest months of the 2012 drought. These values will be used to analyze the anticipated impact of the irrigation system.
FIELD STUDY
Aquifer System - To determine how to provide sufficient irrigation flow rates and volumes a field study was completed to determine the hydraulic characteristics of the regional Silurian-Dovonian aquifer which is located within the dolomite bedrock. In the study area, ten wells were constructed at various depths (see Figure 1 – Well Study Map) to collect geologic and hydrologic information. Based upon the well logs (See Appendix A- On-Site Well Logs) the dolomite bedrock begins approximately 120 feet below land surface (bls) and extends to a depth of approximately 500 feet bls. The bedrock is overlain with a confining layer of up to 90 feet of clay which is overlain by a layer of sand to the land surface.

4
The field investigation identified two separate aquifers. The first aquifer was the shallow aquifer. This aquifer was located within the surficial sand layers between three feet bls and bottom of the sand layer. The second aquifer is the bedrock aquifer. This aquifer originates in the dolomite bedrock and is artesian in nature. Water elevations in the wells screened within the bedrock aquifer were at the ground surface or, in some cases, overflowing the well casing.
Pump Tests – Once the geology and aquifer systems were identified, two pump tests were completed to determine the regional ground water elevation drawdown associated with pumping from the bedrock aquifer. The tests were completed utilizing Well #3 as a pumping well and data loggers were installed in the remaining nine wells to observe the drawdown at varying distances from the pumping well. Well #3 is an 8” diameter well with a practical pumping limit of 450 – 500 gpm. Therefore, a 72-hour constant head rate pump test was completed at 450 gpm along with a step drawdown test. The tests were completed between October 20, 2014 and October 29, 2014 and the results are presented in Table 1 and Table 2 below along with the depth of each observation well and it’s distance from the pumping well.
Table 1 - Well Pumping Test Summary Table
Well Number
Well Depth (ft)
*Drawdown at end of 72 Hour Pump Test (ft)
Recovery Displacement (92 Hours after Pump Test Completed) (ft)
Distance from Pumping Well
(ft)
Notes
1 26’ +0.10 +0.32 266 No impact on shallow wells
2 536’ -26.13 +0.28 222 3
519’ -40.26 -0.26 0
Pumping Well
4 500’ -21.69 -0.25 208
5 25’ -0.02 +0.06 262 No impact on shallow wells
6 206’ -3.01 -0.05 2,228
Possible aquifer recharge area, minimally affected.
7 26’ -0.06 -0.13 2,380 No impact on shallow wells
8 220’ -13.92 -0.42 2,450 9 500’ -13.74 -0.32 2,995 10 500’ -10.72 -0.72 4,070 *The drawdown stabilized prior to completing the test

5
Table 2 - Step Test Results Table (Well #3)
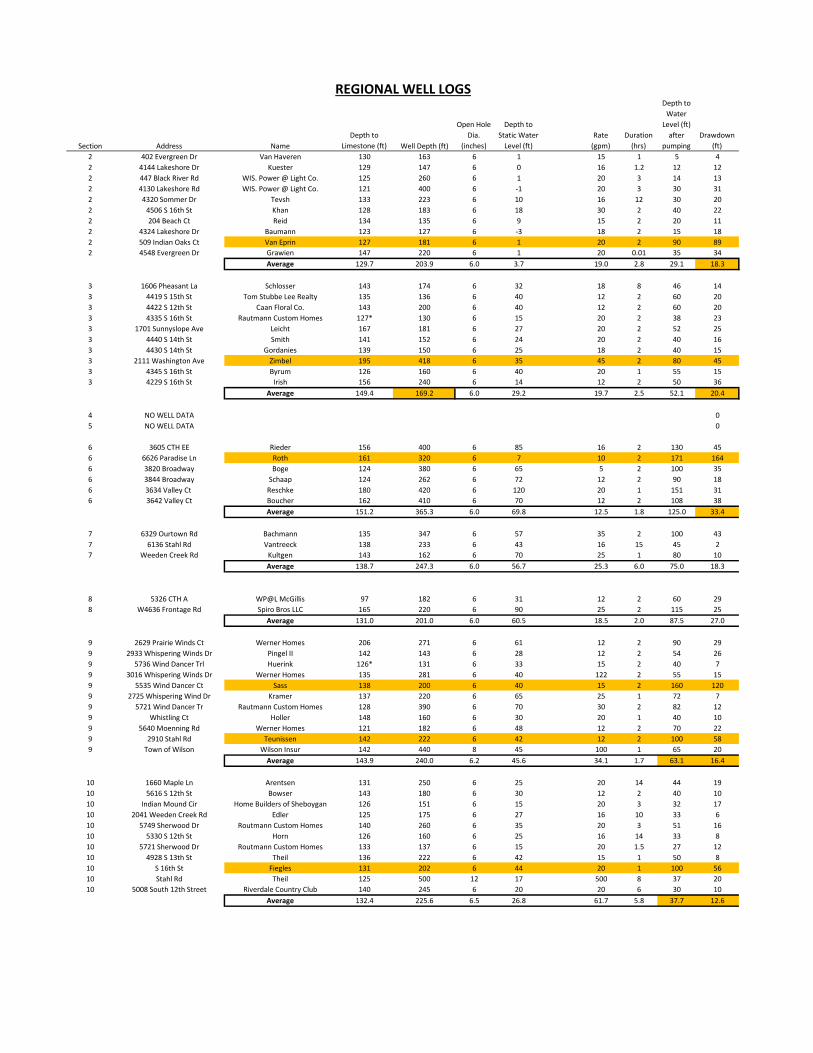
Regional Well Log Data -According to publically available well logs, the nearby residential wells are an average of 230 feet deep and utilize the artesian bedrock aquifer for potable water (See Appendix B – Regional Well Logs). Based upon standard installation practices and the well log information, regional well pumps are assumed to be set just beneath the drawdown elevation recorded during the pump test that was completed when the well was installed. Due to the artesian nature of the aquifer, the pump location is also typically in the upper half of the well casing. The difference between the static groundwater elevation and where the pump is set is considered the allowable drawdown. The average allowable drawdowns have been calculated for each of the neighboring Town Sections and are summarized in the analysis portion of this report in Table 3. The allowable drawdown per Section is also shown on Figures 2-4.
ANALYSIS
Utilizing the data provided by the pump tests in combination with the Theis Equation for a confined aquifer, the hydraulic characteristics of transmissivity and storativity were calculated to be 2.68 ft2/min. and 3.25x10⁻⁶ respectively. In addition, it should be noted that groundwater elevations returned to normal within 92 hours of completing the constant head pumping test. The analyses include:
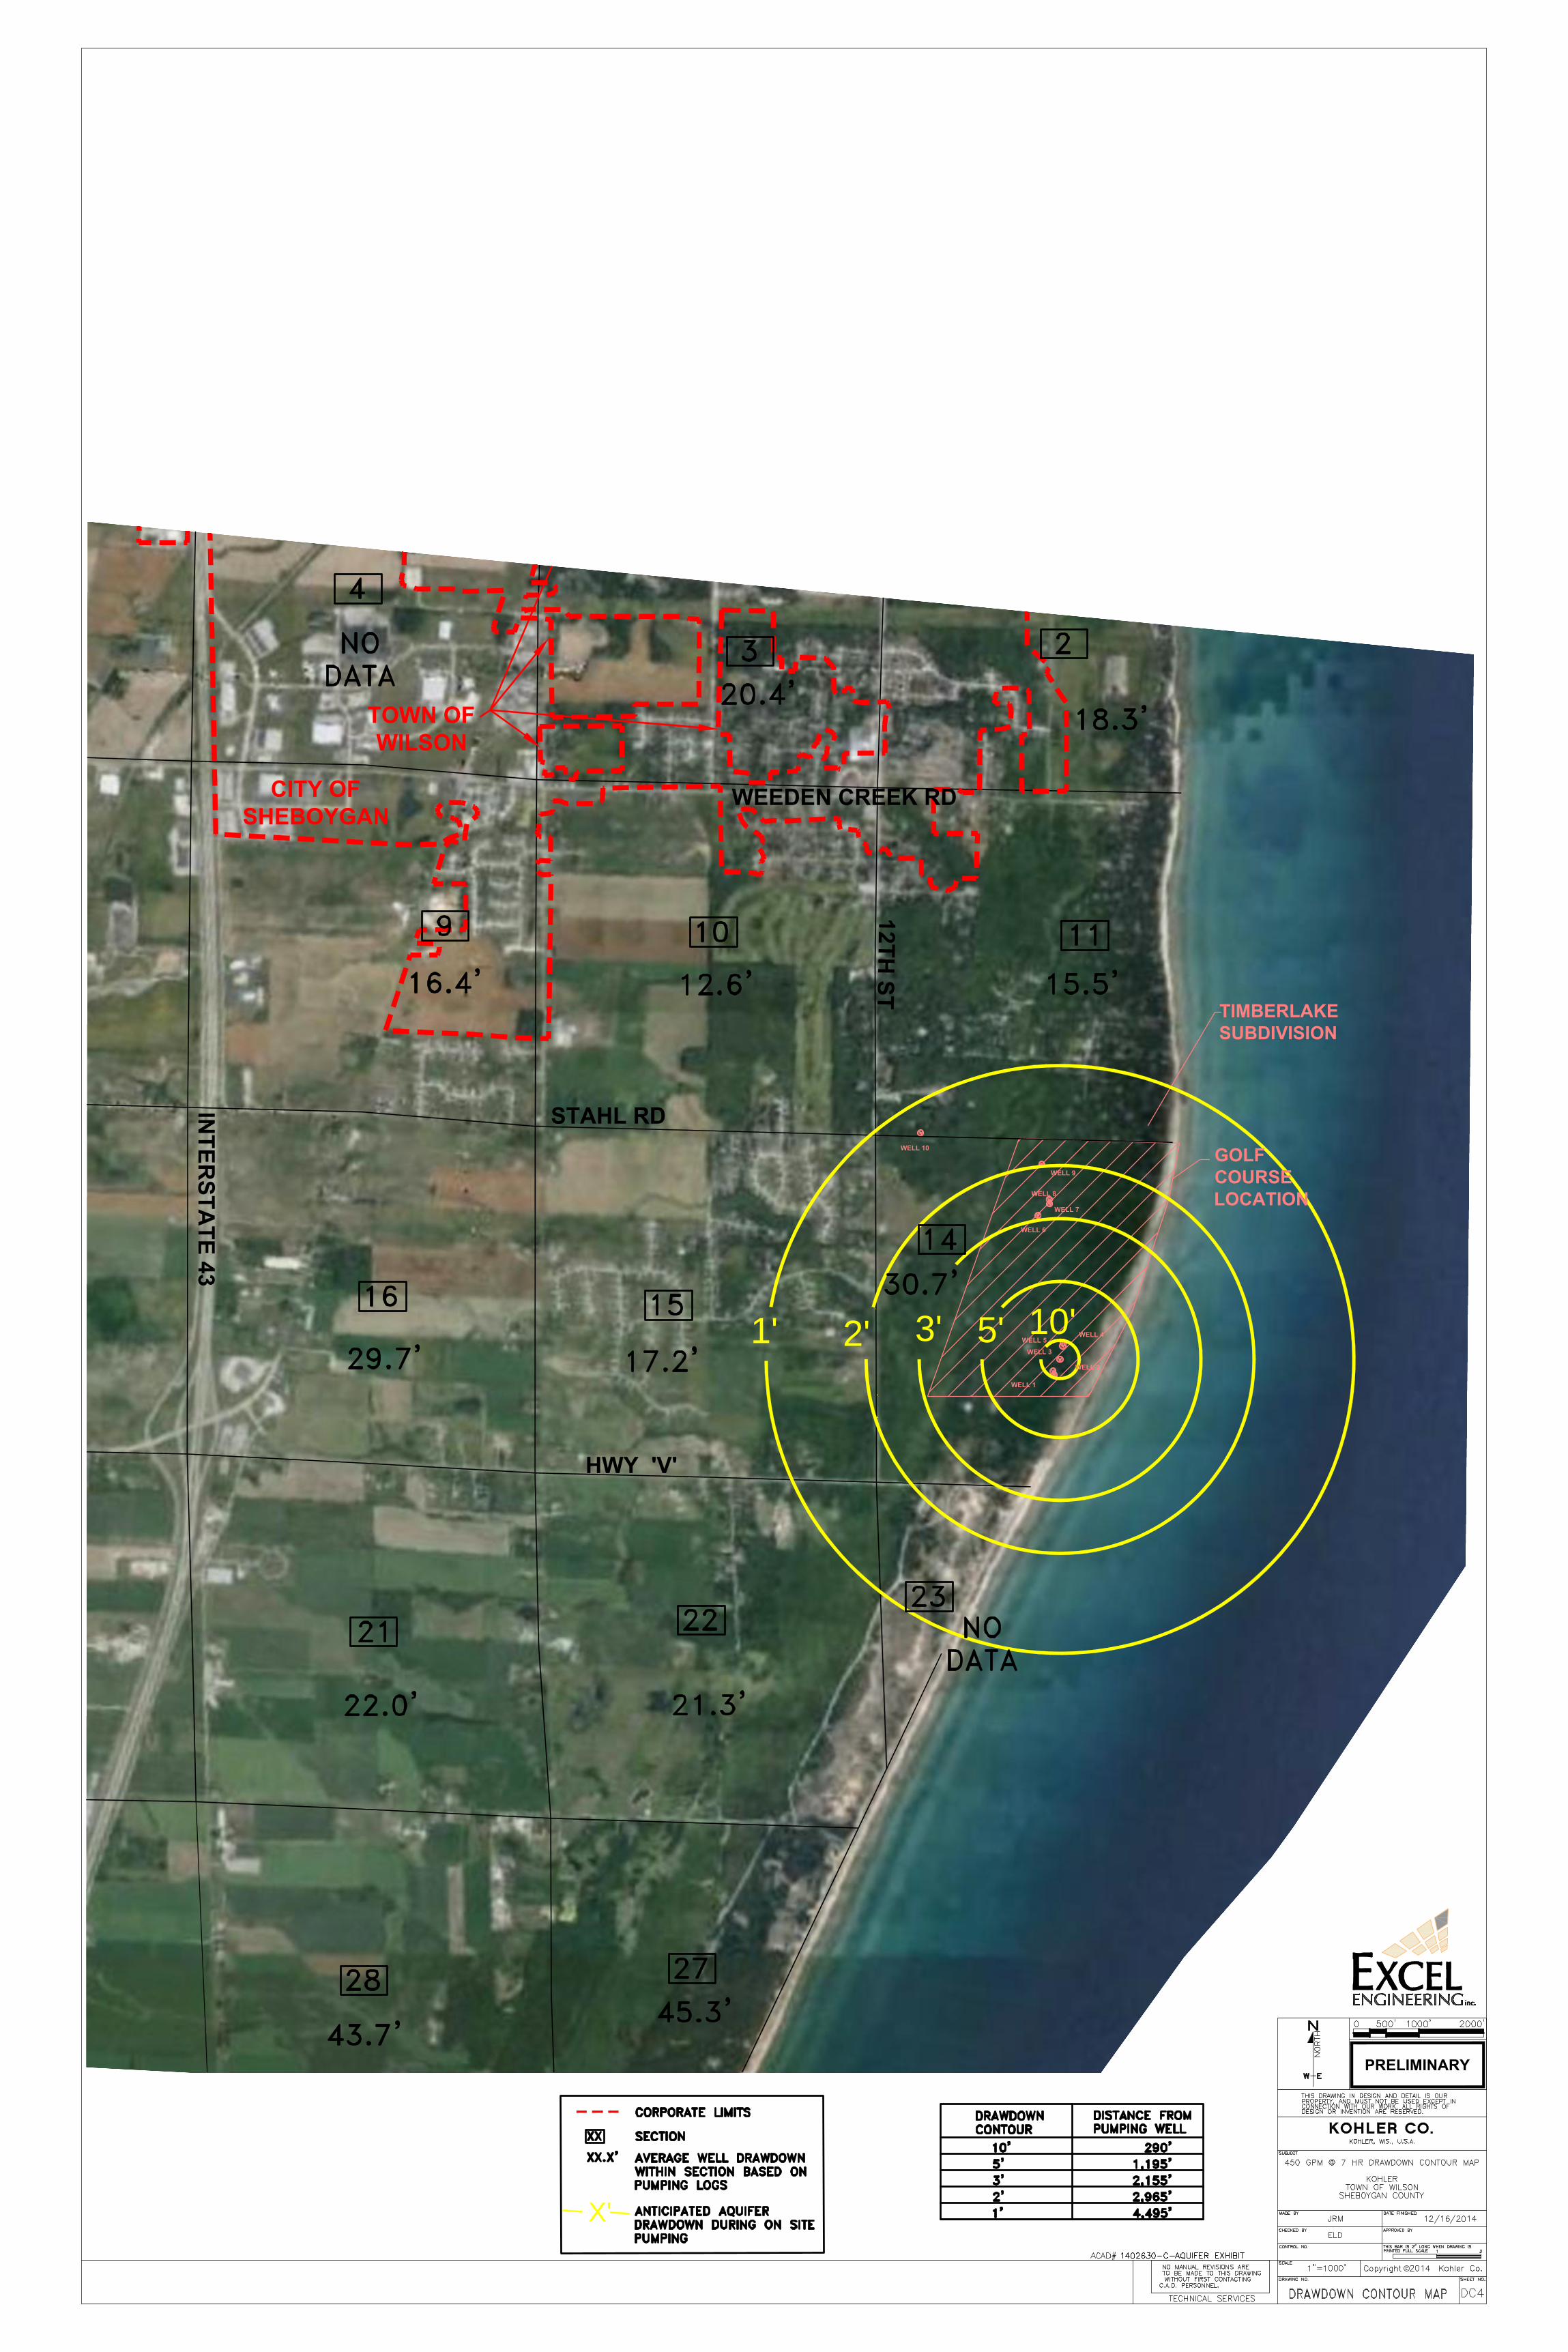
Results of the Constant Head Pumping Test- A drawdown curve was prepared based upon data collected during the 72-hour pump test. The nearest residential wells are located on the southern limit of the Timberlake subdivision approximately 3,500 from the pumping well (#3). The curve developed reveals an anticipated drawdown of between 10-15 feet in this location (See Figure 2 – Drawdown Contour Map). Anticipated drawdowns by Town Section are summarized in Table 3.
Based upon the analysis, the drawdown after 72 hours of pumping at 450 gpm does not result in drawdowns that exceed the average allowable drawdown. It is worthy to note that no complaints were received regarding problems experienced by the neighbors as a result of the 72-hour constant head pumping test. Based upon these results, the drawdown impact to the neighboring residential wells is minimal.
The Impact of Pumping 190,000 gallons per Day on the Neighboring Residential Wells –The average pumping volume (at Kohler’s other courses) during the peak months over the past seven years is 190,000 gallons per day. This is equal to pumping 450 gpm for seven hours a day. The calculated drawdown curve developed for this scenario reveals an anticipated drawdown of between 1-2 feet in the nearby Timberlake subdivision. The drawdown curve further indicates that at distances greater than one mile
GPM
Displacement at end of One Hour Pumping (ft)
100 Flowing 200 7.9 300 22.8 400 26.6

6
from the pumping well, the drawdown is expected to be less than one foot. (See Figure 3 – 190,000 GPD Drawdown Map).
Based upon the anticipated drawdowns summarized in Table 3, the impact associated with pumping 190,000 gallons per day is less than normal seasonal fluctuations in the bedrock groundwater elevations.
The Impact of Pumping 334,000 gallons per Day on the Neighboring Residential Wells – The average pumping volume (at Kohler’s other courses) during the driest months of the 2012 drought year was 334,000 gallons per day. This is equal to pumping 450 gpm for twelve hours a day. A drawdown curve was developed for this scenario to assess the impact associated with the irrigation system during a drought year. The curve reveals an anticipated drawdown of between 2-3 feet in the nearby Timberlake subdivision. The drawdown curve further indicates that at distances greater than 1.5 miles from the pumping well, the drawdown is expected to be less than one foot. (See Figure 4 – 334,000 GPD Drawdown Map).
The drawdown data is again summarized in Table 3. The drawdown associated with pumping 334,000 gallons per day in the Timberlake Subdivision is not expected to affect existing wells in the area.
Table 3 – Average Allowable and Calculated Drawdown by Town Section (ft)
Section Allowable Drawdown
Drawdown Pumping 450
gpm-72 Hours
Drawdown Pumping 450 gpm-7 Hours
Drawdown Pumping 450
gpm-12 Hours 2 18 6-9 0 0 3 20 6-9 0 0 4 NA NA NA NA 5 NA NA NA NA 6 33 4-5 0 0 7 18 4-6 0 0 8 27 5-7 0 0 9 16 6-9 0 0
10 13 7-11 0 0-2 11 16 8-12 0-2 0-3 14 Well Location NA NA NA 15 17 8-13 0-2 0-3 16 30 7-9 0 0 17 36 6-7 0 0 18 19 5-6 0 0 19 42 5-6 0 0 20 18 5-7 0 0 21 22 6-9 0 0 22 21 8-12 0-2 0-3 27 45 6-9 0 0 28 44 6-8 0 0 29 48 5-7 0 0 30 29 4-6 0 0 31 31 4-5 0 0 32 31 4-6 0 0 33 17 5-7 0 0 34 24 6 0 0
The calculations used to prepare Table 3 are included in Appendix C - Calculations.

7
The Impact of an Irrigation Well on the Regional Wetlands – The regional wetlands are hydraulically connected with the surficial sand layer shallow groundwater table. As part of the field study, three shallow groundwater table monitoring wells were installed to a depth of 25 feet bls. These wells were monitored throughout the pump tests to determine if an irrigation well would impact the shallow ground water table and the associated wetlands. The data provided in Table 1 shows there was no drawdown of the shallow groundwater table observed as a result of the pumping tests. In fact, the shallow groundwater elevation actually rose during the monitoring period as a result of periodic rainfall. No impacts are expected to the wetlands associated with an irrigation well.
CONCLUSIONS
Kohler Company has completed an irrigation well impact analysis to determine the potential for impacts to nearby residential wells and to the hydrology of nearby wetlands associated with a golf course irrigation system. Based upon the field investigation and pumping test completed the following conclusions have been drawn:
1) The drawdown associated with a 72-hour pumping test at 450 gallons per minute (gpm) does not exceed the average allowable drawdown in the neighboring wells.
2) The impact associated with pumping during an average year or drought year similar to 2012 is not anticipated to adversely impact the surrounding neighborhood.
3) The regional wetlands are not anticipated to be impacted by the drawdown associated with the irrigation well. Similarly, any domestic wells installed within the shallow aquifer (such as sand point wells) are not anticipated to be impacted.
4) In the event that an adjacent well exists that was constructed with far less than the average allowable drawdown, it may become necessary to lower the pump elevation within the existing well casing to provide additional allowable drawdown. Due to the artesian nature of the aquifer and the depth necessary to construct a well within the bedrock aquifer, this is considered a minor modification that would not necessitate additional drilling.

8
Figure 1 Well Study Map:

PRELIMINARY
=
TRAIL
= TRAIL

9
Figure 2 72-Hour Drawdown Contour Map

10'
HWY 'V'
STAHL RD
12TH ST
INTER
STATE 43
TIMBERLAKESUBDIVISION
HW
Y 32
HWY 28
15'
12'
WELL 5
WELL 6WELL 7
WELL 8WELL 9
WELL 3
WELL 1
10'
WEEDEN CREEK RD
TOWN OFSHEBOYGAN
VILLAGE OFKOHLER
TOWN OFWILSON
CITY OFSHEBOYGAN
CITY OFSHEBOYGAN
WELL 10
WELL 2
WELL 4
GOLFCOURSELOCATION
PRELIMINARY
X'

10
Figure 3 190,000 GPD Drawdown Contour Map
HWY 'V'
STAHL RD
12TH ST
INTER
STATE 43
TIMBERLAKESUBDIVISION
WELL 5
WELL 6
WELL 7
WELL 8
WELL 9
WELL 3
WELL 1
1' 2' 3' 5' 10'
WEEDEN CREEK RD
TOWN OFWILSON
CITY OFSHEBOYGAN
WELL 10
WELL 2
WELL 4
GOLFCOURSELOCATION
PRELIMINARY
X'

11
Figure 4 334,000 GPD Drawdown Contour Map

HWY 'V'
STAHL RD
12TH ST
INTER
STATE 43
TIMBERLAKESUBDIVISION
WELL 5
WELL 6
WELL 7
WELL 8
WELL 9
WELL 3
WELL 1
2'
1'
3'
5'
10'
WEEDEN CREEK RD
TOWN OFWILSON
CITY OFSHEBOYGAN
WELL 10
WELL 2
WELL 4
GOLFCOURSELOCATION
PRELIMINARY
X'

12
Appendix A On Site Well Logs:

Date: 09/26/2014
Owner: Kohler Co
Site: Well #1
Lat: 43 40.631
Long: 87 42.621
Static Water Level:
From To(ft.) (ft.)
0 26
26 26
Sand
Clay
2" PVC
10' of Screen
20' of Riser
Geology
Type, Caving/Non Caving/Color Hardness

Date: 09/29/2014
Owner: Kohler Co
Site: Well #2
Lat: 43 40.641
Long: 87 42.626
Static Water Level: 1' Above
From To(ft.) (ft.)
0 27
27 68
68 91
91 127
127 536
6" STEEL
Clay & Gravel Some Boulders
Clay & Gravel
Limestone
Geology
Type, Caving/Non Caving/Color Hardness
Sand
Clay


Date: 10/04/2014
Owner: Kohler Co
Site: Well #4
Lat: 43 40.705
Long: 87 42.592
Static Water Level:
From To(ft.) (ft.)
0 23
23 71
71 76
76 94
94 131
131 495
495 505
6" STEEL
Clay & Gravel
Clay, Gravel & Boulders
Clay & Gravel
Limestone
Geology
Type, Caving/Non Caving/Color Hardness
Sand
Clay
Fractured Limestone

Date: 10/01/2014
Owner: Kohler Co
Site: Well #5
Lat: 43 40.714
Long: 87 42.590
Static Water Level:
From To(ft.) (ft.)
0 21
21 26
2" PVC
10' of Screen
20' of Riser
Geology
Type, Caving/Non Caving/Color Hardness
Sand
Sand & Clay

Date: 07/02/2014
Owner: Kohler Co
Site: Well #6
Lat: 43 41.034
Long: 87 42.679
Static Water Level:
From To(ft.) (ft.)
0 2
2 18
18 26
26 65
65 138
138 140
140 174
174 178
178 206
8" STEEL
Sand Gravel Clean
Dense Clay
Clay Boulders Gravel
Broken Limestone
Geology
Type, Caving/Non Caving/Color Hardness
Topsoil
M-C Clean Sand
Limerock Tan
Fractured Limerock
Shale, Cavernous, Sand filled caverns

Date: 07/02/2014
Owner: Kohler Co
Site: Well #7
Lat: 43 41.063
Long: 87 42.639
Static Water Level:
From To(ft.) (ft.)
0 1
1 22
22 25
25 26
2" PVC
15' of Screen
13' of Riser
Geology
Type, Caving/Non Caving/Color Hardness
Topsoil
Clean M-C Sand
Silty Sand & Gravel
Dense Clay

Date: 06/26/2014
Owner: Kohler Co
Site: Well #8
Lat: 43 41.074
Long: 87 42.640
Static Water Level: Flowing @ 4'
From To(ft.) (ft.)
0 15
15 17
17 25
25 45
45 123
123 157
157 175
175 186
186 220
6" STEEL
Sand, clay shale filled cavern
Limestone, Soft
Cavernous Limefock, sand & shale in caverns
Geology
Type, Caving/Non Caving/Color Hardness
Clean Water Bearing M-C Sand
Sandy Clay
Sand & Grave with Silt Denses
Dense Clay
Boulders is gravelly clay
Limestone, Soft grey dry

Date: 07/10/2014
Owner: Kohler Co
Site: Well #9
Lat: 43 41.162
Long: 87 42.666
Static Water Level: Flowing 3' above grade
From To(ft.) (ft.)
0 1
1 13
13 18
18 82
82 117
117 119
119 150
150 165
165 167
167 175
175 211
211 224
224 266
266 324
324 341
341 360
360 500
6" STEEL
Grey/Brown Fractured Limerock
Grey Limerock
Hard Grey/Tan Limerock
White Limerock
Grey Limerock
Tan Limerock
Grey Limerock
Limerock White/Grey
Sandy Limerock, Lt Brwn Water Bearing
Creviced Limerock, Tan
Frim Tan Limerock
Geology
Type, Caving/Non Caving/Color Hardness
Topsoil
Clean M-C Sand
Silty Sand Gravel
Dense Clay
Clay with Boulders, angular gravel
Broken Limestone
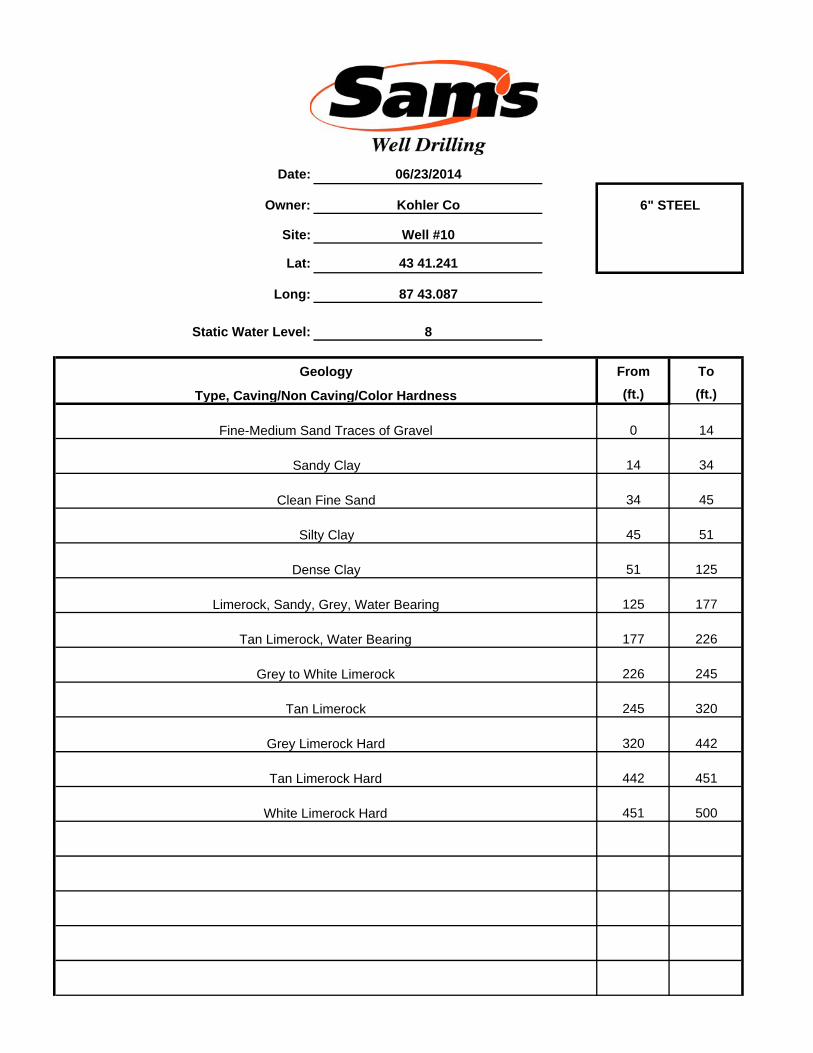
Date: 06/23/2014
Owner: Kohler Co
Site: Well #10
Lat: 43 41.241
Long: 87 43.087
Static Water Level: 8
From To(ft.) (ft.)
0 14
14 34
34 45
45 51
51 125
125 177
177 226
226 245
245 320
320 442
442 451
451 500
6" STEEL
Tan Limerock Hard
White Limerock Hard
Tan Limerock, Water Bearing
Grey to White Limerock
Tan Limerock
Grey Limerock Hard
Geology
Type, Caving/Non Caving/Color Hardness
Fine-Medium Sand Traces of Gravel
Sandy Clay
Clean Fine Sand
Silty Clay
Dense Clay
Limerock, Sandy, Grey, Water Bearing

13
Appendix B Regional Well Logs:
Section Address NameDepth to
Limestone (ft) Well Depth (ft)
Open Hole Dia.
(inches)
Depth to Static Water
Level (ft)Rate
(gpm)Duration
(hrs)
Depth to Water
Level (ft) after
pumpingDrawdown
(ft)2 402 Evergreen Dr Van Haveren 130 163 6 1 15 1 5 42 4144 Lakeshore Dr Kuester 129 147 6 0 16 1.2 12 122 447 Black River Rd WIS. Power @ Light Co. 125 260 6 1 20 3 14 132 4130 Lakeshore Rd WIS. Power @ Light Co. 121 400 6 -1 20 3 30 312 4320 Sommer Dr Tevsh 133 223 6 10 16 12 30 202 4506 S 16th St Khan 128 183 6 18 30 2 40 222 204 Beach Ct Reid 134 135 6 9 15 2 20 112 4324 Lakeshore Dr Baumann 123 127 6 -3 18 2 15 182 509 Indian Oaks Ct Van Eprin 127 181 6 1 20 2 90 892 4548 Evergreen Dr Grawien 147 220 6 1 20 0.01 35 34
Average 129.7 203.9 6.0 3.7 19.0 2.8 29.1 18.3
3 1606 Pheasant La Schlosser 143 174 6 32 18 8 46 143 4419 S 15th St Tom Stubbe Lee Realty 135 136 6 40 12 2 60 203 4422 S 12th St Caan Floral Co. 143 200 6 40 12 2 60 203 4335 S 16th St Rautmann Custom Homes 127* 130 6 15 20 2 38 233 1701 Sunnyslope Ave Leicht 167 181 6 27 20 2 52 253 4440 S 14th St Smith 141 152 6 24 20 2 40 163 4430 S 14th St Gordanies 139 150 6 25 18 2 40 153 2111 Washington Ave Zimbel 195 418 6 35 45 2 80 453 4345 S 16th St Byrum 126 160 6 40 20 1 55 153 4229 S 16th St Irish 156 240 6 14 12 2 50 36
Average 149.4 169.2 6.0 29.2 19.7 2.5 52.1 20.4
4 NO WELL DATA 05 NO WELL DATA 0
6 3605 CTH EE Rieder 156 400 6 85 16 2 130 456 6626 Paradise Ln Roth 161 320 6 7 10 2 171 1646 3820 Broadway Boge 124 380 6 65 5 2 100 356 3844 Broadway Schaap 124 262 6 72 12 2 90 186 3634 Valley Ct Reschke 180 420 6 120 20 1 151 316 3642 Valley Ct Boucher 162 410 6 70 12 2 108 38
Average 151.2 365.3 6.0 69.8 12.5 1.8 125.0 33.4
7 6329 Ourtown Rd Bachmann 135 347 6 57 35 2 100 437 6136 Stahl Rd Vantreeck 138 233 6 43 16 15 45 27 Weeden Creek Rd Kultgen 143 162 6 70 25 1 80 10
Average 138.7 247.3 6.0 56.7 25.3 6.0 75.0 18.3
8 5326 CTH A WP@L McGillis 97 182 6 31 12 2 60 298 W4636 Frontage Rd Spiro Bros LLC 165 220 6 90 25 2 115 25
Average 131.0 201.0 6.0 60.5 18.5 2.0 87.5 27.0
9 2629 Prairie Winds Ct Werner Homes 206 271 6 61 12 2 90 299 2933 Whispering Winds Dr Pingel II 142 143 6 28 12 2 54 269 5736 Wind Dancer Trl Huerink 126* 131 6 33 15 2 40 79 3016 Whispering Winds Dr Werner Homes 135 281 6 40 122 2 55 159 5535 Wind Dancer Ct Sass 138 200 6 40 15 2 160 1209 2725 Whispering Wind Dr Kramer 137 220 6 65 25 1 72 79 5721 Wind Dancer Tr Rautmann Custom Homes 128 390 6 70 30 2 82 129 Whistling Ct Holler 148 160 6 30 20 1 40 109 5640 Moenning Rd Werner Homes 121 182 6 48 12 2 70 229 2910 Stahl Rd Teunissen 142 222 6 42 12 2 100 589 Town of Wilson Wilson Insur 142 440 8 45 100 1 65 20
Average 143.9 240.0 6.2 45.6 34.1 1.7 63.1 16.4
10 1660 Maple Ln Arentsen 131 250 6 25 20 14 44 1910 5616 S 12th St Bowser 143 180 6 30 12 2 40 1010 Indian Mound Cir Home Builders of Sheboygan 126 151 6 15 20 3 32 1710 2041 Weeden Creek Rd Edler 125 175 6 27 16 10 33 610 5749 Sherwood Dr Routmann Custom Homes 140 260 6 35 20 3 51 1610 5330 S 12th St Horn 126 160 6 25 16 14 33 810 5721 Sherwood Dr Routmann Custom Homes 133 137 6 15 20 1.5 27 1210 4928 S 13th St Theil 136 222 6 42 15 1 50 810 S 16th St Fiegles 131 202 6 44 20 1 100 5610 Stahl Rd Theil 125 500 12 17 500 8 37 2010 5008 South 12th Street Riverdale Country Club 140 245 6 20 20 6 30 10
Average 132.4 225.6 6.5 26.8 61.7 5.8 37.7 12.6
REGIONAL WELL LOGS

Section Address NameDepth to
Limestone (ft) Well Depth (ft)
Open Hole Dia.
(inches)
Depth to Static Water
Level (ft)Rate
(gpm)Duration
(hrs)
Depth to Water
Level (ft)Drawdown
(ft)11 5317 Evergreen Dr Bleyer 120 130 6 12 12 2 30 1811 5411 Lonesome Pine Rd Gruenke 131 156 6 10 22 16 16 611 5105 S 8th St Allison Kiegbels by Mullkin 141 160 6 15 12 2 30 1511 222 White Tail Run Ln First Realty Service 112 175 6 -1 16 12 25 2611 415 Timberlake Butz 142 240 6 16 16 14 40 2411 S 12th St Zientek 128 175 6 6 20 16 20 1411 Pioneer Road Lee Realty 108 192 6 1 20 2 10 911 231 Edgewater Hinterberg 162 203 6 7 16 8 20 1311 5428 Evergreen Drive Pequet 120 180 6 55 12 2 80 2511 Edgewater Kinderfather 151 154 6 9 22 20 14 5
Average 131.5 176.5 6.0 13.0 16.8 9.4 28.5 15.5
14 630 Rivertrails Koenig 129 182 6 10 10 2 40 3014 Deep Pumping Well Kohler Co 127 519 8 3 450 72 43 4014 RT #3 Mueller 128 267 6 5 16 24 27 22
Average 128.0 322.7 6.7 6.0 158.7 32.7 36.7 30.7
15 725 Woodside Lane Tom Grey by Lee Realty 136 180 6 60 12 2 70 1015 6014 S 12th St Meissner 105 225 6 24 12 10 35 1115 1508 CTY TK V Calvert 121 169 6 6 16 8 35 2915 1631 Terry Andrae Ave Stump 117 183 6 11 16 9 35 2415 1615 Woodside Ln Fessler 123 185 6 15 16 10 33 1815 1625 Terry Andrae Ave Sonntag 111 180 6 10 12 2 20 1015 6034 S 12th St Prussner 108 216 6 16 16 18 30 1415 6024 S 12th St Paucher 106 224 6 16 16 18 30 1415 1402 Terry Andrae Ave Williamson 103 227 6 13 16 12 27 1415 1464 Terry Andrae Ave Leicht 110 222 6 12 18 15 40 28
Average 114.0 201.1 6.0 18.3 15.0 10.4 35.5 17.2
16 2740 CTY TK V Burkart 180 188 6 31 16 12 40 916 Terry Andrae Ct Al Hoffmann by Lee Realty 114 180 6 15 12 2 80 6516 HWY OK Lee Kultgens Const 208 225 6 40 15 2 60 2016 2840 HWY V Beinemann 187* 192 6 19 12 2 35 1616 6023 S Business Dr Doro 204 236 6 90 20 2 131 4116 7004 Moenning Rd Sixel-Schwinn 135 178 6 37 20 1 75 3816 6451 S Business Dr Fergadakis 213 222 6 51 12 2 70 19
Average 175.7 203.0 6.0 40.4 15.3 3.3 70.1 29.7
17 6630 Markus Ct Weiman 125 202 6 44 13 2 80 36
18 6927 CTH A Davis 149 190 6 53 16 15 72 1918 N3871 Van Treek TRL TMR FURS LLC, Sixel Schwinn 168 360 8 70 50 3 150 80
Average 158.5 275.0 7.0 61.5 33.0 9.0 111.0 19.0
19 CO A Trimberger Mink Ranch 115* 118 6 65 60 3 95 3019 6731 CTH V Falle 144 282 6 60 12 2 120 6019 N3481 CO A Trimberger Mink Ranch 243 300 6 70 70 72 78 819 N3481 CO A TMR FURS LLC 232 358 6 67 150 10 135 68
Average 206.3 264.5 6.0 65.5 73.0 21.8 107.0 41.5
20 CTY TK OK Falls Valley Excv 164 200 6 65 15 9 85 2020 4602 CTH OK Shotts 145 220 6 50 12 2 70 2020 Town of Wilson Town of Wilson 161 222 6 66 8 2 80 14
Average 156.7 214.0 6.0 60.3 11.7 4.3 78.3 18.0
21 3211 CTH V Nawikas 155 200 6 35 16 10 56 2121 7718 Moenning Rd Grunnow 112 161 6 30 20 2 52 2221 7411 Sauk Trail Rd Sunrise Memorial Park 161 220 6 60 20 2 74 1421 7320 Sauk Trail Rd Van Stelle 247 280 6 73 12 2 90 1721 7441 Middle Rd Van Development LLC 161 241 6 73 12 2 90 1721 3010 Old Plank Rd Rammer 122 220 6 90 20 1 135 4521 Moenning Rd Leannah 133 225 6 22 20 1 40 18
Average 155.9 221.0 6.0 54.7 17.1 2.9 76.7 22.0
22 1521 CTY TK V Frank Wolfert EST 109 160 6 8 16 14 28 2022 Town of Wilson Comfort 114 165 6 22 15 2 40 1822 7336 Shircel Rd Wappler 119 140 6 3 10 2 25 2222 Moenning Rd Kummer 165 282 6 25 30 1 50 25
Average 126.8 186.8 6.0 14.5 17.8 4.8 35.8 21.3

Section Address NameDepth to
Limestone (ft) Well Depth (ft)
Open Hole Dia.
(inches)
Depth to Static Water
Level (ft)Rate
(gpm)Duration
(hrs)
Depth to Water
Level (ft)Drawdown
(ft)27 1718 Wilson-Lima Rd McBride 150 158 6 0 16 9 7 727 8822 Pinewoods Ln Wisniewski 155 222 6 7 15 2 80 7327 9004 Pinewoods Ln Davies 140 220 6 59 20 1 115 56
Average 148.3 200.0 6.0 22.0 17.0 4.0 67.3 45.3
28 3029 Old Park Rd White 130 300 6 25 14 15 85 6028 2083 Old Park Rd Kissel 116 215 6 8 15 14 65 5728 Town of Wilson Gary Lee Farms LLC 170 360 6 56 30 2 70 14
Average 138.7 291.7 6.0 29.7 19.7 10.3 73.3 43.7
29 CTH KK Depagter 144 280 6 80 20 2 140 6029 8137 Sauk Trail Rd Krier 187 207 6 62 10 12 110 4829 8513 Sauk Trail Rd Gartman 186 220 6 95 20 2 132 37
Average 172.3 235.7 6.0 79.0 16.7 5.3 127.3 48.3
30 6418 Wilson Lima Rd Jacobchick 148 315 6 60 50 8 68 830 6447 Abraham Ct Zimbal 133 220 6 60 60 2 100 4030 6437 Abraham Ct Zimbal Minkery Inc 160 420 8 55 220 3 135 8030 6437 Abraham Ct Zimbal Minkery Inc 152 420 8 60 150 3 105 4530 6020 Wilson Lima Rd Zimbal Farms Inc 134 198 6 77 20 1 115 38
Average 145.4 314.6 6.8 62.4 100.0 3.4 104.6 28.7
31 R. #1 Minderhaud Rd Hilbelink 162 223 6 32 15 8 75 4331 Wilson Lima Rd Hartman 164 252 6 45 15 8 90 4531 9730 Hartman Rd Kaesermann 184 265 6 84 16 8 90 6
Average 170.0 246.7 6.0 53.7 15.3 8.0 85.0 31.3
32 W1442 CTH KK Lensink 135 278 6 25 16 20 65 4032 9640 Sauk Trail Rd Van Stelle 156 210 6 58 16 12 65 732 9801 Hartman Rd Thimmig 148 170 6 70 16 10 95 2532 9532 Sauk Trail Rd Zimbal Farms Inc 164 420 6 120 60 3 200 8032 4731 Wilson Lima Rd Oostburg Seamless Gutters 174 220 6 90 20 1 132 4232 9635&9637 Sauk Trail Rd Zimbal Farms Inc 163 200 6 81 20 2 100 1932 9532 Sauk Trail Rd Zimbal Farms Inc 172 500 8 77 200 4 150 7332 9532 Sauk Trail Rd Zimbal Farms Inc 157 422 6 75 60 2 130 55
Average 158.6 302.5 6.3 74.5 51.0 6.8 117.1 31.3
33 9525 CTH KK Swinson 88 180 6 40 12 2 60 2033 3443 Wilson Lima Rd Matt 120 290 6 7 16 9 53 4633 9759 CTH KK Mersberger 89 209 6 20 16 2 35 1533 9525 CTY TK KK Lammers 84 210 6 2 30 24 70 6833 9812 Weeks Ln Bellatti 132 135 6 4 16 15 8 433 10007 Middle Rd Dulmes 78 98 6 22 12 2 30 833 Townline Rd Weavers 138 180 6 35 15 2 46 1133 9934 Weeks Ln Black 114 202 6 4 15 2 30 2633 Windpoint Ln Bentley 130 242 6 10 15 3 20 1033 Middle Rd Wildman 113 162 6 25 25 1 35 10
Average 108.6 190.8 6.0 16.9 17.2 6.2 38.7 16.7
34 9526 Sandwood Ln Thiel 127 203 6 10 12 2 60 5034 Town of Wilson Jakubiak 140 225 6 30 15 2 41 1134 9534 Sandwood Ln Froh 133 243 6 5 12 2 40 3534 Weeks Ln Speaker 138 145 6 2 15 2 12 1034 2301 Wilson Lima Rd Mahler 149 231 6 15 16 14 35 2034 Town of Wilson Weinfurer 163 205 6 8 20 2 15 734 2305 Wilson Lima Rd Unger 140 158 6 25 20 1 51 2634 1745&1747 Wilson Lima Rd Norris 165 278 6 15 50 2 51 3634 Town of Wilson Rosenkranz 155 156 6 10 25 1 29 1934 9606 Sandwood Ln Juttner 141 262 6 11 15 2 40 29
Average 145.1 210.6 6.0 13.1 20.0 3.0 37.4 24.3

14
Appendix C Calculation Output:

1. 10. 100. 1000. 1.0E+4 1.0E+50.
10.
20.
30.
40.
50.
Radial Distance (ft)
Dis
plac
emen
t (ft)
WELL TEST ANALYSIS
Data Set: \...\Well Study 10-20-14-theis-mod.aqtDate: 12/16/14 Time: 13:54:43
PROJECT INFORMATION
Company: Excel EngineeringClient: Kohler, IncProject: 1401520Location: Town of WilsonTest Well: Pump Well #3Test Date: 10/20/2014
WELL DATA
Pumping WellsWell Name X (ft) Y (ft)Well #3 (Pumped) 0 0
Observation WellsWell Name X (ft) Y (ft)
Well #3 (Pumped) 0 0OW #2 -105 -186OW #4 44 208OW #8 -158 2450OW #9 -275 2990OW #10 -2130 3467
SOLUTION
Aquifer Model: Confined Solution Method: Theis
T = 2.682 ft2/min S = 3.251E-6Kz/Kr = 1. b = 400. ft

1. 10. 100. 1000. 1.0E+4 1.0E+50.
10.
20.
30.
40.
50.
Radial Distance (ft)
Dis
plac
emen
t (ft)
WELL TEST ANALYSIS
Data Set: \...\Well Study 10-20-14-theis-mod-7hr.aqtDate: 12/16/14 Time: 13:54:03
PROJECT INFORMATION
Company: Excel EngineeringClient: Kohler, IncProject: 1401520Location: Town of WilsonTest Well: Pump Well #3Test Date: 10/20/2014
WELL DATA
Pumping WellsWell Name X (ft) Y (ft)Well #3 (Pumped) 0 0
Observation WellsWell Name X (ft) Y (ft)
Well #3 (Pumped) 0 0OW #2 -105 -186OW #4 44 208OW #8 -158 2450OW #9 -275 2990OW #10 -2130 3467
SOLUTION
Aquifer Model: Confined Solution Method: Theis
T = 2.682 ft2/min S = 0.0001125Kz/Kr = 1. b = 400. ft

1. 10. 100. 1000. 1.0E+4 1.0E+50.
10.
20.
30.
40.
50.
Radial Distance (ft)
Dis
plac
emen
t (ft)
WELL TEST ANALYSIS
Data Set: \...\Well Study 10-20-14-theis-mod-12hr.aqtDate: 12/16/14 Time: 13:53:13
PROJECT INFORMATION
Company: Excel EngineeringClient: Kohler, IncProject: 1401520Location: Town of WilsonTest Well: Pump Well #3Test Date: 10/20/2014
WELL DATA
Pumping WellsWell Name X (ft) Y (ft)Well #3 (Pumped) 0 0
Observation WellsWell Name X (ft) Y (ft)
Well #3 (Pumped) 0 0OW #2 -105 -186OW #4 44 208OW #8 -158 2450OW #9 -275 2990OW #10 -2130 3467
SOLUTION
Aquifer Model: Confined Solution Method: Theis
T = 2.682 ft2/min S = 7.946E-5Kz/Kr = 1. b = 400. ft