irving fisher committee on central bank statistics · 2018-10-12 · irving fisher committee on...
TRANSCRIPT

Irving Fisher Committee
on Central Bank Statistics
IFC Working Papers No 17
Disentangling the supply and demand factors of household credit in Malaysia: evidence from the credit register by Soh Jiaming
October 2018

IFC Working Papers are written by the staff of member institutions of the Irving Fisher Committee on Central Bank Statistics, and from time to time by, or in cooperation with, economists and statisticians from other institutions. The views expressed in them are those of their authors and not necessarily the views of the IFC, its member institutions or the Bank for International Settlements.
This publication is available on the BIS website (www.bis.org).
© Bank for International Settlements 2018. All rights reserved. Brief excerpts may be reproduced or translated provided the source is stated.
ISSN 1991-7511 (online) ISBN 978-92-9259-206-6 (online)

Disentangling the supply and demand factors of household credit in Malaysia: evidence from the credit register 1
Disentangling the supply and demand factors of household credit in Malaysia: evidence from the credit register
Soh Jiaming 1
Abstract
This paper isolates the demand and supply factors of credit extension. We construct a new dataset that combines loan application information from the credit register with individuals’ income and banks’ balance sheet for the period 2014-2016. Using this dataset, we verify the importance of banks' balance sheet (supply factor) and individuals' income (demand factor) in determining housing and car loan approval empirically. We have two main findings. First, we find that banks’ balance sheet matters. Banks with a higher funding ratio, higher capital ratio, and lower liquidity ratio are more likely to approve a housing and car loan. Among the supply factors, the funding ratio of the banks is the strongest determinant of household lending. Second, we find that the supply factors have a greater impact on household loan approval than the demand factor. Specifically, the effect of banks’ funding ratio on loan approval is twice the size of income. Therefore, the declining funding ratio due to higher net external outflows may potentially explain the moderation in aggregate household loan approval growth in 2014-2016. The findings fill a research gap for the Malaysian economy and could serve to inform policies, especially in relation to the discussion on the role of banks’ balance sheet in lending activities.
Keywords: Supply factor, demand factor, household loan approval, credit register, funding ratio
JEL classification: G21, E51
1 This paper is presented at the 9th Biennial BIS-IFC Conference on “Are post-crisis statistical initiatives completed?” The author would like to thank Norhana Endut, Mohd Nozlan Khadri, Chuah Kue Peng, Ho Sui-Jade, Norman Loayza, Daniel Chin and participants at the World Bank, Joint MP-FS seminar and 9th Biennial BIS-IFC Conference for their invaluable comments and insights. The author would like to acknowledge and thank Rafidah binti Mohamad Zahari for her guidance on the credit register database. The views expressed are solely the responsibility of the author and should not be interpreted as reflecting the views of the Central Bank of Malaysia or of anyone else associated with the Central Bank of Malaysia.
Soh Jiaming; Bank Negara Malaysia; E-mail: [email protected] / [email protected]

2 Disentangling the supply and demand factors of household credit in Malaysia: evidence from the credit register
Contents
1. Introduction ....................................................................................................................................... 3
2. Literature review .............................................................................................................................. 4
3. The borrower-bank pair dataset................................................................................................ 5
4. Empirical Methodologies ............................................................................................................. 8
4.1 Method 1 .................................................................................................................................... 8
4.2 Method 2 .................................................................................................................................... 9
5. Results ................................................................................................................................................ 12
5.1 Results from Method 1 ....................................................................................................... 12
5.2 Results from Method 2 ....................................................................................................... 12
6. Discussion and Policy Implications ......................................................................................... 13
7. Conclusion ........................................................................................................................................ 16
8. Appendix ........................................................................................................................................... 17
9. References ........................................................................................................................................ 20
Disentangling the supply and demand factors of household credit in Malaysia: evidence from the credit register 3
1. Introduction
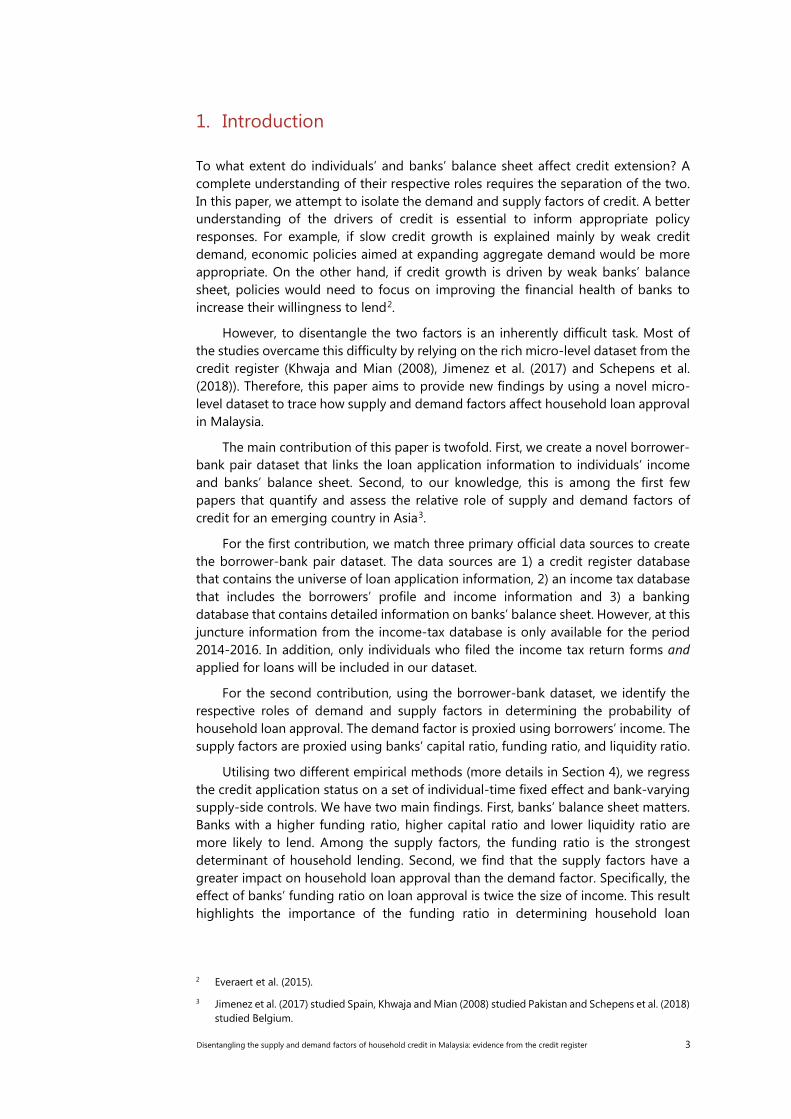
To what extent do individuals’ and banks’ balance sheet affect credit extension? A complete understanding of their respective roles requires the separation of the two. In this paper, we attempt to isolate the demand and supply factors of credit. A better understanding of the drivers of credit is essential to inform appropriate policy responses. For example, if slow credit growth is explained mainly by weak credit demand, economic policies aimed at expanding aggregate demand would be more appropriate. On the other hand, if credit growth is driven by weak banks’ balance sheet, policies would need to focus on improving the financial health of banks to increase their willingness to lend2.
However, to disentangle the two factors is an inherently difficult task. Most of the studies overcame this difficulty by relying on the rich micro-level dataset from the credit register (Khwaja and Mian (2008), Jimenez et al. (2017) and Schepens et al. (2018)). Therefore, this paper aims to provide new findings by using a novel micro-level dataset to trace how supply and demand factors affect household loan approval in Malaysia.
The main contribution of this paper is twofold. First, we create a novel borrower-bank pair dataset that links the loan application information to individuals’ income and banks’ balance sheet. Second, to our knowledge, this is among the first few papers that quantify and assess the relative role of supply and demand factors of credit for an emerging country in Asia3.
For the first contribution, we match three primary official data sources to create the borrower-bank pair dataset. The data sources are 1) a credit register database that contains the universe of loan application information, 2) an income tax database that includes the borrowers’ profile and income information and 3) a banking database that contains detailed information on banks’ balance sheet. However, at this juncture information from the income-tax database is only available for the period 2014-2016. In addition, only individuals who filed the income tax return forms and applied for loans will be included in our dataset.
For the second contribution, using the borrower-bank dataset, we identify the respective roles of demand and supply factors in determining the probability of household loan approval. The demand factor is proxied using borrowers’ income. The supply factors are proxied using banks’ capital ratio, funding ratio, and liquidity ratio.
Utilising two different empirical methods (more details in Section 4), we regress the credit application status on a set of individual-time fixed effect and bank-varying supply-side controls. We have two main findings. First, banks’ balance sheet matters. Banks with a higher funding ratio, higher capital ratio and lower liquidity ratio are more likely to lend. Among the supply factors, the funding ratio is the strongest determinant of household lending. Second, we find that the supply factors have a greater impact on household loan approval than the demand factor. Specifically, the effect of banks’ funding ratio on loan approval is twice the size of income. This result highlights the importance of the funding ratio in determining household loan
2 Everaert et al. (2015).
3 Jimenez et al. (2017) studied Spain, Khwaja and Mian (2008) studied Pakistan and Schepens et al. (2018) studied Belgium.

4 Disentangling the supply and demand factors of household credit in Malaysia: evidence from the credit register
approval. A declining funding ratio due to high net external outflows can potentially explain the moderation in aggregate household loan approval growth in 2014-2016.
Our study could therefore serve as a starting point for discussions on the impact of policies on banks’ balance sheet and ultimately lending activities. In particular, our empirical findings on the importance of banks’ funding ratio in credit extension highlight the importance of promoting diversification of the sources of funding for financial institutions, which can help reduce the sensitivity of lending activities to movements in deposit.
The paper will proceed as follow. Section 2 describes the literature review on the demand and supply factors of credit. Section 3 details the creation of a borrower-bank pair dataset. Section 4 elaborates the two identification strategies that we utilise to disentangle the demand and the supply factors. Section 5 presents the results. Section 6 discusses the policy implications and the limitations of results, and finally, Section 7 concludes.
2. Literature review
The importance of demand factors such as borrowers’ profile and income in getting loan approvals is well accepted, but the role of banks’ balance sheet on lending is less studied in Malaysia. Early efforts to disentangle the demand and supply factors of credit was done by Kashyap et al. (1993; 2000). They found that banks’ balance sheet matters in monetary policy transmission and the impact of monetary policy on lending is stronger for banks with less liquid balance sheet.
In a more recent paper by Khwaja and Mian (2008), they investigated the impact of liquidity shocks on banks’ balance sheet and lending. They found that for the same firm borrowing from two different banks, the loan extended by the bank that experienced a larger decline in liquidity dropped significantly. This provides further evidence on the importance of the supply factors of credit. The studies described above can be summarised as arrow A and arrow B in Chart 1.
Understanding the roles of demand and supply factors of credit goes beyond unravelling the mechanics of credit creation. They do have different impacts on the real economy (arrow C in Chart 1). For example, Mian and Sufi (2017) describes a credit supply expansion as the increase in the quantity of credit or a decrease in the interest rate on credit for reasons unrelated to changes in income or productivity of the borrowers. They found that expansion in credit supply is an important source of business cycle fluctuations and is often associated with a larger growth in loans to households and a larger growth in house prices4, with a subsequent deep recession when the credit supply shock reverts.
Therefore, the focus of this study is to first understand the drivers of credit (arrow B). We will leave the investigation of arrow A and C for future research.
4 Favara and Imbs (2014) found similar result for house price.

Disentangling the supply and demand factors of household credit in Malaysia: evidence from the credit register 5
3. The borrower-bank pair dataset
The availability of a rich micro-level dataset is crucial for our analysis. To create a borrower-bank pair dataset, we use three primary official data sources that are housed at the Central Bank of Malaysia. The three data sources include 1) the credit register database containing the universe of individual-level loan applications information, 2) an income tax database containing individual-level gross income information, and 3) a supervisory bank-level database containing banks’ balance sheet information.
The credit register
The credit register is collected by the Central Bank of Malaysia to monitor the lending activities of banks. Information in the credit register includes lenders, status of loan application (accepted or rejected), the purpose of loan application, the application amount and the collateral value for housing loan. It has monthly information on the universe of all household loan application in Malaysia. For the purpose of our analysis, we remove joint borrowers. Each loan application is linked to only one borrower’s characteristics. We restrict our borrowers to residents only. In this paper, we focus only on housing and car loan applications given that they constitute the majority of household loan5. Only new loan applications are considered. Applications for renewal of existing loans are not considered in our analysis.
The credit register has information on borrowers’ characteristics such as age, location of residence and employment. Unfortunately, we do not have information on the risk profile of the borrowers (for example, credit score) in the dataset. Also, the income of the borrowers - which is an important demand indicator that we need for
5 Housing and car loans comprise 66% of total household loan approval in the 2014-2016 period.
Summary literature review Chart 1
Source: Kashyap (1993); Kashyap and Stein (2000); Khwaja and Mian (2008); Favara (2014); Mian and Sufi (2017); Jimenez et al. (2017) ; Schepens et al. (2018)

6 Disentangling the supply and demand factors of household credit in Malaysia: evidence from the credit register
our analysis - is not available in the credit register. Therefore, we rely on the income tax database to fill this missing gap.
The income tax database
We use the income tax database to extract individual-level gross income. This information, however, is only available for those who submitted their income tax return forms in Malaysia. In addition, the income tax database has information on age, gender, location of residence, and marital status. For borrowers’ characteristics that are not available from the credit register, we fill the missing information from the income tax database. This provides us with the most comprehensive list of characteristics and loan application information for the borrowers.
Unfortunately, due to the data constraint at this juncture, we only have the 2014-2016 data available in the income tax database. We also do not have information on individuals’ wealth or assets.
The bank-level database
The final dataset we use is the monthly banks’ balance sheet data collected by the Central Bank of Malaysia. We use banks’ capital ratio, funding ratio, liquidity ratio, and size to proxy for the supply factors6. The following is the definition for the banks’ balance sheet indicators that we use in this paper:
1) Capital ratio is defined to be the ratio of tier 1 capital7 over risk-weighted assets8. It measures how much additional buffer a bank has to meet claims in the event of insolvency. We use this to proxy for the financial soundness of banks.
2) Funding ratio is defined to be the ratio of deposit9 over total liabilities. We use this to proxy for funding availability of banks as deposit constitutes the main supply of loanable funds in Malaysia and may act as the driving force of bank lending.
3) Liquidity ratio is defined to be the ratio of liquid assets10 over total assets. We use this indicator to represent the available stock of liquid assets to cover unexpected cash outflows and liquidity shocks (for example, unpredictable deposit withdrawal or unpaid credit). Since liquidity comes at a cost, a bank faces a trade-off between the safety of greater liquidity and the expense of obtaining it.
4) Size is defined as log total assets.
6 We restrict our sample to commercial and Islamic banks only.
7 Tier 1 capital consists of ordinary share capital, retained earnings and reserve fund.
8 Assets include cash, deposit with the Central Bank and other banks, government debt, debt securities and loans extended to the private sector.
9 We exclude deposit that are placed by banks.
10 Liquid assets is defined as the sum of cash, deposit placed at other banks, financial assets and reverse repurchase.

Disentangling the supply and demand factors of household credit in Malaysia: evidence from the credit register 7
Finally, using a unique identifier for banks and borrowers, we create a borrower-bank pair dataset that links loan application information to individuals’ and banks’ balance sheet. Note that there will be more loan applications than the number of borrowers since one borrower can apply to multiple banks. Our final sample consists of 530,000 borrowers and 47 banks, with approximately 1.5 million data points over 2014-2016. Chart 2 below summarises the process of creating the borrower-bank pair dataset for Malaysia.
The demand factors are proxied mainly by borrowers’ income and other characteristics that could affect the demand for loans. This includes age, occupation, location of residence and marital status. We utilised all the available borrowers’ characteristics in the dataset. Supply factors are proxied by banks’ capital ratio, funding ratio and liquidity ratio as they indicate banks’ capacity and willingness to lend. All relevant demand and supply indicators are standardised in the regression for ease of direct comparison.
It is important to note that since we rely on information that are available from all three data sources, this study only covers individuals who filed the income tax return forms and applied for loans. In addition, many banks in Malaysia pre-filter the loan applications by income before registering the eligible applicants in the credit register. This could potentially induce a sample selection bias as we do not observe individuals from the lower income group, especially those who did not to submit any loan applications given their lower probability of obtaining an approval. In fact, individuals in our sample may consist of those with relatively high income in the population.
Table 1 in the Appendix presents the summary statistics for the borrowers’ and banks’ characteristics. For banks’ characteristics, the average funding ratio in the sample is 75%, and the average capital and liquidity ratio is around 10%. Note that compared to other supply factors, the standard deviation for the funding ratio is relatively high, suggesting a significant disparity in the funding ratio across banks in Malaysia.
For borrowers’ characteristics, the average monthly gross income is RM 8,600. This confirms our previous claim that individuals in our dataset are relatively well off in the population. The mean income in our dataset is roughly 3 times the average monthly salaries and wages in the population11. On average, the borrowers in our dataset applied to 4 banks and the majority of the loan applications are accepted (~80%).
11 The average monthly salaries and wages in the population is around RM 2500 in 2016. We do not
observe the average gross income for the population. Source: Salaries and Wages Survey Report 2016, Department of Statistics Malaysia.

8 Disentangling the supply and demand factors of household credit in Malaysia: evidence from the credit register
4. Empirical Methodologies
This section outlines the econometric models that we use to overcome the classical identification problem of separating the demand and supply factors of lending. We rely mainly on two methods: the first from Khwaja and Mian (2008), and the second from Schepens et al. (2018). Chart 3 summarises the two methods (Equation 1 and Equation 2) described below.
4.1 Method 1
The first method originates from Khwaja and Mian (2008). We use the sample of borrowers who applied to multiple banks for identification. Intuitively, since the comparison is across banks for the same individual, any difference in the loan approvals is arguably due to heterogeneity in banks’ balance sheet. Specifically, we regress individual-bank level credit application status on a set of individual-time fixed effect and bank-varying supply controls as shown in Equation 1:
Process of Creating a Borrower-Bank Pair dataset for Malaysia Chart 2
Source: Author’s estimate.

Disentangling the supply and demand factors of household credit in Malaysia: evidence from the credit register 9
𝑃𝑃𝑃𝑃𝑃𝑃𝑃𝑃(𝐿𝐿𝑃𝑃𝐿𝐿𝐿𝐿 𝐴𝐴𝐴𝐴𝐴𝐴𝑃𝑃𝑃𝑃𝐴𝐴𝐿𝐿𝐴𝐴)𝑖𝑖,𝑗𝑗,𝑡𝑡 = 𝛽𝛽𝑖𝑖 + 𝜷𝜷𝟏𝟏𝑺𝑺𝒋𝒋,𝒕𝒕=𝟏𝟏 + 𝜷𝜷𝟐𝟐𝑿𝑿𝒊𝒊,𝒋𝒋,𝒕𝒕 + 𝛽𝛽3 𝑍𝑍𝑡𝑡 + 𝜀𝜀𝑖𝑖,𝑗𝑗,𝑡𝑡 (1)
where i refers to individual i who applied to multiple banks, j refers to bank j, and t refers to time.
We use a linear probability model for the estimation. The key dependent variable is a dummy to indicate the status of the loan application made by individual i to bank j at time t (1 if loan application is approved, 0 otherwise). In this study, we only focus on the quantity of loans as our dependent variable due to the lack of data for the price of loans (i.e. effective interest rate).
𝛽𝛽𝑖𝑖 refers to individual-fixed effect. Since the comparison is across banks for the same individual i, individual-specific demand factors such as income, age, occupation, location of residence and marital status will be absorbed by the individual fixed effect 𝛽𝛽𝑖𝑖 .
The key independent variable is the vector 𝑺𝑺𝒋𝒋,𝒕𝒕=𝟏𝟏. It consists of bank j ‘s funding ratio, capital ratio, liquidity ratio at time t=1. All these supply factors are estimated simultaneously in one regression12. We use the supply factors at the beginning of the year to proxy for banks’ initial position. This is to reduce the potential reverse causality from loan to deposit. All standard errors are clustered at individual-time level.
Some controls are capture in the vector 𝑿𝑿𝒊𝒊,𝒋𝒋,𝒕𝒕. It includes the amount applied by the borrower, the collateral value13, and the banks’ size and market share14. 𝑍𝑍𝑡𝑡 refers to the time fixed effect to capture macroeconomic shocks during the year. The loan applications must also be submitted in the same year for the same purpose.
However, there are two setbacks in using Equation 1. First, we can only estimate the fixed effect coefficient 𝛽𝛽𝑖𝑖 in the sample of individuals who submitted their loan applications to multiple banks. This will omit individuals who applied to only one bank. Even though the majority of the loan applicants in our dataset (85%) applied to multiple banks, excluding a subset of individuals from the analysis may potentially induce a sample selection problem. Second, under Equation 1 the role of income will be absorbed by the individual-time fixed effect and we will not be able to compare the relative strength of demand and supply factors. Therefore, we rely on an alternative methodology used in Jimenez et al. (2017) and Schepens et al. (2018).
4.2 Method 2
Under this method, instead of using the individual-time fixed effect, we replace it with industry-location-age-marital-time fixed effect. Because we directly observe the borrowers’ characteristics in the dataset, we do not have to rely on the individual fixed-effect. The benefits of this approach is two-fold. First, it allows us to include all borrowers in our analysis. Second, since the income effect is not absorbed, we can compare the size of the coefficient for the demand factor (proxied by income) and supply factors (proxied by banks' characteristics) to assess their relative strength. Specifically, we estimate the following:
12 We also estimate each of the supply factor in separate regressions. The results are quantitatively similar.
13 Collateral value is only available for housing loan.
14 Market share refers to the share of loan applications in each bank during the year.
10 Disentangling the supply and demand factors of household credit in Malaysia: evidence from the credit register
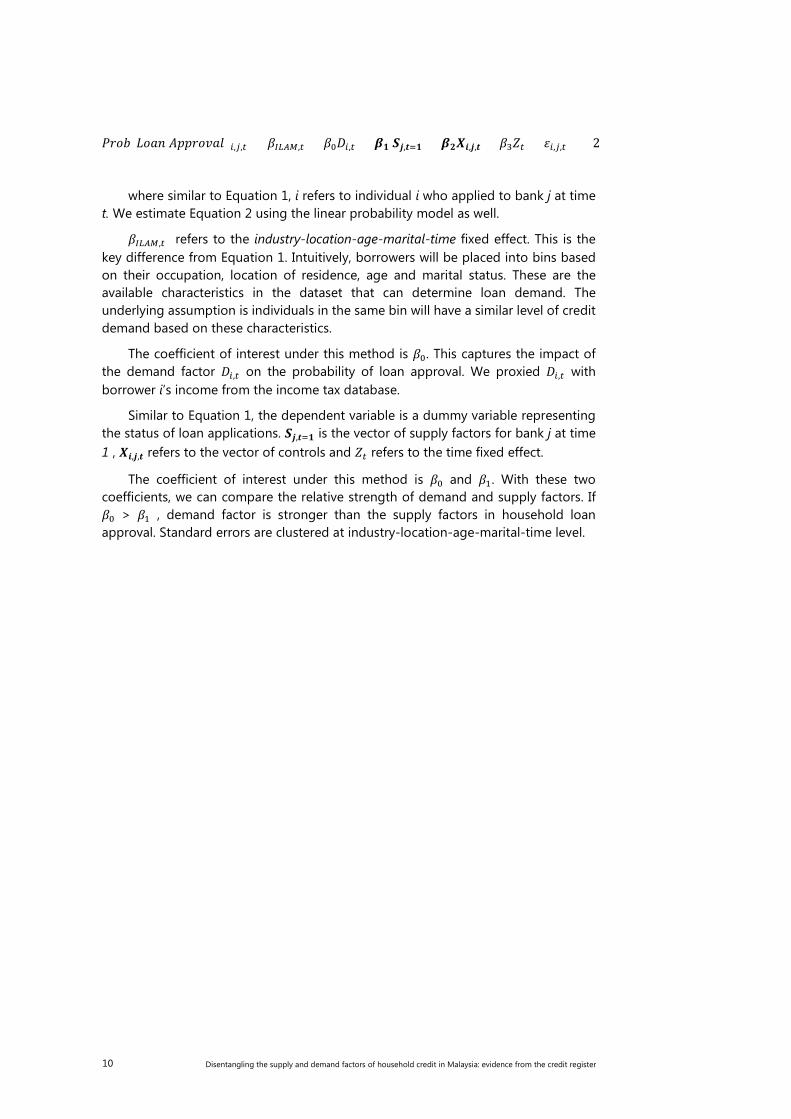
𝑃𝑃𝑃𝑃𝑃𝑃𝑃𝑃(𝐿𝐿𝑃𝑃𝐿𝐿𝐿𝐿 𝐴𝐴𝐴𝐴𝐴𝐴𝑃𝑃𝑃𝑃𝐴𝐴𝐿𝐿𝐴𝐴)𝑖𝑖,𝑗𝑗,𝑡𝑡 = 𝛽𝛽𝐼𝐼𝐼𝐼𝐼𝐼𝐼𝐼,𝑡𝑡 + 𝛽𝛽0𝐷𝐷𝑖𝑖,𝑡𝑡 + 𝜷𝜷𝟏𝟏 𝑺𝑺𝒋𝒋,𝒕𝒕=𝟏𝟏 + 𝜷𝜷𝟐𝟐𝑿𝑿𝒊𝒊,𝒋𝒋,𝒕𝒕 + 𝛽𝛽3𝑍𝑍𝑡𝑡 + 𝜀𝜀𝑖𝑖,𝑗𝑗,𝑡𝑡 (2)
where similar to Equation 1, i refers to individual i who applied to bank j at time t. We estimate Equation 2 using the linear probability model as well.
𝛽𝛽𝐼𝐼𝐼𝐼𝐼𝐼𝐼𝐼,𝑡𝑡 refers to the industry-location-age-marital-time fixed effect. This is the key difference from Equation 1. Intuitively, borrowers will be placed into bins based on their occupation, location of residence, age and marital status. These are the available characteristics in the dataset that can determine loan demand. The underlying assumption is individuals in the same bin will have a similar level of credit demand based on these characteristics.
The coefficient of interest under this method is 𝛽𝛽0. This captures the impact of the demand factor 𝐷𝐷𝑖𝑖,𝑡𝑡 on the probability of loan approval. We proxied 𝐷𝐷𝑖𝑖,𝑡𝑡 with borrower i’s income from the income tax database.
Similar to Equation 1, the dependent variable is a dummy variable representing the status of loan applications. 𝑺𝑺𝒋𝒋,𝒕𝒕=𝟏𝟏 is the vector of supply factors for bank j at time 1 , 𝑿𝑿𝒊𝒊,𝒋𝒋,𝒕𝒕 refers to the vector of controls and 𝑍𝑍𝑡𝑡 refers to the time fixed effect.
The coefficient of interest under this method is 𝛽𝛽0 and 𝛽𝛽1. With these two coefficients, we can compare the relative strength of demand and supply factors. If 𝛽𝛽0 > 𝛽𝛽1 , demand factor is stronger than the supply factors in household loan approval. Standard errors are clustered at industry-location-age-marital-time level.

Disentangling the supply and demand factors of household credit in Malaysia: evidence from the credit register 11
Empirical Methods: Isolating Supply and Demand Factors Chart 3
First strategy (Equation 1) Second strategy (Equation 2)
Only individuals who applied to multiple banks All individuals
Source: Author’s illustration.
• Using individual-year fixed effect
• Since the comparison is across banks for the same individual, only differences in banks’ characteristics will affect the probability of loan approval
• Coefficient of interest is 𝛽𝛽1 in Equation 1. This is the effect from the supply factors
• Using industry-location-age-marital-year fixed effect
• We can compare the relative strength of demand (proxied by individual’s income) and supply factors for the same group of individuals
• Coefficient of interest is 𝛽𝛽0 (demand
factor) vs 𝛽𝛽1 (supply factors) in Equation 2

12 Disentangling the supply and demand factors of household credit in Malaysia: evidence from the credit register
5. Results
5.1 Results from Method 1
Table 2 in Appendix shows the results using Equation 1. Column 1 shows the result for housing loan and column 2 for car loan.
The results show that banks’ balance sheet matters. Banks with a higher funding ratio and capital ratio is more likely to approve a housing and car loan. A one standard deviation increase in the banks’ funding ratio and capital ratio would increase the probability of approval for a housing loan by 0.06 and 0.04 respectively, which represents a 9% and 5% increase in the probability of approval from the mean15 probability of approval. Similar results are observed for a car loan. However, the impact of liquidity ratio is different between a housing and car loan. It does not have a significant impact on the probability of housing loan approval but it does affect the car loan approval negatively. Banks with a higher liquidity ratio are more likely to reject the car loan application. A one standard deviation increase in banks’ liquidity ratio leads to a decline in the probability of a car loan approval by 0.04, which is a 6% decrease from the mean.
Among the supply factors, the funding ratio of the banks is the strongest determinant of household lending. As illustrated in Table 2 the size of the coefficient for the funding ratio is at least twice the size for the capital ratio and liquidity ratio.
5.2 Results from Method 2
Table 3 in Appendix displays the results for Method 2. We replace individual-time fixed effect with industry-location-age-marital-time fixed effect. The advantage of this method is discussed at the earlier section.
Similar to the results from Equation 1, banks with a higher funding ratio and capital ratio are more likely to approve a housing loan and car loan. A one standard deviation increase in the banks’ funding ratio and capital ratio increase the probability of housing loan approval by 0.05 and 0.03 respectively, which represents a 7% and 4% increase from the mean probability of approval. Similar results are observed for car loan approvals. In addition, banks with a higher liquidity ratio are less likely to approve a housing loan and car loan, especially the latter.
Under this method, we can compare the relative strength of demand and supply factors. From Table 3, we observe that a one standard deviation increase in the monthly income of the borrowers increases the probability of approval by 0.03, which represents a 5% increase in the probability of approval from the mean. This magnitude is smaller than the impact from funding ratio and comparable to that of capital ratio. This supports the case where β0 < β1 in which the supply factor is stronger than the demand factor in determining the housing and car loan approvals.
It is worth highlighting the potential selection issue in this sample that may explain the strength of the income factor. Given that borrowers in our sample paid income tax and applied for loans, they are likely to have a higher income level than
15 The mean probability of approval for a housing loan is 0.7, and for a car loan is 0.8. This is estimated
from the constant term in the regression as shown in Table 2.

Disentangling the supply and demand factors of household credit in Malaysia: evidence from the credit register 13
the general population. This may create a downward bias to the income result. The role of income may be much stronger if we take into account the broader population, especially those who did not file the income tax return forms or those who did not have access to submit a loan application.
6. Discussion and Policy Implications
The micro-level results show that banks’ funding ratio is the strongest determinant of household lending in Malaysia during the 2014-2016 period. This is consistent with the fact that deposit constitutes the main supply of loanable funds for banks in Malaysia and thus may act as the driving force of bank lending (see Chart 4). Banks with a lower funding ratio may thus be more risk-averse and restrictive in their lending activities.
The positive relationship between the capital ratio and lending activities is supported by the role of bank capital that acts as a buffer to insulate banks from the risk of insolvency (Rajan (1994); Jokipii and Milne (2008)). Banks with a higher level of capital can therefore accommodate a faster loan growth than banks with lower capital due to their higher capacity to absorb more losses in the event of a loan default (Kosak et al. (2014)).
However, the negative relationship between the liquidity ratio and lending activities is an interesting finding. A higher liquidity ratio should enable banks to draw down their cash and securities to meet any unexpected cash outflows without adjusting their loan portfolio (Gambacorta (2005); Kashyap and Stein (2000)). However, for the case of Malaysia, banks that have more liquid assets extend fewer car loans. More investigation is required to understand this unique feature of Malaysian banks.
Our findings on the importance of the funding ratio may explain the moderation in aggregate household loan approval growth during the 2014-2016 period. Household loan approval growth in Malaysia, especially for housing and car loans, has been declining despite stable GDP growth (Chart 5). Our micro-level findings suggest that the moderation may be driven more by the supply factors instead of demand. As shown in Chart 6, the aggregate funding ratio in the banking system did decline quite substantially during this period due to high net external outflow16.
16 BNM Annual Report 2014, 2015, 2016

14 Disentangling the supply and demand factors of household credit in Malaysia: evidence from the credit register
Malaysian Banking System: Composition of Funding Sources Chart 4
Source: “Evolving Dynamics of Banks’ Funding and Liquidity Management” BNM Financial Stability and Payment Systems Report 2016
80 79 76
7 6 64 4 5
9 10 12
0%
10%
20%
30%
40%
50%
60%
70%
80%
90%
100%
2008
2012
2016
Deposit Repo Interbank borrowing Long-term Borrowing Capital
% of Funding
GDP Growth and Household Loan Approval Growth Chart 5
Source: Author’s estimate.
-30-25-20-15-10
-505
1015
1Q 1
4
2Q 1
4
3Q 1
4
4Q 1
4
1Q 1
5
2Q 1
5
3Q 1
5
4Q 1
5
1Q 1
6
2Q 1
6
3Q 1
6
4Q 1
6
Household loan approval Housing loan approvalCar loan approval GDP growth
yoy, %

Disentangling the supply and demand factors of household credit in Malaysia: evidence from the credit register 15
Malaysian Banking System: Aggregate Deposit to Total Liabilities ratio Chart 6
Source: Author’s estimate.
Our study could therefore serve as a starting point to discuss the impact of
policies on banks’ balance sheet and ultimately lending activities. In particular, our empirical findings on the importance of banks’ funding ratio in credit extension have several policy implications. First, the results highlight the importance of promoting developments in the financial system to encourage diversification in the sources of funding for financial institutions. For example, a deeper bond and equity market will reduce banks’ heavy reliance on deposit as the primary source of funding, which will help decrease the sensitivity of lending activities to movements in deposit.
Second, the unequal distribution of deposit in the banking system may have a non-trivial impact on the lending activities of smaller banks. Unlike the large banks, small banks rely more on deposit as their primary source of funding. Due to the lower concentration of deposit among the small banks, this may potentially affect their willingness to lend given the lack of available funds.
However, there are several key limitations to our findings. First, as highlighted in the previous section, there are selection issues in our sample. Only individuals who filed the income tax and applied for loans are captured in our dataset. Also, many banks in Malaysia pre-filter the loan applications by income. Thus any prospective applicants who are below a certain income threshold may have already been rejected before they are registered in the credit register.
Second, unlike the supply indicators, we have limited demand indicators in the dataset. Only income and basic households’ characteristics such as age, marital status, the location of residence and industry are available in the dataset. Other important factors such as the historical credit score and the debt-service ratio (DSR) of the applicants are not available. Of note, we also do not observe the price of the loan (i.e., the interest rate) offered to the applicants, which limit our analysis to only the quantity of loans.
71
72
73
74
75
76
77
78
79
2014
Q1
2014
Q2
2014
Q3
2014
Q4
2015
Q1
2015
Q2
2015
Q3
2015
Q4
2016
Q1
2016
Q2
2016
Q3
2016
Q4
Ratio

16 Disentangling the supply and demand factors of household credit in Malaysia: evidence from the credit register
Third, it is also important to note that the role of demand and supply factors may change depending on the economic environment. For example, using a dataset of loan applications covering Spain from 2002 to 2010, Jimenez et al. (2012) found that banks’ balance-sheet only matters during crisis periods. Firms’ balance-sheet, on the other hand, matters in both good and bad periods. Unfortunately, for Malaysia, the time period of 2014-2016 is too short to differentiate the channels during good and bad economic periods, which we leave for future research.
7. Conclusion
This paper aims to trace how supply and demand factors affect household loan approval. We create a borrower-bank pair dataset to do the isolation. We utilise two different methods to disentangle the demand and supply factors. There are two key findings from our results. First, we find that banks’ balance sheet (the supply factors) matters. Second, we find that the supply factors affect household loan approval more than the demand factor. The declining funding ratio due to high net external outflows can potentially explain the moderation in the aggregate household loan approval growth between 2014 and 2016. Overall, the findings in our paper fill a research gap for the Malaysian economy by identifying the role of banks’ balance sheet in household lending. Our empirical findings on the importance of the funding ratio could serve to inform the calibration of policies especially those in relation to lending activities.

Disentangling the supply and demand factors of household credit in Malaysia: evidence from the credit register 17
8. Appendix
Table 1: Summary Statistics
Variables Mean S.D.
Banks' Characteristics Funding ratio (%) 75 13.5 Capital ratio (%) 13.7 5.6 Liquidity ratio (%) 11.6 9.7 Size (Log total assets) 10.5 1.2 Borrowers' Characteristics Monthly income (RM) 9016.1 15030.1 Loan Application amount (RM, thousand) 246.9 340.6 Collateral value for housing loan only (RM, thousand) 2438 10500
Number of banks applied 4.2 2.8 Age 38.3 9.6 % accepted % rejected Status of loan applications 83% 17% Male Female Sex 63% 37% Married Single Marital status 40% 60%
*Note: Table 1 shows the summary statistics for the borrower-bank pair dataset. There are 530000 borrowers and 47 banks. Only individuals who paid income tax and applied for loan will appear in the dataset. We also restrict our borrowers to residents only. Only new loan applications are considered.

18 Disentangling the supply and demand factors of household credit in Malaysia: evidence from the credit register
Table 2: Effect of demand and supply factors on the status of loan applications (using the sample of individuals who applied to multiple banks (Equation 1))
Dependent variable Status of Loan Applications (1 if accepted, 0 otherwise)
[Column 1: Housing Loan] [Column 2 : Car Loan] Standardised Capital Ratio 0.037*** 0.052*** [0.006] [0.004] Standardised Funding Ratio 0.060*** 0.072*** [0.004] [0.003] Standardised Liquidity Ratio -0.004 -0.049*** [0.005] [0.005] Constant 0.662*** 0.770*** [0.017] [0.012] Loan's Characteristics Controls Loan Application Amount (Value) Yes Yes Collateral Value Yes No Bank's Characteristics Controls Size of Bank Yes Yes Bank's Market Share Yes Yes Time fixed effect Yes Yes Loan Type Housing Car Observations 247,069 354,598
Robust standard errors in brackets, *** p<0.01, ** p<0.05, * p<0.1 *Note: Table 2 shows the results from Equation 1. The regression examines how the probability of loan approval is affected by the supply factors. This is estimated using the sample of borrowers who applied to multiple banks. Housing loan and car loan applications are estimated separately in Column 1 and Column 2. We use a linear probability model for estimation. The dependent variable is a dummy variable to indicate the status of loan applications (1 if approved, 0 if rejected). Individuals’ characteristics are absorbed by the individual-time fixed effect. The key independent variables are banks’ supply factors (capital ratio, funding ratio and liquidity ratio) at the beginning of the year. Controls include the loan application amount, the collateral value, the size and the market share of banks. All variables are standardised for ease of comparison. Only new loan applications are considered. Robust standard errors in parentheses.

Disentangling the supply and demand factors of household credit in Malaysia: evidence from the credit register 19
Table 3: Effect of demand and supply factors on the status of loan applications (using all individuals (Equation 2))
Dependent variable Status of Loan Applications (1 if accepted, 0 otherwise)
[Column 1: Housing Loan] [Column 2: Car Loan] Standardised Monthly Income 0.029*** 0.025*** [0.004] [0.003] Standardised Capital Ratio 0.025*** 0.056*** [0.001] [0.001] Standardised Funding Ratio 0.051*** 0.064*** [0.001] [0.001] Standardised Liquidity Ratio -0.014*** -0.045*** [0.001] [0.001] Constant 0.683*** 0.847*** [0.005] [0.004] Loan's Characteristics Controls Loan Application Amount (Value) Yes Yes Collateral Value Yes No Bank's Characteristics Controls Size of Bank Yes Yes Bank's Market Share Yes Yes Time fixed effect Yes Yes Loan Type Housing Car Observations 263,058 399,573
Robust standard errors in brackets, *** p<0.01, ** p<0.05, * p<0.1 *Note: Table 3 shows the results from Equation 2. The regression examines how the probability of loan approval is affected by both demand and supply factors. This is estimated using the sample of all borrowers. Housing loan and car loan applications are estimated separately in Column 1 and Column 2. We use a linear probability model for estimation. The dependent variable is a dummy variable to indicate the status of loan applications (1 if approved, 0 if rejected). Individuals’ characteristics are absorbed by the industry-location-age-marital-time fixed effect. The key independent variables include banks’ supply factors (capital ratio, funding ratio and liquidity ratio) at the beginning of the year and the demand factor proxied by individuals’ monthly gross income. Controls include the loan application amount, the collateral value, the size and the market share of banks. All variables are standardised for ease of comparison. Only new loan applications are considered. Robust standard errors in parentheses.

20 Disentangling the supply and demand factors of household credit in Malaysia: evidence from the credit register
9. References
Alper Koray, Hulagu Timur, Keles Gursu (2012) “An Empirical Study on Liquidity and Bank Lending” Central Bank of Turkey Working Paper No 12.
Amiti, M. and D.E. Weinstein (2018) “How much do idiosyncratic bank shocks affect investment? Evidence from matched bank-firm loan data” Journal of Political Economy Vol 126, No 2.
Bank Negara Malaysia Annual Report (2014; 2015; 2016).
Bernanke, Ben S., Blinder, Alan S. (1992) “The Federal Funds Rate and the Channels of Monetary Transmission” American Economic Review Vol 82, No 4.
Black, Lamont K., Rosen, Richard J. (2007) “How the Credit Channel Works: Differentiating the Bank Lending Channel and the Balance Sheet Channel” Federal Reserve of Chicago Working Paper.
Campello, Graham M., J.R., and C.R Harvey (2010) “The real effects of financial constraints: Evidence from a financial crisis” Journal of Financial Economics , 97(3), 470-487.
Cornett, Marcia Millon, McNutt, Jamie John, Strahan, Philip E. and Tehranian, Hassan, (2011) “Liquidity risk management and credit supply in the financial crisis “ Journal of Financial Economics, 101, issue 2, p. 297-312.
Everaert, Greetje., Che Natasha, Geng Nan, Gruss Betrand, Impavido Gregorio, Lu Yinqiu, Saborowski Christian, Vandenbussche Jerome, Zeng Li (2015) “Does Supply or Demand Drive the Credit Cycle? Evidence from Central, Eastern, and Southeastern Europe” IMF Working Paper.
Favara, Giovanni, and Jean Imbs (2015) "Credit Supply and the Price of Housing." American Economic Review, 105 (3): 958-92.
Gabriel Jimenez, Steven Ongena, Peydro, Luis Jose., Jesus Saurina (2017) “Do demand or supply factors drive bank credit in good and crisis times?” Working paper.
Gambacorta, L (2005) “Inside the bank lending channel” European Economic Review, 49 (7).
Glenn Schepens, Jonghe, Olivier D., Hans Degryse, Sanja Jakovljevic, Klass Mulier (2018) “Identifying Credit Supply Shocks with Bank-Firm Data: Methods and Applications” R&R, Journal of Financial Intermediation.
Guillermo Alger and Ingela Alger (1999) "Liquid Assets in Banks: Theory and Practice," Boston College Working Papers in Economics 446, Boston College Department of Economics.
Jokippi, T., and Milne, A. (2008) “The cyclical behaviour of European bank capital buffers” Journal of Banking and Finance, 32(8).
Mian, Atif R. and Amir Sufi (2018) "Finance and Business Cycles: The Credit-Driven Household Demand Channel," NBER Working Papers 24322, National Bureau of Economic Research.
Mian, Atif R. and Amir Sufi (2010) "The Great Recession: Lessons from Microeconomic Data." American Economic Review, 100 (2): 51-56.
Disentangling the supply and demand factors of household credit in Malaysia: evidence from the credit register 21
Kashyap, Anil K. and Jeremy Stein (2000) “What do a Million Observation on Banks say about the Transmission of Monetary Policy” American Economic Review, 90(3).
Kashyap, Anil K., Jeremey Stein and David Wilcox (1993) “Monetary Policy and Credit Conditions: Evidence from the Composition of External Finance” American Economic Review, 83(1).
Khwaja, Asim I. and Mian, Atif R. (2008) “Tracing the Impact of Bank Liquidity Shocks: Evidence from an Emerging Market” American Economic Review Vol.98, No 4.
Kosak Marko, Li Shaofong, Loncarski Igor, Marinc Matej (2014) “Quality of Bank Capital and Bank Lending Behaviour during the Global Financial Crisis” International Review of Financial Analysis Vol 37.
Piti Disyatat (2010) “The bank lending channel revisited” BIS Working Papers No 297.
Rajan, R.G. (1994) “Why bank credit policies fluctuate. A theory and some evidence” Quarterly Journal of Economics, 109(2).
Shar Linn, Fann and Ang, Vincent (2016) “Evolving Dynamics of Banks’ Funding and Liquidity Management” Bank Negara Malaysia Financial Stability and Payment System Report.