is 3025-4 (1983): methods of sampling and test (physical … · 2018-02-02 · 1s : 3025 ( part 4)...
TRANSCRIPT
Disclosure to Promote the Right To Information
Whereas the Parliament of India has set out to provide a practical regime of right to information for citizens to secure access to information under the control of public authorities, in order to promote transparency and accountability in the working of every public authority, and whereas the attached publication of the Bureau of Indian Standards is of particular interest to the public, particularly disadvantaged communities and those engaged in the pursuit of education and knowledge, the attached public safety standard is made available to promote the timely dissemination of this information in an accurate manner to the public.
इंटरनेट मानक
“!ान $ एक न' भारत का +नम-ण”Satyanarayan Gangaram Pitroda
“Invent a New India Using Knowledge”
“प0रा1 को छोड न' 5 तरफ”Jawaharlal Nehru
“Step Out From the Old to the New”
“जान1 का अ+धकार, जी1 का अ+धकार”Mazdoor Kisan Shakti Sangathan
“The Right to Information, The Right to Live”
“!ान एक ऐसा खजाना > जो कभी च0राया नहB जा सकता है”Bhartṛhari—Nītiśatakam
“Knowledge is such a treasure which cannot be stolen”
“Invent a New India Using Knowledge”
है”ह”ह
IS 3025-4 (1983): Methods of Sampling and Test (Physicaland Chemical) for Water and Waste Water, Part 4: Colour[CHD 32: Environmental Protection and Waste Management]


.).
UDC 628-l/*3 : 543’3 : 535’65 ( Second Reprint MARCH 1996 ) IS:3025(Part4)-1983
Indian Standard
METHODS OF SAMPLING AND TEST ( PHYSICAL AND CHEMICAL) FOR WATER AND WASTE WATER
. APART 4 COLOUR
(First Revision)
1. Scope - Prescribes the following two methods for the determination of colour.
a) Platinum cobalt (visual-comparison ) method, and
b) Spectrophotometric method.
1 .l Platinum cobalt ( visual comparisbn ) method is applicable to nearly all samples of potable water and is not applicable to colour measurements on water containing highly coloured industrial wastes.
1.2 Spectrophotometric method is applicable for all types of water including domestic land industrial wastes. It is generally used in case of industrial wastes that cannot be determined by pl’atinum - cobalt method.
2. Platinum Cobalt ( Visual Comparison ) Method
2.1 Principle - Colour is measured by visual comparison of the sample with platinum - cobalt standards. One unit of colour is that produced by 1 mg of platinum per litre in the form of chloropla- tinate ion.
2.2 Interferences
2.2.1 Very slight amounts of turbidity interfere with the determination. Therefore samples showing visible turbidity should be clarified by centrifugation.
2.2.2 The method is pH dependent. Colour of water normally increases with increase -in pH value unless the coloured ion precipitates.
2.2.3 Use of filter paper may result in removal of some of the colour, leading to erroneous results. Therefore, filter paper should not be used for determination of true colour.
2.3 Sample Handling and Preservation - Representative samples shall be taken in clean glassware. Colour should be determined as early as possible after the collection of samples as biological activity or physical changes occuring during storage may affect the colour. Refrigeration at 4°C is recommended.
2.4 Apparatus
2.4.1 Nessler cylinders - 50 ml capacity. /
2.4.2 Centrifuge or filter assembly - With glass fibre filters or membrane filters with ,functional pore sizes of approximately 0’45 Pm. ( see Fig. 1 ).
2.5 Reagent
2.5.1 Standard chloroplatinate solution - Dissolve 1’246 g potassium chloroplatinate ( KnPtC16 ) (equivalent to 500 mg metallic platinum ) and 1’00 g crystalline cobaltous chloride ( CoClr.6H10 ) (equivalent to 250 mg metallic cobalt) in distilled water containing 100 ml of concentrated hydro- chloric acid. Dilute to 1 000 ml with distilled water. This standard solution is equivalent to 500 colour units.
2.6 Preparation of Standards
2.6.1 Prepare standards having colours units of 5, 10, 15, 20, 25, 30, 35, 40, 45, 50, 60 and 70 -by diluting O’!X 1’0, 1’5, 2’0, 2’5, 3’0, 3’5, 4’0,4’5, 5’0, 6’0 and 7’0 ml standard chloroplatinate so!ution with distilled water to 50 ml. Use distilled water as 0 unit standard.
2.6.2 Protect these standards against evaporation and contamination by use of clean inert stoppers. The standards should also be protected against absorption of ammonia, which causes increase in colour.
Adopted 30 December 1983 I
(Q August 1985, 91s I
8r 3
BUREAU OF INDIA-N STANDARDS MANAK BHAVAN. 9 BAHADUR SHAH ZAFAR MARG
NEW DELHI 110002

IS : 302g ( Part 4 ) - 1983
FIG, -1 FILTRATION SYSTEM FOR COLOUR DETERMINATION
2.7 Procedure
2.7.1 Apparenr co/our -- Observe the colour of the sample by filling a matched Nessler cylinder to the 50 ml mark with water and compare with standards. Compare by looking vertically downward through the cylinders towards a white surface placed at such an angle that light is reflected upwards through the column ~of liquid. If turbidity has not been removed, report the colour as ‘apparent colour’. If the colour exceeds 70 units, dilute the sample with distiHed water until the colour is in the range of the standards.
2.7.2 True co/our - Remove turbidity by centrifuging or filtering sample until the supernatant liquid is clear. Compare the centrifuged or filtered sample with distilled water to ensure that turbidity has been removed. If the sample is clear, then compare with the standards as given in 2.7.1.
2.8 Calculation - Calculate the colour units as follows:
Colour units -= “sVL
where
A = estimated colour of diluted sample, and
V = vblume in ml of sample taken for dilution.
2.9 Report - Report the results in whole numbers as follows:
&tour Units Record to Nearest
1 to 50 1
51 to 100 5
101 to 250 10
251 to 500 20
2.10 Precision and Accuracy - Data not available.
3. Spectrophotometric Method
3.1 Principle - Colour characteristics are measured at PH 7’6 and original pH of the sample by obtaining the visible absorption spectrum of the sample on a spectrophotometer. The percent transmission at certain wavelengths is used to calculate the results which are expressed ill terms of dominant wavelength, hue, luminance and purity.
2
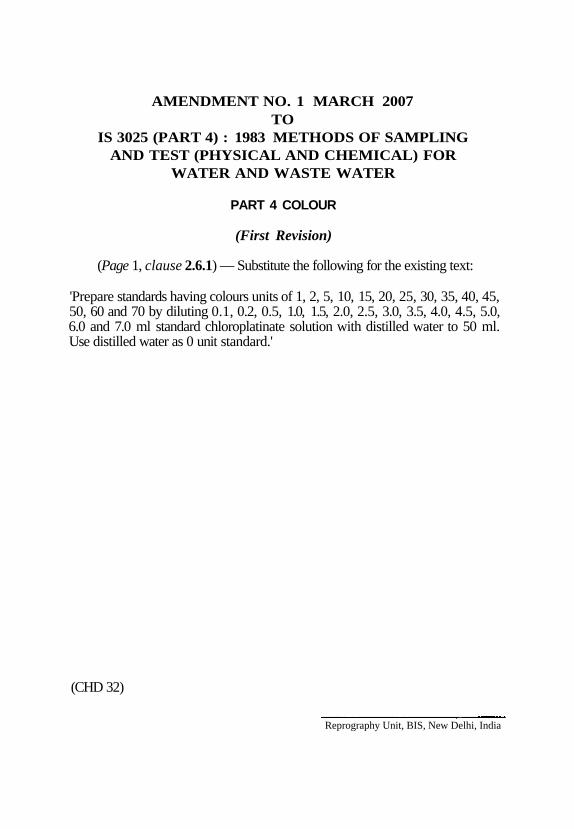
AMENDMENT NO. 1 MARCH 2007 TO
IS 3025 (PART 4) : 1983 METHODS OF SAMPLING AND TEST (PHYSICAL AND CHEMICAL) FOR
WATER AND WASTE WATER
PART 4 COLOUR
(First Revision)
(Page 1, clause 2.6.1) — Substitute the following for the existing text:
'Prepare standards having colours units of 1, 2, 5, 10, 15, 20, 25, 30, 35, 40, 45, 50, 60 and 70 by diluting 0.1, 0.2, 0.5, 1.0, 1.5, 2.0, 2.5, 3.0, 3.5, 4.0, 4.5, 5.0, 6.0 and 7.0 ml standard chloroplatinate solution with distilled water to 50 ml. Use distilled water as 0 unit standard.'
(CHD 32)
Reprography Unit, BIS, New Delhi, India

1s : 3025 ( Part 4) - 1983
3.2 Apparatus
3.2.1 Spectrophotometer - Having 10 mm absorption cells, a narrow (10 mm or less) spectral band and an effective operating range from 400 to 700 nm.
3.2.2 Filtration system - Consisting of following (see Fig. 1 ):
a) Filtration flasks, 250 ml with side tubes ;
b) Crucible holder;
c) .Micrometallic filter crucible, average pore size 40 pm;
d) Calcined filter aid (celite 505_or equivalent); and
e) Vacuum system.
3.3 Sample Handling and Preservation - Since biological activity may change the colour characteristics of a sample, the determination should be made as soon as possible. Refrigeration to 4°C is recommended.
3.4 Procedure
3.4.1 Take two 50-ml samples and bring to room temperature. Use one sample at original PH value and adjust pH of other sample to 7’6 by use of suitable volume of concentrated sulphuric acid or sodium hydroxide so that not more than 0’5 ml acid or alkali is used. Remove suspended material by centrifuging. Treat each sample separately by thoroughly mixing 0’1 g filter aid in a lo-ml portion of centrifuged sample and filtering the slurry to form a precoat in the filter crucible. Direct the filtrate to waste flask of filtration system. Mix 40 mg filter aid in a 35-ml portion of the centrifuged sample. With the vacuum still on, filter through the precoat and pass the filtrate to waste flask until clear, and then direct the clear filtrate flow to clean flask by means of three-way stop-cock. Collect 25 ml sample for measurement of transmittance.
Note - In case a larger volume of acid/alkali is required for pH adjustment, determine the exact quantity required and use the appropriate dilution factor.
3.42 For determination of light transmittance characteristics clean 10 mm absorption cells with detergent, rinse with distilled, filtered water and fill the cell with filtered water. Determine the trans- mittance values ( in percent ) for the sample at each of the-visible wavelength values given in Table 1. For fairly accurate work take readings at 10 ordinates marked with an asterisk, and for increased accuracy at all 30 ordina~tes. Set the instrument to read 100 percent transmittance on the distilled water blank. Make all determinations with a narrow spectral band.
TABLE 1 SELECTED ORDINATES FOR SPECTROPHOTOMETRIC COLOUR ~DETERMiNATlONS -
Ordinate No. I
X Y Z *
1
2*
3
4 5’
6
7 8+
9
10
11.
12
13
14’
15
Wavelength. nm ~---_--- _.__ ----- A--------------7
424’4 465’9 4141
435’5’ 489.5’ 422’2*
443’9 500’4 ’ 42t3.3
452’1 508’7 429.4
461’2’ 515.2, 432’0’
474.0 520.6 434’3
531’2 525.4 436.5
544’3, 529’8* 438’6’
552’4 533’9 440’6
558’7 537’7 442’5
564’1’ 641*4* 444’4+
568’9 544’9 446’3
573’2 548’4 448’2
577*4* 551’8’ 450’1+
581’3 555’1 452’1
( CoI7finusd )
3

IS : 3025 ( Part 4) - 1983
TABLE 1 SELECTED ORDlNATES FOR SPECTROPHOTOMETRlC COLOUR DETERMINATIONS - Contd
Ordinate No.
I_--___
16
17. 18
19 20’
21 22
23.
24 25
26.
27 28
29.
30
X I
Y I
Z
Wavelength, nm ~-_-__-_-------_ *------- --S-T
585’0 558’5 454.0
688.7, 661’9. 455’9,
592’4 565’3 457’9
596.0 668’9 459.9
599.6’ 572’5’ 462’0.
603’3 576’4 464.1
607’0 580’4 466’3
610.9. 584’8* 468’7.
615.0 589’6 471’4
619’4 594’8 474’3
624’2. 600’8+ 477’7.
629.8 607’7 481’8
636’6 616‘1 487’2
645’9. 627’3. 49,5.2*
663.0 647’4 511’2 i
Factors when 30 ordinates used
0’032 69 0’033 33 0’039 38
Factors when ID ordinates used
0’098 06 0’100 00 0’118 14
*Insert in each column the transmittance value in percent corresponding to the given wavelength. Where limited accuracy is sufficient, only the ordinates marked with an asterisk may be used.
3.6 Calculation
3.51 Tabulate the transmittance values corresponding to wavelengths shown in col X, Y and Z, in Table 1. Add each of transmittance columns and multiply the tables by the appropriate factors (for 10 or 30 ordinates) shown at the bottom of the table to obtain tristimulus values X, Y and Z. The tristimulus value Y is the percent luminance of the waste.
3.62 Calculate the trichromatic coefficients X and Y from tristimulus values X, Y and Z by the equations :
X X
= x+y+z
Y Y
=-Tp+z Locate the point (X, Ye) on one of the chromaticity diagrams shown in Fig. 2 and determine the
dominant wavelength and purity from this diagram. Determine the hue values from dominant wave- length value according to the ranges given In Table 2.
TABLE 2 COLOUR HUES FOR DOMINANT WAVELENGTH RANGES
Dominant Wave Length Range Colour Hue
nm
400 - 465 465 - 482 zze 482 - 497 Blue green 497 - 530 Green 530 - 575 Greenish yellow 575 - 580 Yellow 580 - 587 Yellowish orange 587 - 698 Orange
f% - - 620 700 Fzge red
5;cx ;;;= Blue purple Red-purple
Note - SS~ Fig. 2 for significance of ‘C’.
4

IS:3025( Part4) -1983
VALUE OF X
FIG. 2 CHROMATCITY OIAGRAM
3.6 Report - Report the colour characteristics at PH 7’6 and at Original pH in terms of dominant wavelength ( nm to the nearest unit) hue (for example, blue, blue green, etc) luminance ( percent to the nearest tenth ), and purity ( percent, to the nearest unit 1. Mention the type of instrument ( that is the spectrophotometer 1, the number of selected ordinates ( 10 or 30 ) and the spectral band width.
EXPLANATORY NOTE
Colour in water may be due to inorganic ions, such as iron and manganese, humus and peat materials, plankton, weeds and industrial wastes. The term ‘colour’ is used to mean true colour, that is, the colour of water from which turbidity has been removed. The term apparent colour includes not only the colour due to substances in solution but also that due to suspended matter. is determined on the original sample without filtration or centrifiguation.
Apparent colour
This ,method supersedes 5 of IS : 2488 ( Part 1 J-1966 ‘Methods of sampling and test for industrial effluents : Part 1’ and 5 of IS : 302W964 ‘Methods of sampling and test (physical and chemical ) for water used in industry’
5
Reprography Unit, BIS, New Delhi, India