is it time to rethink nutrition communications? a 5-year
TRANSCRIPT

PRACTICE APPLICATIONSTopics of Professional Interest
Is it Time to Rethink Nutrition Communications?A 5-Year Retrospective of Americans’ Attitudes
toward Food, Nutrition, and HealthTODAY’S CONSUMERS ARE ATthe center of a perplexing andchanging nutrition environment,particularly when it comes to
eating healthfully and reducing healthrisks associated with overweight andobesity.With instant access to informa-tion, itmight seem that Americans have“knowledge” literally at their finger-tips, yet evidence suggests that they arenot acting on this knowledge when itcomes to making decisions about foodand health. Insights revealed from thefirst 5 years (2006-2010) of the Interna-tional Food Information Council (IFIC)Foundation’s Food & Health Survey:Consumer Attitudes Toward FoodSafety, Nutrition & Health suggest that,although food and health communica-tionsmay have fostered general aware-ness, a disconnect remains among
This article was written by Betsy A.Hornick, MS, RD, LDN, Food, Nutri-tion & Health Communications, Pop-lar Grove, IL; Nancy M. Childs, PhD,professor of Food Marketing, SaintJoseph’s University, Erivan K. HaubSchool of Business, Philadelphia, PA;Marianne Smith Edge, MS, RD, LD,FADA, senior vice president, Nutrition& Food Safety, International FoodInformation Council Foundation,Washington, DC; Wendy ReinhardtKapsak, MS, RD, senior manager,Public Affairs, Monsanto Company, StLouis, MO (at the time of the study:senior director, Wellness, Interna-tional Food Information CouncilFoundation, Washington, DC); CarrieDooher, JD, vice president, SocialMarketing Practice, Ogilvy Washing-ton, Washington, DC (at time of thestudy: director, Trends and ConsumerInsights, International Food Informa-tion Council Foundation, Washing-ton, DC); and Christy White, princi-pal, Cogent Research, LLC,Cambridge, MA.
doi: 10.1016/j.jand.2012.10.009
Available online 13 November 201214 JOURNAL OF THE ACADEMY OF NUTRITIO
Americans’ perceptions, attitudes, andactual behaviors when it comes toachieving a healthful lifestyle.1–5
The 2010 Dietary Guidelines forAmericans (DGA) opens a new chapterin food and health communications, fo-cusing for the first time on an at-risk,overweight, obese population.6 It chal-lenges nutrition and health practitio-ners to consider new approaches formotivating today’s consumers towardmore healthful choices. Helping Amer-icans achieve diet and physical activitygoals means more than just communi-cating what to do. Communicationsmust reach consumers where they eat,work, and play and include strategiesthat both inspire and guide them onhow to make healthful behaviorchanges. This effort calls for programsand partnerships that deliver consis-tent, persistent, and positive messagesthat also provide interactive andhands-on direction to consumers.Using longitudinal data collected
during the first 5 years of the IFIC Foun-dation’s Food & Health Survey, this ar-ticle highlights key findings andtrends in consumer knowledge, atti-tudes, and behaviors.1–5 To relate toAmericans’ mindsets, nutrition andhealth practitioners, including regis-tered dietitians (RDs), must considerthis evidence of what consumersknow and understand, what theyidentify as important, what actions, ifany, they are taking to make improve-ments, and common barriers to mak-ing changes. Equipped with this infor-mation, practitioners can build oncommunication strategies that ap-pear to be working with consumerswhile rethinking other approachesthat will motivate and inspire changetoward achieving a healthful lifestyle.
SURVEY DESCRIPTIONThe IFIC Foundation’s Food&Health Sur-
vey is an annual national survey thatN AND DIETETICS © 2
monitors consumer knowledge, atti-tudes, and self-reported behaviors re-lated to important nutrition, health, andfood safety practices. Using a web distri-bution approach, Cogent Research wascommissioned by the IFIC Foundation todevelop and conduct the survey from2006-2010. Surveys were presented inEnglish, self-administered online, andcontained a range of 90 to 134 questions.In addition, researchers used Flesch-Kin-caid, a readability test designed to indi-cate comprehension difficulty, which ac-cessed the survey’s reading grade levelsbetween 6.8 and 7.5. Some questionswere repeated in the surveys, whereasothers varied toelaborateonprevious in-formationoraddressnewissues. Figure1summarizes the research objectives andhow they have evolved during the 5years. The Food & Health Survey permitsa unique longitudinal view of evolvingconsumer attitudes and their reportedbehaviors.Survey participants were members
of an online panel who have opted toparticipate in consumer research.They were recruited randomly to re-flect the latest US Census data for theUS adult population (18 years orolder) on key US Census characteris-tics, including age, sex, race, and levelof education. Responses from 1,000 to1,064 participants per year with asample size error of �3.0-3.1 for indi-vidual years and �4.4 among surveyyears 2006-2010.
KEY SURVEY FINDINGS ANDIMPLICATIONSThe following sections highlight keyfindings and implications from5 years ofdata collection. Select data are presentedin theTablewithkeyquestions identifiedand yearly responses. Demographic data
is from the 2010 Food & Health Survey.013 by the Academy of Nutrition and Dietetics.

ary o
PRACTICE APPLICATIONS
Perceptions of Overall Health,Weight Status, and Diet StatusOverall Health. From 2006-2010, atleast three quarters of Americans haveconsistently reported their health asbeing good to excellent, a surprisingfinding given the rates of overweightand obesity. They also reported a rela-tively high degree of satisfaction withtheir overall health; fewer consumersreported being either “not very satis-fied” or “not at all satisfied.”
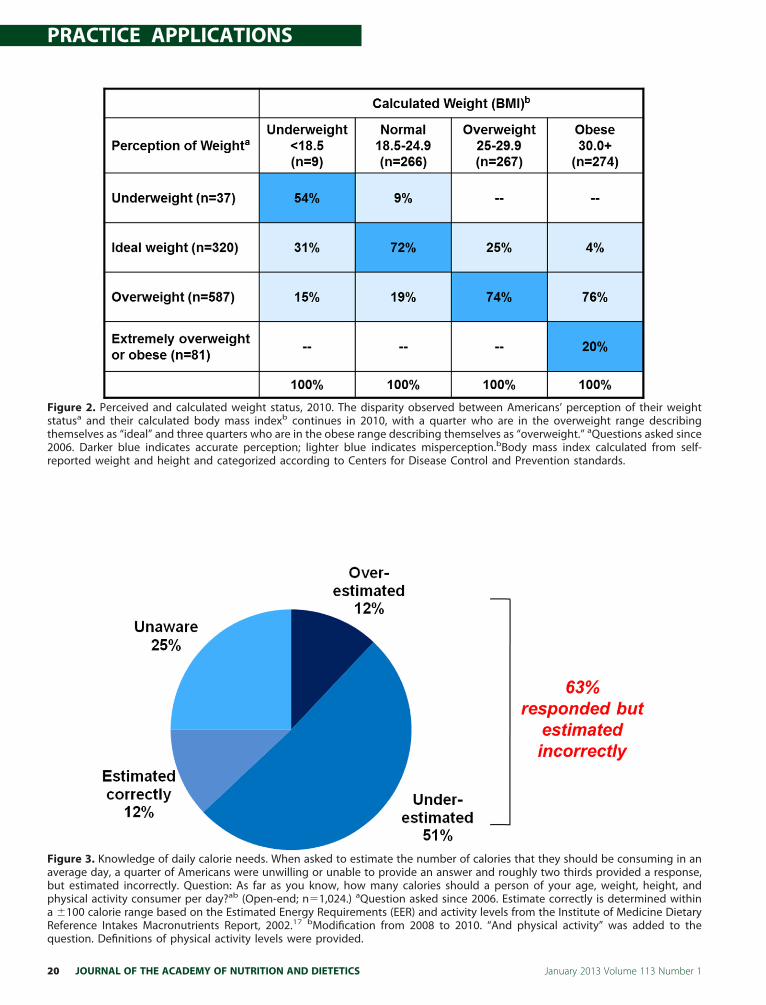
Weight Status. Each year, respondentsrated theirweight statusasunderweight,ideal, overweight, or extremely over-weight/obese. This was compared to ac-tual weight status, calculated as bodymass index (BMI) using self-reportedheight and weight and categorized ac-cording to Centers for Disease Controland Prevention standards.In 2010, 25% of the respondents with
BMI in the overweight range describedthemselves as “ideal” and 76% with BMIin the obese range described themselvesonly as overweight. This disparity be-tween Americans’ perceived and actualweight status has remained nearly un-changed since 2006 (Figure 2). Still, themajority of consumers in 2010 admittedto being “extremely” (21%) or “some-what” (49%) concerned about theirweight. Despite 70% expressing concernabout their weight, this concern has de-clined in recent years, down from 75% in2008, suggesting a movement towardcomplacency with weight status.However, many consumers reported
taking action regarding to their weight.Since 2007, about 8 in 10 Americans
Survey Year Key focu
2006 (benchmark survey) How conhealth; excarbohyd
delwonK7002sweeteneand typic
delwonK8002
delwonK9002
delwonK0102protein, s
Figure 1. Food & Health Survey. Summ
have consistently reported they are try-
16 JOURNAL OF THE ACADEMY OF NUTRITIO
ing to lose ormaintain theirweight. Thetop three changes reported for weightmanagement in 2009 and 2010 in-cluded changing the amounts of foodeaten, changing the types of foods orcomponents eaten, and engaging inphysical activity. Although consumers’reported approaches show a level ofknowledge related to weight manage-ment strategies, this knowledge doesnot appear to have reversed the inci-dence of overweight or obesity.Primary motivators to lose or main-
tain weight included improvements inphysical appearance or in overall healthandwell-being,while the top three bar-riers included lack ofwill power, lack oftime, and not seeing results quickly.Consistent over the 2009 and 2010 sur-veys, younger populations (18 to 24years of age) and those respondentsconcerned with their weight status re-ported physical appearance as a pri-mary motivator, whereas older adults(65 years of age and older) with ahigher income level were trying to loseor maintain weight for improvementsin health and overall well-being. Since2007, women have been more likelythan men to report that they were try-ing to lose weight. In addition, thosewho were not satisfied with theirhealth and whose BMIs were in theoverweight or obese range also re-ported attempts at weight loss.At a timewhen themajority of adults
and one in three children are over-weight or obese,7,8 Americans shouldbe increasingly concerned about theirweight status, its effect on health, andstrategies to improve healthful behav-
as of change
rs approach overall diet, physical activity,ed knowledge and attitudes toward food, as well as attitudes towards and use ofi
rawa;seirolactuobanoitamrofnifoesudd caffeine; benefits off ood that can conteal occasions
fasdnaytefasdoofgnidragersecitcarpd
plaroivaheb,secruosnoitamrofnignidrag
alabygrene/eirolacgnidragersecitcarpdm, food shopping destinations, and consu
f changes, 2006-2010.
ior and choices. With rising rates of
N AND DIETETICS
obesity also come increased risk fornoncommunicable diseases, includingcoronary heart disease, stroke, highblood pressure, type 2 diabetes, andother serious health conditions.9 YetFood & Health Survey results indicate apersistent disconnect between con-sumers’ perceptions of their weightstatus and health.Perhaps the perceived growing accep-
tance and/or state of denial regardingoverweightmay be interferingwith con-sumers’ desire tomakediet andbehaviorchanges. Nutrition and health practitio-nersmust seeknewandpracticalways toconnect with consumers; provide guid-ance inevaluatingpersonalweight statusand identifying a realistic body weight;encourage healthful behavior changes;and prioritize messages that foster un-derstanding of the connections amongdiet, weight, health, and cultural sensi-tivities.
Diet Status. Consistent with the USDepartment of Agriculture’s nationaldata reporting a declining assessmentby Americans in the overall healthful-ness of their diet,10 Food & Health Sur-vey trends indicate that fewer Ameri-cans rate their overall diets as healthful(“diet” was defined in the surveys to in-clude all foods; beverages; and vitamin,mineral, and other dietary supple-ments). Just over half rated their overalldiet as being somewhat or extremelyhealthful, a significant decrease fromearlier years (Table). This suggests agrowing recognition among consumersthat their diets may lack healthfulness,yet a sense of urgency appears to be
weight to manage their physicalponents such as fats, sugars, andation sources
seirolac-wolfosnoitpecrepdnase to physical health and well-being,
gnildnahd
noitaidarridoofdna,sevitiddadoof,sn
,srotavitomdnaslevelytivitcalacisyhptrust
s/are
sume andplor comrates nform
senenaegrs an ributal m
oofenaeg
rettaereg
,ecnnaegodiu mer
missing with an increasing number
January 2013 Volume 113 Number 1

PRACTICE APPLICATIONS
who rated their diets as “neitherhealthful nor unhealthful” (26%, 2010vs 20%, 2008). Women, those with acollege degree or higher, and thosewhoperceive themselves to be at an idealweight, are more likely to state thattheir diet is either “somewhat or ex-tremely healthful.”Steady since 2007, roughly 6 in 10
Americans reported making an effort toimprove the healthfulness of their diet.As shown in the Table, of those makingchanges in2010,weightwasa top reasonfor making dietary modifications. How-ever, in previous years, health-based rea-sons such as “improve overall well-be-ing,” “improve physical health,” and “fora specific health condition” all competedas top reasons consumers wanted tomake dietary changes. In 2010, thosemost likely to have made a change intheir diet include women, those who are18 to 34 years of age, and those who areconcerned about their weight.Americans make dietary changes for
many reasons, and weight loss hasgrown in prominence over the years.Successful consumer messaging re-quires a better understanding of themotives and behavioral determinantsfor specific groups or individuals. If be-havior change is desired, it is importantfor nutrition and health practitioners tofirst listen closely for specific goals andmotives, and then provide messagesand recommendations accordingly.
Consumers’ Calorie ConundrumThe DGA recognizes calorie imbalanceas a primary factor in the increased in-cidence of being overweight and obese,and suggests that everyone know theirdaily calorie needs based on their age,sex, and activity level to avoid inappro-priate weight gain.6 Food & Health Sur-vey findings demonstrated the need toprioritize communications around cal-ories, provide information on how tobalance calories, and make these mes-sages meaningful and actionable forconsumers.
Calories. Consumers reported a lack ofawareness of their personal calorie re-quirements and the effects of caloriesources on their weight. When asked tochoosewhether calories in general, calo-ries from fats, calories from carbohy-drates, or calories from protein weremost likely to cause weight gain, only
about 30% correctly identified that “calo-January 2013 Volume 113 Number 1
ries in general are what causes weightgain.” About 20% of Americans were notsure about the relationship between cal-orie sources and weight gain. These fig-ures have remained unchanged since2006.Also unchanged since 2006, only 12%
of Americans correctly estimated theirdaily calorie requirements in 2010(within a �100 calorie range based onage, weight, height, and physical activ-ity) (Figure 3). However, more consum-ers were willing to venture a guess attheir daily calorie needs in 2010 (75%)compared to 2006 (57%), potentiallysuggesting a growing interest in orawareness of calories. Messages thatencourage consumers to “know theirnumber” and understand that “caloriescount” may help consumers under-stand the important role that caloriesplay related to weight management.Recent research reveals that thesemes-sages, in fact, are motivating to con-sumers.11-13
Physical Activity. Physical activity isvital to helping consumers live ahealthful life. Between 2006 and 2009,when consumers were given a broaddefinition of physical activity, the per-centage of Americanswho reported be-ing physically active at least 1 day perweek increased from 64% in 2006 to83% in 2009. However, when the ques-tion was revised in 2010 to better un-derstand whether consumers weremeeting the 2008 US Department ofHealth and Human Services’ PhysicalActivity Guidelines, findings showedthat the majority of consumers (77%)were not meeting these guidelines. ThePhysical Activity Guidelines providescience-based guidance to help Ameri-cans improve their health through ap-propriate physical activity. Althoughmany food and nutrition practitionersfocus on food as a way to help consum-ers manage their weight, emphasizingthe important role of physical activitywill not only assist with weight man-agement, but also with overall health.
Insights and Understanding ofNutrientsWhile the 2006-2010 Food & Healthsurveys took a longitudinal look at spe-cific nutrients, such as dietary fats, car-bohydrates, and sugars, others nutri-
ents were added in subsequent years toJOURNAL OF THE ACAD
fully understand consumer attitudesregarding broader nutrients.
Dietary Fats. Dietary guidance hasevolved from a singular focus on reduc-ing total fat intake to adjusting thetypes of fats consumed. Yet all types ofdietary fat continue to have a poor rep-utation among Americans, with littlerecognition of the beneficial impactthat fats can have on health.From 2006 to 2009, about two thirds
of Americans reported concern withthe amount and type of fats consumed.As part of the first four Food & Healthsurveys, Americans were asked whetherthey had heard of various types of fatsand fatty acids, with trans fats, saturatedfats, and vegetable oils being the mostrecognized fats in 2009. Awareness oftrans-fatty acids grew from 81% in 2006to 90% in 2009, along with reported at-tempts to reduce dietary consumption oftrans-fatty acids. Awareness of n-3 fattyacids has remained fairly steady with74% in 2009 reporting that they haveheard of this type of fat. Yet only 51% in-dicated they were trying to eat more ofn-3 fatty acids.When making purchasing decisions,
the use of total fat, saturated fat, andcalories from fat information on theNutrition Facts panel appears to be de-clining, which may suggest that con-sumers are directing their attention toother nutrients and overall calories.
Carbohydrates, Sugars, and Low-calorie Sweeteners. Although con-cern with the total amount of carbohy-drates consumed remained stablebetween 2006 and 2009, more Ameri-cans became concerned with the typeof carbohydrate. Awareness of fiber andwhole grains increased, with a peak ininterest in 2008 when nine of 10 con-sumers reported that they were tryingto increase their intakes.Since 2008, consumers have become
increasingly concerned about theamount and type of sugar they eat. In2010, the majority of Americans re-ported trying to consume less sugar(70%) and less high-fructose corn syrup(63%), whereas a declining number ofAmericans believed that “moderateamounts of sugar canbepart of an over-all healthful diet” (58%, 2010 vs 71%,2008). Fewer Americans believed it isnot necessary to eliminate sugar from
their diet to loseweight. Likewise, a de-EMY OF NUTRITION AND DIETETICS 17
PRACTICE APPLICATIONS
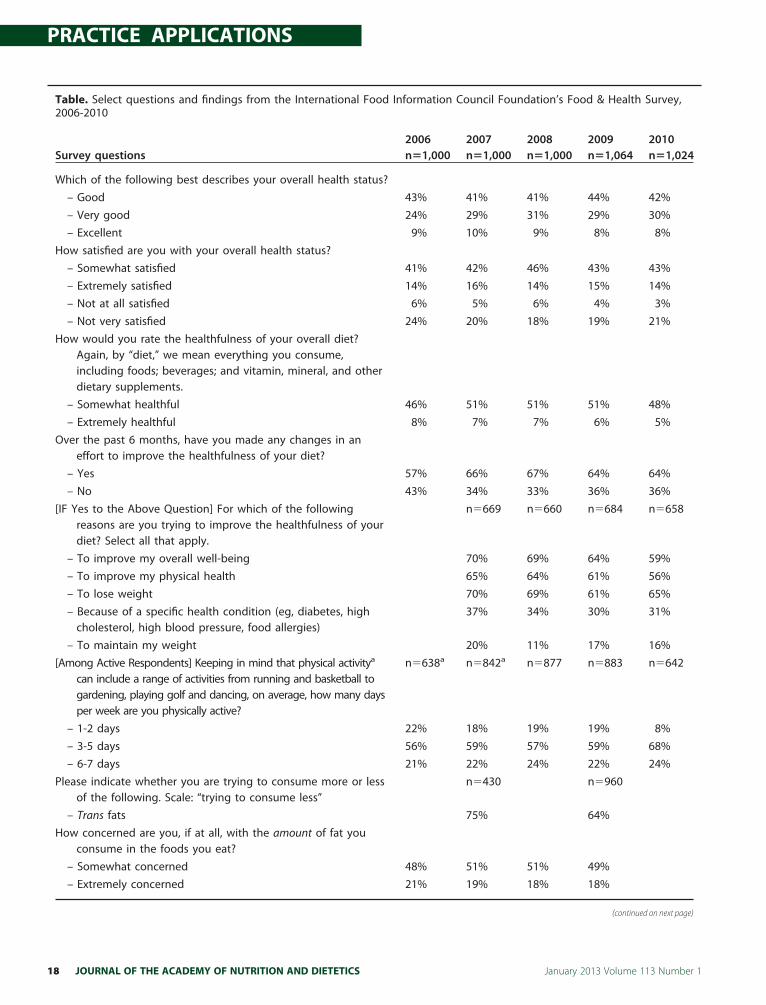
Table. Select questions and findings from the International Food Information Council Foundation’s Food & Health Survey,2006-2010
Survey questions2006n�1,000
2007n�1,000
2008n�1,000
2009n�1,064
2010n�1,024
Which of the following best describes your overall health status?
– Good 43% 41% 41% 44% 42%
– Very good 24% 29% 31% 29% 30%
– Excellent 9% 10% 9% 8% 8%
How satisfied are you with your overall health status?
– Somewhat satisfied 41% 42% 46% 43% 43%
– Extremely satisfied 14% 16% 14% 15% 14%
– Not at all satisfied 6% 5% 6% 4% 3%
– Not very satisfied 24% 20% 18% 19% 21%
How would you rate the healthfulness of your overall diet?Again, by “diet,” we mean everything you consume,including foods; beverages; and vitamin, mineral, and otherdietary supplements.
– Somewhat healthful 46% 51% 51% 51% 48%
– Extremely healthful 8% 7% 7% 6% 5%
Over the past 6 months, have you made any changes in aneffort to improve the healthfulness of your diet?
– Yes 57% 66% 67% 64% 64%
– No 43% 34% 33% 36% 36%
[IF Yes to the Above Question] For which of the followingreasons are you trying to improve the healthfulness of yourdiet? Select all that apply.
n�669 n�660 n�684 n�658
– To improve my overall well-being 70% 69% 64% 59%
– To improve my physical health 65% 64% 61% 56%
– To lose weight 70% 69% 61% 65%
– Because of a specific health condition (eg, diabetes, highcholesterol, high blood pressure, food allergies)
37% 34% 30% 31%
– To maintain my weight 20% 11% 17% 16%
[Among Active Respondents] Keeping in mind that physical activitya
can include a range of activities from running and basketball togardening, playing golf and dancing, on average, how many daysper week are you physically active?
n�638a n�842a n�877 n�883 n�642
– 1-2 days 22% 18% 19% 19% 8%
– 3-5 days 56% 59% 57% 59% 68%
– 6-7 days 21% 22% 24% 22% 24%
Please indicate whether you are trying to consume more or lessof the following. Scale: “trying to consume less”
n�430 n�960
– Trans fats 75% 64%
How concerned are you, if at all, with the amount of fat youconsume in the foods you eat?
– Somewhat concerned 48% 51% 51% 49%
– Extremely concerned 21% 19% 18% 18%
(continued on next page)
18 JOURNAL OF THE ACADEMY OF NUTRITION AND DIETETICS January 2013 Volume 113 Number 1

007. Th we meld you eek?
PRACTICE APPLICATIONS
clining number of Americans agreedthat people with diabetes can includesome foods with sugar as part of theirtotal diet (see the Table).In 2009 and 2010, about 4 in 10
Americans agreed that low-calorie/ar-tificial sweeteners can play a role inweight loss or weight management.More than one third (38%) repor-ted consuming low-calorie/artificialsweeteners primarily to help with cal-orie management, whereas 22% indi-cated that they prefer the taste (2010)as a reason for consuming low-calorie/artificial sweeteners. When askedabout specific types of low-caloriesweeteners (2006-2009), the majorityof consumers (roughly 6 of 10) areaware of saccharin and aspartame.About one third of consumers are fa-miliar with sugar alcohols and sucra-lose. Awareness of stevia gradually in-creased to 21% in 2009.The DGA provides recommendations
Table. Select questions and findings f2006-2010 (continued)
Survey questions
How concerned are you, if at all, withconsume in the foods you eat?
– Somewhat concerned
– Extremely concerned
As far as you know, which of the folloare true? Select all that apply.
– It is not necessary to eliminate suweight
– People with diabetes can includepart of their total diet
Which of the following, if any, have yoimprove the healthfulness of your
– I have not used any resources tohealthfulness of my diet
– Family/friends support
Which of the following information, ifNutrition Facts Panel? Select all th
– Calories
– Total Fat
– Saturated Fat
– Sugars
aThe definition of physical activity changed from 2006 to 2walking, jogging, etc. On average, how often, if at all, wou
on foods and nutrients to increase or
January 2013 Volume 113 Number 1
reduce, yet there remains confusionamong consumers about the role ofsomenutrients and inwhat direction tochange consumption behaviors. For ex-ample, consumers may be ignoring nu-trient-specific information, such as ad-vice about dietary fats, because thesemessages often fail to relate nutrientsto foods consumers actually eat. In ad-dition, directions to reduce intake ofspecific nutrients and foods may be in-terpreted as negative rules, which re-search has shown are often resentedand ignored. On the other hand, mes-sages about moderating dietary intakeare seen as empowering and encourageconsumers tomake their own healthfulchoices.14 These findings indicate agreat educational opportunity to helpprovide positive and actionable mes-sages that not only focus on foods thatprovide specific nutrients but also rein-force balance and attention to overall
the International Food Information Cou
2006n�1,000
20n�
types of fat you
47% 47
22% 25
statements, if any,
rom your diet to lose
e foods with sugar as
ed in your efforts to? Select all that apply.
improve the
do you use on theply.
n�581 n�
78% 73
76% 73
60% 58
67% 63
e 2006 question was worded as follows: By physical activitysay you are physically active, for health benefits, in a given w
diet.
JOURNAL OF THE ACAD
Influences and InformationSourcesDietary Guidance. During the 5-yearperiod (2006-2010), familiarity withthe DGA and corresponding food guid-ance system (MyPyramid15 prior to the2011 introduction of MyPlate16) ap-pears encouraging. Close to three quar-ters of Americans have heard of theDGA since first asked in 2009, yet closeto half also admitted knowing very lit-tle about them. About 85% of Americans(2010) had heard of MyPyramid,which remained stable since 2006.The MyPyramid icon was better knownwith about half (51%) knowing at least afair amount about it during the 5 yearsof the Food & Health Survey.In 2010, sources of contact with
MyPyramid included doctor’s officeor health clinic (31%); TV, newspaper,or magazine story (28%); and food orbeverage package (20%). These figures
oundation’s Food & Health Survey,
02008n�1,000
2009n�1,064
2010n�1,024
49% 49%
21% 20%
48% 45% 41%
44% 39% 34%
n�684 n�658
38% 34%
29% 37%
n�627 n�738 n�698
75% 75% 74%
71% 69% 62%
58% 56% 52%
68% 61% 62%
an something that would increase your heart rate like
rom ncil F
071,00
the
%
%
wing
gar f
som
u usdiet
help
any,at ap
657
%
%
%
%
represent a decline from 2008. Amer-
EMY OF NUTRITION AND DIETETICS 19
PRACTICE APPLICATIONS
Figure 2. Perceived and calculated weight status, 2010. The disparity observed between Americans’ perception of their weightstatusa and their calculated body mass indexb continues in 2010, with a quarter who are in the overweight range describingthemselves as “ideal” and three quarters who are in the obese range describing themselves as “overweight.” aQuestions asked since2006. Darker blue indicates accurate perception; lighter blue indicates misperception.bBody mass index calculated from self-
reported weight and height and categorized according to Centers for Disease Control and Prevention standards.Figure 3. Knowledge of daily calorie needs. When asked to estimate the number of calories that they should be consuming in anaverage day, a quarter of Americans were unwilling or unable to provide an answer and roughly two thirds provided a response,but estimated incorrectly. Question: As far as you know, how many calories should a person of your age, weight, height, andphysical activity consumer per day?ab (Open-end; n�1,024.) aQuestion asked since 2006. Estimate correctly is determined withina �100 calorie range based on the Estimated Energy Requirements (EER) and activity levels from the Institute of Medicine DietaryReference Intakes Macronutrients Report, 2002.17 bModification from 2008 to 2010. “And physical activity” was added to the
question. Definitions of physical activity levels were provided.20 JOURNAL OF THE ACADEMY OF NUTRITION AND DIETETICS January 2013 Volume 113 Number 1
ye
PRACTICE APPLICATIONS
icans also reported seeingMyPyramidinformation in advertising, at/from aschool, and in a grocery store; each atabout 20%. Interestingly, among thosewho have heard of MyPyramid, themajority admitted not using it (71% in2010). From 2008 to 2010, only about1 in 10 reported using MyPyramid tohelp change their diet to either eathealthier or lose weight; less than 10%reported visiting the MyPyramidwebsite or using its tools to plan orassess their diets.Future dietary guidance communica-
tions need to address consumer behav-iors by first understanding where con-sumers are in their interest andunderstanding of dietary guidance.While recognition is a positive step,Americans are not necessarily connect-ing with dietary guidance tools. In anexpanding world of interactive mediaand mobile apps, understanding whereand how consumers wish to seek anduse dietary guidance information willbe increasingly important. The newMyPlate uses a familiar food- or meal-related image, which may provide fur-ther context for putting dietary guid-ance into actual practice. Future Food &Health surveys will explore the newMyPlate, icon, and messages.
Food Labels. During the 5 years of the
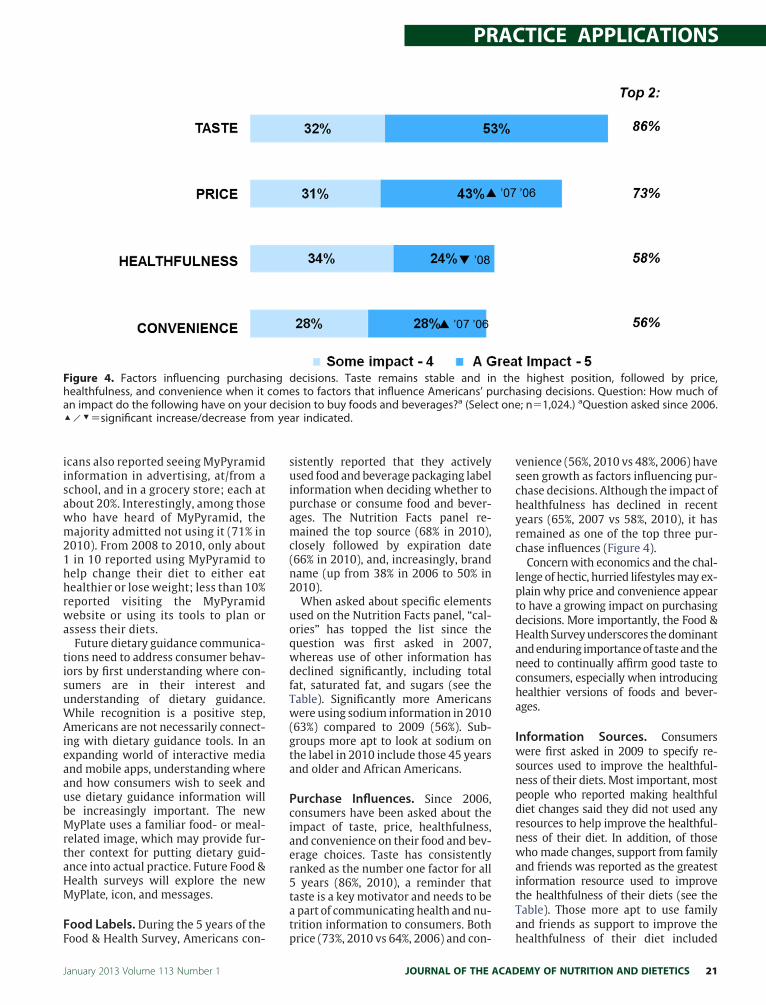
Figure 4. Factors influencing purchashealthfulness, and convenience when itan impact do the following have on your‘´’�significant increase/decrease from
Food & Health Survey, Americans con-
January 2013 Volume 113 Number 1
sistently reported that they activelyused food and beverage packaging labelinformation when deciding whether topurchase or consume food and bever-ages. The Nutrition Facts panel re-mained the top source (68% in 2010),closely followed by expiration date(66% in 2010), and, increasingly, brandname (up from 38% in 2006 to 50% in2010).When asked about specific elements
used on the Nutrition Facts panel, “cal-ories” has topped the list since thequestion was first asked in 2007,whereas use of other information hasdeclined significantly, including totalfat, saturated fat, and sugars (see theTable). Significantly more Americanswere using sodium information in 2010(63%) compared to 2009 (56%). Sub-groups more apt to look at sodium onthe label in 2010 include those 45 yearsand older and African Americans.
Purchase Influences. Since 2006,consumers have been asked about theimpact of taste, price, healthfulness,and convenience on their food and bev-erage choices. Taste has consistentlyranked as the number one factor for all5 years (86%, 2010), a reminder thattaste is a keymotivator and needs to bea part of communicating health and nu-trition information to consumers. Both
decisions. Taste remains stable and ines to factors that influence Americans’ psion to buy foods and beverages?a (Selecar indicated.
price (73%, 2010 vs 64%, 2006) and con-
JOURNAL OF THE ACAD
venience (56%, 2010 vs 48%, 2006) haveseen growth as factors influencing pur-chase decisions. Although the impact ofhealthfulness has declined in recentyears (65%, 2007 vs 58%, 2010), it hasremained as one of the top three pur-chase influences (Figure 4).Concernwith economics and the chal-
lenge of hectic, hurried lifestylesmay ex-plain why price and convenience appearto have a growing impact on purchasingdecisions. More importantly, the Food &Health Surveyunderscores thedominantandenduring importanceof tasteandtheneed to continually affirm good taste toconsumers, especially when introducinghealthier versions of foods and bever-ages.
Information Sources. Consumerswere first asked in 2009 to specify re-sources used to improve the healthful-ness of their diets. Most important, mostpeople who reported making healthfuldiet changes said they did not used anyresources to help improve the healthful-ness of their diet. In addition, of thosewhomade changes, support from familyand friends was reported as the greatestinformation resource used to improvethe healthfulness of their diets (see theTable). Those more apt to use familyand friends as support to improve the
highest position, followed by price,asing decisions. Question: How much of; n�1,024.) aQuestion asked since 2006.
ing thecom urchdeci t one
healthfulness of their diet included
EMY OF NUTRITION AND DIETETICS 21

PRACTICE APPLICATIONS
22 JOURNAL OF THE ACADEMY OF NUTRITIO
N AND DIETETICSthose 18 to 34 years of age, those whoconsidered themselves to have an un-healthful diet, and thosewho perceivedthemselves as obese. Fewer Americansreported using health professionals(14%),onlineresources includingsupportfrom community groups or blogs (11%),and dietitians (5%).About 6 in 10 Americans in the 2009
and 2010 Food & Health surveys identi-fied the food label as the top source ofinformation used to guide their food andnutrition choices. Other top sources in2010 included friends/family (40%), gro-cery/drug/specialty stores (29%), andhealth professionals (28%).Survey results show that food and nu-
trition practitioners, specifically RDs, areunderutilized when consumers seek in-formation about nutrition and health.The wide range of information sourcesused, much of it personally derived,raises concern since people tend to seekout like-minded opinions that may notlead to new attitudes and behaviors.There is an increasing need to informconsumers about the importance ofseeking well-qualified health and well-ness practitioners and resources.
RETHINKING CONSUMERCOMMUNICATION STRATEGIESLongitudinal consumer research sur-veys, such as the IFIC Foundation’s an-nual Food & Health Survey, providethe groundwork to help nutritioncommunicators, including RDs, betterunderstand how to meet consumerswhere they are in their understand-ing, and how to motivate them to-ward desired behavior change. Duringthe 5 years of the survey, there hasbeen an explosion in access to tech-nology and information, includingfood, nutrition, and health counsel,yet this has not appeared to facilitategreater consumer understanding oraction. These data raise the questionof whether traditional nutrition com-munications may have contributed toconsumer confusion and perhaps, thelack of motivation expressed by manyAmericans.In this era of information overload
and personal choice, Americans arefaced with myriad daily decisionsabout what they will eat and drinkand the type and amount of, if any,physical activity they will engage in.Nutrition and its impact on health is
only one of many factors that influ-January 2013 Volume 113 Number 1

PRACTICE APPLICATIONS
ence these decisions. Food & HealthSurvey results indicate that some nu-trition and health messages are in-deed being heard and Americans de-sire to engage in healthful behaviors.Imparting knowledge and directionthrough education may foster short-term action or interest, but currentapproaches have not facilitated estab-lished, long-term healthful habits. In-deed, we are at a critical juncture indetermining how to effectively com-municate with today’s consumers tomotivate them to action.At present, qualified food and nutri-
tion practitioners often go unrecog-nized and underutilized for helpingconsumers reach their healthy livinggoals. As the science-based experts innutrition, RDs must earn consumers’trust as an authentic source for adviceby seeking to understand their indi-vidual and complex needs, ratherthan just delivering information. De-veloping real relationships with con-sumers where they seek information,such as through social networks,blogs, twitter, mobile apps, and variedmedia channels, will help foster bet-ter consumer recognition of RDs as a“go to” source to guide their food andnutrition choices. Stopping to reallylisten to consumers regarding theircurrent behaviors and concerns iswhat is needed to equip them withpractical, relevant, and actionablestrategies for implementing and sus-taining healthful changes. Otherwise,consumers will continue to see di-etary changes as a “do-it-yourself”project to be completed some otherday—with orwithout the right “tools.”The DGA provides an excellent op-
portunity to rethink current ap-proaches and develop new, innova-
tive, and customized communicationJanuary 2013 Volume 113 Number 1
strategies to help consumers. RDs anddietetic technicians, registered areuniquely qualified to help Americansconnect knowledge with behavior toachieve a healthful, active life-style.12,13
References1. International Food Information Council
Foundation. 2006 Food & Health Sur-vey: Consumer attitudes toward food saf-ety, nutrition, and health. http://www.foodinsight.org/Resources/Detail.aspx?topic�Food_Health_Survey_Consumer_Attitudes_toward_Food_Nutrition_Health_2006_. Ac-cessed June 1, 2011.
2. International Food Information CouncilFoundation. 2007 Food & Health Sur-vey: Consumer attitudes toward food saf-ety, nutrition, and health. http://www.foodinsight.org/Resources/Detail.aspx?topic�2007_Food_Health_Survey_Consumer_Attitudes_toward_Food_Nutrition_Health.Accessed June 1, 2011.
3. International Food Information CouncilFoundation. 2008 Food & Health Sur-vey: Consumer attitudes toward food saf-ety, nutrition, and health. http://www.foodinsight.org/Resources/Detail.aspx?topic�2008_Food_Health_Survey_Consumer_Attitudes_toward_Food_Nutrition_Health.Accessed June 1, 2011.
4. International Food Information CouncilFoundation. 2009 Food & Health Sur-vey: Consumer attitudes toward food saf-ety, nutrition, and health. http://www.foodinsight.org/Resources/Detail.aspx?topic�2009_Food_Health_Survey_Consumer_Attitudes_toward_Food_Nutrition_and_Health. Accessed June 1, 2011.
5. International Food Information CouncilFoundation. 2010 Food & Health Sur-vey: Consumer attitudes toward food saf-ety, nutrition, and health. http://www.foodinsight.org/Resources/Detail.aspx?topic�2010_Food_Health_Survey_Consumer_Attitudes_Toward_Food_Safety_Nutrition_Health. Accessed June 1, 2011.
6. US Department of Agriculture, US Depart-ment of Health and Human Services. DietaryGuidelines for Americans. 7th ed. Washington,DC:USGovernment PrintingOffice; 2010.
7. Flegal KM, Carroll MD, Ogden CL, CurtinLR. Prevalence and trends in obesity
among U.S. adults, 1999–2008. JAMA.2010;303(3):235-241.JOURNAL OF THE ACAD
8. Ogden CL, Carroll MD, Curtin LR, LambMM, Flegal KM. Prevalence of high bodymass index in U.S. children and adoles-cents, 2007–2008. JAMA. 2010;303(3):242-249.
9. World Health Organization. Global StatusReport on Noncommunicable Diseases,2010. Geneva, Switzerland: WHO Press;2011. http://whqlibdoc.who.int/publications/2011/9789240686458_eng.pdf. AccessedDe-cember 1, 2011.
10. Variyam J. Americans are more realisticabout the quality of their diets. AmberWaves, USDA ERS. March 2010:7. http://www.ers.usda.gov/amberwaves/march10/findings/americandiets.htm.AccessedAu-gust 1, 2011.
11. Dietary Guidelines Alliance. 2010 DietaryGuidelines Alliance consumer research:Motivating families to lead ahealthier life-style in 2011 and beyond. http://www.foodinsight.org/Content/3651/FINAL2010DGAConsumerResearchReport.pdf. Ac-cessed March 9, 2011.
12. Reinhardt KapsakW, Smith EdgeM,WhiteC, Childs NM, Geiger CJ. Putting the Di-etary Guidelines for Americans into ac-tion: Behavior-directedmessages tomoti-vate parents—Phases I and II observationaland focus group findings. J Acad Nutr Diet.2012. In press.
13. Reinhardt KapsakW, Smith EdgeM,WhiteC, Childs NM, Geiger CJ. Putting the Di-etary Guidelines for Americans into ac-tion: Behavior-directed messages tomotivate parents—Phase III quantitativemessage testing and survey evaluation. JAcad Nutr Diet. 2012. In press.
14. Borra ST, Kelly L, Tuttle M, Neville K.Developing actionable dietary guidancemessages: Dietary fat as a case study. J AmDiet Assoc. 2001;101(6):678-684.
15. US Department of Agriculture and Cen-ter for Nutrition Policy and Promotion:Food Guide Pyramid. http://www.cnpp.usda.gov/FGP.htm. AccessedMarch 1, 2011.
16. ChooseMyPlate.gov. http://www.choosemyplate.gov/. Published June 2, 2011.Accessed August 29, 2011.
17. Institute of Medicine. Dietary referenceintakes for energy, carbohydrate, fiber,fat, fatty acids, cholesterol, protein, andamino acids. http://iom.edu/Reports/2002/Dietary-Reference-Intakes-for-Energy-Carbohydrate-Fiber-Fat-Fatty-Acids-Cholesterol-Protein-and-Amino-Acids.
aspx. Published September 5, 2002. Ac-cessed August 29, 2011.AUTHOR INFORMATION
ACKNOWLEDGEMENTS:The International Food Information Council (IFIC) Foundation would like to acknowledge the following people for their insights, review,comments, and guidance through the process to publish this article: IFIC Foundation Trustees; Kimberly A. Reed, JD, Executive Director, IFICFoundation; Ann Bouchoux, Senior Director, Nutrients, IFIC Foundation; Elizabeth Rahavi, RD, Director, Wellness, IFIC Foundation; LindseyLoving, Senior Director, Food Ingredients, IFIC Foundation; Kris Sollid, RD, Manager, Nutrients, IFIC Foundation; and Jania Matthews, AssociateDirector, Strategic Communications, IFIC Foundation.
EMY OF NUTRITION AND DIETETICS 23