is society ready for a.i. ethical decision making? lessons
TRANSCRIPT

Is Society Ready for A.I. Ethical Decision Making?
Lessons from a Study on Autonomous Cars
Johann Caro-Burnett NERPS
Hiroshima University
Shinji Kaneko
NERPS
Hiroshima University
IDEC DP2 Series Vol. 11 No. 1
IDEC Institute Hiroshima University
1-5-1 Kagamiyama, Higashi-hiroshima 7398529 Japan

Is Society Ready for A.I. Ethical Decision Making? Lessons
from a Study on Autonomous Cars∗
Johann Caro-Burnett† Shinji Kaneko‡
April 9, 2021
Abstract
We use two separate experiments to study social acceptance of AI ethical decision making. In the first
experiment, we test whether there is an unjustifiable fear of technology. Moreover, we contrast two method-
ologies to estimate preferences: an indirect method and a direct method. We find that the direct method
shows that humans have an aversion toward AI; however, the indirect method shows that humans do not
mind the implementation of new technologies. We identify the cause of this discrepancy and find that, in
addition to their own preferences, the respondents largely weight social preferences on the direct method.
Finally, in the second experiment, we study how humans react to different ways to introduce this new
technology to society to show that part of the fear of AI may be related to trust in the government.
Keywords: Artificial Intelligence; Ethics; Self-Driving Cars; Social Preferences
∗We thank the participants of the 2019 Asian Meeting of the Econometric Society and the microeconomics seminarat the University of Tokyo for their valuable comments. We have greatly benefited from the comments and suggestionsfrom Pedro C.F. Pinto. Sui Y. Lee has provided valuable research assistance. We are also thankful to a large group ofprofessors and their students in different countries who helped us organize the experiments and a number of HiroshimaUniversity students who helped us with translations and pilot testing.
†Hiroshima University and NERPS. [email protected].‡Hiroshima University and NERPS. [email protected].
1

1 Introduction
The accelerating evolution of technology and, in particular, artificial intelligence (AI) is unavoidable.
We are becoming increasingly more dependent on algorithms to process information for us, recommend
certain behaviors to us, and even take actions on our behalf. For instance, our email service providers
suggest possible recipients and recommend endings to our sentences. We obtain very accurate and
sometimes useful purchase suggestions (and even automated purchases) based on our shopping history.
Our cars can autonomously and suddenly fully stop if their sensors perceive a nearby body. More
recently, one can enable a feature to allow the car to drive by itself. These are examples of a trend
that will continuously increase the level of automaticity of machines.
Although the automaticity of machines is unavoidable, we might want to delay its implementation
for two reasons: (i) a justifiable understanding that the current technology is not yet ready to be
fully autonomous (which also depends on the action being automated) or (ii) an unjustifiable fear of
technology. In this paper, we investigate the second reason: we test how humans will perceive and
react to the fact that autonomous cars may have (now or in the near future) the ability to make
ethical decisions. Our study is divided into two parts. In experiment one, we test whether humans are
experiencing an unjustifiable fear of technology regardless of the state of the technology.1 Based on
those results, in experiment two, we compare two ways that a government can introduce automaticity
to our daily life: by a referendum or by direct policy implementation.
More precisely, in experiment one, we estimate humans’ assessments for the ethical decision making
of human and AI drivers. Moreover, we contrast two methodologies to estimate preferences: an indirect
method and a direct method. Then, we determine the correct interpretation for each of them, at least
1This test, however, does not mean that we imply that we are technologically ready to allow AI to make autonomousethical decisions in every aspect of our lives. Indeed, we aim to determine whether we (humans) are afraid of technologygiven our current social and moral development.
2

regarding preferences in ethical decision making.2 For the indirect method, we use a series of vignette
case scenarios similar to the trolley experiment. However, in our case, a driver (either human or
autonomous AI) has already made an ethical decision that implies saving some people at the cost of
harming others. The respondents are asked to rate the decision made by the driver on a scale from one
to five stars.3 Respondents were randomly divided as follows: a control group rates the decisions made
by a human driver, and a treatment group rates the decisions made by autonomous AI.4 Given that,
on average, both groups rate the same decisions made in the same scenarios, any difference between
the responses in the two groups measures a bias. If this bias happens to be toward disagreeing with
the AI (i.e., a low rating provided to the AI driver), then we can say that there is an unjustifiable fear
of technology.
For the direct method of our first experiment, we asked the respondents to answer one additional
“opinion-based” question. Each respondent was randomly (and independently from the first treatment)
assigned to one of six possible statements and asked to indicate their level of agreement. Three
questions involved a human driver, and three questions involved an autonomous driver. The first
alternative of those three questions asked the respondents’ opinion of ethical decision making.5 The
second alternative asked respondents to separate their beliefs from those of the rest of the society.
Finally, in the third alternative, we asked respondents to state what (they believe) to be society’s
opinion independent of their preferences. Respondents were instructed to rate their degree of agreement
2A direct method can also be referred to as stated preferences or “choice modeling,” and an indirect method, althoughbased on stated reports, is closer to a revealed preferences method and is sometimes called “contingent valuation” or“conjoint analysis.” Given the ethical nature and extreme outcomes of our study, it is nearly impossible to estimateactual revealed preferences.
3That is, different from the trolley experiment, the respondent does not choose who should be saved. Instead, therespondent rates the decision of another driver.
4Subsequently, we introduce a third group that answers the first half of the questions for rating a human driver andthe second half for rating an autonomous AI driver.
5This first alternative is similar to Bigman and Gray (2018).
3

with one of those six statements from one to five stars.
In the first experiment, we find that humans did not show any bias against AI in the indirect
questions. In contrast, by using the direct questions method, the average respondent answered as if
they had a negative bias against AI. Nevertheless, these two results can be consolidated. We explore
the variations in the direct method’s questions; in particular, in one of the three types of direct method
questions, we explicitly asked respondents to separate their preferences from those of society. We note
that if subjects were answering based solely on their preferences, adding the instruction to focus on
personal preferences and ignore social preferences should have no impact when asked whether we
should allow a driver to make ethical decisions. However, we show that when this explicit distinction
is not mentioned, the participants assigned some weight to social preferences.
In our second experiment, we no longer ask questions about human drivers; thus, we focus exclusively
on AI. We first randomly divided the subjects into three groups: a control group, a referendum group,
and a forced-implementation group. In this case, the control group is identical to the treatment
group of experiment one: subjects respond to fifteen vignette case scenarios with an AI driver. In
contrast, before answering the fifteen case questions, the referendum group first votes on a nominal
referendum for which the policy implementing AI always wins. Similarly, before answering the fifteen
case questions, the forced-implementation group “receives the news” that the government has decided
to allow AI to make ethical decisions and are asked to state their position. In the latter two cases, we
added a disclaimer that this is purely fictional and no such law is being implemented. Moreover, we
mentioned “the government” without explicitly telling them the country to which we are referring.
In experiment two, we explore two additional explanations to the “social preferences weight” result
for the difference between the direct and indirect approaches in the first experiment: (i) a status
quo effect (loss-aversion); and (ii) how it relates to citizens’ trust with their governments. Compared
4

with the case in which AI is the status quo (control group of experiment two), the effect of explicitly
mentioning that AI is introduced seems to depend on the quality of political institutions. In countries
in which people have relatively better institutions (i.e., Japan and the United States), informing the
population has an average positive effect on the perception of AI ethical decision making. In contrast,
the opposite is also true in countries in which people have relatively weaker institutions (i.e., Bolivia
and India). Moreover, among those who were initially against the introduction of AI ethical decision
making, having the option to vote has a positive effect on respondents’ perception about AI, while
being forced to accept the implementation of AI has a negative effect.
The remainder of this paper is organized as follows. In section 2, we briefly discuss the related
literature. In sections 3 and 4, we describe the experiment in detail and the data collection procedure,
respectively. In section 5, we show the basic results from experiment one. Section 6 analyzes more
deeply the results from the direct method of experiment one to show that when asking for their opinion
on social issues, people positively weigh social preferences. In section 7, we show the results from part
two of the experiment. Lastly, we finish with concluding remarks in section 8.
2 Theoretical Background
Concerns have existed for a long time over the ethics involving AI, including fictional stories (Asimov,
1942, as one of the earliest examples), inquires about its implications on religion (Wiener, 1964),
and studies on the need for its philosophical considerations (McCarthy and Hayes, 1981). More
recently, Goodrich et al. (2008) offered a broad summary of several studies involving human and
robot interactions, and chapter 4 identifies autonomy as a potential problem. Indeed, they note that
“autonomy is not an end in itself [...] but rather a means to supporting productive interaction.” The
5

authors state that the problems with autonomy arise from the (current) inferiority of AI. However,
Goodrich et al. (2008) do not discuss the process of humans accepting the ability of AI to act on
sensitive issues (such as ethical decision making) as a potential problem.
Other approaches to studying the relationship between AI and ethics focus on how to ethically
manage AI. That is, given that AI already exists (at least to some extent), one could ask questions
regarding the ethics of treating AI or ask how humans will react and judge the ability of AI to
make ethical decisions (Malle, 2016). McDermott (2011) analyzes the question we have in mind. He
argues that ethical reasoning and ethical decision making are different: the former can be achieved
by humans, while the latter can (to date) barely be done by contemporary machines. Although
McDermott formally studies these two concepts, we (humans) perceive this distinction intuitively.
Given the current technology and because a clear line exists between the ethical capabilities of humans
and AI, why would we even bother to compare them? The answer is that, in certain simple scenarios,
an algorithm may suffice to achieve nearly the same (if not exactly the same) outcomes between an
ethical reasoner and an ethical decision maker.6
Our research is closely related to the well-known trolley experiment in which the main question
focuses on the distinction between a utilitarian perspective (it is acceptable to sacrifice one person if
this action saves five people) versus a deontological perspective (if the action itself is wrong, do not do
it regardless of the outcome). There are several experiments on this topic; for example, Navarrete et al.
(2012) shows that more than 90% of people follow a utilitarian approach.7 Even among philosophy-
6By “simple,” we mean scenarios with few and clearly delimited options from which to choose.7In our experiment, based on questions 5, 10, and 15, only approximately 65% of the participants answered as
utilitarians. However, this is not a discrepancy with Navarrete et al. (2012). The mismatch might be the result ofsome participants not answering seriously. In early pilots, we personally interviewed people who answered these threequestions in a non-utilitarian way. A few answered that they either did not understand the tasks, and a larger proportionconfessed to not answering truthfully because of fear of being monitored. More importantly, no one said that they didnot want to take any action that would harm people (the alternative to the utilitarian case).
6

major subjects, Bourget and Chalmers (2014) shows that more than 68% chose the utilitarian outcome,
no more than 8% provided the deontological answer, and approximately 24% declined to answer.
A few studies measure human preferences regarding the ethical decision making of AI, which is a
valuable contribution to car manufacturers and policy makers (Riek and Howard, 2014; Goodall, 2014;
Bonnefon et al., 2016; Lin, 2016; Nyholm and Smids, 2016; Malle et al., 2015; Gogoll and Muller,
2017; Noothigattu et al., 2018). All of these studies (as well as ours) start with a setup similar
to the trolley experiment; however, the difference is in the research question. As opposed to the
majority of preceding studies, we are not interested in constructing aggregate social preferences to
be implemented in autonomous cars. The most closely related study to ours is Karasek (2020), who
measures neurological activity when humans are in presence of robots; similarly, we want to measure
social aversion towards AI. Indeed, we believe that the questions in Karasek (2020) and our study are
more fundamental and have different implications, especially from a policy-making point of view.
In this study, we utilize two methods to measure the bias against AI that, in principle, should
have similar results. Nevertheless, we observe that this is not the case: a direct approach shows that
humans are indeed afraid of technology; however, an indirect approach shows that humans do not
have a particular bias toward disagreeing on the ethical decision making of AI (at least no more than
they disagree with other human drivers). A few studies contrast a direct and an indirect method to
estimate preferences in contexts different from ours.8 The general consensus in those studies is that
the outcome variable tends to be more sensitive to the “treatment” variable in indirect methods, which
is a property also satisfied in our case. However, different from our research, none of those studies
8In most cases, they are environmental or transportation studies. Although this paper involves self-driving cars, webelieve our study is more closely related to morality than transportation research. Some examples are Wardman (1988);Hensher and Bradley (1993); Boxall et al. (1996); Scarpa et al. (2003); Bateman et al. (2006); Veisten (2007); Whiteheadet al. (2008); Miller et al. (2011).
7

attempted to explain the fundamental reason for the discrepancy between the results.9 We claim that
the discrepancy is the result of respondents internalizing social preferences and a status quo effect. We
then explore those two ideas in sections 6 and 7.
Although an ethical decision maker (as defined in McDermott, 2011) may suffice in some scenarios,
our awareness of the difference in human versus AI capabilities may lead us (humans) to have a bias
toward disagreeing with the machine regardless of whether the same outcome could be achieved by
humans or machines. Bigman and Gray (2018) is a recent study that asks questions similar to ours.
They find that a significant unjustifiable fear of AI exists. However, they only use questions that are
similar to our direct approach to reveal preferences. We not only contrast that method with an indirect
approach but also provide a theory for the methodological discrepancy. Indeed, our opinion is that
an indirect method is more appropriate to measure individual preferences because our results show
that people’s answers to direct questions are heavily weighted by society. Zaller and Feldman (1992)
make the argument that resembles ours when discussing how people answer in surveys versus what
they really want or feel: people answer based on what is “at the top of their heads” at that moment.
For questions regarding ethics, society is likely to be the idea at the top of respondents’ heads.
3 Experiment Design
We conducted two experiments. Experiment one attempts to measures any existing bias against an
AI ethical decision maker. Moreover, participants of experiment one answered indirect and direct
questions designed to measure the mentioned bias. Experiment two studies how people react to
9Beshears et al. (2008) do not compare different methods but instead identify five cases in which the revealedpreferences may not represent the actual preferences.
8

different ways of introducing AI ethical decision making into society.10 Appendix table A2 provides a
summary of the experimental design.
Experiment One, Indirect Method
We conducted a multi-country controlled experiment. The respondents were presented a questionnaire
subdivided into two. First, we ask fifteen indirect questions that involve a driver facing an ethical
dilemma. Similar to the trolley experiment and previous studies on self-driving cars, a collision is
unavoidable, and the driver must decide whether to crash the car against either set A or set B of
people.11 It is not possible to take any alternative action.12 Previous studies have attempted to measure
social preferences by allowing the respondents to choose who should be saved (i.e., the respondent is
the driver). However, in our study, the driver has already decided to crash the car against set A,
causing severe damage to people in set A but surely saving the lives of the people in set B. Therefore,
the respondent is asked to provide a rating from one to five stars of the decision made by the driver.
One star indicates total disagreement, and five stars indicate total agreement.
There is randomization in two dimensions: (i) the treatment groups and (ii) the composition of
the sets of people A and B. The treatment for the indirect method is summarized by a dichotomous
variable: T1 = 0 if the driver is human and T1 = 1 if the driver is AI. Before the questions are asked,
people are randomly divided into three groups. The first two groups are assigned to rate (evaluate)
10Note that although autonomous cars are already being introduced, their availability is limited, and we expect to seemore discussion on this topic once their number is large enough to raise awareness. At that point, policy makers mayconsider regulations of different degrees.
11When typing this paper, we use the word “set” as opposed to the word “group” to avoid confusion with the treatmentgroups. However, during the experiment, we used the word “group” to describe the collection of people in either sets Aor B.
12Although some people have argued that such extreme events imply that the AI’s navigation software requiressignificant improvements, we believe that such situations may not be at all the driver’s fault. Indeed, it could be amistake by the pedestrians, which could happen with a small but positive probability regardless of whether a human orAI driver.
9

the decisions of a human (H) or an autonomous car (AI), respectively. That is, the fifteen questions
involve only one type of driver. In addition, the third group (M) answers seven questions about human
drivers and eight questions about an autonomous car. Moreover, for group M , the compositions of
pedestrians from questions 1 and 2 are repeated in questions 8 and 9, respectively; those from questions
3 and 4 are repeated in questions 11 and 12, respectively; and those from questions 6 and 7 are repeated
in questions 13 and 14, respectively.13 In all cases, respondents were asked to rate the ethical decision
of the driver from 1 to 5 stars using the rating system in Table 1.
Table 1: Rating System
F = I totally disagree with the driver’s decision.FF = I am inclined to disagree with the driver’s decision,
but maybe there’s additional relevant information notincluded in the pictures.
FFF = I am almost indifferent between agreeing and disagreeingwith the decision made by the driver.
FFFF = I am inclined to agree with the driver’s decision,but maybe there’s additional relevant information notincluded in the pictures.
FFFFF = I totally agree with the driver’s decision.
The second type of randomization of the indirect method is of the composition of sets A and B of
people. These two sets can have between one and three people, and those people can be children,
adults, or seniors. There are fifteen questions; however, three of them are used to control for potential
“bad respondents.”
Questions 5, 10, and 15 have a restricted domain for randomization. Because the driver has decided
to collide against set A, for these three questions: (i) set A is always of size 3, (ii) set B is of sizes
either 1 or 2, and (iii) all people (in total 4 or 5 pedestrians) are of the same type (all children, or
all adults, or seniors). This should make disagreement with the driver’s decision the obvious choice.
13Questions 5, 10, and 15 are used to detect potential bad respondents. See below.
10

Therefore, anyone who gives at least a 3-star rating in either of these questions is flagged as a bad
(non-utilitarian) respondent.14 The randomization for the remaining twelve questions is as follows.
For questions 1 to 4, the group sizes are either 1 or 2 for each group (in total, 4 combinations of group
sizes), and each type of person is also randomly selected. For questions 6 to 9, the group sizes are
either 2 or 3 for each group (in total, 4 combinations of group sizes), and each type of person is again
randomly selected. Finally, for questions 11 to 14, the group sizes can be 1, 2, or 3 for each group (in
total, 9 combinations of group sizes), and each type of person is again randomly selected.
Experiment One, Direct Method
After the fifteen direct questions, there is one more instance of randomization (independent from T1),
which is the second treatment: T2. Each respondent was randomly assigned to one out of six possible
“opinion-based” questions: three questions involved a human driver, and three questions involved an
autonomous AI driver. The first type of question, type a, asked the respondent’s opinion on ethical
decision making. The statement was, “It is acceptable that experienced drivers (or AI) are allowed
to make ethical decisions.” Respondents were asked to rate the previous statement from 1 to 5 stars.
Ideally, a type a question should implicitly ask for respondents’ personal preferences; however, it is
possible that doing so introduces noise. Namely, we believe that the answer to this question includes
both personal preferences and (beliefs of) aggregated social preferences. To test this idea, we added
two variations: questions type b and type c.
The type b question modified the statement in such a way that the respondents focus on their
personal preferences. We accomplish this by adding, “Regardless of what the society may think,
14Note that we are assuming that a good respondent is necessarily a “utilitarian” decision maker. However, accordingto a study by Navarrete et al. (2012), more than 90% of people are utilitarian. Therefore, we would not be missingmany potentially good respondents who happen to be “deontological” decision makers.
11

according to your personal opinion...” Similarly, the type c question modified the statement in such a
way that the respondents focus on (their beliefs about) aggregate social preferences. We accomplish
this by adding, “Regardless of your personal opinion, according to society...” Each of these six opinion-
based questions had a probability of 1/6 of being assigned to a respondent.
Experiment Two
After some months, we conducted a second round of multi-country experiments.15 The subjects were
randomly divided into three groups. All groups were asked to rate the ethical decision of an AI
driver in the same format as in the indirect method of experiment one. Thus, the control group of
experiment two is identical to the treatment group from experiment one (more precisely, group AI). In
this second experiment, there are two treatment groups. First, before the fifteen trolley-like questions,
the referendum group votes on a nominal plebiscite to decide whether AI should be allowed to make
ethical decisions. However, their votes are not counted. In the referendum group, the implementation
of AI always wins. After voting, participants go through a few introduction slides while “waiting for
the results of the referendum to be computed.” Then, they receive the news that the AI won and
proceed with the rating questions like the other groups.
The other treatment is the forced-implementation group. In this case, participants are simply given
the news that “the government has recently allowed autonomous cars to make ethical decisions.” Then,
subjects are asked to choose whether they (i) disagree with the new laws or (ii) accept the judgment
from the experts working with the government. After judging the new policy, participants proceed
with the rating questions like the other groups. At the end of the experiment, to avoid misinforming
the participants, both treatment groups were told that no such law or referendum is being discussed
15This happened during the COVID-19 pandemic.
12

in reality and were asked to confirm their understanding of the disclaimer.
Preamble to Experiments
Before either of the two experiments, the respondents were asked to read a comprehensive introduction.
At the end of the introduction, there was a quiz with three questions that captured the most relevant
part of the introduction. Those questions were: (i) “Is the driver experienced or a beginner?” for those
answering questions about human drivers and “Is the driver a human or an AI?” for those answering
questions about autonomous cars; (ii) “Is it possible to save both groups of people?,” referring to
sets A and B of pedestrians; and (iii) “Who is making the ethical decision, a third party or you?”
Respondents were not allowed to continue until they answered the quiz perfectly.
After the quiz, there was one practice question identical to the format of the indirect questions.
However, after the respondent’s evaluation (from one to five stars), we asked them to confirm the
meaning of their answer. For instance, those who gave a one-star rating were asked to confirm: “you
have selected one star, meaning that you totally disagree with the driver’s decision. Is that correct?”
Then, the respondents could confirm or go back to answer the same question again.
4 Data Collection
Our main source of respondents is university students. We contacted faculty members from several
universities in different parts of the world and asked them for help. Of those who replied, we asked
them to conduct our survey, which took no more than fifteen minutes, during a lecture (or during
the break between lectures). In addition, we shared links on social media and collected data from
anonymous respondents. Finally, because of the COVID-19 pandemic, we were unable to get in-
13

classroom respondents for half of the sample for the second experiment; thus, we used Amazon’s
Mechanical Turk services to get additional respondents. Table 2 summarizes the locations and dates
of the interventions.
Table 2: Data Source
Experiment oneLocation Data Source Date Participants Utilitarians % Utilitarians
Bangladesh Jahangirnagar U 4/23/2019 165 99 60.00%Bolivia Catholic U. of Bolivia 2/12/2019 28 18 64.29%China Shanghai Tech 5/17/2019 36 26 72.22%
Indonesia Sepuluh Nopember 5/23/2019 72 53 73.61%Brazil PUC-Rio 3/15/2019 26 20 76.92%India BITS Pilani U 4/24/2019 29 16 55.17%Japan Shimane U 12/13/2018* 91 58 63.74%
4/23/2019*Social Media N/A N/A 82 43 52.44%
529 333 62.95%
Experiment twoLocation Data Source Date Participants Utilitarians % Utilitarians
Bolivia Catholic U. of Bolivia 9/23/2019 133 100 75.19%Japan Tohoku University 7/1/2020 136 100 73.53%India Mechanical Turk N/A 124 61 49.19%
United States Mechanical Turk N/A 170 124 72.94%
563 385 68.38%
* We conducted experiment one of the study two times at Shimane University because we didnot include types b and c during the first intervention. When a university was repeated, we madesure that participants were not repeated. Data from Mechanical Turk was gathered during theCOVID-19 pandemic.
The experiments at universities were conducted in classrooms except for Tohoku University, where
the survey happened online but still right after finishing the lecture. Students were not allowed to talk
to each other, and they knew beforehand that 10% of the class would win a prize of approximately 20
USD for which only serious respondents would be eligible.16 Namely, two conditions had to be met to
16Roughly speaking, a prize was awarded to 10% of the registered students. However, because of a lack of attendanceand ineligibility resulting from “bad responses,” the effective probability of winning the prize was nearly 20%. Thismeans that the expected hourly payment was approximately 16 USD.
14

be eligible for the prize. First, the respondent had to provide a way to be identified (generally, student
ID or email address). Second, they were asked to complete the questionnaire in a “serious way.” That
is, we informed the student that we had (undisclosed) methods to identify who was not answering
responsibly. Although we did not inform the students of the methods used to identify reliable answers,
we decided on those methods privately and in advance (which we subsequently describe).
Instead of a lottery, respondents from Mechanical Turk received a fixed payment.17 For social media
respondents, we did not offer any payments.18 Finally, as an additional filter to potentially improve
our results, we labeled some respondents as “bad.” This label does not necessarily mean incorrect
but, instead, means that the respondent did not provide the expected “utilitarian” answers. This
categorization followed two criteria:
1) People who selected a rating of 3 or more stars for any of questions 5, 10, or 15 are considered bad
respondents.
2) Respondents who took an average of fewer than five seconds to answer each question are considered
bad respondents.
5 Estimating Preferences
Indirect Method
First, we test whether a bias against AI exists by asking respondents to rate drivers’ ethical decisions.
If such a bias exists, respondents should, on average, give a lower rating to the decisions of the self-
17Payments averaged 2.5 USD to complete the task. Since the task takes less than fifteen minutes to complete, theaverage payment per hour is at least 10 USD.
18Because social media data are regarded as secondary, we explain the details in the appendix C.
15

driving car. Let us recall that T1 = 1 when the question involves AI, and let us define the star rating
y1 ∈ {1, 2, 3, 4, 5} as the outcome variable. Then, we want to estimate the average treatment effect of
T1:
y1 = β0 + β1T1 + ε
Table 3 summarizes the results for the indirect method of experiment one. Surprisingly, respondents
showed no bias against AI. This result was completely unexpected and counterintuitive. Moreover,
these findings are very robust across different sub-samples and specifications. Although not significant,
the coefficients are positive, hinting that many humans actually favor having ethical decisions made by
AI rather than by other humans.19 The only case in which we found a negative but still not significant
estimate was on the sub-sample that exclusively looked at the M group, in column (5). Let us recall
that respondents in this group first answered questions involving a human driver and then repeated the
same scenarios but with an autonomous car. One can clearly see that we were “forcing” respondents
to have a bias against AI. Indeed, some respondents showed that bias.
Direct Method
From the previous analysis, the results show that the average respondent from several countries in-
cluded in our sample tends to be indifferent between AI or humans making ethical decisions. This
contradicted our initial guess and the findings in Bigman and Gray (2018). However, it makes sense
to claim that, although people are unconsciously willing to accept AI’s ethical decision making, they
are also concerned about (what they believe is) the social consensus. To test this hypothesis, we asked
19A sub-sample analysis shows that countries have no significant bias or, in a couple of cases, a slight positive bias infavor of AI; see appendix Table A1.
16

Table 3: Experiment one, indirect question
y1=Star rating for driver
(1) (2) (3) (4) (5)
AI driver (T1 = 1) 0.103 0.0970 0.154 0.0822 -0.0996(0.0840) (0.0984) (0.127) (0.0823) (0.0604)
constant 2.727*** 2.537*** 2.904*** 2.944*** 3.047***(0.0425) (0.0562) (0.0786) (0.0637) (0.160)
observations 5,547 3,525 2,496 3,480 984non-utilitarians Xmixed group X Exclusivelyquestions 5, 10 & 15 X Xunpaid respondents X X
Errors were clustered by experiment location for the targeted data and by country for the socialmedia data. Robust standard errors are in parentheses. ∗ p< 0.05, ∗∗ p< 0.01, ∗∗∗ p< 0.001.y1 is the star rating that takes a value between 1 and 5. A high value of y1 means that therespondent agrees with the driver’s ethical decision.
three different types of direct questions.
At the end of the questionnaire, respondents were asked to rate their level of agreement with
a statement declaring whether we (humans) should allow a certain type of driver to make ethical
decisions. T2 = 1 means that the question involves AI, and T2 = 0 means that the driver is human.
Moreover, this question is also sub-divided into three (mutually exclusive) categories, T2a, T2b, and
T2c, displayed in Table 4. In summary, respondents in T2a were asked to rate the most general
statement. Respondents in T2b were explicitly instructed to focus on their preferences and not on social
preferences. Finally, respondents in T2c were explicitly instructed to provide (their beliefs about) social
preferences rather than their preferences. Common sense dictates that people are afraid of technology.
Consequently, respondents should agree less with the statements with an AI driver. Table 5 shows
that, disregarding the subcategories a, b, and c, respondents indeed showed some bias against AI when
asked a direct opinion.
17

Table 4: Direct questions of experiment one
T2=0 T2=1driver is human driver is AI
Type a It is acceptable that experienceddrivers are allowed to make ethical de-cisions.
It is acceptable that autonomous carsare allowed to make ethical decisions.
Type b Regardless of what society may think,according to your personal opinion, itis acceptable that experienced driversare allowed to make ethical decisions.
Regardless of what society may think,according to your personal opinion, it isacceptable that autonomous cars areallowed to make ethical decisions.
Type c Regardless of your personal opinion, ac-cording to society, it is acceptable thatexperienced drivers are allowed tomake ethical decisions.
Regardless of your personal opinion, ac-cording to society, it is acceptable thatautonomous cars are allowed to makeethical decisions.
Table 5: Experiment one, direct question
y2=Level of agreement with statement(1) (2) (3) (4) (5)
Statement on AI -0.662*** -0.766*** -0.744*** -0.761*** -0.737***drivers (T2=1) (0.0896) (0.139) (0.162) (0.204) (0.155)Previous indirect -0.168 -0.257question (T1=1) (0.129) (0.173)constant 3.665*** 3.682*** 3.744*** 3.755*** 3.833***
(0.106) (0.123) (0.120) (0.119) (0.140)
observations 528 333 290 208 290non-utilitarians Xunpaid respondents X Xcontrolled by T1 pure T1 mixed
Errors were clustered by experiment location for the targeted data and by country for the socialmedia data. Robust standard errors are in parentheses. ∗ p< 0.05, ∗∗ p< 0.01, ∗∗∗ p< 0.001. y2is the star rating on a statement regarding the acceptance of a driver making ethical decisionsand takes values between 1 and 5. A low value of y2 means that the respondent is averse toaccepting the ethical decision making of a certain driver.
18

The result that T2 is significant and negative (as dictated by common sense) is robust under different
specifications. This result states that humans are afraid of AI. However, the results in table 3 indicate
that humans are willing to accept this new technology. Why do we have this discrepancy? The
answer lies in the methodology. The results in table 3 were derived from an indirect way of revealing
preferences, and the results in table 5 are from a direct approach. We claim that a direct approach
introduces noise. Respondents answer based on a convex combination of their preferences and (their
beliefs about) the preferences of society. Anticipating this reasoning, we divided the second treatment
into three slight variations and explored this differentiation below.
Table 6 differentiates the types of statements being evaluated by respondents. In this table, T2
captures the average effect of the type a question compared with the control group (human driver),
while T2b and T2c capture the additional effect of those differentiated treatments compared with T2a.
The coefficient for T2 is significant and negative. Therefore, group T2a responds differently compared
with respondents who are asked to state their level of agreement on statements about human drivers.
The coefficient for T2b is positive, which means that group b is statistically different from group a
within the subset of respondents who evaluate statements of AI drivers. More precisely, the answers
to the question that does not explicitly ask respondents to separate their opinion from those of society
are harsher to AI compared with the answers to the question that explicitly indicates respondents to
focus on their opinions (rather than those of society).
For example, if the coefficient of T2 equals −1, that means that people give one less point on
a 5-star rating to the statement that AI should be allowed to make ethical decisions relative to a
human driver. In addition, if the coefficient for T2b is +0.5, then people give about half less stars
on a 5-star rating to the statement that regardless of what society may think, according to my own
personal preferences, AI should be allowed to make ethical decisions. In other words, people’s distrust
19

Table 6: Experiment one, three types of the direct question
y2=Level of agreement with statement(1) (2) (3) (4) (5)
Statement on AI -0.797*** -0.965*** -0.978*** -1.055*** -0.963***drivers (T2=1) (0.123) (0.164) (0.187) (0.204) (0.176)T2b=1 0.419*** 0.524** 0.545** 0.577** 0.538**
(0.131) (0.178) (0.171) (0.172) (0.164)T2c=1 -0.0194 0.0490 0.163 0.345 0.144
(0.192) (0.227) (0.223) (0.226) (0.215)Previous indirect -0.167 -0.255question (T1=1) (0.126) (0.172)constant 3.665*** 3.682*** 3.744*** 3.755*** 3.832***
(0.106) (0.124) (0.120) (0.112) (0.140)
observations 528 333 290 208 290non-utilitarians Xunpaid respondents X Xcontrolled by T1 pure T1 mixed
Errors were clustered by experiment location for the targeted data and by country for the socialmedia data. Robust standard errors are in parentheses. ∗ p< 0.05, ∗∗ p< 0.01, ∗∗∗ p< 0.001. y2is the star rating on a statement regarding the acceptance of a driver making ethical decisionsand takes values between 1 and 5. A low value of y2 means that the respondent is averse toaccepting the ethical decision making of a certain driver.
20

for AI is still present but is less severe when asked to isolate their personal preferences from those
of society. In contrast, the coefficient for T2c is not significant, meaning that people’s distrust for
AI without explicitly mentioning whose preferences they should interpret is not statistically different
from that same distrust when explicitly asking them to provide society’s preferences. This hints that
a direct general question (type a) is probably interpreted as a question about society and not personal
preferences, at least for questions about ethics.
6 Social Weights
Based on the previous results, we argue that there is some sort of social weight embedded when
answering the unconstrained (type a) question. In this section, we propose a method to estimate that
social weight. Let Ui(s, T ) be the individual valuation of a statement s ∈ {a, b, c} that depends on
treatment T ∈ {human driver, autonomous car}.20 It depends on the respondents’ own values vi(T ),
beliefs about society’s values v(T ), and possibly some bias mostly from being part of an experiment
η(T ). Moreover, although the relative weights of the former two are a matter of the respondent’s
interpretation of what statement s says, the bias for being on an experiment is something that the
respondent incorporates unconsciously. Namely, let λ(s) and φ be numbers between 0 and 1 that
measure the relative weight given to social preferences and unconscious bias from being part of an
experiment, respectively. Then, we propose a simple functional form as follows:
Ui(s, T ) = φ[(1− λ(s))vi(T ) + λ(s)v(T )
]+ (1− φ)η(T ) + εi (1)
Moreover, the relative weight λ(s) is given by:
20To simplify the notation, in this section, T refers to the second treatment or T2.
21

λ(s) =
λ , for type a question
0 , for type b question
1 , for type c question
That is, type b questions force the respondents to consciously report their preferences, type c
questions force the respondents to consciously report their beliefs regarding social preferences, and
we are interested in measuring the implicit social weight λ. Namely, when the type a question is
asked, respondents do not know whether to interpret it as a question that asks about their pref-
erences or what society would accept; therefore, their answer depends on a combination of both:
Ui(a, T ) = φ(
(1− λ)vi(T ) + λv(T ))
+ (1− φ)η(T ) + εi.
The model has several parameters to estimate: vi(0), vi(1), v(0), v(1), η(0), η(1), φ, and λ. Conse-
quently, not all of them can be identified. However, it is possible to estimate the most relevant one:
λ. First, note that the treatment only takes two values. Therefore, the curvature of function vi and
v is not important, and a linear representation of the econometric model suffices. We use OLS and
an ordered logit.21 Finally, although vi can be heterogeneous among individuals, we assume that λ is
homogeneous. Therefore, we estimate:
Ui(s, T ) = θ0 + (θ1 + θ2Ib + θ3Ic)T + εi (2)
where T is a dummy that indicates whether the question addressed the control (human driver) or
treatment (AI) group, and Is indicates whether the statement was type s. Indeed, we solve for each of
the three types and obtain the following expressions:
21Indeed, the OLS estimation is the same as that on table 6.
22
Ui(s, T ) =
θ0 + θ1T + εi , for type a question
θ0 + θ1T + θ2T + εi , for type b question
θ0 + θ1T + θ3T + εi , for type c question
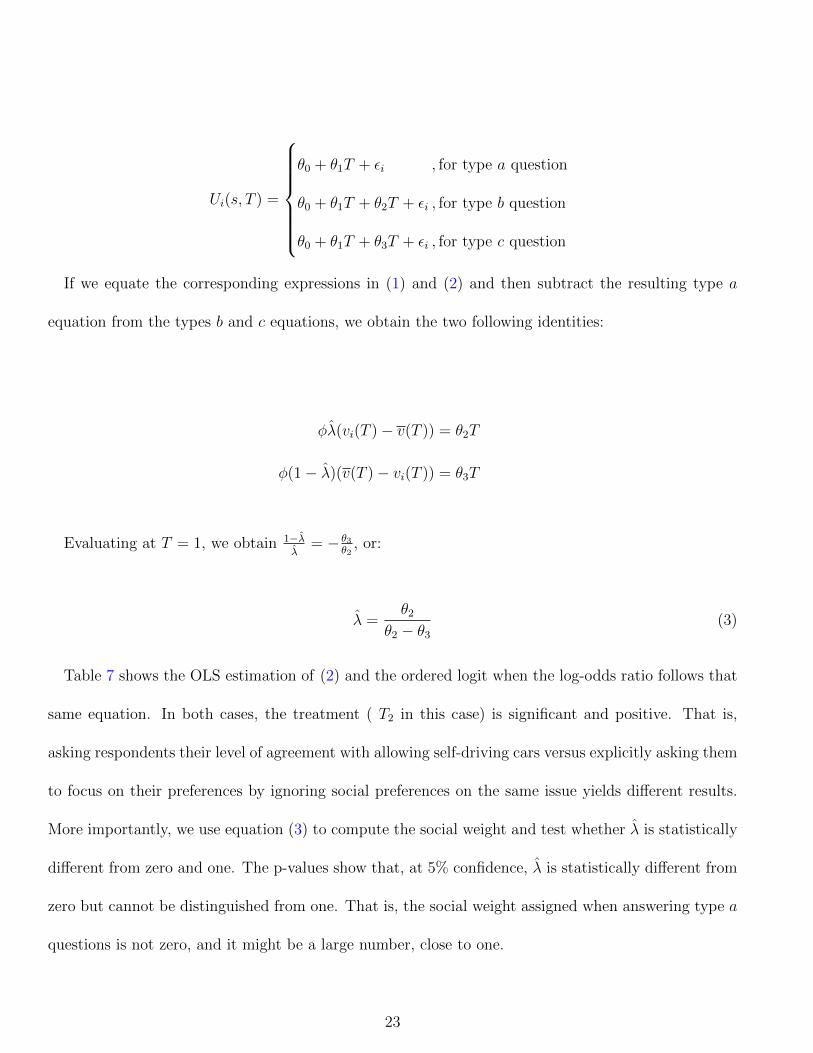
If we equate the corresponding expressions in (1) and (2) and then subtract the resulting type a
equation from the types b and c equations, we obtain the two following identities:
φλ(vi(T )− v(T )) = θ2T
φ(1− λ)(v(T )− vi(T )) = θ3T
Evaluating at T = 1, we obtain 1−λλ
= − θ3θ2
, or:
λ =θ2
θ2 − θ3(3)
Table 7 shows the OLS estimation of (2) and the ordered logit when the log-odds ratio follows that
same equation. In both cases, the treatment ( T2 in this case) is significant and positive. That is,
asking respondents their level of agreement with allowing self-driving cars versus explicitly asking them
to focus on their preferences by ignoring social preferences on the same issue yields different results.
More importantly, we use equation (3) to compute the social weight and test whether λ is statistically
different from zero and one. The p-values show that, at 5% confidence, λ is statistically different from
zero but cannot be distinguished from one. That is, the social weight assigned when answering type a
questions is not zero, and it might be a large number, close to one.
23

Table 7: Social weights
y2=Level of agreement with statementOLS Ordered logit
(1) (2) (3) (4)
Statement on AI -0.965*** -0.797*** -1.317*** -1.079***drivers (T2=1) (0.164) (0.123) (0.294) (0.217)T2b=1 0.524** 0.419*** 0.799*** 0.645***
(0.178) (0.131) (0.260) (0.188)T2c=1 0.0490 -0.0194 0.131 -0.0144
(0.227) (0.192) (0.303) (0.257)constant 3.682*** 3.665*** – –
(0.124) (0.106) – –
observations 333 528 333 528non-utilitarians X X
λ 1.103 0.956 1.196 0.978
p[λ = 0] 0.027 0.024 0.013 0.011
p[λ = 1] 0.836 0.917 0.684 0.955
Errors were clustered by experiment location for the targeted data and by country for the socialmedia data. Robust standard errors are in parentheses. ∗ p< 0.05, ∗∗ p< 0.01, ∗∗∗ p< 0.001. y2is the star rating on a statement of the acceptance of a driver making ethical decisions and takesvalues between 1 and 5. A low value of y2 means that the respondent is averse to accepting acertain driver’s ethical decision making.
24

This positive social weight partially explains why the estimations from a direct and an indirect
method different. Nevertheless, Table 6 shows that the statement that explicitly asks for personal
preferences does not completely eliminate the bias against AI (i.e., there is about a half-star point
that is not explained). Next, we discuss one possible reason for the remaining unexplained discrepancy
between the direct and indirect methods.
7 Policy and Implementation
The contrasting results from the direct and indirect method hint at the idea that, when being directly
asked for their opinion, people may have a bias against AI. At the same time, when being forced to
accept the existence of AI in their lives, people may not really have concerns. Thus, perhaps a status
quo effect may affect our results.22
This idea is explored in a second round of experiments. In experiment two, we focus on indirect
questions, and respondents exclusively evaluate AI drivers. The control group of experiment two is
identical to the treatment group of experiment one. In contrast, the treatments are two alternative
ways to introduce AI ethical decision making by a hypothetical government: a forced implementation
and implementation via a plebiscite. Regarding the forced implementation, the government already
decided to allow autonomous cars to make ethical decisions. Then, prior to evaluating the ethical
decisions of the AI (as before), respondents are asked whether they support the government’s decision.
On the plebiscite, again, prior to evaluating the ethical decisions of the AI, respondents are given the
option to vote on a referendum that asks whether they want to allow AI ethical decision making into
cars.
22(See, for example, Kahneman and Tversky, 1979).
25

In both cases, respondents can be in favor of or against the technology. However, the difference
is that, in the former case, the policy is already implemented. In the latter case, the policy has
not yet been implemented; thus, the status quo is different. More specifically, in the plebiscite case,
respondents implicitly know that the status quo is not having AI ethical decision making and that
their vote can change the outcome. Nevertheless, the voting is not really counted, and the outcome
of the referendum is always to allow autonomous cars. However, respondents do not know this at the
moment of voting.
Let us aggregate both treatments as one variable called information = either referendum or forced
implementation. Moreover, following basically any index on development or trust in a government, we
divided our sample into two groups: “good institutions” for Japan and the United States and “bad
institutions” for Bolivia and India. We interacted this sample categorization with the treatment of
experiment two. The results for this second experiment are shown in Table 8. Columns (1) and (4)
indicate that, in the entire sample, explicitly mentioning the introduction of AI ethical decision making
does not make a difference. However, columns (2) and (3) show that discussing the implementation
of AI increases people’s opinion in favor of AI in places with good institutions but decreases people’s
opinion of AI in places with poor institutions. Moreover, as shown in columns (5) and (6), this
differentiation seems stronger when given the option to “vote” on the issue.23
Finally, we check how our results depend on whether the respondent was initially in favor or against
the introduction of the new technology. More precisely, the group “in favor” is either those who voted
“yes” in the referendum or those who responded that they would accept the introduction of AI by
the government. Similarly, the group “against” is either those who voted “no” in the referendum or
23Note that, as shown in appendix Table A1, the sub-sample analysis of the indirect questions in experiment one wasmore homogeneous; that is, countries either had no significant effect or had a positive effect.
26

Table 8: Policy implementation
y3=Star raring for AI on experiment two(1) (2) (3) (4) (5) (6)
Information 0.0118(0.0679)
× good institutions 0.0863*** 0.158***(0.0138) (0.0162)
× bad institutions -0.0979 -0.185***(0.0869) (0.0192)
Option to vote 0.0454(0.144)
× good institutions 0.276*** 0.305**(0.0229) (0.0582)
× bad institutions -0.219*** -0.377*(0.0231) (0.121)
Forced implementation -0.0441(0.0671)
× good institutions 0.0478 0.147**(0.0508) (0.0269)
× bad institutions -0.149* -0.136(0.0606) (0.0602)
constant 2.538*** 2.615*** 3.341*** 3.216*** 3.342*** 3.398***(0.0479) (0.0612) (0.0127) (0.0679) (0.0104) (0.0603)
observations 5,775 5,775 8,444 8,444 8,444 4,844non-utilitarians X X X Xsample all all all all all age<30
Errors were clustered by experiment location for the targeted data and by country for the socialmedia data. Robust standard errors are in parentheses. ∗ p< 0.05, ∗∗ p< 0.01, ∗∗∗ p< 0.001. y3is the star rating to AI drivers on experiment two, and it takes a value between 1 and 5. A highvalue of y3 means that the respondent agrees with the ethical decision of the AI.
27
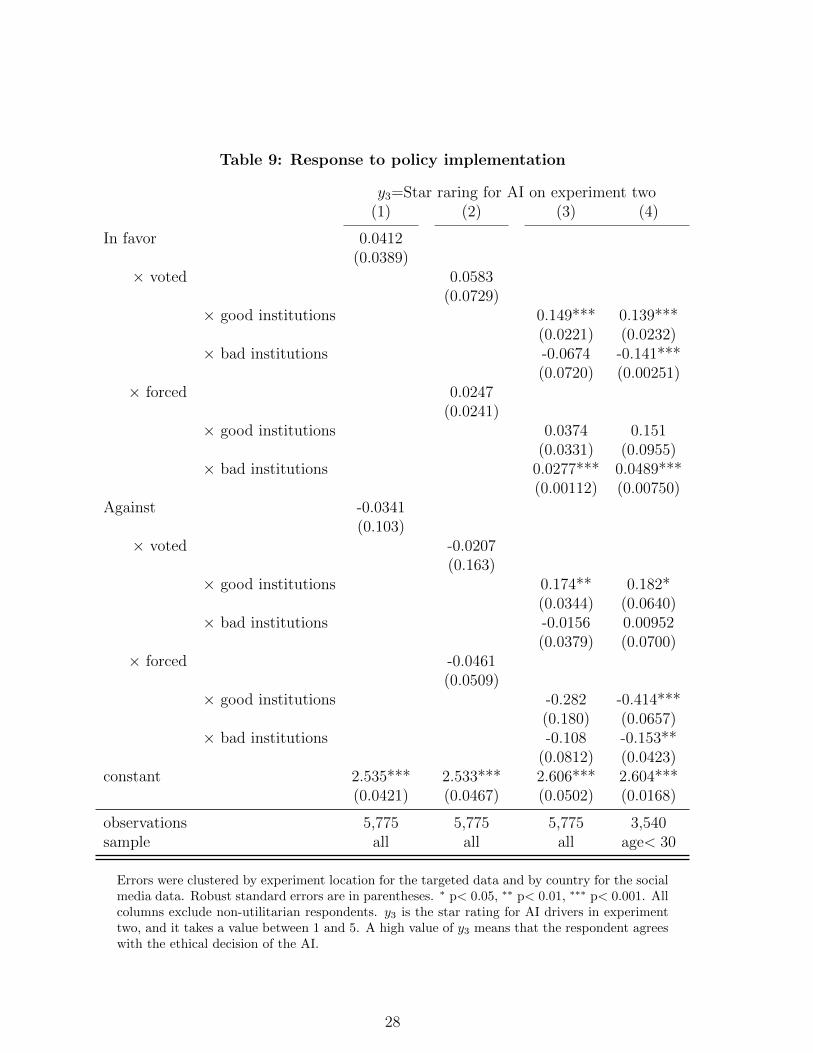
Table 9: Response to policy implementation
y3=Star raring for AI on experiment two(1) (2) (3) (4)
In favor 0.0412(0.0389)
× voted 0.0583(0.0729)
× good institutions 0.149*** 0.139***(0.0221) (0.0232)
× bad institutions -0.0674 -0.141***(0.0720) (0.00251)
× forced 0.0247(0.0241)
× good institutions 0.0374 0.151(0.0331) (0.0955)
× bad institutions 0.0277*** 0.0489***(0.00112) (0.00750)
Against -0.0341(0.103)
× voted -0.0207(0.163)
× good institutions 0.174** 0.182*(0.0344) (0.0640)
× bad institutions -0.0156 0.00952(0.0379) (0.0700)
× forced -0.0461(0.0509)
× good institutions -0.282 -0.414***(0.180) (0.0657)
× bad institutions -0.108 -0.153**(0.0812) (0.0423)
constant 2.535*** 2.533*** 2.606*** 2.604***(0.0421) (0.0467) (0.0502) (0.0168)
observations 5,775 5,775 5,775 3,540sample all all all age< 30
Errors were clustered by experiment location for the targeted data and by country for the socialmedia data. Robust standard errors are in parentheses. ∗ p< 0.05, ∗∗ p< 0.01, ∗∗∗ p< 0.001. Allcolumns exclude non-utilitarian respondents. y3 is the star rating for AI drivers in experimenttwo, and it takes a value between 1 and 5. A high value of y3 means that the respondent agreeswith the ethical decision of the AI.
28

responded that they would reject the introduction of AI by the government. Columns (1) and (2) of
Table 9 show that, in the entire sample, being in favor or against the introduction of AI does not make
any difference when evaluating the decisions of the AI, which still holds after isolating the effects of
having the option to vote or being forced to accept the new technology.
However, columns (3) and (4) of table 9 show that, in countries with good institutions, having the
right to vote gives people more trust of AI. Additionally, in countries with good institutions, people
younger than 30 in the forced implementation group who were initially against the introduction of
AI more harshly evaluated the decisions of the autonomous car than the control group (no explicit
mentioning of the introduction of AI). Finally, in countries with poor institutions, respondents who
were initially in favor of AI and were forced to accept the new technology increased their evaluation of
decisions related to the autonomous car, whereas those who were given the option to vote rated more
harshly the decisions of the autonomous car.
8 Conclusions
We studied how society would react to the introduction of AI ethical decision making. In the first
experiment, we measure the bias against AI using a direct and an indirect method to reveal preferences.
In the second experiment, we test the effect of two different alternative policies to introduce AI into
society.
The results from experiment one show that when asking directly about their opinion on whether
we should allow a certain driver to make an ethical decision, respondents had a negative bias toward
AI. In contrast, when asking indirectly, by requesting respondents to rate the ethical decision making
of a certain driver, there was no such bias. Moreover, because we had three different types of direct
29

questions, we were able to identify the weight that respondents put on their answer when facing the
more general and “open to interpretation” question. Indeed, that social weight is positive and close
to one.
In addition, experiment two explores the effect of two ways to introduce AI into society: a plebiscite
and a forced implementation. In contrast to the control group in which the introduction of AI to
society is not explicitly discussed, we observe that respondents in countries with strong institutions
improve their perception about AI, whereas respondents in countries with poor institutions worsen
their perception about AI. Moreover, this effect is stronger in magnitude within the plebiscite group
than the forced implementation group.
People seem not to reject the idea of ethical decision making by AI. However, when asked their
opinion on this issue, there is an aversion toward AI. Are we ready for AI ethical decision making?
At least in the case of autonomous cars, society does not seem to mind such decision making, at least
conditional on the technology already implemented. However, society also seems to be better off by
not “having that conversation.” Unfortunately, it is a discussion that will happen eventually, if not
with autonomous cars, then with other, more advanced robots.
30

Appendix
A Additional Tables
Table A1: Indirect question, sub-sample analysis by country
y1=Star rating for driver
(1) (2) (3) (4)
AI driver (T1 = 1) 0.109 0.383*** 0.822* 0.274(0.0794) (0.139) (0.432) (0.189)
constant 2.576*** 2.957*** 2.444*** 2.861***(0.137) (0.103) (0.401) (0.0952)
observations 2,820 852 132 168heterogeneity Country F.E. Bangladesh Bolivia Brazil
(5) (6) (7) (8)
AI driver (T1 = 1) -0.513 -0.0833 -0.149 0.151(0.355) (0.275) (0.210) (0.150)
constant 2.898*** 2.972*** 3.162*** 2.705***(0.174) (0.207) (0.116) (0.100)
observations 204 144 456 540heterogeneity China India Indonesia Japan
In all columns, we excluded bad respondents—questions 5, 10, 15, and the M group. Errorswere clustered by respondent. Robust standard errors are in parentheses. ∗ p< 0.05, ∗∗ p< 0.01,∗∗∗ p< 0.001. y1 is the assessment of the driver’s decision and takes values between 1 and 5. Ahigh value of y1 means that the respondent agrees with the ethical decision of the driver.
31

Table A2: Summary of the Experiment
Experiment one
Human Driver AI Driver Mixed(Control) (Treatment) (Treatment)
Introduction X X XVote on referendumOpinion on new lawsIndirect questions (assessmentof ethical decisions)
X X X
Direct question (degree ofagreement with a statement)
X X X
Disclaimer on misinformation
Experiment two
AI Driver Referendum Forced implementation(Control) (Treatment) (Treatment)
Introduction X X XVote on referendum XOpinion on new laws XIndirect questions (assessmentof ethical decisions)
X X X
Disclaimer on misinformation X X
32

B Instructions for the Experiment in Universities
The following text represents the directions that we provided to the person proctoring the experiments:
For the Students:
You will participate in a study on ethical decision making. The
questionnaire will begin with an introduction explaining what the study
consists of and how to answer it. Then you will be asked to answer
15 questions about ethical decisions. The questionnaire requires the
internet and can be answered on computers, smartphones, and tablets.
The original format is in English, but there is a button in the
upper right corner to change the language. We have methods to detect
who answers the questionnaire seriously and who does not. We will
randomly select N students24 who answered the questionnaire seriously,
and these students will earn 20 USD25. If you wish to participate in
the raffle, you must provide your student ID or email or full name for
the last question on the first page of the questionnaire. Thank you
for participating.
For the Instructor:
Please do not mention anything that is not in the students’ instructions.
In particular, do not explain the treatment and control groups. Please
do not allow students to talk to each other.
24N was the rounded-up integer that corresponds to 10% of the registered students in the class.25Or a similar amount in local currency. The payment was in either cash or giftcards.
33

C Social Media Data
We shared via email links leading directly to the questionnaire. In addition, we shared links on social
media with a brief description of the questionnaire (without giving away information on the treatment
and control groups). Moreover, there were three different lengths of questionnaires: 5, 10, or 15
questions. We decided to do so because we were not attracting respondents when there was only the
option to fill out the long (15 questions) questionnaire. The link shared via email was the 15-question
version. In addition to length modifications, an introduction to the questionnaire was reduced, and
the examples were removed because we observed that some respondents started but never completed
the questionnaire.
D Questionnaire
We asked some basic information, such as age, education, country of residency, country of origin,
political view, and religion. However, answering those questions was not mandatory. Then, we provided
an introduction that explains the topic and types of questions. To guarantee that the respondents
understood the tasks, we also included a quiz about the directions and a question “zero” that confirms
whether the respondents would answer the questionnaire correctly. After this, the questionnaire moves
to the 15 actual questions on ethical decision making. They were shown an animated image in which
a car switches lanes to save set B of randomly selected people, thereby saving their lives. However,
this means that the car will necessarily crash into set A of randomly selected people. The animation
shows a loop of the four images displayed in Figure A1.
34

Figure A1: Sequence of images shown in animated questionnaire
(a) (b)
(c) (d)
The animated image displays how a car (a) realizes it has an unexpected ethical dilemma (b),
then it chooses to switch lanes (c), and saves set B of people at the cost of harming set A of
people (d).
35

References
Asimov, Isaac (1942) “Runaround,” Astounding Science Fiction, Vol. 29, pp. 94–103.
Bateman, Ian J, MA Cole, Stavros Georgiou, and DJ Hadley (2006) “Comparing contingent valu-
ation and contingent ranking: A case study considering the benefits of urban river water quality
improvements,” Journal of environmental management, Vol. 79, pp. 221–231.
Beshears, John, James J Choi, David Laibson, and Brigitte C Madrian (2008) “How are preferences
revealed?” Journal of public economics, Vol. 92, pp. 1787–1794.
Bigman, Yochanan E and Kurt Gray (2018) “People are averse to machines making moral decisions,”
Cognition, Vol. 181, pp. 21–34.
Bonnefon, Jean-Francois, Azim Shariff, and Iyad Rahwan (2016) “The social dilemma of autonomous
vehicles,” Science, Vol. 352, pp. 1573–1576.
Bourget, David and David J Chalmers (2014) “What do philosophers believe?” Philosophical studies,
Vol. 170, pp. 465–500.
Boxall, Peter C, Wiktor L Adamowicz, Joffre Swait, Michael Williams, and Jordan Louviere (1996) “A
comparison of stated preference methods for environmental valuation,” Ecological economics, Vol.
18, pp. 243–253.
Gogoll, Jan and Julian F Muller (2017) “Autonomous cars: in favor of a mandatory ethics setting,”
Science and engineering ethics, Vol. 23, pp. 681–700.
Goodall, Noah J (2014) “Machine ethics and automated vehicles,” in Road vehicle automation:
Springer, pp. 93–102.
36

Goodrich, Michael A, Alan C Schultz et al. (2008) “Human–robot interaction: a survey,” Foundations
and Trends R© in Human–Computer Interaction, Vol. 1, pp. 203–275.
Hensher, David A and Mark Bradley (1993) “Using stated response choice data to enrich revealed
preference discrete choice models,” Marketing Letters, Vol. 4, pp. 139–151.
Kahneman, Daniel and Amos Tversky (1979) “Prospect Theory: An Analysis of Decision under Risk,”
Econometrica, Vol. 47, pp. 263–291.
Karasek, Matej (2020) “Good vibrations for flapping-wing flyers,” Science Robotics, Vol. 5.
Lin, Patrick (2016) “Why ethics matters for autonomous cars,” in Autonomous driving: Springer,
Berlin, Heidelberg, pp. 69–85.
Malle, Bertram F (2016) “Integrating robot ethics and machine morality: the study and design of
moral competence in robots,” Ethics and Information Technology, Vol. 18, pp. 243–256.
Malle, Bertram F, Matthias Scheutz, Thomas Arnold, John Voiklis, and Corey Cusimano (2015)
“Sacrifice one for the good of many?: People apply different moral norms to human and robot
agents,” in Proceedings of the tenth annual ACM/IEEE international conference on human-robot
interaction, pp. 117–124, ACM.
McCarthy, John and Patrick J Hayes (1981) “Some philosophical problems from the standpoint of
artificial intelligence,” in Readings in artificial intelligence: Elsevier, pp. 431–450.
McDermott, Drew (2011) “What matters to a machine,” Machine ethics, pp. 88–114.
Miller, Klaus M, Reto Hofstetter, Harley Krohmer, and Z John Zhang (2011) “How should consumers’
37

willingness to pay be measured? An empirical comparison of state-of-the-art approaches,” Journal
of Marketing Research, Vol. 48, pp. 172–184.
Navarrete, C David, Melissa M McDonald, Michael L Mott, and Benjamin Asher (2012) “Virtual
morality: Emotion and action in a simulated three-dimensional “trolley problem”.,” Emotion, Vol.
12, p. 364.
Noothigattu, Ritesh, Snehalkumar S Gaikwad, Edmond Awad, Sohan Dsouza, Iyad Rahwan, Pradeep
Ravikumar, and Ariel D Procaccia (2018) “A voting-based system for ethical decision making,” in
Thirty-Second AAAI Conference on Artificial Intelligence.
Nyholm, Sven and Jilles Smids (2016) “The ethics of accident-algorithms for self-driving cars: an
applied trolley problem?” Ethical theory and moral practice, Vol. 19, pp. 1275–1289.
Riek, Laurel and Don Howard (2014) “A code of ethics for the human-robot interaction profession,”
URL: https://ssrn.com/abstract=2757805.
Scarpa, Riccardo, Eric SK Ruto, Patti Kristjanson, Maren Radeny, Adam G Drucker, and John EO
Rege (2003) “Valuing indigenous cattle breeds in Kenya: an empirical comparison of stated and
revealed preference value estimates,” Ecological Economics, Vol. 45, pp. 409–426.
Veisten, Knut (2007) “Willingness to pay for eco-labelled wood furniture: Choice-based conjoint anal-
ysis versus open-ended contingent valuation,” Journal of forest economics, Vol. 13, pp. 29–48.
Wardman, Mark (1988) “A comparison of revealed preference and stated preference models of travel
behaviour,” Journal of transport economics and policy, Vol. 22, pp. 71–91.
Whitehead, John C, Christopher F Dumas, Jim Herstine, Jeffery Hill, and Bob Buerger (2008) “Valuing
38

beach access and width with revealed and stated preference data,” Marine Resource Economics, Vol.
23, pp. 119–135.
Wiener, Norbert (1964) God and Golem, Inc: A Comment on Certain Points where Cybernetics
Impinges on Religion, Vol. 42: MIT press.
Zaller, John and Stanley Feldman (1992) “A simple theory of the survey response: Answering questions
versus revealing preferences,” American journal of political science, Vol. 36, pp. 579–616.
39