is tax shifting asymmetric? evidence from french vat
TRANSCRIPT
HAL Id: halshs-00590719https://halshs.archives-ouvertes.fr/halshs-00590719
Preprint submitted on 4 May 2011
HAL is a multi-disciplinary open accessarchive for the deposit and dissemination of sci-entific research documents, whether they are pub-lished or not. The documents may come fromteaching and research institutions in France orabroad, or from public or private research centers.
L’archive ouverte pluridisciplinaire HAL, estdestinée au dépôt et à la diffusion de documentsscientifiques de niveau recherche, publiés ou non,émanant des établissements d’enseignement et derecherche français ou étrangers, des laboratoirespublics ou privés.
Is Tax Shifting Asymmetric? Evidence from French VATreforms, 1995-2000
Clément Carbonnier
To cite this version:Clément Carbonnier. Is Tax Shifting Asymmetric? Evidence from French VAT reforms, 1995-2000.2005. �halshs-00590719�
PARIS-JOURDAN SCIENCES ECONOMIQUES48, BD JOURDAN – E.N.S. – 75014 PARIS
TEL. : 33(0) 1 43 13 63 00 – FAX : 33 (0) 1 43 13 63 10www.pse.ens.fr
WORKING PAPER N° 2005 - 34
Is tax shifting asymmetric ?
Evidence from French VAT reforms, 1995-2000
Clément Carbonnier
JEL Codes : D40, H22, H31, H32
Keywords : Commodity taxation, tax incidence, economicagents behaviour, oligopoly.
CENTRE NATIONAL DE LA RECHERCHE SCIENTIFIQUE – ÉCOLE DES HAUTES ÉTUDES EN SCIENCES SOCIALESÉCOLE NATIONALE DES PONTS ET CHAUSSÉES – ÉCOLE NORMALE SUPÉRIEURE

Is Tax Shifting Asymmetric ?
Evidence from French VAT reforms, 1995-2000
Clement Carbonnier†
Paris-jourdan Sciences Economiques (PSE), CNRS-EHESS-ENPC-ENS
Abstract
This paper presents evidence from three French VAT reforms showing that tax shifting on
prices operates differently upwards and downwards. This paper puts forward two different
asymmetric effects. The first one is linked to asymmetries in firms’ supply curves, which
implies that price decreases are smaller than price increases. The second asymmetric effect
is linked to asymmetries in customers’ demand curves, which react more to big price changes
than to tenuous ones. This implies that price decreases are bigger than price increases. This
paper shows that this second effect can counteract the first effect in markets with high fixed
costs.
†Address : PSE, campus Jourdan, bureau B 107, 48 Bd Jourdan 75018 Paris, France.
Tel : (+33) 01.43.13.62.61
E-mail : [email protected]
Key Words : Commodity Taxation ; Tax Incidence ; Economic Agents Behaviour ; Oligopoly.
JEL classification : D40, H22, H31, H32.
1 Introduction
This paper studies the economic impact of commodity tax reforms, and attempts to compare
tax shifting on prices upwards and downwards. Commodity taxation is heavily used all
around the world, through different kinds of taxes, as VAT in Europe or local commodity
taxes in the United States. Commodity tax rates in the United States are often fluctuating
and, for more than a decade, the European Union has attempted to make VAT rates converge
throughout their members. These frequent changes of commodity taxation legislation offer
the opportunity to study the incidence of this kind of taxes through natural experiments.
The novelty of this paper is to present evidence from three French VAT reforms showing
that tax shifting on prices operates differently upwards and downwards, and to suggest the-
oretical mechanisms that can explain these facts.
A number of papers have already studied commodity tax incidence on prices, but they
usually consider tax shifting on prices as a symmetric event. The basic definition is that
taxes are fully-shifted on prices if before tax prices do not vary after fluctuations of the
commodity tax rate (the tax shifting parameter is then said to be equal to 100%). Following
the same pattern, taxes are over-shifted on prices if before tax prices increase (the tax shifting
parameter is then bigger than 100%) and they are under-shifted on prices if before tax prices
decrease (the tax shifting parameter is then smaller than 100%). Under perfect competition
hypothesis, taxes can not be over-shifted, and the tax shifting parameter is always less or
equal to 100%. Whether it is close to 100% or to 0% depends on the relative elasticity of the
demand and supply curves.
Tax shifting under different imperfect competition hypothesis has also been studied. Katz
& Rosen (1985) consider closed Cournot oligopoly. Stern (1987) and Besley (1989) examine
free entrance oligopoly, based on conjectural variation model developped by Seade (1980).
Cremer & Thisse (1994) study a differentiated oligopoly. One of the main result of all these
studies is that in imperfect competition markets, taxes may be over-shifted. However, these
papers also show that the impact of imperfect competition depends on specific parameters of
the markets and can go either way. Furthermore, this litterature does not consider differences
between commodity tax rate increases and decreases.
For instance, Besley & Rosen (1999) empirically test tax shifting in the United States
through cross city and panel regressions. This paper firstly finds that tax shifting on prices
is very fast. Moreover, it finds that some taxes on goods sold through the retail industry are
over-shifted. This confirms the theoretical results on oligopoly markets. Indeed, the retail
industry is commonly considered as an oligopoly. However, this study is based on many
variations of the different local commodity tax rates, both upwards and downwards, and
therefore measures a mean effect of upwards and downwards tax shifting.
1
The present paper develops the hypothesis that tax shifting operates differently upwards
and downwards. There are two asymmetric effects. The causes are the asymmetric properties
of firms supply curves on the one hand, and of consumers demand curves on the other hand.
First of all, the asymmetric properties of supply curves can be due to asymmetries in the
production process of firms. Indeed, it is easier for firms to decrease their production than
to increase it, at least in the short and medium run. Increasing output often requires hiring
new workers and undertaking new investments, wich can induce long delays. This implies
smaller price decreases than price increases. That is, following a decrease of the VAT rate, an
increase of the supply is needed to observe a decrease of prices. Therefore, the existence of
constraints on supply increases leads to small price decreases. This can explain why studying
French VAT reforms on perfect competition markets we find tax shifting parameters close to
100% following VAT increases (an average of 91%) and tax shifting well below 100% following
VAT decreases (an average of 22%)1.
The first effect is general and should apply to all industries, but it may be compensated by
a second asymmetric effect in case of collusion. The second asymmetric effect is linked to the
shape of the customers’ demand curves, which may react with higher intensity to big price
changes than to tenuous ones. This might be due to psychological effects or to the shadow
price of changing one’s consumption habits. Therefore, in markets with monopolistical firms
or with collusion - markets that better consider the variations of the demand because of the
price making power of firms - price increases are relatively weak in order to prevent the fall
of the demand, and price decreases are relatively strong in order to take profit of the takeoff
of the demand. This can explain why studying French VAT reforms on oligopoly markets we
find tax shifting parameters well below 100% following VAT increases (an average of 52%)
and over-shifting of the tax following VAT decreases (an average of 130%).
These asymmetric effects take a great importance in the political debate because they
put forward the existence of a bias toward high VAT rate. If politicians have a short term
bias and make their reforms with the aim of obtaining viewable short run results, the deci-
sion of decreasing the VAT rate will rarely be taken. Indeed, amongs the goods subject to
the full-rate - which do not take the main part of custommers’ budgets - only the capital
intensive goods would reflect commodity tax decreases in the short run. Such bias may occur
specially when governments choose a temporarily increase of commodity taxes in order to
face transitory budget problems. The temporary reforms might be changed in permanent
ones. This is what happens in France for the reforms studied in this paper.
The rest of the paper is organised as follows.
1These tax shifting parameters are calculated over a 4-month window.It’is very difficult - if not impossible
- to properly identify tax shifting on prices beyond a 4 to 6 month window.
2

In section 2, I present the tax reforms and data sources that are used for this empirical
study. The effects explained above are tested with price data using three French fiscal reforms.
These reforms occured on August 10th 1995, on September 1st 1999 and on April 1st 2000.
The choices in terms of data sets are explained by the aim of comparing labour-intensive
services and capital-intensive products, the second kind of goods representing the oligopoly
markets.
In section 3, I present the regressions that allow to estimate tax shifting parametersup-
wards and downwards. I use therefore difference in difference regressions on the prices of
the selected goods around both the August 10th 1995 and the April 1st 2000 VAT full-rate
reforms. Two asymmetric effects appear. The first one appears concerning labor intensive
services, with tax shifting upwards superior to tax shifting downwards. The second one ap-
pears concerning capital intensive products, with tax shifting upwards inferior to tax shifting
downwards.
In section 4, I attempt to explain the asymmetric effect occuring for labor intensive
services, which I called “supply effect”. Therefore, I propose theoretical arguments for an
asymmetry in firms’ supply curves, which explain why it is more difficult to increase the
output than to decrease it, which may lead to lower price variations downwards than upwards.
In section 5, I attempt to explain the asymmetric effect occuring for capital intensive
products, which I called “demand effect”. First of all, I confirm this asymmetric effect
runing comparison regressions. Then I propose theoreticalarguments for asymmetries and non
linearities in customers’ demand curves, which supposes that demand reacts more strongly
to considerable price variations than to tenuous ones. Hence, when some collusion exists on
markets, and particularly in the monopoly cases, production plans take into account these
customers’ demand curves properties, which may lead to higher price variations downwards
than upwards.
In section 6, I try to confront the hypothesis on the causes of the “supply effect” to bigger
VAT rate changes. In that point, I studied the 1999 European experience on VAT on several
services. I focus on repair services in more than two year old habitation, whose VAT rate
went down from 20,6% to 5,5 % on Septembre 1st 1999.
In section 7, I present the conclusions. There is also discussed the consequences of these
results in terms of political decisions, and I try to understand the share out of the VAT costs
for firms between labor and capital.
2 Tax reforms and data sources
The point of this study is to examine empirically tax shifting on prices after VAT rate changes.
In particular, the objective is to compare tax shifting upwards and downwards, in order to
understand the asymmetrical properties of tax shifting. Therefore, I analyse the consequences
3

of three different reforms that occured in France recently. In France, there exists severals
VAT rates. The main ones are the full rate - which applies to most consumption goods except
food and cultural goods - and the reduced rate - which applies to the food and cultural goods.
Moreover, there exist special rates, such as zero rate - for financial services, housing rents and
real estate - and a super reduced rate - for newspapers. The reduced rate is 5.5%, the super
reduced rate is 2.1%. Two reforms out of the three I study changed the VAT full-rate. This
rate was increased from 18,6% to 20,6% on August 10th 1995, then it was decreased from
20,6 % to 19,6% on April 1st 2000, and has not been changed since then. The other reform
occured on September 1st 1999, and was part of the European experiment on low-qualified
labor-intensive services. European Union allowed states to apply their VAT reduced rate to
several labor intensive services. For that reason, in France, the VAT rate of repair services
in more than two year old housing went down from 20.6% to 5.5% in September 1st 1999.
The main data source used for this study are price series built by INSEE. I can use
monthly series concerning 296 different kinds of goods. Each represents the global prices
of a set of consumption goods. From these 296 index series, I have selected those which
are meaningful from the point of view of this paper. The first condition for an index to be
selected is that the VAT rate for each good in the index is the same and that this rate is
the full-rate, except for the control index and the home repair services index. Regarding the
control index, I choose a set of goods that has not been affected by any of the VAT reforms,
actually I choose books. Indeed book VAT rate has been the reduced rate since 1989, and
therefore has always been 5.5% since this time. I also run the regressions using drugs as
control goods, which gives globally the same results. Food goods might be used because they
are taxed at the reduced rate, but their prices are too much affected by the whether and the
seasons.
The second condition is for the set to be quite homogenous with respect to the compe-
tition structure. This study tries to compare tax shifting that occured in markets whose
properties are close to perfect competition or to oligopoly with some collusion. The point is
to understand the competition effects on tax shifting. In that purpose, I study price series
for manufactured products on the one hand, and for labor intensive services on the other
hand. The main idea is to compare labor intensive and capital intensive goods. Indeed, the
manufactured productions, which need fixed capital, have high fixed costs and few competi-
tors, and therefore may be better represented by an oligopoly model. I assume that labor,
and particularly low qualification labor is more flexible, and therefore labor intensive services
may be represented by a perfect competition model.
Indeed, a production sector is called capital intensive if high investments are needed before
producing. These investments, which may be considered as fixed costs, generate increasing
returns to scales, and then constitute a kind of entry barrier. Then, even with free entrance
and competition, the existence of high investments required, coupled with potential strategic
4
acting of insiders, makes the competition imperfect and leads to oligopoly (e.g. Dixit (1980
& 1986), Baumol Panzar & Willig (1982), Spence (1983)).
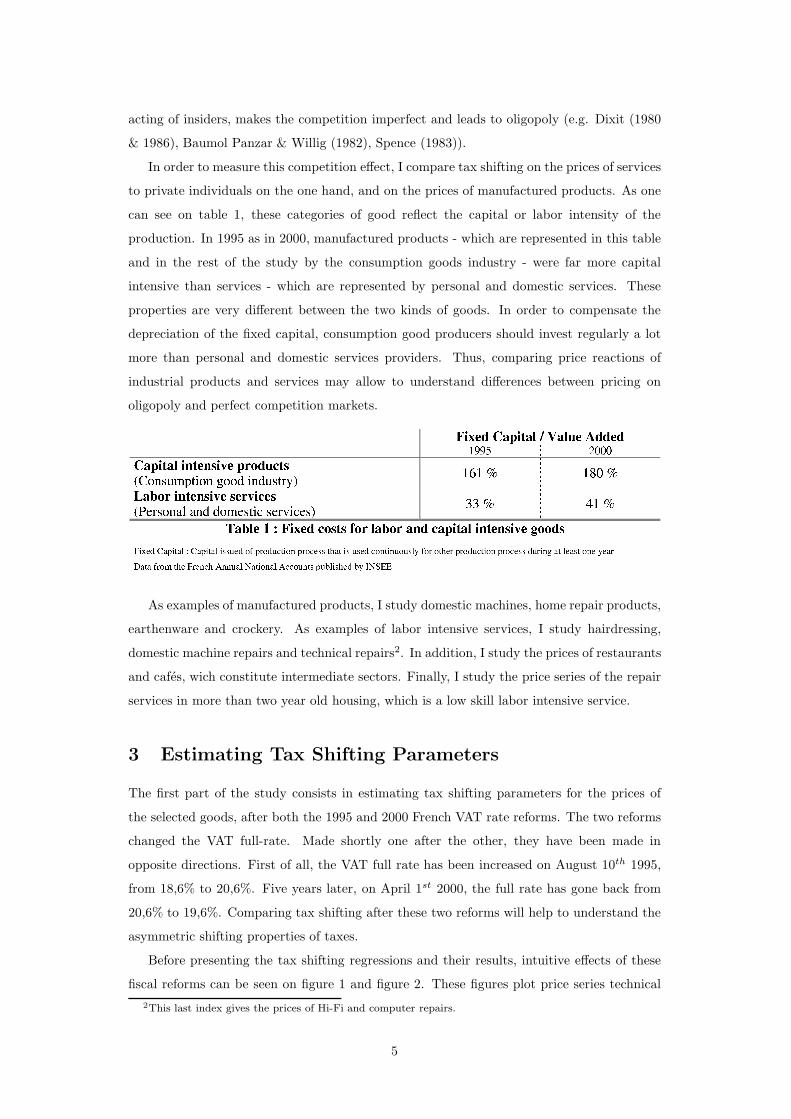
In order to measure this competition effect, I compare tax shifting on the prices of services
to private individuals on the one hand, and on the prices of manufactured products. As one
can see on table 1, these categories of good reflect the capital or labor intensity of the
production. In 1995 as in 2000, manufactured products - which are represented in this table
and in the rest of the study by the consumption goods industry - were far more capital
intensive than services - which are represented by personal and domestic services. These
properties are very different between the two kinds of goods. In order to compensate the
depreciation of the fixed capital, consumption good producers should invest regularly a lot
more than personal and domestic services providers. Thus, comparing price reactions of
industrial products and services may allow to understand differences between pricing on
oligopoly and perfect competition markets.
As examples of manufactured products, I study domestic machines, home repair products,
earthenware and crockery. As examples of labor intensive services, I study hairdressing,
domestic machine repairs and technical repairs2. In addition, I study the prices of restaurants
and cafes, wich constitute intermediate sectors. Finally, I study the price series of the repair
services in more than two year old housing, which is a low skill labor intensive service.
3 Estimating Tax Shifting Parameters
The first part of the study consists in estimating tax shifting parameters for the prices of
the selected goods, after both the 1995 and 2000 French VAT rate reforms. The two reforms
changed the VAT full-rate. Made shortly one after the other, they have been made in
opposite directions. First of all, the VAT full rate has been increased on August 10th 1995,
from 18,6% to 20,6%. Five years later, on April 1st 2000, the full rate has gone back from
20,6% to 19,6%. Comparing tax shifting after these two reforms will help to understand the
asymmetric shifting properties of taxes.
Before presenting the tax shifting regressions and their results, intuitive effects of these
fiscal reforms can be seen on figure 1 and figure 2. These figures plot price series technical
2This last index gives the prices of Hi-Fi and computer repairs.
5

Figure 1: Prices around the 1995 French VAT reform
The prices are corrected from an inflation trend estimated as the mean of the book inflation during the 16
month considered.
repairs - that are part of the personal and domestic services - and domestic machines - that
are products from the consumption good industry.
The prices of the two goods have a fast price increase shortly after August 10th 1995 on
figure 1. This may answer a first question that is : do prices reflect small VAT changes ? The
inflexions of the price series suggest a positive answer. A decrease shortly after September
1st appears also on figure 2, but it is less clear. Morover, it seems that technical repairs price
variation is bigger than domestic machines price variation on figure 1, and that it is smaller
on figure 2.
The point of this paper is to compare upwards and downwards tax shifting on prices. From
that point of view, comparing figure 1 and figure 2 leads to the conclusion that the 1995 shifts
on prices had been higher than those of 2000. However, this impression might be an illusion
linked to the fact that the 2000 VAT full rate decrease was only of 1%, although the 1995
VAT full rate increase was of 2%. Hence, the point of this section is to determine through
regressions whether these visual differences between price shifting upwards and downwards
are valid.
At last, another property appears clearly out of the comparison of figures 1 and figure 2
: although the tax shifting upwards has been very fast in 1995, it seems to have been slower
downwards in 2000.
6

Figure 2: Prices around the 2000 French VAT reform
The prices are corrected from an inflation trend estimated as the mean of the book inflation during the 16
month considered.
In order to estimate precisely tax shifting parameters, I implement regressions of the
relative price variations on the relative tax variations. More precisly, tax shifting parameter
is given by the following equation, where τ is the tax rate, p the after tax price and t the
time.
x =1 + τt
pt
pt+1 − pt
τt+1 − τt
(1)
This parameter is the ratio between the effective after-tax prices following the reform and
the after-tax prices if the pre-tax prices do not change following the reform. Thus, the tax is
fully shifted - then x = 100% - if the pre-tax prices do not change following the reform (i.e.
: pt+1
1+τt+1= pt
τt), and x = 0% if the after-tax prices do not change following the reform (i.e. :
pt+1 = pt).
Two different operators are used for these regressions. First of all, the operator of price
increase : ∆p,t = pt+1−pt
pt, and secondly the operator of VAT rate increase : ∆τ,t = τt+1−τt
1+τt.
In this section, the regressions are ran with monthly data.
A classical issue consists in trying not to be deluded by natural economic variations. In
order to avoid this problem, two different strategies are used in parallel. First of all, the
regressions are difference in difference ones with respect to the prices of goods which had not
been affected by the fiscal reform : in practice, the present results use book prices. Secondly,
these regressions are controlled with variables providing information about the production
7

costs : in practice, energy prices and rents are used. The regressions follows equation 2 :
∆p,t = α +
3∑
i=0
βi∆τ,t−i + γ∆pbooks,t + δ∆pcosts,t + ǫt (2)
The tax shifting parameter is defined as x =∑3
i=0 βi. Indeed, the regressions are made
with a monthly time scale, adding delays on the regressors of the VAT rate increase. The
point of doing so is to understand tax shifting dynamics. This is then a tax shifting parameter
estimated over a four months window. I also runs regressions with more delays on the VAT
rate, the additionnal estimations were always close to 0 and not significant. This suggest that
it is very difficulted - if not impossible - to identify tax shifting on prices beyond a 4-to-6
month window.
In addition to the main control variables, the regressions of cafes consumptions and restau-
rants are also controlled with before tax prices of alcoholic drinks3. Indeed, these intermediate
products take an important part in the formation of the prices of the cafes consumptions.
In addition, these drinks are submitted to the VAT full-rate. Hence, if the tax shifting pa-
rameter for alcoholic drink prices is inferior to 100%, before tax prices of alcoholic drinks
decreases when the VAT tax rate increases. Therefore, not taking this fact in account might
lead to under-estimate the tax shifting parameter of cafes consumptions.
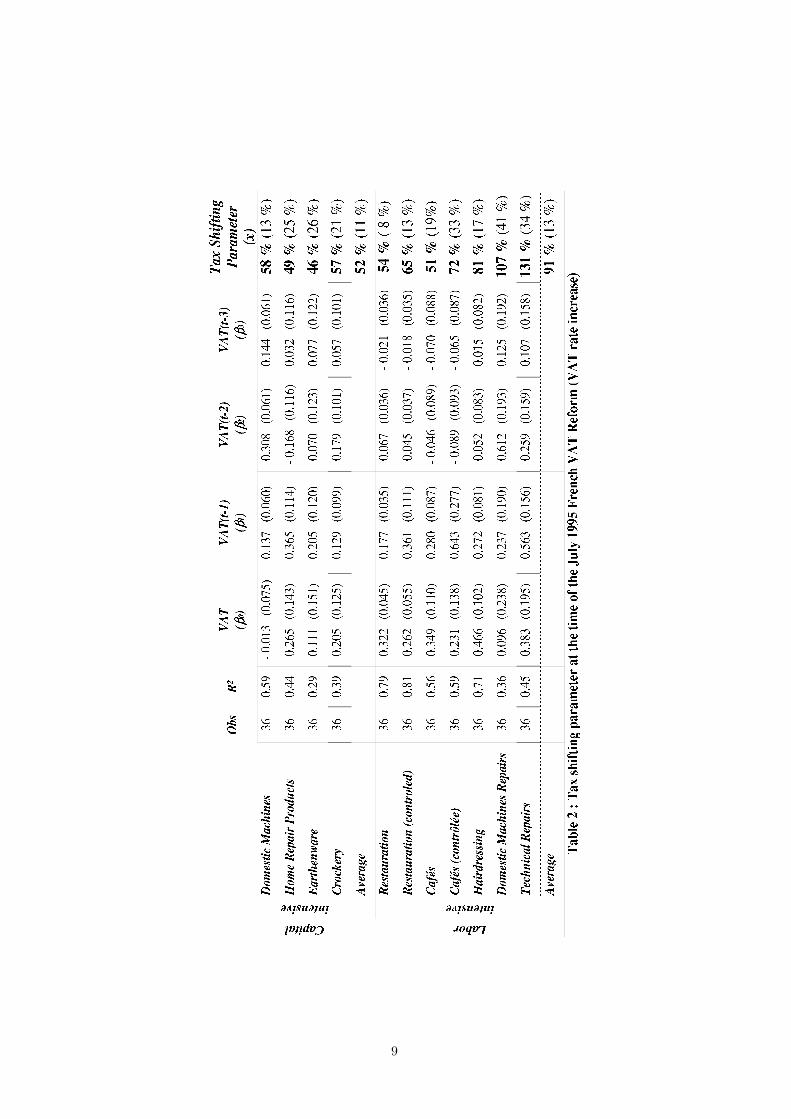
I run two series of regressions with the data described in section 2, one concerning each
reform. The results for the 1995 reform are presented in table 2 and the results for the 2000
reform are presented in table 3.
The first important property which has to be noticed deals with the R2 of these regres-
sions. They are quite often high, and particularly for the 1995 reform. This means that,
during all of the three years that are considered for these regressions, the few controls used
and the VAT tax rate variation are enough to explain the main part of price variations.
It is also important to notice the usefulness of the additional controls introduced in
the price regressions of the consumptions at cafes and restaurants. As explained in the
presentation of these additional controls, commodity taxes on alcoholic drink prices are far
lower than full-shifted - actually, tax shifting parameter for the alcoholic drink prices is found
equal to 68% - and therefore the tax shifting parameter without controlling by the alcoholic
drink prices is under-estimated. Indeed, the tax shifting parameter for the restauration prices
increases from 54% to 65% - and R2 also increases, from 79% to 81% - when controling and the
tax shifting parameter for prices of consumptions at cafes increases from 51% to 72% - and R2
also increases, from 56% to 59% - when controlling. One can note that the under-estimation
is bigger for the consumptions at cafes than for those at restaurants, which is obviously
implied by the far bigger part of alcoholic drinks in their intermediate consumptions.
3Indeed, the before tax prices is the one that has to be used in these regressions because VAT had been
built with the point to tax value-added only once. Hence, firms can deduce the VAT they paid on their
intermediate consumption purchases from the VAT they have to pay on their sales. This means that firms
do not pay VAT on their intermediate consumptions.
8
9

10

The two important results that come out of these regressions consist in the two different
asymmetric effects occuring for the two kinds of goods studied. For each labor intensive
service, the tax shifting parameter is higher upwards than downwards. Indeed, table 2 and
table 3 show that tax shifting averages for these goods are 91% upwards and 22% downwards.
This is the “supply asymmetric effect”. We propose an explaination of this effect in section
4. For each capital intensive product, the tax shifting parameter is lower upwards than
downwards. Indeed, table 2 and table 3 show that tax shifting averages for these goods are
52% upwards and 130% downwards. This the “demand effect”. We propose an explaination
of this effect in section 5.
In order to compare with Besley & Rosen (1999) empirical results, it should be noticed
that they regress the before tax price logarithm variation on the tax rate variation. Hence,
the relation between their tax shifting indicator βBR and our tax shifting parameter x is :
x = 1+(1+τ)βBR. They find indicators βBR between −0.282 and 1.42, with only the higher
ones - that are for goods sold by the retail industry - significantly different from 0, which is
the full shifting. It corresponds to tax shifting parameter x between 70% and 250%. It means
that they find tax shifting a bit higher than in the present study. However, their regressions
are partly cross-section, and the local commodity tax rate on a good consumption may be
linked to different properties of the local demand elasticity for this good. A low demand
elasticity with respect to the prices of a kind of goods may induce together high prices and
high commodity tax rates - according to the Laffer curve. This mechanism may lead to over
estimation.
Nevertheless, their results are consistent with ours. They also find that price shifting
occurs very quickly. According to their results, only between 0.29 and 1.27 quarters are
necessary for the taxes to shift totally on prices. This is consistent with our four month
window.
The main difference between their paper and our paper lies in the analysis of the asym-
metric properties. They do not regress separately tax rate increases and tax rate decreases.
Consequently, because prices do not react the same way upwards and downwards, their re-
sults depend on the number of commodity tax rate increases and decreases in their time
series.
4 Explaining the supply asymmetric effect
In this section, I concentrate on taxe shifting on labor intensive markets. Two main differences
between the 1995 and 2000 tax shifting on labor intensive service prices appear in table 2
and table 3. On one hand, there is a difference between the shifting dynamics, and on the
other hand, there is a great difference in the values of the tax shifting themselves. Table 4
recalls the values of tax shifting for the labor intensive services.
11
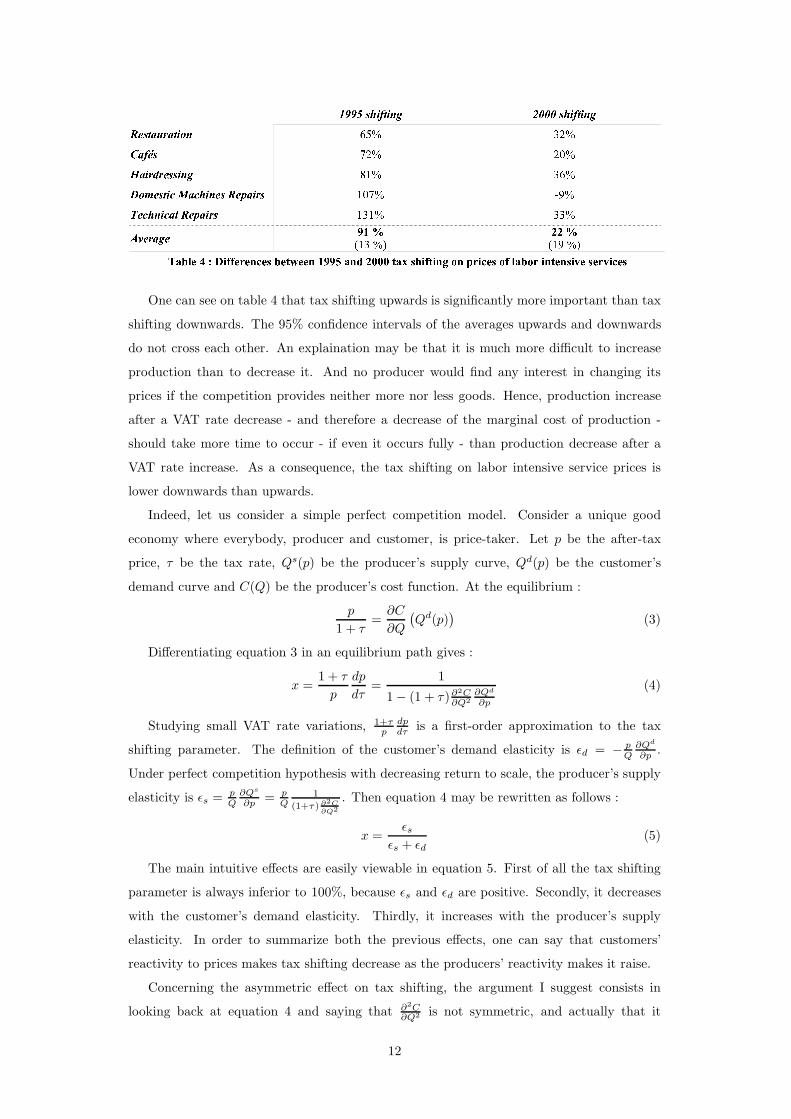
One can see on table 4 that tax shifting upwards is significantly more important than tax
shifting downwards. The 95% confidence intervals of the averages upwards and downwards
do not cross each other. An explaination may be that it is much more difficult to increase
production than to decrease it. And no producer would find any interest in changing its
prices if the competition provides neither more nor less goods. Hence, production increase
after a VAT rate decrease - and therefore a decrease of the marginal cost of production -
should take more time to occur - if even it occurs fully - than production decrease after a
VAT rate increase. As a consequence, the tax shifting on labor intensive service prices is
lower downwards than upwards.
Indeed, let us consider a simple perfect competition model. Consider a unique good
economy where everybody, producer and customer, is price-taker. Let p be the after-tax
price, τ be the tax rate, Qs(p) be the producer’s supply curve, Qd(p) be the customer’s
demand curve and C(Q) be the producer’s cost function. At the equilibrium :
p
1 + τ=
∂C
∂Q
(
Qd(p))
(3)
Differentiating equation 3 in an equilibrium path gives :
x =1 + τ
p
dp
dτ=
1
1 − (1 + τ)∂2C∂Q2
∂Qd
∂p
(4)
Studying small VAT rate variations, 1+τp
dp
dτis a first-order approximation to the tax
shifting parameter. The definition of the customer’s demand elasticity is ǫd = − p
Q
∂Qd
∂p.
Under perfect competition hypothesis with decreasing return to scale, the producer’s supply
elasticity is ǫs = p
Q
∂Qs
∂p= p
Q1
(1+τ) ∂2C
∂Q2
. Then equation 4 may be rewritten as follows :
x =ǫs
ǫs + ǫd
(5)
The main intuitive effects are easily viewable in equation 5. First of all the tax shifting
parameter is always inferior to 100%, because ǫs and ǫd are positive. Secondly, it decreases
with the customer’s demand elasticity. Thirdly, it increases with the producer’s supply
elasticity. In order to summarize both the previous effects, one can say that customers’
reactivity to prices makes tax shifting decrease as the producers’ reactivity makes it raise.
Concerning the asymmetric effect on tax shifting, the argument I suggest consists in
looking back at equation 4 and saying that ∂2C∂Q2 is not symmetric, and actually that it
12

is bigger when ∆Q < 0 than when ∆Q > 0. There are mainly two possible causes for
this property. First of all one can consider that ∂2C∂Q2 is composed of two parts, because of
the existence of a transitory state and a stationary state. The first part is the stationary
variation of the marginal cost of production because of the variations of the output and the
non constant returns of scales. This part is symmetric - the value of the first part when
dQ > 0 (∆1 > 0) is the opposite of the one when dQ < 0 (−∆1 < 0). The second part is
the transitory variation of the marginal cost due to restructuration needs, which is always
positive (∆2 > 0). Hence, the absolute value of the marginal cost variation (∣
∣
∣
∂2C∂Q2
∣
∣
∣) is bigger
when dQ > 0 than when dQ < 0 (|∆1 + ∆2| > |∆1 − ∆2|). Because there are less output
sales when the prices are higher, marginal cost’s variations are smaller when prices increase
than when they decrease, and therefore taxes shift more fully on prices when the VAT rate
increases than when it decreases.
Another propertiy reinforces this effect ; increasing the output needs to be financed al-
though decreasing it does not. Thus, because of credit constraints, it is more difficult to
restructurate a firm to produce more than to produce less, more especially as it concerns
small firms.
The arguments are complementary, the idea is basically the same. Because it is more
difficult to increase than to decrease one’s production, supply elasticity is bigger upwards
than downwards, which is the cause of a general asymmetric effect that makes the taxes shift
more fully upwards than downwards.
According to this arguments, differences in shifting dynamics between upwards and down-
wards shifting should be observed. This property seems to appear on table 2 and table 3.
Indeed, whereas the coefficients of the first two delays in the 1995 regressions are high and
significative, the coefficients of the last two delays of these same regressions are low. In 2000,
prices react in the opposite way and the 2000 tax shifting on prices is slower. Indeed, first
month shifting parameters are globally small, as the last month shifting parameters are still
considerable.
In order to test more precisely this hypothesis, I compare tax shifting during the first
13

two months after the reform with tax shifting during the two following months. That is, I
estimate β0 + β1 − (β2 + β3), which gives the difference between shifting during the first two
months and during the two following months. In order to understand the significance level of
these differences, I also calculate the standart errors of these values. The results are reported
in Table 5.
One can see on table 5 that the values of β0 +β1− (β2 +β3) are positive in 1995 at a high
significant level. On the oppposite, the values of these indices are smaller and non significant
in 2000. This means that tax shifting is really faster upwards in 1995 than downwards in
2000. This confirms the hypothesis of faster shifting upwards than downwards.
5 Explaining the demand asymmetric effet
An other asymmetric effect appears in section 3, concerning the capital intensive products.
For these goods, the change between 1995 and 2000 tax shifting parameters occurs in the
opposite direction. Table 6 recalls the values of tax shifting for the capital intensive goods.
There, capital intensive product prices behaves clearly in a different way from the labor
intensive service prices, studied in the previous section. The tax shifting parameters for
these manufactured product prices are higher downwards in 2000 than upwards in 1995.
Indeed, the tax shifting parameters for the capital intensive product prices are inferior
to 60% at the time of the 1995 reform, whereas the tax shifting parameters for the labor
intensive service prices is more important : 81% for hairdressing, 107% for domestic machine
repairs and 131% for technical repairs. In 2000, there is a complete U-turn of the order of
the tax shifting between manufactured products and services. Tax shifting is much more
important on manufactured product prices than on service prices. Obviously, while the 2000
tax shifting parameters for the labor intensive service prices are inferior to 36%, the tax
shifting parameters for capital intensive product prices are superior to 100%.
Though, looking at table 6, one can see that as it appears when looking at figure 2
- showing the prices around 2000 - the standard errors are quite all very high. Indeed,
the 95% confident intervals of the tax shifting averages upwards and downwards cross (the
85% confident intervals do not cross). Thus, before proposing an explanation of this demand
asymmetric effect, it is important to confirm the significance level of this asymmetry property.
14

To do so, I run other regressions, as defined by equation 6. This equation allows to compare
the tax shifting parameters for the prices of two goods A and B, at the same period.
∆pA,t − ∆pB ,t = α + β∆τ,t + γ∆pbooks,t + δ∆pcosts,t + ǫt (6)
It is the same kind of regression equation as equation 2. The first difference is that there
is no delay on coefficient ∆τ,t, because the time scale of the data used for these regressions
is three point a year. Hence, the four month time of the complete tax shifting lies between
the period where the reform occurs and the following period. This time scale is used in this
section because the tax shifting dynamics are not studied here.
There exists another main difference between equation 2 and equation 6. In this section,
instead of regressing price increases on VAT rate increases, I regress differences between two
price increases on VAT rate increases. Therefore, the significativity of coefficient β would
imply that VAT rate’s variation impacts significantly differently on the two kinds of goods.
Moreover, β > 0 (β < 0) implies that tax shifting parameter for the prices of goods A (B) is
higher than the one on the prices of goods B (A).
These regressions are ran for several couples of goods - each time comparing one set of
manufactured products and one set of labor intensive services - independently for both VAT
full-rate reform. The results of the regressions around 1995 period are presented in table 7,
and the ones around the 2000 reform are presented in table 8.
After the 1995 French fiscal reform, the tax shifting parameters for the prices of labor
intensive services are greater than the ones on the prices of capital intensive products. The
significativity of these results is 20% for all the pairs of goods but hairdressing and domestic
machine repairs versus crockery. Moreover, seven differences between tax shifting are 10%
significant and five are 5% significant : domestic machines repairs versus domestic machine
and technical repairs versus the four manufactured products that are studied.
After the 2000 French fiscal reform, differences between tax shifting are less significant,
but the tax shifting parameters for the prices of capital intensive products are greater than
the ones on the prices of labor intensive services. Seven regressions have 20% significant
coefficients, three have 10% significant coefficients and two have 5% significant coefficients.
The 5% significant two are home repair products versus hairdressing and domestic machine
repairs.
These results confirm that the tax shifting on the prices of labor intensive services had
been higher than those on the prices of capital intensive products in 1995, and lower than
them in 2000. Hence, it can be concluded that the “supply” asymmetric effect presented in
the previous section is balanced by another one for manufactured products.
I suggest an explanation to this asymmetry linked to asymmetries in the shape of the
custommers’ demand curves, which are revealed by the price-maker power of firms. The
15

16

17

price-maker power allows the firm to respond in a better way - from a strategic point of view
- to the demand’s fluctuations, which puts forward the asymmetric properties which may
exist in the shape of the custommers’ demand curves. As was noted in section 2, on the basis
of table 1, the capital intensive industries I study may be considered as price making because
of the high fixed costs.
Indeed, if considering the demand problem as tenuous variations around an equilibrium
point, figure 3 shows three different kinds of demand curves in a graph where the variation
proportion of the demand - that is dDD
- is function of the variation proportion of the price -
that is dp
p. As the demand elasticity with respect to the prices is ǫ = − p
DdDdp
, this is the graph
of the demand elasticity in a space where relative variations of prices are at X-coordinate
and relative variations of demand are at Y-coordinate.
Figure 3: Demand function curves
The simplest and most common way to represent demand variations is through isoelas-
ticity properties, which corresponds to a straight line on figure 3.
18

However, this does not take psychological and reference point effects into account. These
effects may induce that the demand reaction is proportionally bigger when the price variation
is higher. Such increasing elasticity properties are known concerning petroleum products
(e.g. Walker & Wirl (1993)), and may also be true for other consumption goods. Benabou &
Gertner (1993) explain that demand elasticity with respect to the prices is locally increasing
through search for prices arguments. Indeed, the willingness to search for better prices
is stronger when the price increases is higher. Therefore, the consumption decreases are
proportionnally more important when the price increases are bigger. Such kinds of demand
reactions are represented by graphs such as the asymmetric elasticity curve on figure 3.
Economic theorists traditionally use models with increasing elasticities - with constant
elasticity as a limit - because on one hand it takes into account the psychological effects for
the price increases and on the other hand it is mathematically very regular4. However, they
might not be the most relevant elasticity profiles. Increasing elasticity profiles assume that
demand reactions are stronger when price increases are more important, and that demand
reactions are stronger when price decreases are less important. That would mean that the
consumption increases are proportionnally smaller when the price decreases are bigger. That
could be explained by saturating effects, but these saturating effects are not considered here
because the different price variations studied are all small.
Then, I use in the following demand curves that react as increasing elasticity models
when prices increase, and whose reaction increases with the price variations when prices are
reduced. In order to summarize, it can be said that| dD
D || dp
p |is increasing with respect to
∣
∣
∣
dpp
∣
∣
∣.
Such behaviors are represented by the asymmetric elasticity demand function in figure
3. It is called asymmetric elasticity demand function because the mathematical properties
of what it represents are asymmetric in spite of the symmetrical properties of the demand’s
reactions. Indeed, the demand elasticity increases with respect to the prices when dp > 0
and decreases with respect to them when dp < 0.
Now, let us introduce such kind of demand functions in a simple model that considers the
price-maker power of firms. To make it very clear, let us consider a monopoly firm producing
the quantity Q of a good with the cost function C(Q). Knowing the function of customer’s
demand is Qd(p) - which is such that ǫd, the elasticity with respect to the prices, is always
larger than one5 - the maximisation problem gives as a result :
p
1 + τ=
ǫd
ǫd − 1
∂C
∂Q(7)
Differentiating equation 7 in an equilibrium path gives, with F = p
ǫd
∂ǫd
∂pbeing the elasticity
4Indeed, the derivated function sign does not change.5It is what find Ehrenberg & England (1990), Ehrenberg & Scriven (1999) and Scriven & Watson-Gandy
(2000) in their emprirical studies, and the basic stability condition for monopoly markets.
19

with respect to the price of the demand elasticity :
x =1 + τ
p
dp
dτ=
1
1 − ǫd
ǫd−1 (1 + τ)∂2C∂Q2
∂Qd
∂p+ F
ǫd−1
(8)
As in section 3, tax shifting parameter for the prices is decreasing with respect to the
demand reaction ∂Qd
∂pand with respect to the marginal cost increase ∂2C
∂Q2 - however, it must
be noticed that this marginal cost increase is no longer the inverse of the supply elasticity.
Moreover, one can see there, as it has been said previously, that tax shifting on the prices
when firms are price-taker takes in account the price elasticity of the demand elasticity.
According to the demand properties previously presented, F is bigger when prices increase
than when they decrease, and therefore the tax shifting parameters are smaller upwards than
downwards.
This price-taker effect may explain that the asymmetry of the tax shifting on the prices of
industrial products, the demand asymmetric effect, is in the opposite direction as the supply
asymmetry. In markets with monopolistical firms or with collusion - markets that better
consider demand variations because of the price-making power of firms - price increases are
relatively weak in order to prevent the fall of the demand, and price decreases are relatively
strong in order to take benefit from the takeoff of the demand.
6 Tax shifting after big VAT variations
In section 4 was presented an explanation of the supply asymmetrical effect using adjust-
ment costs arguments. An important issue consists in understanding whether or not these
adjustment costs are proportional to the output adjustments. More precisely, does there
exist considerable fixed adjustment costs ? Indeed, if the adjustment costs are proportional
to the output adjustments, the supply asymmetric effect should be the same whatever the
VAT rate change is big or small. But if there exists considerable fixed adjustment costs, the
supply asymmetric effect should decrease with respect to the importance of the VAT rate
decrease.
In order to understand this mechanism, let us use the same notations as in section 4.
When dτ is negative, dQ is positive and ǫs is in inverse proportion to ∂2C∂Q2 = |∆1 + ∆2|,
where ∆1 is the second derivative of the cost function and ∆2 is the adjustement cost. If
the adjustment costs consist in fixed costs, then ∆2 is decreasing with respect to dQ - only
dQ > 0 are considered here - and so does ∂2C∂Q2 . It follows that ǫs is increasing in dQ, and so
does the tax shifting parameter.
In this section, I analyse tax shifting on prices after an important VAT rate change in
order to answer this question. The suitable reform occured in France on September 1st
1999. According to a European experiment, French VAT rate on home repair services had
been decreased at this time from the full rate - 20.6% - to the reduced rate - 5.5% -, which
20

Figure 4: Prices of home repair services around the 1999 French VAT reform
The prices are corrected from an inflation trend estimated as the mean of the book inflation during the 16
month considered.
constitute a big variation. Figure 4 shows the price index of these services around the reform.
Two properties may clearly be seen on figure 4. First of all, the shifting seems to occur
very quickly. Secondly, it seems to be very substantial. It should be specified that home repair
services are labor intensive services, whose prices should behave as those of hairdressing or
domestic machines services. Indeed, I make the same regressions as in section 3 for home
repair services 6, the results are that the tax shifting parameter for the prices of these services
is 87%, which is indeed intermediate between the tax shifting parameters for the prices of
hairdressing and domestic machines repairs.
For the same reasons as for the other labor intensive services, the tax shifting on the
prices of home repair services should be very little after small VAT rate decreases. As it
has been said previously, the calculation of the tax shifting on the prices of this set of price
data after the 1999 huge VAT rate reduction gives informations on the causes of the supply
asymmetric effect. Table 9 shows the results of the regression following equation 2 of the
home repair services’ prices around the 1999 reform.
6I make these regressions only for the 1995 reform, because home repair services, which were taxed at the
reduce rate, did not be concerned by the 2000 reform.
21
Before commenting the results themselves, it must be noticed that they are very signi-
ficative. More than 99% of the variance is explained by the explicative variables, and all the
coefficients are much more significant than 1%.
This regression demonstrate that with an important VAT rate decrease, the two symp-
toms of the supply asymmetric effect disapear. Firstly, the first two delay coefficients are
significantly higher than the last two. Indeed, β0 + β1 − (β2 + β3) = 0.546, with a standard
error equal to 0.016. Secondly, the tax shifting parameter is hardly smaller than the upwards
one. It is 74% downwards and 87% upwards.
Thus, this section shows that the adjustment costs presented in order to explain the
supply asymmetrical effect should be mainly fixed costs.
7 Conclusions
This paper presents two different asymmetric effects on tax shifting on prices, that occur on
different kinds of markets. On competitive markets, firms reflect commodity tax variations
more fully when the taxes increase than when they decrease. As an opposite result, on
markets with collusion, firms reduce more the prices than they raise them. This might look
like a paradox but one must keep in mind that in perfect competition markets, prices are
still low, which prevents firms from making important price decreases.
This paper suggests explanations for these two asymmetric effects. Concerning the higher
tax shifting parameters upwards than downwards in competitive markets, supply asymmetry
arguments are proposed. The existence of fixed adjustment costs may prevent firms from
decreasing their prices after small VAT decreases. However, big VAT rate decreases are more
strongly shifted on prices.
Concerning the lower tax shifting parameters upwards than downwards in collusive mar-
kets, demand asymmetry arguments are proposed. The demand reactions might be stronger
after important price variations than after tenuous ones. This might be due to psychological
effects or to the shadow price of changing one’s consumption habits. Therefore, in markets
with monopolistical firms or with collusion - markets that better consider the variations of
the demand because of the price making power of firms - price increases are relatively weak
in order to prevent the fall of the demand, and price decreases are relatively strong in order
to take profit of the takeoff of the demand.
These asymmetric effects take a great importance in the political debate because they put
forward the risk of a bias toward high VAT rate. If politicians have a short term bias and make
their reforms with the aim of obtaining viewable short run results, the decision of decreasing
the VAT rate will rarely be taken. Indeed, amongs the goods subject to the full-rate -
which do not take the main part of custommers’ budgets - only the capital intensive goods
22

would reflect commodity tax decreases in the short run. Such bias may occur specially when
governments choose a temporarily increase of commodity taxes in order to face transitory
budget problems. The temporary reforms might be changed in permanent ones.
However, this bias should be stronger if the asymmetric effects - in particular the supply
asymmetric effect - are permanent in the long run. But the theoretical arguments proposed to
explain this asymmetry imply that the asymmetric shifts on prices should not be permanent,
because restructuration costs and credit constraints are transitory matters. Unfortunately,
long run compensations can not be seen in data, and it can not been said for sure if the
asymmetric effects presented in these paper are transitory or permanent effects. Nevertheless,
the bias toward high VAT rate should be effective, because even if the asymmetric effects are
only transitory, the transition time should be long. If not, tax shifting on prices after four
month should appear on regressions using more delays.
References
Benabou, R., Gertner, R., 1993. Search with Learning from Prices : Does Increased InflationaryUncertainty Lead to Higher Markups ?. Review of Economic Studies 60, 69 - 94.
Bertrand, M., Kramarz, F., 2002. Does entry regulation hinder job creation ? Evidence fromthe french retail industry. Quarterly Journal of Economics 117, 1363 - 1414.
Besley, T., 1989. Commodity taxation and imperfect competition, a note on the effects of entry.Journal of Public Economics 40, 359 - 367.
Besley, T., Rosen, H., 1999. Sales taxes and prices : an empirical analysis. National Tax Journal52, 157 - 178.
Brown, A.,Deaton, A., 1972. Surveys in applied economics : models of consummer behaviour.The Economic Journal 82, 1145 - 1236.
Carbonnier, C., 2004. Qui paie la TVA ? Existence d’un hysteresis dans l’ajustement des prixaux variations de TVA. master reserch paper EHESS, Paris.
Cremer, H., Thisse, J.-F., 1994. Commodity Taxation in a Differentiated Oligopoly. Interna-tional Economic Review 35, 613 - 633.
Cremer, H., Pestieau, P., Rochet, J., 1997. Direct versus undirect taxation The design of taxestructure revisited. International Economic Review 42, 781 - 800.
Delipalla, S., Keen, M. 1992. The comparison between ad valorem and specific taxation underimperfect competition. Journal of Public Economics 49, 351 - 367.
Dierickx, I., Matutes, C., Neven, D., 1988. Indirect taxation and Cournot equilibrium. Interna-tional Journal of Industrial Organisation 6, 385 - 399.
Dixit A., 1980. The Role of Investment in Entry Deterence. Economic Journal 90, 95 - 106.
Dixit A., 1986 Comparative Statics for Oligopoly. International Economic Review 27, 107 - 122.
Durham, Y., McCabe, K., Olson, M., Rassenti, S., Smith, V., 2004. Oligopoly competition infixed cost environment. International Journal of Industrial Organization 22, 147 - 162.
23

Ehrenberg, A., England, L., 1990. Generalising a pricing effect. The Journal of Industrial Eco-nomics 39, 49 - 68.
Ehrenberg, A., Scriven, J., 1999. Patterns of Response to Price Changes. Proceedings of theANZMAC conference.
Haufler, A., Schjelderup, G., 2004. Tacit collusion and international commodity taxation. Jour-nal of Public Economics 88, 577 - 600
Katz, M., Rosen, H., 1985. Tax analysis in an oligopoly model. Public Finance Quarterly 13, 3- 19.
Kay, J., Keen, M., 1991. Product quality under specific and ad valorem taxation. Public FinanceQuaterly 19, 238 - 247.
Neumann, N., Weigland, J., Gross, A., Munter, M., 2001. Market size, fixed costs and horizontalconcentration. International Journal of Industrial Organization 19, 823 - 840.
Scriven, J., Watson-Gandy, C., 2000. Empirical Results from an Experimental Study of Cross-Price Effects. Proceeding form the ANZMAC conference.
Seade, J., 1980. On the effects of entry. Econometrica 48, 479 - 490.
Spence, M., 1983. Contestable Markets and the theory of Industry Structure : A Review Article.Journal of Economic Literature 21, 981 - 990.
Stern, N., 1987. The effects of taxation price control and government contracts in oligopoly andmonopolistic competition. Journal of Public Economics 32, 133 - 158.
Tam, M.-Y., 1991. Tax on price : A new commodity tax structure for efficiency. Public Finance46, 123 - 133.
Walker, I., Wirl, F., 1993. Irreversible Price-Induced Efficiency Improvements : Theory andEmpirical Applications to road transportation. Energy Journal 14, 183 - 205.
Commission des communautes europeennes, rapport de la commission au conseil et au parlementeuropeen COM(2003) 309 final, 2003. Experience de l’application d’un taux de TVA reduit surcertains services a forte intensite de main-d’œuvre.
24