is the federal debt raising corporate profits and reducing ... · is the federal debt raising...
TRANSCRIPT
Is the Federal Debt Raising Corporate Profits and
Reducing Labor’s Share of National Income?
John E. Golob – Retired (Federal Reserve Bank of Kansas City)
5515 Crestwood Drive, Kansas City, MO 64110, [email protected]
Abstract
The federal debt-to-GDP ratio has accelerated in recent years to levels unseen in the U.S.
since the post- World War II decline. At the same time, the profit share of national income is at
post-war highs and the employee compensation share of national income is at 40-year lows.
The empirical evidence in this paper suggests that these facts are related. The paper provides
evidence that government debt has crowded out business investment, which has led to a rising
profit share and declining employee compensation share of income. This result suggests that
the federal debt is contributing to income inequality. On the other hand, to the extent that the
rise in profit share can be traced to economic fundamentals, it is likely to be more persistent
than the rise in the mid-2000s, which was boosted by illusory profits in the financial sector.
October 2012

2
Is the Federal Debt Raising Corporate Profits and Reducing Labor’s Share of National Income?
I. Introduction
At the end of calendar year 2011 the U.S. gross federal debt was 15.6 trillion dollars, which
at 102 percent of annualized U.S. GDP is the highest since 1947.1 Corporate profits in the final
quarter of 2011 were $1.99 trillion dollars, which at 14.6 percent of national income is the
largest profit share since the Department of Commerce started compiling quarterly data on the
U.S. economy in 1947.2 Meanwhile, the labor share of income is at post-war lows (Jacobson
and Occhino, 2012).3 Is it a coincidence that the profit share of national income and the debt
were both at 60-year highs while the labor share of income was at post-war lows? This paper
suggests not. Although the rise in profit share can be partly attributed to growth in the
overseas operations of U.S. corporations (Hodge, 2011), this paper presents evidence that the
federal debt may be another contributing factor.
Many researchers have analyzed the economic effects of government debt and deficits.
Elmendorf and Mankiw (1999), Gale and Orszag (2003) and Engen and Hubbard (2005) are
among the more recent articles that summarize this extensive research. Much of the empirical
research has focused on whether government deficits affect interest rates. Although early
research yielded mixed results, subsequent research has found a more consistent relationship
between deficit forecasts and expectations of future long-term interest rates (Laubach, 2003). 1 This calculation is based on GDP in the fourth quarter of 2011. The CBO forecasts the debt will continue to rise,
and Kliesen and Thornton (2012) suggest that the CBO forecasts may understate future debt levels. 2 This calculation of profit share uses data from BEA NIPA Table 1.12, from the July 2012 issue of the Survey of
Current Business. The remainder of the paper calculates domestic profits as a share of domestic income (BEA NIPA Table 1.10). Domestic profits are lower because they exclude profits earned by U.S. corporations from operations in other countries. 3 The record low labor share in Jacobson and Occhino (2012) is based on BLS data. The remainder of this paper
uses employee compensation from BEA NIPA accounts as a proxy for labor share. This alternative measure has also fallen over the past three decades, but is not at record lows.

3
Interest rates, however, are not the only issue. To the extent that deficits reduce savings
and national wealth, they will restrain future economic growth. Ball and Mankiw (1995) discuss
these potential long-term consequences, noting that ongoing deficits would reduce the capital
stock, which would lead to higher rates of profit and put downward pressure on wages. The
empirical evidence below supports these predictions by Ball and Mankiw.
Separate from the study of government debt, researchers have been trying to understand
why labor’s share of income has declined and the profit share of income has risen over the last
three decades. Jacobson and Occhino (2012) and Ellis and Smith (2007) discuss three potential
reasons. First, researchers have suggested that wage growth has slowed because the
bargaining power of unions has declined as employment in unionized sectors of the economy
has declined. Second, globalization may have reduced the bargaining power of labor as low-
skilled workers from China and Eastern Europe have entered the global economy. Third,
researchers have suggested that technological change may play a role in changing labor and
profit shares, either by increasing the productivity of capital, or by increasing the rate of
worker’s obsolescence and thereby reducing their bargaining power. In a cross-country
analysis Ellis and Smith (2007) conclude that technology is more important than the decline of
unions or globalization. Guscina (2006), however, finds a role for both technology and
globalization in cross-country data. Offering an alternative explanation, the 2005 IMF World
Economic Outlook finds that the labor share of income has not declined as much in countries
with greater labor market flexibility. To summarize this extensive area of research, it is safe to
say that researchers have not yet reached a consensus as to why labor share is low and profit
share is high.

4
The current paper establishes a link between the two distinct areas of research,
government debt and income shares. Instead of looking at interest rates for evidence of
crowding out, the paper looks at business investment, corporate profits, and employee
compensation.
Government debt can affect the economy by crowding out private investment and thereby
restraining growth in the capital stock (Friedman, 1983). The resources available for
investment are the sum of domestic savings and capital inflows from abroad. Government
deficits subtract from domestic savings, and unless rising deficits are accompanied by either
higher private savings or higher capital inflows, the deficits will reduce investment.4 And as
reduced business investment restrains growth in the capital stock, further macroeconomic
consequences can occur.
A change in the capital stock has implications for both wages and business profitability.
Looking first at wages, microeconomic theory says that a profit maximizing firm pays workers
the marginal product of labor. And if the capital stock falls, wages follow the marginal product
of labor downward. That is, when business investment is low workers are less productive and
wages are lower. Of course, the U.S. capital stock has generally trended upwards, but to the
extent that the capital stock is lower than it would be in the absence of deficits, government
debt restrains wage growth. The National Income and Product Accounts (NIPA) confirm this
4 See Olivei (2000) and Ball and Mankiw (1995) for further discussion on the relationship among savings,
investment, and international capital flows.

5
relationship, the employee compensation (wages plus benefits) share of domestic income is
low when the debt-to-GDP ratio is high.5
The capital stock also affects business profitability. In a competitive market,
microeconomic theory says that the return-to-capital will be the same as its marginal product,
and that the marginal product moves inversely with the capital stock. Stated another way,
when businesses have less to invest they choose only the most profitable opportunities. Thus,
if the capital stock is lower because investment is crowded out by the deficits, businesses will
be more profitable than they would have been without the deficits. The NIPA data confirm this
relationship, the profit share of domestic income is positively correlated with the debt-to-GDP
ratio.6
Changes in the employee compensation and profit shares of income over the last few
decades have been economically significant. For example, the compensation share of domestic
income was 68.4 percent during the business cycle that began in 1980, but fell to 64.3 percent
in the cycle that began in 2001.7 This 4.1 percent difference corresponds to over $539 billion
dollars annually at current levels of domestic income, which is less than the $518 billion growth
in employee compensation from the trough of the recession in 2009:Q2 to the end of 2011.8
5 In the context of an aggregate production function, a lower income share for the more abundant input requires
the elasticity of substitution to be less than unity (Romer, 2012). This is consistent with estimates by Antràs (2004), but there is no consensus regarding the value of this economic parameter. Economists often model production with a Cobb-Douglas function, which has unity elasticity of substitution and constant labor and capital shares. As additional evidence that income shares vary, Bentolilla and Saint-Paul (2003) present cross-country evidence that labor shares decline as capital/output ratios fall. 6 Again, in the context of an aggregate production function, this requires the elasticity of substitution to be less
than unity. 7 According to the June 2012 NIPA data release, the employee compensation share of gross domestic income fell to
62.6 percent in 2011:Q4. 8 This calculation is based on the preliminary NIPA data release (Table 1.10) for 2011:Q4 on January 27, 2012.
Employee Compensation was $7818 billion in 2009:Q2 and $8336 billion in 2011:Q4.

6
The remainder of the paper is organized as follows. Section 2 presents empirical evidence
on how the federal debt affects the macroeconomy. Section 3 discusses implications of the
empirical results and relates the results to previous research.
II. Debt and the Macroeconomy
To explore the crowding out effect of the federal debt, this section looks at the relationship
between the debt and three other economic variables; business investment, corporate profits,
and employee compensation.9 Business investment as measured by the BEA is close in concept
to investment as defined in the context an economic growth model. Finding measures of
wages and business profits is more problematic. NIPA accounts include measures of employee
compensation and corporate profits, but the proprietor’s income category, into which many
small businesses fall, contains an uncertain mix of compensation and profits.10 This paper
sidesteps the problem of dividing proprietor’s income, and takes the NIPA corporate profit
category as a proxy for business profits, and the NIPA employee compensation category as a
proxy for wages and benefits.
Two of the macroeconomic relationships discussed in this paper differ from those that
occur within the business cycle. First, both corporate profits and business investment are pro-
cyclical, they rise during expansions and fall during recessions (Zarnowitz, 1992). But NIPA data
reveal an inverse relationship between these variables over longer time horizons. As a second
example, corporate profits and tax revenues typically fall during recessions, and lower tax
9 The label for business investment in the NIPA tables is “Nonresidential Investment.”
10 See Gomme and Rupert (2004) for a discussion of some of the problems dividing NIPA accounts into labor and
profit share. One strategy is to divide proprietor’s income between capital and labor in the same proportions as their share of total income.

7
revenues cause the debt to rise. That is, business cycle effects suggest an inverse relationship
between debt and profits over the short-run. In contrast, the paper shows a positive
relationship between these variables over longer time horizons.
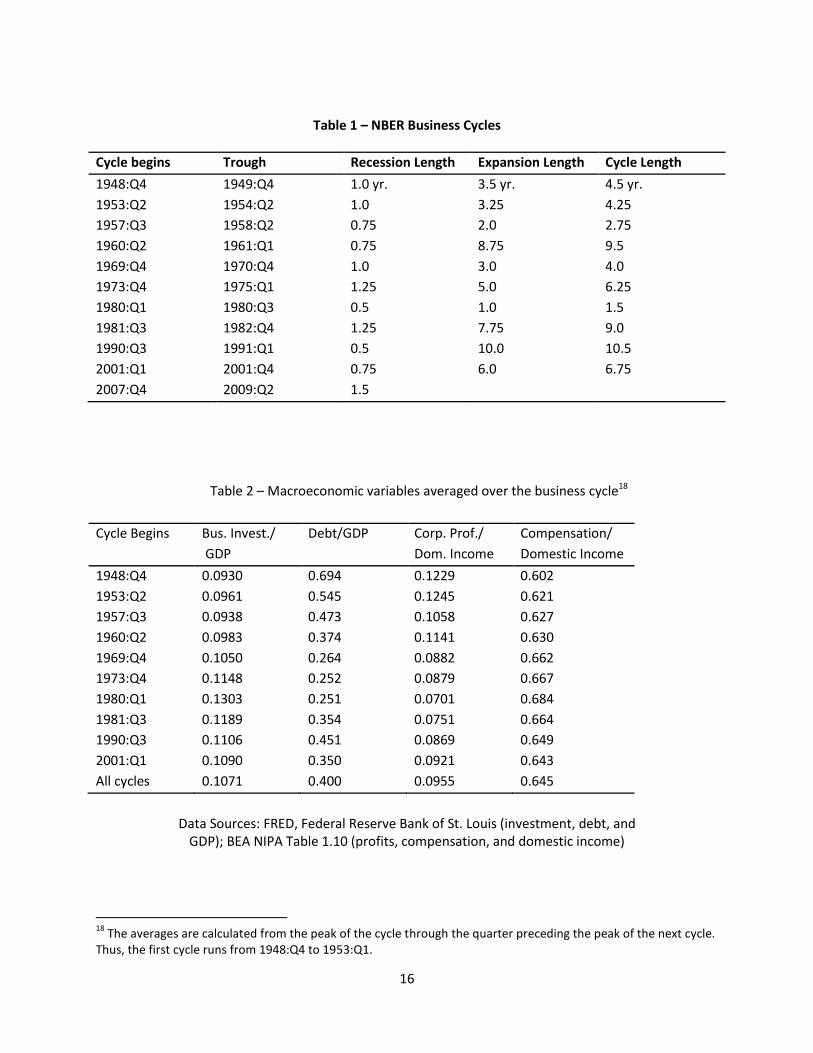
To separate the long-term economic relationships from those that occur during the
business cycle, this paper calculates the averages of economic variables over the ten post-war
business cycles. The business cycle peaks and troughs are taken from the National Bureau of
Economic Research (NBER) Business Cycle Dating Committee (Table 1). Table 2 shows the
business cycle averages of business investment, the federal debt, corporate profits, and
employee compensation. The calculations use normalized variables, investment and debt are
shown as a fraction of GDP, and profits and employee compensation are shown as a fraction of
domestic income. Time plots of these variables from 1947 through 2011 are shown in Chart 1
and Chart 2.
The first link in the chain between debt and income shares is the crowding out of business
investment. This effect is not controversial, and is arguably more about accounting than
economics. That is, since domestic investment is the sum of domestic savings plus capital
inflows, and the federal deficit subtracts directly from domestic savings, any increase in the
deficit that is not accompanied by an increase in capital inflows or private savings will reduce
investment. A paper by Feldstein and Horioka (1980) provides early indirect evidence, showing
a correlation between savings and investment in cross-country data. If capital was mobile
enough to compensate for shortfalls in domestic savings, investment would be independent of
savings. In a more recent CBO paper, Russek (2005) offers a consensus estimate that capital
inflows compensate for about 40 percent of the savings lost to the federal deficit.

8
Chart 3 looks at crowding out using the data from Table 2. The scatter plot shows business
cycle averages of business investment versus the federal debt, both as a fraction of GDP. The
negative slope of the trendline indicates a negative relationship between business investment
and the federal debt.11
The next link in the chain between federal debt and income shares is the relationship
between business investment and profits. If higher business investment implies a lower
marginal product of capital, profits and business investment should be inversely related. This
issue has not received as much attention as crowding out, but Anderson, Klau, and Yndgaard
(1999) show a negative relationship between the level of capital and the return-to-capital in
cross-country data.12 Chart 4 illustrates this correlation using the calculations from Table 2.
The scatter-chart of business cycle averages shows a negative relationship between business
investment and profits.
Having shown that high federal debt levels have been associated with low business
investment, and that low investment has been associated with high profitability, the paper next
looks directly at the relationship between debt and income shares. Chart 5 shows the
relationship between profits and the federal debt, and Chart 6 shows the relationship between
employee compensation and the federal debt. These results are consistent with the crowding
out hypothesis. If the federal debt reduces the capital stock, this should raise the marginal
11
A more appropriate measure of crowding out would be a comparison of the capital stock to the federal debt. This relationship is not as strong, possibly because estimates of the capital stock depend strongly on assumptions about depreciation. When the BEA changed depreciation assumptions in 1996, estimates of the capital stock for both private and government structures rose by almost 50 percent (Browne and Hellerstein, p. 32). To the extent that some of the capital stock depreciates rapidly, business investment over the course of a business cycle may be a reasonable proxy for the capital stock. 12
See Graph 3 on page 13 of Anderson, Klau, and Yndgaard (1999).
9
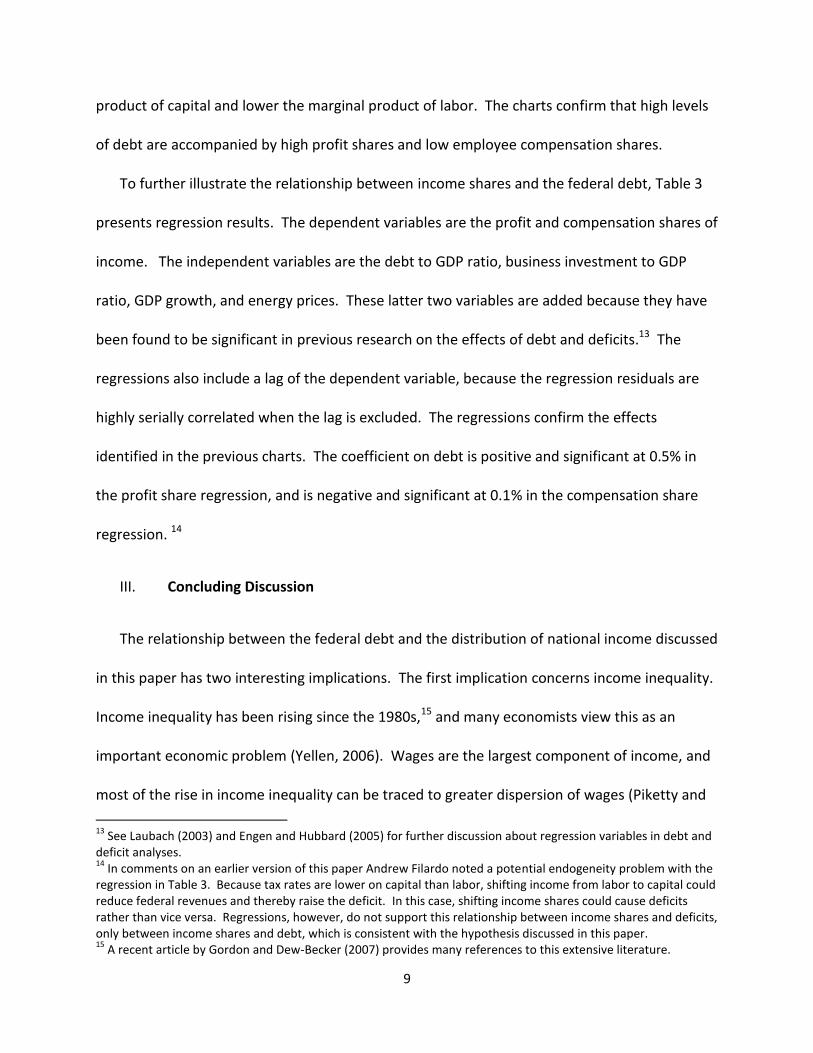
product of capital and lower the marginal product of labor. The charts confirm that high levels
of debt are accompanied by high profit shares and low employee compensation shares.
To further illustrate the relationship between income shares and the federal debt, Table 3
presents regression results. The dependent variables are the profit and compensation shares of
income. The independent variables are the debt to GDP ratio, business investment to GDP
ratio, GDP growth, and energy prices. These latter two variables are added because they have
been found to be significant in previous research on the effects of debt and deficits.13 The
regressions also include a lag of the dependent variable, because the regression residuals are
highly serially correlated when the lag is excluded. The regressions confirm the effects
identified in the previous charts. The coefficient on debt is positive and significant at 0.5% in
the profit share regression, and is negative and significant at 0.1% in the compensation share
regression. 14
III. Concluding Discussion
The relationship between the federal debt and the distribution of national income discussed
in this paper has two interesting implications. The first implication concerns income inequality.
Income inequality has been rising since the 1980s,15 and many economists view this as an
important economic problem (Yellen, 2006). Wages are the largest component of income, and
most of the rise in income inequality can be traced to greater dispersion of wages (Piketty and
13
See Laubach (2003) and Engen and Hubbard (2005) for further discussion about regression variables in debt and deficit analyses. 14
In comments on an earlier version of this paper Andrew Filardo noted a potential endogeneity problem with the regression in Table 3. Because tax rates are lower on capital than labor, shifting income from labor to capital could reduce federal revenues and thereby raise the deficit. In this case, shifting income shares could cause deficits rather than vice versa. Regressions, however, do not support this relationship between income shares and deficits, only between income shares and debt, which is consistent with the hypothesis discussed in this paper. 15
A recent article by Gordon and Dew-Becker (2007) provides many references to this extensive literature.

10
Saez, 2003). Nevertheless, because capital income is skewed towards the upper end of the
income distribution (Díaz-Giménez, Glover, and Ríos-Rull, 2011), a shift in the distribution of
income from labor to capital will exacerbate income inequality. Thus, if the federal debt is
crowding out private investment and reducing labor’s share of national income, the federal
debt is contributing to income inequality.
A second implication of the link between the federal debt and the distribution of national
income concerns the sustainability of current levels of corporate profitability. The labor and
profit shares of national income have been relatively stable over time, implying that departures
from the long-run averages of these variables have been mean-reverting. Furthermore, profit
shares that were high in early releases of GDP data have sometimes been revised downwards in
subsequent data releases. For example, when the July 2008 NIPA data release showed the 4-
quarter average of the profit share rose to over 13 percent in 2006 and 2007 for the first time
in more than 50 years, some of these profits were later found to be illusory. Subsequent data
releases subtracted over 40 billion dollars from the initial profit estimates for the third quarter
of 2007 (mostly in the financial sector), and the profit share fell from 13.5 percent to 12.1
percent.16 To the extent that recent rises in the profit share can be traced to macroeconomic
fundamentals, this economic variable is less likely to revert to its long-run mean or be revised
downwards in subsequent data releases.
The link shown in this paper between the federal debt and changes in the distribution of
national income is a significant departure from earlier research on income shares. Thus, this
16
BEA tables present annualized data and show a revision of 167 billion dollars for 3Q:2007 over the next two July releases.

11
preliminary result demands further scrutiny.17 One direction for future research would be to
extend the analysis to other countries. Declining labor shares, rising profit shares, and rising
debt have also been observed throughout the developed world (Rodriguez and Jaydev, 2010;
Ellis and Smith, 2007). Consistent with the above analysis, Bentolila and Saint-Paul (2003)
present evidence that labor share depends on the capital/output ratio in OECD countries.
Cross-country comparisons may be complicated, however, by dissimilarities among the
developed economies. For example, Ellis and Smith show that profit shares in Australia and
Norway were among the highest in the developed world in 2005, but the debt levels in these
countries were not unusually high. At 16 percent of GDP, Australia’s gross debt was among the
lowest in the developed world (OECD, 2011). A possible explanation for these outliers is the
large role for natural resources in the economies of both Australia and Norway.
In another relevant study of international data, Poterba (1998) calculates the correlation
across G-7 countries of the profitability of business capital. He calculates that correlations of
profitability across countries is generally low, which suggests that idiosyncratic factors are more
important than common factors in explaining changes in profitability. As discussed in the
introduction above, analyses of changing income shares often consider technological
explanations, but technology varies less than fiscal policy across countries. Thus, Poterba’s
conclusion that idiosyncratic factors are more important than common factors favors a fiscal
policy explanation over a technology explanation of inter-country variations in profitability.
17
One avenue for testing the robustness of the result in this paper would be to consider alternative measures of labor share. A labor share estimate calculated by the Bureau of Labor Statistics does not show the same rise through the 1950s and 1960s that is shown in Chart 2 of employee compensation (Jacobson and Occhino, 2012). The results in this paper are unlikely to be robust to this alternative measure of labor share.

12
Lübker (2007) presents a final piece of cross-country evidence that is consistent with the
hypothesis in this paper. He notes that labor shares of income are generally lower in
developing than industrialized economies. Of course, investment and the capital stock are also
lower in developing economies. Thus, this positive relationship between low labor shares and
low levels of investment parallels the relationship shown above in U.S. data.

13
References
Andersen, P. S., M. Klau, and E. Yndgaard, 1999, “Higher Profits and Lower Capital Prices: Is
Factor Allocation Optimal,” Bank for International Settlements, BIS Working Paper No. 65, April.
Antràs, Pol, 2004, “Is the U.S. Aggregate Production Function Cobb-Douglas? New Estimates of
the Elasticity of Substitution,” Contributions to Macroeconomics, Berkeley Electronic Press, Vol.
4, 1-34.
Ball, Lawrence and N. Gregory Mankiw, 1995, “What Do Budget Deficits Do?” in Budget Deficits
and Debt: Issues and Options, Federal Reserve Bank of Kansas City, Economic Symposium
Conference Proceedings, Jackson Hole, 95-119.
Bentolila, Samuel, and Gilles Saint-Paul, 2003, “Explaining Movements in the Labor Share,” The
B.E. Journal of Macroeconomics, Berkeley Electronic Press, vol. 0(1).
Browne, Lynn Elaine, and Rebecca Hellerstein, 1997, “Are We Investing Too Little?” New
England Economic Review, November/December, 29-50.
Díaz-Giménez, Javier, Andy Glover, and José-Victor Ríos-Rull, 2011, “Facts on the Distributions
of Earnings, Income, and Wealth in the United States: 2007 Update,” Federal Reserve Bank of
Minneapolis Quarterly Review, Vol. 24, No. 1, 2-31.
Ellis, Luci, and Kathryn Smith, 2007, “The global upward trend in the profit share,” Bank for
International Settlements, BIS Working Paper No. 231, July.
Elmendorf, Douglas, and N. Gregory Mankiw, 1999, “Government Debt,” Chapter 25 in J.B.
Taylor and M. Woodford (eds.) Handbook of Macroeconomics, Vol. 1, Amsterdam: Elsevier
Science.
Engen, Eric M. and R. Glenn Hubbard, 2005, “Federal Government Debt and Interest Rates,”
NBER Macroeconomic Annual 2004, Vol. 19, 83-138.
Feldstein , Martin, and Charles Horioka, 1980, “Domestic Saving and International Capital
Flows,” Economic Journal, Vol. 90, No. 358, 314-329.

14
Frankel, Jeffrey A., 1992, “Measuring International Capital Mobility: A Review,” American
Economic Review, Vol. 82, No. 2, 197-202.
Friedman, Benjamin F., 1983, “Implications of the Government Deficit for U.S. Capital
Formation,” in The Economics of Large Government Deficits, Federal Reserve Bank of Boston,
Conference Series No. 27.
Gale, William G., and Peter Orszag, 2003, “The Economic Effects of Sustained Budget Deficits,
National Tax Journal, Vol. 56, 463-485.
Gomme, Paul, and Peter Rupert, 2004, “Measuring Labor’s Share of Income,” Federal Reserve
Bank of Cleveland, Policy Discussion Paper No. 7, November.
Guidolin, Massimo, and Elizabeth A. La Jeunesse, 2007,”The Decline in the U.S. Personal Saving
Rate: Is It Real and Is It a Puzzle?” Federal Reserve Bank of St. Louis Review, Vol. 89, No. 6, 491-
514.
Guscina, Anastasia, 2006, “Effects of Globalization on Labor’s Share in National Income,”
International Monetary Fund, IMF Working Paper WP/06/294.
Hodge, Andrew W., 2011, “Comparing NIPA Profits With S&P 500 Profits,” Survey of Current
Business, Vol. 91, No. 3, 22-27.
IMF, 2005, World Economic Outlook: Globalization and External Imbalances, April.
Jacobson, Margaret, and Filippo Occhino, 2012, “Behind the Decline in Labor’s Share of
Income,” Federal Reserve Bank of Cleveland, Economic Trends, Feb. 3.
Kliesen, Kevin L., and Daniel L. Thornton, 2012, “How Good Are the Government’s Deficit and
Debt Projections and Should We Care?” Federal Reserve Bank of St. Louis Review, Vol. 94, No. 1,
21-39.
Laubach, Thomas, 2003, “New Evidence on the Interest Rate Effects of Budget Deficits and
Debt,” Board of Governors of the Federal Reserve System, Finance and Economics Discussion
Series, Vol. 2003:12.

15
Lübker, Malte, 2007, “Labour Shares,” International Labour Office: Geneva, Technical Brief No.
01.
OECD, 2011, “OECD Economic Outlook,” Vol. 89, Annex Table 32.
Olivei, Giovanni, 2000, “The Role of Savings and Investment in Balancing the Current Account:
Some Empirical Evidence from the United States,” New England Economic Review, July/August,
3-14.
Piketty, Thomas and Emmanuel Saez, 2003, “Income Inequality in the United States, 1913-
1998,” Quarterly Journal of Economics, Vol. 118, No. 1, 1-39.
Poterba, James M., 1998, “Rate of Return to Corporate Capital and Factor Shares: New
Estimates Using Revised National Income Accounts and Capital Stock Data,” Carnegie-Rochester
Conference Series on Public Policy, Vol. 48, 211-46.
Rodriguez, Francisco, and Arjun Jayadev, 2010, “The Declining Labor Share of Income,” United
Nations Development Programme, Human Development Research Paper 2010/36, November.
Romer, David, 2012, Advanced Macroeconomics, New York: McGraw-Hill Irwin.
Russek, Frank S, 2005, “Long-Term Economic Effects of Chronically Large Federal Deficits,”
Economic and Budget Issue Brief, Congressional Budget Office, Oct. 13.
Swann, Christopher, 2011, “GDP and the Economy,” Survey of Current Business, Vol. 91, No. 11,
1-5.
Ventura, Luca, and Tina Aridas, 2012, “Public Debt as Percent of GDP 2006-2013,” Global
Finance Magazine, Economic Data Global Database.
Yellen, Janet, 2006, “Economic Inequality in the United States,” Speech to the Center for the
Study of Democracy, Nov. 6, 2006.
Zarnowitz, Victor, 1992, Business Cycles: Theory, History, Indicators, and Forecasting, Chicago:
University of Chicago Press.
16
Table 1 – NBER Business Cycles
Cycle begins Trough Recession Length Expansion Length Cycle Length
1948:Q4 1949:Q4 1.0 yr. 3.5 yr. 4.5 yr.
1953:Q2 1954:Q2 1.0 3.25 4.25
1957:Q3 1958:Q2 0.75 2.0 2.75
1960:Q2 1961:Q1 0.75 8.75 9.5
1969:Q4 1970:Q4 1.0 3.0 4.0
1973:Q4 1975:Q1 1.25 5.0 6.25
1980:Q1 1980:Q3 0.5 1.0 1.5
1981:Q3 1982:Q4 1.25 7.75 9.0
1990:Q3 1991:Q1 0.5 10.0 10.5
2001:Q1 2001:Q4 0.75 6.0 6.75
2007:Q4 2009:Q2 1.5
Table 2 – Macroeconomic variables averaged over the business cycle18
Cycle Begins Bus. Invest./
GDP
Debt/GDP
Corp. Prof./
Dom. Income
Compensation/
Domestic Income
1948:Q4 0.0930 0.694 0.1229 0.602
1953:Q2 0.0961 0.545 0.1245 0.621
1957:Q3 0.0938 0.473 0.1058 0.627
1960:Q2 0.0983 0.374 0.1141 0.630
1969:Q4 0.1050 0.264 0.0882 0.662
1973:Q4 0.1148 0.252 0.0879 0.667
1980:Q1 0.1303 0.251 0.0701 0.684
1981:Q3 0.1189 0.354 0.0751 0.664
1990:Q3 0.1106 0.451 0.0869 0.649
2001:Q1 0.1090 0.350 0.0921 0.643
All cycles 0.1071 0.400 0.0955 0.645
Data Sources: FRED, Federal Reserve Bank of St. Louis (investment, debt, and GDP); BEA NIPA Table 1.10 (profits, compensation, and domestic income)
18
The averages are calculated from the peak of the cycle through the quarter preceding the peak of the next cycle. Thus, the first cycle runs from 1948:Q4 to 1953:Q1.

17
Table 3 – Regression results for profit and employee compensation shares of income (1947:Q2-2011:Q3)
Dependent variable
Profits/income
Dependent variable
Compensation/income
Lagged dependent variable
Debt/GDP
Nonresidential investment/GDP
GDP growth
Energy prices
0.859
(0.016)***
0.0063
(0.0022)**
-0.158
(0.028)***
0.317
(0.026)***
0.0035
(0.0014)*
0.887
(0.015)***
-0.011
(.0023)***
0.096
(0.024)***
-0.223
(0.021)***
-0.0038
(0.0011)**
Adjusted R-squared
DW statistic
N
0.96
1.88
258
258
1.86
258
Notes: Standard errors in parentheses. GDP growth is calculated as the log difference of real GDP in
2005 dollars. Energy prices are calculated as the ratio of the energy price deflator to total consumption
deflator in the NIPA accounts. * Coefficient significant at 5%, ** Coefficient significant at 0.5%,
*** Coefficient estimate significant at 0.1%.

18
Chart 1 – Profits as a share of domestic income and business investment as a share of GDP
Chart 2 – Debt/GDP and employee compensation/domestic income

19
Chart 3 – Business investment/GDP and public debt/GDP, cycle averages
Chart 4 – Profits/domestic income and business investment/GDP, cycle averages
Note: The coefficients of determination, R2, measure how well the data fit the trendlines. Because the variables are serially correlated between business cycles, these coefficients cannot be interpreted as a measure of statistical significance.

20
Chart 5 – Profits/domestic income vs. debt/GDP, cycle averages
Chart 6 – Employee compensation/domestic income vs. debt/GDP, cycle averages
Note: The coefficients of determination, R2, measure how well the data fit the trendlines. Because these variables are serially correlated between business cycles, the coefficients cannot be interpreted as a measure of statistical significance.