is the price of gold manipulated? - gata the price of gold manipulated? dirk g. baur1 business...
TRANSCRIPT

Electronic copy available at: http://ssrn.com/abstract=2326606
Is the Price of Gold Manipulated?
Dirk G. Baur1
Business School: Finance
University of Technology, Sydney
First draft: September 15, 2013
Abstract
An increasing price of gold provides signals about the value of fiat money and can
influence inflation expectations and bond yields. Central banks therefore have an
interest in a relatively constant price of gold and consequently an incentive to
manipulate the price of gold. This paper summarizes the main arguments for gold
price manipulation and replicates the statistical analysis commonly used to support
the manipulation hypothesis. Conversely, our statistical analysis finds no evidence in
support of gold price suppression and no exploitable profit opportunity based on
differences in the London AM and PM fixing. We further argue that it is more likely
that the gold carry trade is responsible for price anomalies. Despite statistical
evidence against gold price manipulation the lack of transparency regarding central
bank gold lending and the London gold price fixings cannot comprehensively dismiss
claims of manipulation.
Keywords: gold; manipulation; central banks; gold lending; gold carry trade
1 Address: PO Box 123, Sydney NSW 2007, Australia, email: [email protected]
I would like to thank Isaac Miyakawa for excellent research assistance and Bron Suchecki for very important
comments and feedback on an earlier version of this paper.

Electronic copy available at: http://ssrn.com/abstract=2326606
2
Introduction
There are several sources which argue that the price of gold is manipulated (e.g. Douglas, 2010,
Martenson, 2012 and Speck, 2003 among many others). In fact, there is even an organization, the
Gold Anti-Trust Action Committee (GATA), dedicated to the issue of gold price manipulation.
An article in the Financial Times (Tett, 2011) summarizes the core argument by GATA2 and
argues that some of GATA’s “points have at least a grain of truth”. The “grain of truth” may be
related to the economic arguments underlying the manipulation claims. Since central banks
control fiat money and the monetary system they have an interest in a relatively low price of gold
or a price of gold that does not rise by too much and too fast. A strong price increase and a high
price of gold would trigger concerns regarding the value of fiat money and the stability of the
monetary system.3 Doubts about the value of fiat money would lead to higher government bond
yields and expected inflation and particularly influence a country whose currency is a global
reserve currency. Hence, the focus of manipulation is often on the US central bank.4
Interestingly, recent statements by the chairman of the US central bank, Ben Bernanke, have
contributed to the manipulation debate. When asked in 2011 whether gold is money he
responded that gold is not money but an asset.5 Two years later, in 2013 when again questioned
about gold, Bernanke said that “Movements of gold prices don’t predict inflation very well.” and
that “nobody really understands gold prices” (see Wall Street Journal, 2013). These statements
2 “Gold is a currency that competes with government currencies [which is] why central banks have tried to control –
usually suppress – the price of gold.” 3 “The price of gold is largely determined by what people who do not have trust in fiat money system want to use
for an escape out of any currency, and they want to gain security through owning gold. Now, if annual gold
production and consumption amount to 2 percent of the world's stock, a change of 10 percent in the amount
produced or consumed is not going to change the price very much. But attitudes about inflation will change it.”
(Fed, 1993 (Angell, FOMC meeting 5/ 18/ 1993)).
“There's an interesting question here because if the gold price broke in that context, the thermometer would not be
just a measuring tool. It would basically affect the underlying psychology. Now, we don't have the legal right to sell
gold but I'm just frankly curious about what people's views are on situations of this nature because something
unusual is involved in policy here.“ (Fed 1993 (Greenspan, FOMC meeting 5/ 18/ 1993)). 4 “We can hold the price of gold very easily; all we have to do is to cause the opportunity cost in terms of interest
rates and U.S. Treasury bills to make it unprofitable to own gold. I don't know how much change in the fed funds
rate and the Treasury bill rate it takes to do that, but I'd sure like to find out.” (Fed, 1993 (Angell, FOMC meeting
5/18/1993)). 5 During his monetary policy report to Congress in July 2011 Bernanke responded to the question “Is gold money”
with “No. It’s an asset.” (e.g. see Forbes 7/13/2011).

3
do not acknowledge the role of gold as (an alternative) currency or money which is a key
premise in the rationale for gold price manipulation.6
Moreover, the recent LIBOR scandal has revealed that manipulation exists. If an important
benchmark like LIBOR can be manipulated, it is also possible that the price of gold can be
manipulated.7 Banks had an incentive to manipulate LIBOR and we will demonstrate that banks
also have an incentive to manipulate the price of gold. We will show below that it is not only
central banks, especially the US central bank that has an incentive to manipulate prices but also
private banks involved in the gold trade (also referred to as “bullion banks”). The incentives of
the bullion banks are conditional on the fact that central banks lend out some of their gold
reserve holdings enabling bullion banks to engage in the gold carry trade.
This paper is motivated by the claims that the gold price is manipulated, by the data-driven
analysis that is used to support these claims, by the apparently biased and in some cases
unsubstantiated claims made by some contributors to this debate (including apparent sample
selection biases), by the economic rationale for central banks to manipulate the gold price, the
role of the gold carry trade and, finally, by the recent LIBOR manipulation scandal.
To the best of our knowledge this is the first academic study on the manipulation of the gold
price. It is structured as follows: We first describe the main arguments for gold price
manipulation and its sources. We then replicate the data-driven analysis generally used to
support the claims and extend it significantly. The extended, more in-depth analysis shows that
the results used to support the claims are either statistical artefacts, biased because of an obvious
sample selection or anomalies that can be explained with classical finance theory. For example,
whilst most contributions suggest that there is a significant profit opportunity8, we demonstrate
(using bid and ask quote tick data) that there is no exploitable profit opportunity associated with
the price patterns claimed to be evidence for manipulation.9
6 If the price of gold was indeed manipulated in the 1980s and 1990s so that it did not increase with the general price
level, the manipulation would be the basis for Bernanke’s argument that gold “does not predict inflation very well.” 7 CFTC Commissioner Bart Chilton, attending the annual Futures Industry Association conference in Boca Raton,
Florida, declined to specifically address the report, saying: "Given the clubby manipulation efforts we saw in Libor
benchmarks, I assume other benchmarks - many other benchmarks - are legit areas of inquiry." (Wall Street Journal,
March 13, 2013). 8 We are not aware of any contribution that explains why significant profit opportunities persist for many years and
are not arbitraged away. 9 Another example is the performance of gold in periods of turmoil and financial crises. Speck (2010) argues that
gold is manipulated in such periods since its price is not stable during the entire turmoil or crisis period. An

4
Finally, an econometric analysis examines the persistence of intraday (London AM to PM fixing)
and overnight returns (London PM fixing to following day AM fixing) and the influence of
overnight returns on subsequent intraday returns. The estimation results reveal an effect that is
inconsistent with (uni-directional) gold price suppression, i.e. the evidence suggests that there is
a correction or reversal both after a rise and a decline in the price of gold.
Finally, we argue that the observed patterns are fully consistent with the gold carry trade and that
it may be private banks as opposed to central banks that caused what may look like an intended
suppression.
Even though we can dismiss the empirical evidence for suppression some questions remain
unanswered. For example, why do official statistics not distinguish between physical gold
reserve holdings of central banks and the fraction of leased gold (see IMF, 2004)?
I. Gold Price Manipulation
The role of gold as a monetary anchor has been the basis for an official gold price fixing by
central banks. The price of gold was maintained by monetary authorities at a predetermined level
until 1968 followed by a two-tier London market establishing a free market for individuals and a
central bank “market” with a gold price set at 35 US dollars per troy ounce. When the US
dollar’s convertibility into gold (at 35 US dollars) was suspended in 1971 the two-tier market
became one global market for gold. As the London fix would now be free of any central bank
intervention an afternoon (second) fix was introduced in an effort to attract investors from the
United States (O’Callaghan, 1991).10
The objective of central banks to maintain a predetermined level of the gold price during the gold
standard and the Bretton Woods system is seen by some commentators as the basis and the
precursor of gold price manipulation in the post-1971 period. However, the 40-year price history
of gold from 35 US dollars in 1971 to more than 1,900 US dollars in 2011 is not necessarily
compelling evidence for any gold price suppression.
alternative explanation is that the safe haven character of gold is short-lived and that investors start to sell gold as
soon as the uncertainty associated with the shock is resolved (see Baur and McDermott, 2012). 10
Currently, gold fixing happens twice a day by teleconference with five banks: Bank of Nova Scotia-
ScotiaMocatta, Barclays Bank, Deutsche Bank AG, HSBC Bank USA and Société Générale. The fixings are used to
determine prices globally (e.g. see Brown (Reuters), 2013)

5
Even though the suspension of the Bretton Woods gold standard meant that gold lost its pivotal
role in the international monetary system (O’Callaghan, 1991) gold still plays an important role
as a relative benchmark for fiat money. Since gold is a measure of the degree to which fiat
money is being managed there is an interest for governments and central bankers to influence the
price (Martenson, 2012).
The evidence provided by Martenson and others to prove that the price of gold is manipulated is
based on the London AM and PM fixings. The authors show that the PM fixing is lower than the
AM fixing and that the overnight returns (AM price at day t minus PM price at day t-1) are larger
than the (intra)-day returns (PM price at day t minus AM price at day t). They argue that the
lower day returns are clear proof of price suppression since day and night returns should be equal
over a long sample period.
We proceed as follows. First we replicate the main empirical findings and then extend the
analysis and thereby challenge and eventually dismiss the data-based “evidence” for gold price
manipulation.
II. Descriptive and Econometric Analysis of Manipulation
A. Data
We use two sets of data for our analysis. Daily London AM fixing prices and PM fixing prices
from 1968 until 2013 and high-frequency tick data (bid and ask quotes) from 1996 to 2013. The
tick data is only available for a shorter time period. The data is retrieved from Thomson Reuters.
Figure 1 presents the evolution of the price of gold and shows that there are two bull markets,
one spanning the period from 1968 until September 1980 and the other one lasting from 2003
until 2011. Moreover, there is a third and rather long episode in which the price of gold remained
in relatively narrow bands between the early 1980s until the year 2000. We identified these three
periods since a successful manipulation and suppression of the gold price can only have occurred
in the 1980 – 2000 period in which the price was relatively stable. A strong bull market, similar
to the one between 2003 and 2011, is not consistent with a successful suppression of the price of
gold. Moreover, some authors use the relatively stable price of gold in the 1980s and 1990s
(around 300 US dollar) as an indication for a price suppression and identify the 400 US dollar
price as an upper-price barrier (see Speck, 2010). It is well known that assets display such price

6
barriers or thresholds. However, they are often the result of psychological factors rather than
manipulation (see Aggarwal and Lucey, 2007).
Figure 1: Price of Gold
Most contributions (Douglas, 2010, Martenson, 2012 and Speck, 2003) do not examine the
relationship between central bank gold reserve changes and the price of gold (direct
manipulation) but focus on the London AM and PM fixing prices. They structure their analysis
as follows: they present London AM and PM fixing price differences, return differences between
AM and PM fixing prices labelled “intraday” and “overnight” returns, cumulative return
differences and the relationship between intraday returns and previous overnight returns.
We first look at direct evidence for an influence of central bank gold reserve changes on the
price of gold, replicate the structure of the price-related analysis and significantly extend it.
Figure 2 displays the relationship between total (world aggregate) central bank gold reserves and
the price of gold. The graph illustrates that there is no clear and consistent relationship between
the two series for the 1968 – 2013 period. There are periods in which a positive association can
0
200
400
600
800
1000
1200
1400
1600
1800
2000
Jul-
68
Jul-
70
Jul-
72
Jul-
74
Jul-
76
Jul-
78
Jul-
80
Jul-
82
Jul-
84
Jul-
86
Jul-
88
Jul-
90
Jul-
92
Jul-
94
Jul-
96
Jul-
98
Jul-
00
Jul-
02
Jul-
04
Jul-
06
Jul-
08
Jul-
10
Jul-
12

7
be identified, e.g. between 1968 and 1980, between 1996 and 2000 and between 2009 and 2011.
However, there are also periods in which the association is negative, e.g. between 2002 and
2008.
Figure 2: Central bank gold reserves and the Price of Gold
Total central bank gold reserves are represented by the solid line (left scale)
and the price of gold is given by the dashed line (right scale).
Since a visual inspection and a regression involving non-stationary variables can be misleading
we estimate a model using relative changes, i.e. we regress relative gold price changes on
relative central bank gold reserve changes. The estimation results yield negative coefficients for
the contemporaneous and lagged influence of gold reserve changes on gold price changes. These
estimates rule out a direct and positive influence of central bank gold sales or purchases on the
price of gold.11
11
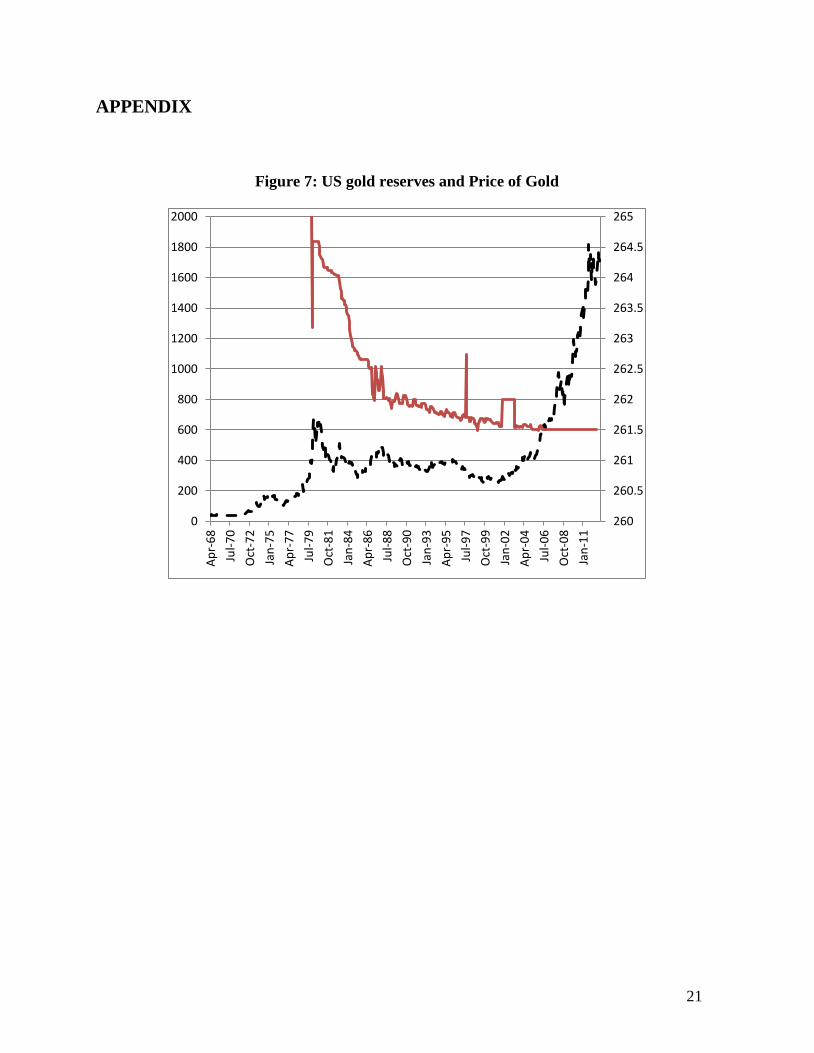
A similar result is obtained with an analysis of US central bank gold reserves. The coefficient estimates are
negative and statistically insignificant. A visual inspection of the US central bank gold reserves reveal a negative
trend of gold reserve holdings from the 1970s until 2005 (consistent with a bank selling gold to suppress the
0
200
400
600
800
1000
1200
1400
1600
1800
2000
30000
32000
34000
36000
38000
40000
42000
44000
Ap
r-6
8
Sep
-70
Feb
-73
Jul-
75
Dec
-77
May
-80
Oct
-82
Mar
-85
Au
g-8
7
Jan
-90
Jun
-92
No
v-9
4
Ap
r-9
7
Sep
-99
Feb
-02
Jul-
04
Dec
-06
May
-09
Oct
-11

8
B. Replication
1. London AM and PM fixing price differences
The sample mean of the AM fixing price based on 11,741 daily observations is 436.1957
compared to the PM fixing price of 436.0231. The standard deviations are 370.05 for the AM
price and 369.85 for the PM price. Whilst the PM price is indeed lower than the AM price the
differences are not statistically significant.
2. Intraday and overnight return differences
Intraday returns are defined as the percentage change of the PM fixing price relative to the AM
fixing price (PM price – AM price) and overnight returns are defined as the percentage change of
the AM fixing price on day t relative to the previous day’s (t-1) PM fixing price. The sample
means of the intraday and overnight returns based on 11,741 observations are -0.002348 and
0.0005348, respectively. The standard deviations are 0.0065 and 0.0154. Hence, the returns are
clearly different both in mean and in variation. Intraday returns are negative while overnight
returns are positive on average with the latter exhibiting a larger variation than the intraday
returns. The variation can also be described using quantiles. The 1% and 99% quantiles for the
intraday returns are -0.0193 and 0.0180 while the same quantiles for the overnight returns are
given by -0.0288 and 0.0323. The skewness also represents a key difference between the
intraday and overnight returns. Intraday returns display a skewness of 0.028 compared to 0.278
for overnight returns, i.e. overnight returns have a fatter positive tail (more extreme positive
observations) while this effect is negligible for intraday returns.12
We use a two-sample t-test to examine whether the returns do not only exhibit different signs but
are also statistically significant. The t-statistic is -6.73 which implies that the intraday and
overnight returns are also statistically different from each other.
In summary, the changes between the AM fixing and the PM fixing (intraday returns) are
negative on average and vary within a relatively small band while the changes between the PM
market). The downward trend exhibits a rather smooth character between 1985 and 2005 (see Figure in the
Appendix). For these sub-sample periods the coefficient estimates are positive but remain statistically insignificant. 12
The positive skewness indicates that there are more extreme positive shocks than negative shocks. This finding
does not support studies that argue mini-crashes or extreme shocks are part of a manipulation strategy and aim to
keep investors away from the gold market (e.g. see Speck 2010, page 129).

9
fixing and the following day’s AM fixing (overnight returns) are positive on average and vary
significantly more than the intraday returns.
Figure 3: Intraday and overnight returns
Finally, Figure 3 presents the intraday and overnight returns for the 40-year period and visualises
the key features of the data. In addition, the returns also display volatility clustering, i.e. periods
of increased volatility (around the year 1980 and between 2008 and 2013) and periods of
relatively low volatility (between 1982 and 2000).
3. Cumulative returns
Figure 4 displays the cumulative intraday and overnight returns. The cumulative intraday returns
(consistent with negative average intraday returns) are decreasing through time while the
cumulative overnight returns (consistent with positive average overnight returns) are increasing
through time.
-100
-80
-60
-40
-20
0
20
40
60
80
100
Jul-
68
Jul-
71
Jul-
74
Jul-
77
Jul-
80
Jul-
83
Jul-
86
Jul-
89
Jul-
92
Jul-
95
Jul-
98
Jul-
01
Jul-
04
Jul-
07
Jul-
10
Jul-
13
diff AM (t) - PM(t-1)
diff pm(t) - am(t)

10
The cumulative returns are used as evidence that a strategy that is based on buying at the PM
fixing and selling at the following day’s AM fixing yields a significant profit. Similarly, it is
argued that a short position opened at the AM fixing and closed at the PM fixing would also lead
to a significant profit.
Since the cumulative returns increased significantly over the 40-year period it is claimed that
there was not only a profit opportunity but also evidence of manipulation. The authors use
cumulative returns to emphasize the return differences and as an argument that it is a
“sophisticated” suppression that only becomes evident if longer periods are examined (see
Douglas, 2010). Interestingly, it is not explained why such profit opportunities are not exploited
and persist.
Figure 4: Cumulative intraday and overnight returns
-3000
-2000
-1000
0
1000
2000
3000
4000
5000
Jul-
68
Jul-
71
Jul-
74
Jul-
77
Jul-
80
Jul-
83
Jul-
86
Jul-
89
Jul-
92
Jul-
95
Jul-
98
Jul-
01
Jul-
04
Jul-
07
Jul-
10
Jul-
13
cumul overnight
cumulative day

11
Some authors also look at the number of positive and negative return “days” and their ratio and
conclude that there is manipulation because of more negative (“down”) than positive (“up”)
intraday returns and more positive than negative overnight returns.13
4. Relationship intraday and overnight return differences
An important step to identify gold price manipulation is to establish a relationship between
intraday returns and previous overnight returns. Martenson (2012) for example plots the
cumulative intraday returns using an inverted scale and cumulative overnight returns in one
graph and argues that the strong positive association is evidence of a link between the two
returns.14
C. Critical assessment
The manipulation-advocates argue that a lower average PM fixing price relative to the AM fixing
price is evidence of gold price suppression, i.e. entities sell gold between the AM fixing and the
PM fixing. An analysis of intraday and overnight returns is used to emphasize this gold price
suppression hypothesis since overnight returns are positive while intraday returns are negative.
In a final step a relationship between cumulative intraday returns and overnight returns is
established and used as evidence for gold price suppression.
Most of the evidence used to back the manipulation hypothesis is based on averages (sample
means). Naturally, such averages can hide a lot of information. For example, an analysis of the
time-variation of the averages (using moving averages) shows that the PM fixing price is not
consistently below the AM fixing price. In contrast, there are several periods that exhibit a higher
PM fixing price than the AM fixing price and also relatively long periods (between 1980 and
2000) in which there is no clear difference between the AM and PM prices. Figure 5 presents the
evolution of the AM – PM price differences through time. The graph displays the raw price
difference and a 6-month moving average.
13
# Pos. returns # Neg. returns
Intraday returns 5398 6343
Overnight returns 6026 5714
14
Martenson (2010) also regresses cumulative intraday price changes on cumulative overnight changes and reports
an R squared of 95%. Speck (2003) uses a comparable graphical approach.

12
Apart from the shortcomings of sample means, there are other explanations for a lower PM
fixing price. First, if the market during the AM – PM fixings is more liquid than the overnight
market, it is possible that the AM price reflects an overreaction to previous news arrivals which
is corrected (reversed) during the AM to PM day trading. This liquidity and overreaction
hypothesis is consistent with the larger overnight return volatility compared to the intraday
volatility. Moreover, the larger overnight return volatility is consistent with a significantly
longer time span (hours) and thus more news arrivals.
The sequence of positive overnight returns and negative day returns are used as evidence of price
suppression, i.e. the price is suppressed during the day based on the previous overnight return.
Cumulative returns are used to emphasize the return differences and as an argument that it is a
sophisticated “suppression” that becomes only evident if longer periods are examined (see
Douglas, 2010).
Figure 5: AM - PM price difference and 6-month moving average
If overnight and intraday return differences could be used to prove suppression such differences
should be most pronounced at times when the suppression is successful and the price of gold is
relatively stable over a certain period of time. However, while the price of gold was relatively
-20
-15
-10
-5
0
5
10
15
20
Jul-
68
Jul-
71
Jul-
74
Jul-
77
Jul-
80
Jul-
83
Jul-
86
Jul-
89
Jul-
92
Jul-
95
Jul-
98
Jul-
01
Jul-
04
Jul-
07
Jul-
10
Jul-
13

13
stable between 1982 and 2000 and particularly so between 1986 and 1996, intraday and
overnight returns do not indicate price suppression. Conversely, during periods when the gold
price was not stable and increased significantly (between 1971 and 1980 and between 2001 and
2011) the AM – PM differences indicate strong (but unsuccessful) suppression of the price of
gold.
To establish a causal link between overnight returns and subsequent intraday returns (consistent
with the hypothesis that large overnight returns lead to a suppression of the price of gold during
the day), it is not sufficient to visually analyse the relationship between cumulative intraday and
overnight returns or to regress the cumulative overnight returns on the cumulative intraday
returns (e.g. see Douglas, 2010). Many contributions neglect the non-stationarity of the
cumulative returns which renders the regression analysis spurious.15
We account for the non-
stationary (trending) character of the cumulative returns and instead use the overnight and
intraday returns for an econometric analysis.
Table 1 provides the estimation results of a regression of the intraday returns (rday) on the
lagged intraday returns and the previous overnight returns (rovernight). The number of lags is
chosen based on a general-to-specific methodology. The number of observations used is 11,735.
The estimation results show that the previous overnight return exhibits a positive influence on
the (following) intraday return. The positive influence and coefficient means that positive
overnight returns tend to increase the (subsequent) intraday return and that negative overnight
returns tend to decrease the (subsequent) intraday returns. Whilst this result is inconsistent with a
gold price suppression based on the previous overnight return, the lagged overnight returns (t-1
to t-5) exhibit a different sign but strengthen the evidence against suppression, i.e. lagged
positive overnight returns tend to decrease the intraday return and lagged negative overnight
returns tend to increase the intraday return. The coefficients for lag one (t-1) and two (t-2) are
highly significant and thus indicate that the reaction is indeed effective in both directions, i.e.
lagged overnight returns can both increase and decrease subsequent intraday returns depending
on the sign of the overnight return. Since this effect works for both positive and negative
overnight returns, the result is inconsistent with gold price suppression. Clear evidence for gold
price suppression would imply that only lagged positive overnight returns led to a lower intraday
15
See the Granger and Newbold (1974) “Spurious Regressions in Econometrics” (Journal of Econometrics 2, 111-
120).

14
return and that there was no such effect for negative overnight returns. A sub-sample analysis
confirms this conclusion: the negative influence of lagged overnight returns exists for the 1968 –
1980 period, for the 1980 – 1990 period and for the 1990 – 2000 period with the strength of the
influence decreasing over time (sub-samples). Only the 2000 – 2013 period does not exhibit any
significant coefficient estimates.
Table 1: Intraday return
Intraday returns are regressed on lagged intraday returns and
previous and lagged overnight returns. Intraday returns exhibit return
persistence. There is no (statistically significant) influence of
previous overnight returns on intraday returns and a negative
influence of lagged overnight returns on intraday returns.
Coef. Std. Err. t P>|t|
rday
(t-1) .0181592 .0092625 1.96 0.050
(t-2) .0492408 .0092758 5.31 0.000
(t-3) .0266405 .0092838 2.87 0.004
(t-4) -.0007811 .0092744 -0.08 0.933
(t-5) -.0014001 .0092529 -0.15 0.880
rovernight
t .0090248 .005719 1.58 0.115
(t-1) -.0443854 .0057219 -7.76 0.000
(t-2) -.0163918 .0057359 -2.86 0.004
(t-3) -.0022375 .0057379 -0.39 0.697
(t-4) -.0116329 .005731 -2.03 0.042
(t-5) -.0003809 .0057112 -0.07 0.947
constant -.0001778 .0000605 -2.94 0.003
Table 2 presents the estimation results for overnight returns being the dependent variable. It
demonstrates that overnight returns are strongly dependent on lagged day returns and negatively
influenced by its first lag (t-1) and positively influenced by lags 2 (t-2) to lags 4 (t-4). Table 2
does not provide direct evidence for or against gold price manipulation but provides additional
evidence regarding the differences between intraday and overnight returns.

15
Table 2: Overnight returns
Overnight returns are regressed on lagged day returns and lagged
overnight returns. The estimation results display a strong influence of
lagged day returns and a weaker influence of lagged overnight returns.
Overnight returns exhibit weak persistence.
Coef. Std. Err. t P>|t|
rday
(t-1) .1229673 .0149147 8.24 0.000
(t-2) -.0871580 .0149577 -5.83 0.000
(t-3) .0110125 .0149919 0.73 0.463
(t-4) -.0035087 .0149771 -0.23 0.815
(t-5) -.0349621 .0149389 -2.34 0.019
rovernight
(t-1) -.0359898 .0092343 -3.90 0.000
(t-2) .0144206 .0092619 1.56 0.120
(t-3) .0244787 .0092633 2.64 0.008
(t-4) .0222529 .0092526 2.41 0.016
(t-5) -.0050411 .0092229 -0.55 0.585
constant .0005270 .0000976 5.40 0.000
D. Intraday Analysis and Profit Opportunity
The cumulative return analysis based on the differences between the AM and PM fixings
suggests that there is a profit opportunity.16
We retrieved intra-day bid and ask quotes from
Thompson Reuters Tick Data to examine whether there is indeed a profit opportunity if trading
costs are included.
Figure 6 presents the intra-day bid and ask quotes averaged over the 1996-2013 sample period
and shows that there is no profit opportunity if bid and ask quotes and thus trading costs are
included in the analysis. More specifically, investors can buy at an average PM fixing price of
677.15 US dollars and sell at the following AM fixing price of 676.95 US dollars incurring a
16
Douglas (2010) and Martenson (2012) among others suggest that there is a significant profit opportunity based on
buying at the PM fixing and selling at the following AM fixing. The authors do not explain why such profit
opportunities are not exploited and lead to the eventual termination of any manipulation and suppression.

16
clear loss despite a lower average midpoint PM fixing price and a higher average midpoint AM
fixing price.
Figure 6: Bid and ask quotes (tick data)
Buy at the PM fixing (3.30PM) and sell at the following day’s AM fixing
(10.30AM). Whilst mid-points would indicate a small (daily) profit the use of bid
and ask quotes identifies a loss.
This section demonstrated that there is no statistical evidence for the suppression of the price of
gold. Our analysis replicates the main figures (statistics) used by most authors to support their
manipulation hypothesis and extends the analysis by using a longer sample period, an
econometric analysis and the use of high-frequency tick data to show that there is no profit
opportunity based on PM and AM fixing price differences if trading costs are included.
The finding of no systematic statistical evidence for gold price suppression is not surprising. If
there was indeed a profit opportunity as suggested by the cumulative intraday and overnight
return differences (see Figure 4) it is unlikely that no investor would exploit such an opportunity.
Under the assumption that profit opportunities are always exploited manipulation should neither
be detectable nor should such profit opportunities be created in the first place.
676.5
676.6
676.7
676.8
676.9
677
677.1
677.2
677.3
677.4
677.5
676.5
677
677.5
678
678.5
0:0
0
1:0
5
2:1
0
3:1
5
4:2
0
5:2
5
6:3
0
7:3
5
8:4
0
9:4
5
10
:50
11
:55
13
:00
14
:05
15
:10
16
:15
17
:20
18
:25
19
:30
20
:35
21
:40
22
:45
23
:50
buy at 677.15
sell at 676.95

17
III. Alternative Explanations
An alternative explanation for the suppression of the gold price is based on central bank gold
lending and the gold carry trade. This alternative is generally not considered by most
contributors to this debate, i.e. Brown (2013), Douglas (2010), Martenson (2012) and Williams
(2013) do not mention this alternative. Speck (2003 and 2010) is a notable exception and
considers the lending channel as one of three methods of gold price intervention (direct gold
sales, gold lending and the use of futures). The idea is simple and intuitive. Since gold does not
pay any interest there is an incentive to lend gold. Since gold lending increases the supply of
gold, central bank gold lending has a possible negative price effect. Speck (2010) explains that
central banks lend gold to bullion banks. If these bullion banks lend gold to mining companies or
speculators and use the proceeds to invest in higher yielding bonds or assets, bullion banks
engage in a gold carry trade. The gold carry trade implies that bullion banks have a short position
in gold and thus an interest in a constant or decreasing price of gold. Hence, the gold lending
initiated by central banks changes the incentive structure if bullion banks try to enhance their
returns via the gold carry trade. In this case bullion banks have an interest and incentive to
suppress the price and not primarily the central banks. Hence, lower average PM fixing prices
than AM fixing prices are not exclusive evidence for direct gold sales of central banks but can
also be the result of gold lending and private banks engaging in the gold carry trade. In fact,
since gold reserves are finite gold sales would reduce the reserves and thus reduce a central
banks ability to suppress the price of gold in the future. Due to international agreements that
restrict the sale of gold17
gold lending may be the only alternative and must not be disclosed by
central banks (see IMF, 2004 and Speck, 2010).18
There may also be a conflict of interest. We briefly described that the AM and PM gold fixing is
determined by five banks. If some or all of these banks engage in the gold carry trade they have
not only an incentive to manipulate the price of gold but they may also use the fixing to
manipulate the price directly.
The strong gold price increase between 2003 and 2011 is evidence that the gold price was not
suppressed or that such suppression was not successful. However, the direct manipulation
17
E.g. see World Gold Council website: Government Affairs - Central Bank Gold Agreements. 18
Speck (2010) provides statistics of gold lending for the central banks of Portugal and Switzerland and estimates
the amount of gold lent by the Deutsche Bundesbank.

18
hypothesis does not offer any explanation why central banks ended attempts to suppress the price
of gold. Conversely, the gold carry trade offers such an explanation. It is possible that banks
involved in the carry trade were surprised by an unexpected gold price increase which led them
to buy back gold to close the short positions. This may have led to a short squeeze potentially
explaining parts of the strong price increase between 2003 and 2011.19
IV. Summary and Concluding Remarks
This paper is motivated by claims that the price of gold is suppressed, by the statistical analysis
used to support such claims, by recent central bank statements regarding the role of gold in the
financial and monetary system and by the LIBOR manipulation scandal.
We described the main arguments for gold price manipulation, reviewed the key contributions to
this debate and replicated the statistical analysis employed by the majority of contributors. Since
we use a more comprehensive sample and econometric framework we do not find any direct
evidence for gold price manipulation in historical gold prices. However, we argue that the gold
carry trade provides incentives to manipulate the gold price and point to the lack of transparency
regarding the London gold fixing and a conflict of interest if banks are both involved in the gold
carry trade and the gold price fixing. Whilst there are strong economic arguments for central
bank gold price manipulation it is not clear why central banks should have adopted manipulation
strategies in the 1980s and 1990s and then ended such strategies rather abruptly in the 2000s. In
contrast, the gold carry trade and a potential short squeeze in the early 2000s offers an
explanation for the significant price change between 2003 and 2011.
Despite the fact that we can dismiss statistical evidence for gold price manipulation in historical
gold prices several questions remain unanswered. First, why did the price of gold follow a rather
narrow price path in the 1980s and 1990s? Second, why is there a significant lack of
transparency regarding central bank gold leasing and London gold price fixings?
These questions may be the basis for future research.
19
Speck (2010) mentions such a short squeeze on page 201. He also offers an alternative explanation, i.e. that the
Fed wanted to end gold lending and the gold carry trade and urged banks to reverse their trades.

19
References
Aggarwal, R. and B.M. Lucey (2007), “Psychological barriers in gold prices?”, Review of
Financial Economics, 16 (2), 217-230.
Baur, D.G. and T.K. McDermott (2012), “Safe Haven Assets and Investor Behaviour under
Uncertainty”, IIIS Discussion Paper No. 392 (Trinity College Dublin)
Brown, V. (2013), “How London’s Gold and Silver Prices are ‘Fixed’”, Reuters (UK),
14/03/2013
Douglas, A. (2010), “Gold Market is not ‘Fixed’, it’s Rigged”, 13/08/2010,
marketforceanalysis.com
Fed (1993), FOMC meeting 5/18/1993
http://www.federalreserve.gov/monetarypolicy/files/FOMC19930518meeting.pdf
IMF (2004), “Background Paper – The Treatment of Non-Monetary Gold in the Macro
Economic Accounts”, BOPTEG Issues # 27A, IMF Committee on Balance of Payments
Statistics, Paper prepared by Philip Turnbull
Leeb, S. (2013), “Gold Will Get The Last Laugh On Central Banks”, Forbes.com, 17/4/2013
Martenson, C. (2012), “Gold is Manipulated (But That’s Okay)”, 28/3/2012,
www.peakprosperity.com
O’Callaghan, G. (1991), “The Structure and Operation of the World Gold Market”, IMF
Working Paper 91/ 120
Speck, D. (2003), “Die Goldpreismanipulation”, Smart Investor 9/ 2003

20
Speck, D. (2010), “Geheime Goldpolitik” [“Secret Gold Policy”], Finanzbuchverlag Munich, 2nd
edition
Tett, G. (2011), “Is there a shadowy plot behind gold?”, Financial Times, October 21, 2011
Wall Street Journal (2013), “Bernanke: Nobody really understands gold prices”, July 18, 2013
Williams, G. (2013), “Default feared – Gold & Silver Paper Claims Hit All-Time Highs”, King
World News Blog 11/8/2013
21
APPENDIX
Figure 7: US gold reserves and Price of Gold
260
260.5
261
261.5
262
262.5
263
263.5
264
264.5
265
0
200
400
600
800
1000
1200
1400
1600
1800
2000 A
pr-
68
Jul-
70
Oct
-72
Jan
-75
Ap
r-7
7
Jul-
79
Oct
-81
Jan
-84
Ap
r-8
6
Jul-
88
Oct
-90
Jan
-93
Ap
r-9
5
Jul-
97
Oct
-99
Jan
-02
Ap
r-0
4
Jul-
06
Oct
-08
Jan
-11