is the relationship between the built environment and physical activity moderated by perceptions of...
TRANSCRIPT
RESEARCH Open Access
Is the relationship between the built environmentand physical activity moderated by perceptionsof crime and safety?Nicole L Bracy1, Rachel A Millstein2, Jordan A Carlson3, Terry L Conway3, James F Sallis3*, Brian E Saelens4,Jacqueline Kerr3, Kelli L Cain3, Lawrence D Frank5 and Abby C King6
Abstract
Background: Direct relationships between safety concerns and physical activity have been inconsistently patternedin the literature. To tease out these relationships, crime, pedestrian, and traffic safety were examined as moderatorsof built environment associations with physical activity.
Methods: Exploratory analyses used two cross-sectional studies of 2068 adults ages 20–65 and 718 seniorsages 66+ with similar designs and measures. The studies were conducted in the Baltimore, Maryland-Washington, DCand Seattle-King County, Washington regions during 2001–2005 (adults) and 2005–2008 (seniors). Participants wererecruited from areas selected to sample high- and low- income and walkability. Independent variables perceivedcrime, traffic, and pedestrian safety were measured using scales from validated instruments. A GIS-based walkabilityindex was calculated for a street-network buffer around each participant’s home address. Outcomes were total physicalactivity measured using accelerometers and transportation and leisure walking measured with validated self-reports(IPAQ-long). Mixed effects regression models were conducted separately for each sample.
Results: Of 36 interactions evaluated across both studies, only 5 were significant (p < .05). Significant interactions didnot consistently support a pattern of highest physical activity when safety was rated high and environments werefavorable. There was not consistent evidence that safety concerns reduced the beneficial effects of favorableenvironments on physical activity. Only pedestrian safety showed evidence of a consistent main effect with physicalactivity outcomes, possibly because pedestrian safety items (e.g., crosswalks, sidewalks) were not as subjective as thoseon the crime and traffic safety scales.
Conclusions: Clear relationships between crime, pedestrian, and traffic safety with physical activity levels remain elusive.The development of more precise safety variables and the use of neighborhood-specific physical activity outcomes mayhelp to elucidate these relationships.
Keywords: Ecological models, Older adults, Parks, Social environment, Walkability, Traffic, Transportation
BackgroundPhysical activity is important for the prevention ofchronic diseases and promotion of health, yet mostAmericans do not meet national guidelines [1]. A compre-hensive understanding of the correlates of physical activitycan inform the development of effective interventions.Prior research documented a variety of factors related to
physical activity in both younger adults and older adults,including built environment features such as neighbor-hood walkability and proximity of parks and recreation fa-cilities [2-4], and neighborhood social environment factorssuch as aesthetics and incivilities [5-7]. Given that barriersto physical activity exist on multiple levels – individual,social, and environmental – employing an ecologicalmodel to guide research on these multiple levels of influ-ence is useful. An important principle of ecological modelsis that interactions can occur across levels, such as with
* Correspondence: [email protected] of Family and Preventive Medicine, University of California, SanDiego, 3900 Fifth Avenue, Suite 310, San Diego, CA 92103, USAFull list of author information is available at the end of the article
© 2014 Bracy et al.; licensee BioMed Central Ltd. This is an Open Access article distributed under the terms of the CreativeCommons Attribution License (http://creativecommons.org/licenses/by/2.0), which permits unrestricted use, distribution, andreproduction in any medium, provided the original work is properly credited.
Bracy et al. International Journal of Behavioral Nutrition and Physical Activity 2014, 11:24http://www.ijbnpa.org/content/11/1/24
built environment and social environment factors, e.g.,crime [8].Crime, traffic, and pedestrian-related safety are neigh-
borhood environment variables that may affect people’swillingness to be physically active outdoors in theirneighborhoods [9-11]. Crime and traffic safety are socialenvironment variables, but pedestrian safety, as mea-sured here, mainly deals with perceptions of pedestrianinfrastructure in the built environment, including streetcrossing aids. However, the evidence demonstrating therelations between these constructs and physical activityhas been inconsistent [5]. In a review of 18 studiesexamining environmental correlates of walking, trafficand pedestrian-related safety were positively associatedwith walking for exercise, recreation and transportation,but not associated with total walking in adults [7]. Therelation between crime-related safety and physical activ-ity is even less clear. Most studies of adults, with someexceptions, have not found significant associations be-tween crime-related safety and physical activity [12].Studies assessing perceived crime safety and physical
activity specifically in older adults have also producedmixed results [13]. However, several found inverse asso-ciations between perceptions of danger and less physicalactivity among older adults [14-16]. It is reasonable toexpect that older adults’ outdoor physical activity ismore sensitive to their perceptions of safety, as they aregenerally more physically vulnerable, unable to movequickly out of the path of an oncoming car or defendthemselves against a mugger on the street, for example.Therefore, it is useful to examine older adults as a distinctgroup (from their younger counterparts) in assessing howsafety perceptions interact with built environment factorsto explain physical activity.The mixed results found in the literature suggest that
the relations of crime, traffic, and pedestrian safety withphysical activity may be more complex than throughdirect associations. It is possible, for example, that per-ceived crime safety and concern for pedestrian and trafficsafety may have interactive effects with built environmentconstructs rather than main effects on physical activity.The present study tested hypotheses based on an eco-
logical model, that the association of the built environ-ment and physical activity might be moderated byperceptions of neighborhood crime, traffic, and pedes-trian safety. Based in part on the literature [4,7], walk-ability was expected to interact with crime, traffic andpedestrian safety variables in explaining walking fortransportation and total physical activity. The number ofproximal parks and recreation facilities was expected tointeract with the crime, traffic and pedestrian safety vari-ables in explaining walking for leisure and total physicalactivity. If, for example, participants feel safe walking intheir neighborhoods and have one or more parks or
recreation facilities nearby, they may be more likely towalk, particularly for leisure. Generally, built environ-ment attributes were expected to have stronger associa-tions with physical activity when perceived safety washigh as opposed to when perceived safety was low.Walking for transportation was expected to be less-relatedto safety variables for some groups, such as those with noor limited access to a private vehicle, which would be morecommon among low-income subgroups. Thus, we antici-pated lower associations of perceived safety with walkingfor transportation than with walking for leisure.Separate samples of younger and older adults made pos-
sible a richer test of hypotheses and an informal examin-ation of whether safety perceptions appear to moderate thebuilt environment-physical activity relationship differentlyfor these groups. Both samples were recruited from thesame two distinct regions of the US, using a systematicsampling approach designed to produce a sample withwide variability in neighborhood built and socioeconomicenvironments. The physical vulnerability of older adultsled to the expectation that moderating effects of safetywould be stronger for older adults than younger adults.Sample-specific, instead of combined, analyses were useddue to some differences in methods across samples.
MethodsDesignPresent analyses used data from separate studies ofyounger adults and older adults that were similar intheir design and methods. Both studies were approvedby the Institutional Review Board at San Diego StateUniversity, and informed written consent was obtainedfrom all participants.
NQLSThe Neighborhood Quality of Life Study (NQLS) was anobservational epidemiologic study designed to examinerelations among built environment and income variables,physical activity, and other health outcomes amongadults aged 20–65. NQLS was conducted in the Balti-more, Maryland-Washington, DC and Seattle-KingCounty, Washington metropolitan areas during 2001–2005. Neighborhoods were defined as clusters of contigu-ous census block groups that met eligibility criteria formedian household income and walkability. Sixteen neigh-borhoods were included from each metro area, evenly di-vided by walkability (high/low) and income (high/low).Details of neighborhood selection, walkability index calcu-lations, and results have been previously reported [17,18].
SNQLSThe Senior Neighborhood Quality of Life Study (SNQLS)was based on a similar stratified design and was con-ducted in the same regions during 2005–2008. Important
Bracy et al. International Journal of Behavioral Nutrition and Physical Activity 2014, 11:24 Page 2 of 13http://www.ijbnpa.org/content/11/1/24
differences from the NQLS study were that the SNQLSsample was aged 66 and older, and participants were re-cruited from individual census block groups (N= 216) thatmet criteria for high and low walkability and high and lowincome, instead of contiguous clusters of block groups.SNQLS study design details and initial results are detailedelsewhere [19].
Participants and proceduresNQLSParticipants were 2199 adults recruited from householdsin the identified neighborhoods, using marketing com-pany mailing lists, and contacted by phone and mail.Eligibility criteria included: being 20–65 years old, resid-ing in a private home (not a group facility), proficiencyin speaking and reading English, and the ability to walkindependently. Participants signed a consent form andthen were mailed an accelerometer. Accelerometers wereworn for one week, and participants completed the sur-vey at the end of that week. Surveys could be completedby mail, online, or telephone interview. Participants re-ceived $20 for completing the survey and returning theaccelerometer [18].
SNQLSParticipants were 718 adults age 66 or greater who livedindependently in the community (not in a group facility).Participants were identified and recruited using similarmethods as NQLS. Eligibility criteria for SNQLS weresimilar to NQLS, with the addition of: being able to cor-rectly reiterate the study tasks and reporting ability to walkmore than 10 feet (approximately 3 meters) at a time. Thedata collection method was the same as described above.Incentive payments of $25 were given to participants whoreturned accelerometer and survey data [19].
MeasuresMeasures were generally similar across studies, and mostdifferences were due to ensuring that measures were ap-propriate for each of the age groups.
DemographicsFor both studies, age, gender, ethnicity (non-Hispanicwhite vs. other), education (5 levels from ‘less than highschool’ to ‘graduate degree’), number of motor vehicles peradult in household, number of people in household, yearsat current address, and marital status (re-categorized asmarried/living together or other) were collected by survey.
Perceived safety measuresPerceived, rather than objective, measures of safety wereused for two key reasons: first, the lack of availability ofcomparable crime data across jurisdictions and lack ofobjective data on traffic and pedestrian safety variables;
and second, participants’ perceptions of safety werethought to be more likely to be related to outdoor phys-ical activity behaviors. For example, a neighborhood mayhave a high crime rate, as measured by police indicators,but if a resident of that neighborhood does not perceivethreats, the crime rate may have no bearing on physicalactivity. Both studies used modified scales from theNeighborhood Environment Walkability Scale (NEWS)to assess perceptions of traffic, pedestrian, and crimesafety. Reliability and validity of the NEWS have beensupported by multiple studies [20-22]. Traffic safety wasmeasured using 5-item (NQLS α = 0.6) and 3-item(SNQLS α = 0.6) scales asking participants to rate theirperception of the quantity and speed of traffic on theirneighborhood streets. The NQLS survey included 2 add-itional items in this section asking specifically about thequantity and speed of traffic on the street on which therespondent lives (as opposed to SNQLS which asksabout “nearby” streets only). Pedestrian safety was mea-sured using 7-item (NQLS α = 0.7) and 9-item (SNQLSα = 0.5) scales asking participants to rate their percep-tion of how safe it is to walk in their neighborhoods,specific to issues such as safe intersections, sidewalksand crosswalks. The SNQLS survey included additionalitems in this section that were more relevant to seniors’pedestrian safety, such as whether the crosswalks in theirneighborhood were designed for people who do not seewell. Crime safety was measured using 4-item (NQLSα = 0.7) and 5-item scales (SNQLS α = 0.8) addressingperceptions of neighborhood crime. The SNQLS crimesafety scale included one additional item thought to beparticularly relevant to older adults’ safety concerns:teenagers hanging out in the neighborhood. Higherscores on each scale corresponded to better safety.Table 1 shows the details of the safety items completedby each sample.
Objective built environment measuresData from the county-level tax assessor, regional landuse at the parcel level, and street networks were inte-grated into geographic information systems (GIS) to cre-ate a walkability index for each participant based on a1000 meter (NQLS) and 500 meter (SNQLS) street-network buffer around his/her home. The index con-sisted of the sum of z-scores of measures of residentialdensity, retail floor area ratio, intersection density, andland use mix [17]. The different buffer sizes were chosenbecause younger adults were expected to walk furtherthan older adults. For the SNQLS sample, measuresusing both buffer sizes were analyzed, and the 500 meterbuffer produced consistently stronger findings; therefore,only results using the 500 meter buffer measures arepresented in this paper.
Bracy et al. International Journal of Behavioral Nutrition and Physical Activity 2014, 11:24 Page 3 of 13http://www.ijbnpa.org/content/11/1/24
Parcel-level land use data, supplemented with listsfrom local parks agencies, were used to determine thenumber of parks within or intersecting the 1000 (NQLS)or 500 (SNQLS) meter buffer around each participant’shome. Using paper and internet-based phone directories,private recreation facilities (e.g., gyms, dance and martialarts studios) within each region were identified and geo-coded, as described elsewhere [23]. The count of parksand private recreation facilities within 1000 (NQLS) or
500 (SNQLS) meters of each participant’s home was cal-culated separately and dichotomized as 0 or ≥ 1.
Physical activityFor both studies, ActiGraph accelerometers (Manufac-turing Technology Incorporated, models 7164 and71256; Pensacola, FL) were used to objectively measureparticipants’ total physical activity. Accelerometers havebeen validated for adults [24] and older adults [25]. The
Table 1 Safety items used in the present study
Adult sample Older adult sample
Crime safety
1. There is a high crime rate in my neighborhood. 1. There is a high crime rate in my neighborhood.
2. The crime rate in my neighborhood makes it unsafe to goon walks during the day.
2. The crime rate in my neighborhood makes it unsafe to goon walks during the day.
3. The crime rate in my neighborhood makes it unsafe to goon walks at night.
3. The crime rate in my neighborhood makes it unsafe to goon walks at night.
4. My neighborhood is safe enough so that I would let a10-year-old boy walk around my block alone in the daytimea.
4. There are alleys between buildings that make it unsafe towalk in my neighborhooda.
5. There are teenagers hanging out that make it unsafe towalk in my neighborhooda.
Pedestrian safety
1. My neighborhood streets are well lit at night. 1. My neighborhood streets are well lit at night.
2. Walkers and bikers on the streets in my neighborhood canbe easily seen by people in their homes.
2. Walkers and bikers on the streets in my neighborhood canbe easily seen by people in their homes.
3. There are unattended or stray dogs in my neighborhood. 3. Stray or loose dogs can be a problem in my neighborhood.
4. There are crosswalks and pedestrian signals to help walkerscross busy streets in my neighborhood.
4. Pedestrian signals in my neighborhood give me enoughtime to cross the roada.
5. The crosswalks in my neighborhood help walkers feel safecrossing busy streets.
5. The crosswalks in my neighborhood are designed for peoplewho don’t see well because they have things like beeps thattell you when to cross.a
6. When walking in my neighborhood there are a lot ofexhaust fumes (such as from cars, buses).
6. At major intersections in my neighborhood, there are islandsin the middle of the road where pedestrians can safely stopafter crossing half waya.
7. I see and speak to other people when I am walking in myneighborhood.
7. I have to cross many busy streets to get to places like shopsin my neighborhooda.
8. Cars going across sidewalks to get to driveways and parkinglots make it difficult to walk in my neighborhooda.
9. There are curb cuts (ramps) that go from sidewalk level toroad level in my neighborhooda.
Traffic safety
1. There is so much traffic along the street I live on that itmakes it difficult or unpleasant to walk in my neighborhood.
1. There is so much traffic along nearby streets that it makes itdifficult or unpleasant to walk in my neighborhood.
2. There is so much traffic along nearby streets that it makes itdifficult or unpleasant to walk in my neighborhood.
2. The speed of traffic on most nearby streets is usually slow(30 mph or less).
3. Most drivers exceed the posted speed limits while drivingin my neighborhood.
3. Most drivers exceed the posted speed limits while driving inmy neighborhood.
4. The speed of traffic on the street I live on is usually slow(30 mph or less).
5. The speed of traffic on most nearby streets is usually slow(30 mph or less).aDerived for present study.Note: All items were scored on a 4-point scale ranging from strongly disagree to strongly agree; scales were scored so that higher numbers represented greaterperceived safety.
Bracy et al. International Journal of Behavioral Nutrition and Physical Activity 2014, 11:24 Page 4 of 13http://www.ijbnpa.org/content/11/1/24

epoch was set at 60-seconds and participants were re-quired to wear the accelerometer for at least 5 validdays. Eight hours of valid wear time was required for avalid day, and a valid hour contained no more than 30(NQLS) or 45 (SNQLS) consecutive minutes of zerocounts. Data were cleaned and scored using MeterPlusversion 4.0 software from Santech, Inc. (www.meterplus-software.com). Cumulative minutes/week (as opposed tocontinuous bouts) of moderate to vigorous physical ac-tivity (MVPA) was calculated for both samples usingpreviously established cut-points for adults (≥1952 counts/minute) [26].For NQLS, self-reported physical activity was assessed
using the well-validated International Physical ActivityQuestionnaire (IPAQ) survey [27]. Items assessed fre-quency and duration of transportation and leisure walk-ing within the past week, from which average minutes/week of the two domains of walking were calculated.For SNQLS, self-reported physical activity was assessed
using the Community Healthy Activities Model Programfor Seniors (CHAMPS) survey. Six-month stability was ac-ceptable (ICCs = 0.58-0.67), and the measure was able todiscriminate between inactive, somewhat active, and activepersons [28]. An average minutes/week variable was com-puted for the walking for transportation single item: “In atypical week during the past 4 weeks did you walk to doerrands (such as to/from a store or to take children toschool)?” and for the walking for leisure single item: “In atypical week during the past 4 weeks did you walk leisurelyfor exercise or pleasure?” Those reporting any walkingindicated categories of minutes/week.
AnalysisEighteen mixed effects regression models were con-ducted for NQLS and SNQLS samples separately usingSPSS version 17.0 with census block group entered as arandom effect variable to account for clustering, andaccelerometer-derived total MVPA, walking for trans-portation, and walking for leisure entered as dependentvariables. The intraclass correlation coefficient (ICC)assessing proportion of variance between block groupswas examined for each outcome variable with no othervariables in the model. Models were created using con-ceptually matched variables based on ecological models[29,30] and previous research. For example, walkabilitywas not expected to be related to walking for leisure, andparks and recreation facilities were not expected to be re-lated to walking for transportation. Separate models werefitted to test each interaction term (18 models in eachsample) to maximize sensitivity for detecting interactioneffects and reduce chance for type 2 error. Continuousindependent variables were grand mean centered, and di-chotomous variables were centered on 0. The two NQLSIPAQ walking outcomes (transportation and leisure)
were skewed (skewness > 2.0), so the natural log of thosevariables was used (after adding a constant of 1 to allcases to remove the problem of a value of 0) in the re-gression models. Unstandardized coefficients (B) with95% confidence intervals (CI) were reported to representchange in (log of ) minutes/week of physical activityfor every 1 unit change in continuous predictors orpresence/absence of parks and recreation facilities (i.e.,dichotomous predictors). The eight demographic vari-ables mentioned in the measures section were controlledfor in each model. Pseudo R2 for neighborhood-levelvariance (i.e., neighborhood-level variance explained bythe built environment and safety variables and theirinteraction) was calculated for models with significant in-teractions by taking the (intercept from null model -intercept from full model) / intercept from null model,where the null model included all covariates but excludedthe main independent variables of interest. Significantinteractions (p < .05) were interpreted by calculating theeffect of the objective environment variable at −1 SD (i.e.,“low”) and +1 SD (i.e., “high”) for continuous variables,and at 0 and 1 for the parks and recreation facilitiesvariables, and for each level of the safety variable (at −1and +1 SD). The log outcomes were back-transformed forreporting central tendencies and interpreting interactioneffects.
ResultsParticipant demographic characteristics for each studyare presented in Table 2 and descriptive statistics ofstudy variables in Table 3. Final sample size ranged from1995 to 2068 for NQLS and 687 to 718 for SNQLS dueto missing data. NQLS and SNQLS participants indi-cated similarly low levels of concern about crime safety,with mean scores of 3.3 and 3.4 (range of 1–4), respect-ively, on the 4- and 5-item scales. Table 4 presents
Table 2 Participant demographic characteristics (NQLSn = 2068, SNQLS n = 718)
NQLS SNQLS
Women 47.6% 53.1%
Non-Hispanic white 73.9% 70.7%
With college degree (or higher) 64.5% 48.8%
Married or living with partner 61.7% 56.8%
Residing in the Baltimore region 40.6% 49.3%
Number of vehicles in household Mode =1.0 Mode =1.0
Mean (SD) Mean (SD)
Number of vehicles per adult in household 1.04 (0.5) 0.9 (0.5)
Age in years 45.0 (10.9) 74.4 (6.3)
Number of people in household 2.6 (1.4) 1.8 (0.8)
Years at current address 9.6 (9.0) 24.7 (12.5)
SD: Standard Deviation.
Bracy et al. International Journal of Behavioral Nutrition and Physical Activity 2014, 11:24 Page 5 of 13http://www.ijbnpa.org/content/11/1/24
correlations between built environment and safety vari-ables. Tables 5 and 6 show the relation of the environ-mental and safety variables to minutes/week of physicalactivity.
NQLS modelsTotal MVPANQLS participants engaged in an average of 233.0 mi-nutes/week of total MVPA, as assessed by accelerometer.As shown in Table 5, walkability (see Models 1–3;Bs = 7.81 to 9.99; p-values < .001) and number of recre-ation facilities (see Models 7–9; Bs = 28.10 to 35.66;p-values < .05) were consistently associated with totalMVPA minutes/week (note that main effects for environ-mental variables in relation to all three outcomes have
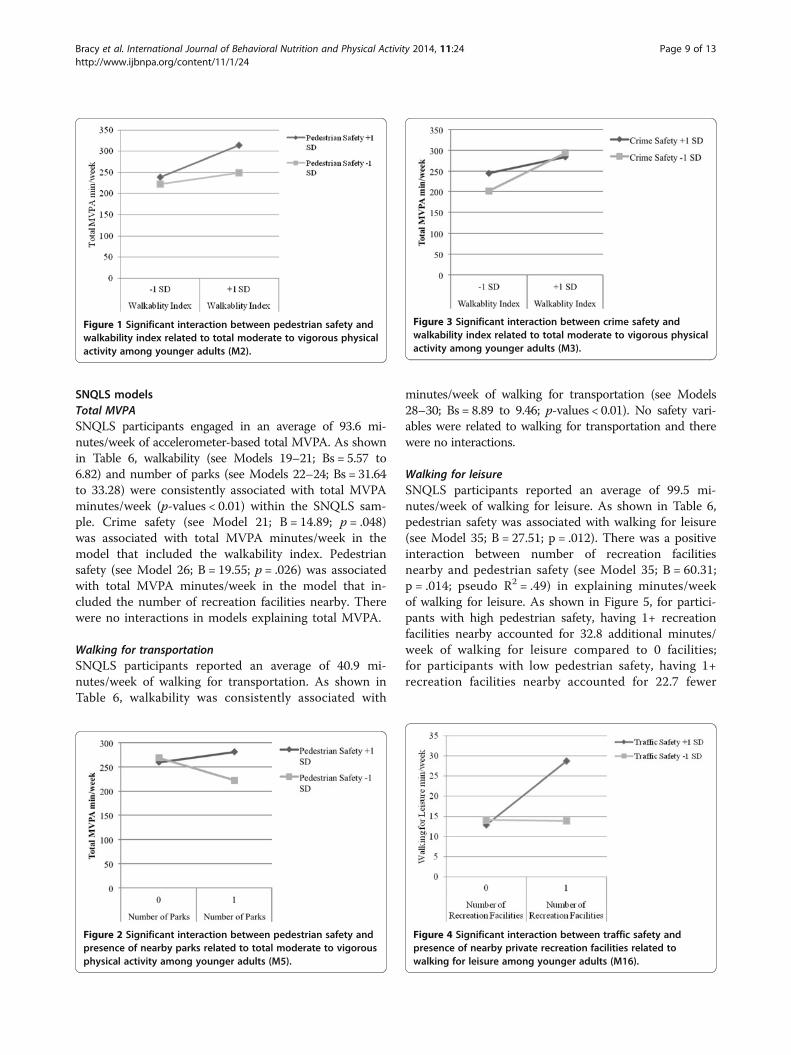
been reported previously for the NQLS sample) [31].Pedestrian safety was associated with total MVPAminutes/week in the model that included the walkabil-ity index (see Model 2; B = 40.26; p < .001) and themodel that included number of recreation facilitiesnearby (see Model 8; B = 36.90; p = .002). Traffic safetywas associated with total minutes of MVPA/week in themodel that included the walkability index (see Model 1;B = 17.15; p = .049). There were positive interactions be-tween walkability and pedestrian safety (see Model 2;B = 7.48; p = .027; pseudo R2 = .634) and number of parksnearby and pedestrian safety (see Model 5; B = 76.32;p = .012; pseudo R2 = .103), and a negative interaction be-tween walkability and crime safety (see Model 3; B = −6.51;p = .028; pseudo R2 = .700) in explaining total MVPA. Asshown in Figure 1, for participants with high pedestriansafety, having higher neighborhood walkability accountedfor 75.1 additional minutes/week of total MVPA. For par-ticipants with low pedestrian safety, having higher neigh-borhood walkability accounted for 26.4 more minutes/week of total MVPA. As shown in Figure 2, for participantswith high pedestrian safety, having 1+ vs. 0 parks nearbyaccounted for 22.2 additional minutes/week of totalMVPA. For participants with low pedestrian safety,having 1+ vs. 0 parks nearby accounted for 46.2 fewerminutes/week of total MVPA. As shown in Figure 3, forparticipants with high crime safety, having higher walk-ability accounted for 38.8 additional minutes/week oftotal MVPA; for participants with low crime safety, havinghigher walkability accounted for 91.2 additional minutes/week of total MVPA.
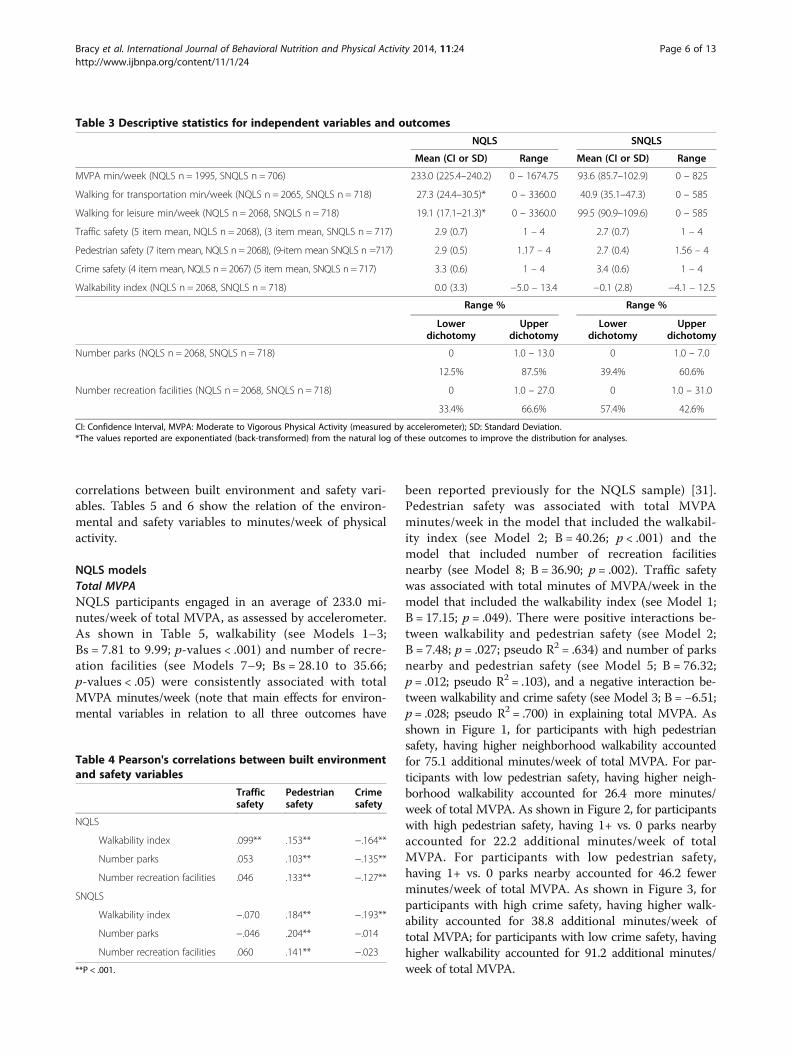
Table 3 Descriptive statistics for independent variables and outcomes
NQLS SNQLS
Mean (CI or SD) Range Mean (CI or SD) Range
MVPA min/week (NQLS n = 1995, SNQLS n = 706) 233.0 (225.4–240.2) 0 – 1674.75 93.6 (85.7–102.9) 0 – 825
Walking for transportation min/week (NQLS n = 2065, SNQLS n = 718) 27.3 (24.4–30.5)* 0 – 3360.0 40.9 (35.1–47.3) 0 – 585
Walking for leisure min/week (NQLS n = 2068, SNQLS n = 718) 19.1 (17.1–21.3)* 0 – 3360.0 99.5 (90.9–109.6) 0 – 585
Traffic safety (5 item mean, NQLS n = 2068), (3 item mean, SNQLS n = 717) 2.9 (0.7) 1 – 4 2.7 (0.7) 1 – 4
Pedestrian safety (7 item mean, NQLS n = 2068), (9-item mean SNQLS n =717) 2.9 (0.5) 1.17 – 4 2.7 (0.4) 1.56 – 4
Crime safety (4 item mean, NQLS n = 2067) (5 item mean, SNQLS n = 717) 3.3 (0.6) 1 – 4 3.4 (0.6) 1 – 4
Walkability index (NQLS n = 2068, SNQLS n = 718) 0.0 (3.3) −5.0 – 13.4 −0.1 (2.8) −4.1 – 12.5
Range % Range %
Lowerdichotomy
Upperdichotomy
Lowerdichotomy
Upperdichotomy
Number parks (NQLS n = 2068, SNQLS n = 718) 0 1.0 – 13.0 0 1.0 – 7.0
12.5% 87.5% 39.4% 60.6%
Number recreation facilities (NQLS n = 2068, SNQLS n = 718) 0 1.0 – 27.0 0 1.0 – 31.0
33.4% 66.6% 57.4% 42.6%
CI: Confidence Interval, MVPA: Moderate to Vigorous Physical Activity (measured by accelerometer); SD: Standard Deviation.*The values reported are exponentiated (back-transformed) from the natural log of these outcomes to improve the distribution for analyses.
Table 4 Pearson's correlations between built environmentand safety variables
Trafficsafety
Pedestriansafety
Crimesafety
NQLS
Walkability index .099** .153** −.164**
Number parks .053 .103** −.135**
Number recreation facilities .046 .133** −.127**
SNQLS
Walkability index −.070 .184** −.193**
Number parks −.046 .204** −.014
Number recreation facilities .060 .141** −.023
**P < .001.
Bracy et al. International Journal of Behavioral Nutrition and Physical Activity 2014, 11:24 Page 6 of 13http://www.ijbnpa.org/content/11/1/24
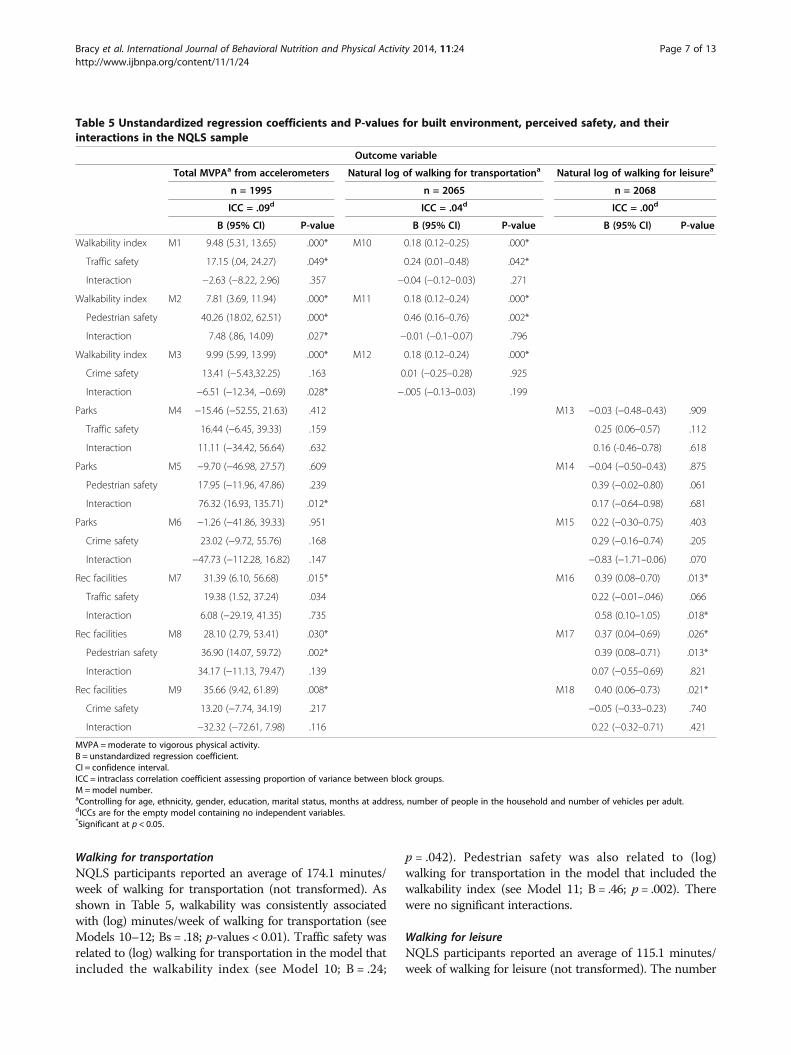
Walking for transportationNQLS participants reported an average of 174.1 minutes/week of walking for transportation (not transformed). Asshown in Table 5, walkability was consistently associatedwith (log) minutes/week of walking for transportation (seeModels 10–12; Bs = .18; p-values < 0.01). Traffic safety wasrelated to (log) walking for transportation in the model thatincluded the walkability index (see Model 10; B = .24;
p = .042). Pedestrian safety was also related to (log)walking for transportation in the model that included thewalkability index (see Model 11; B = .46; p = .002). Therewere no significant interactions.
Walking for leisureNQLS participants reported an average of 115.1 minutes/week of walking for leisure (not transformed). The number
Table 5 Unstandardized regression coefficients and P-values for built environment, perceived safety, and theirinteractions in the NQLS sample
Outcome variable
Total MVPAa from accelerometers Natural log of walking for transportationa Natural log of walking for leisurea
n = 1995 n = 2065 n = 2068
ICC = .09d ICC = .04d ICC = .00d
B (95% CI) P-value B (95% CI) P-value B (95% CI) P-value
Walkability index M1 9.48 (5.31, 13.65) .000* M10 0.18 (0.12–0.25) .000*
Traffic safety 17.15 (.04, 24.27) .049* 0.24 (0.01–0.48) .042*
Interaction −2.63 (−8.22, 2.96) .357 −0.04 (−0.12–0.03) .271
Walkability index M2 7.81 (3.69, 11.94) .000* M11 0.18 (0.12–0.24) .000*
Pedestrian safety 40.26 (18.02, 62.51) .000* 0.46 (0.16–0.76) .002*
Interaction 7.48 (.86, 14.09) .027* −0.01 (−0.1–0.07) .796
Walkability index M3 9.99 (5.99, 13.99) .000* M12 0.18 (0.12–0.24) .000*
Crime safety 13.41 (−5.43,32.25) .163 0.01 (−0.25–0.28) .925
Interaction −6.51 (−12.34, −0.69) .028* −.005 (−0.13–0.03) .199
Parks M4 −15.46 (−52.55, 21.63) .412 M13 −0.03 (−0.48–0.43) .909
Traffic safety 16.44 (−6.45, 39.33) .159 0.25 (0.06–0.57) .112
Interaction 11.11 (−34.42, 56.64) .632 0.16 (-0.46–0.78) .618
Parks M5 −9.70 (−46.98, 27.57) .609 M14 −0.04 (−0.50–0.43) .875
Pedestrian safety 17.95 (−11.96, 47.86) .239 0.39 (−0.02–0.80) .061
Interaction 76.32 (16.93, 135.71) .012* 0.17 (−0.64–0.98) .681
Parks M6 −1.26 (−41.86, 39.33) .951 M15 0.22 (−0.30–0.75) .403
Crime safety 23.02 (−9.72, 55.76) .168 0.29 (−0.16–0.74) .205
Interaction −47.73 (−112.28, 16.82) .147 −0.83 (−1.71–0.06) .070
Rec facilities M7 31.39 (6.10, 56.68) .015* M16 0.39 (0.08–0.70) .013*
Traffic safety 19.38 (1.52, 37.24) .034 0.22 (−0.01–.046) .066
Interaction 6.08 (−29.19, 41.35) .735 0.58 (0.10–1.05) .018*
Rec facilities M8 28.10 (2.79, 53.41) .030* M17 0.37 (0.04–0.69) .026*
Pedestrian safety 36.90 (14.07, 59.72) .002* 0.39 (0.08–0.71) .013*
Interaction 34.17 (−11.13, 79.47) .139 0.07 (−0.55–0.69) .821
Rec facilities M9 35.66 (9.42, 61.89) .008* M18 0.40 (0.06–0.73) .021*
Crime safety 13.20 (−7.74, 34.19) .217 −0.05 (−0.33–0.23) .740
Interaction −32.32 (−72.61, 7.98) .116 0.22 (−0.32–0.71) .421
MVPA =moderate to vigorous physical activity.B = unstandardized regression coefficient.CI = confidence interval.ICC = intraclass correlation coefficient assessing proportion of variance between block groups.M =model number.aControlling for age, ethnicity, gender, education, marital status, months at address, number of people in the household and number of vehicles per adult.dICCs are for the empty model containing no independent variables.*Significant at p < 0.05.
Bracy et al. International Journal of Behavioral Nutrition and Physical Activity 2014, 11:24 Page 7 of 13http://www.ijbnpa.org/content/11/1/24
of recreation facilities was consistently related to (log)walking for leisure (see Models 16–18; Bs = .37-.40;ps = .013-.021). Pedestrian safety was related to (log) walk-ing for leisure in the model that included the number ofrecreation facilities (see Model 17; B = .39; p = .013). Therewas a positive interaction between the number of recre-ation facilities nearby and traffic safety (see Model 16;
B = .58; p = .018; pseudo R2 = .911). As shown in Figure 4,for participants with high traffic safety, having 1+ vs. 0recreation facilities nearby accounted for 15.7 additionalminutes/week of walking for leisure. For participantswith low traffic safety, having 1+ vs. 0 recreation facilitiesnearby was not related to leisure walking minutes, ac-counting for 0.2 fewer minutes/week.
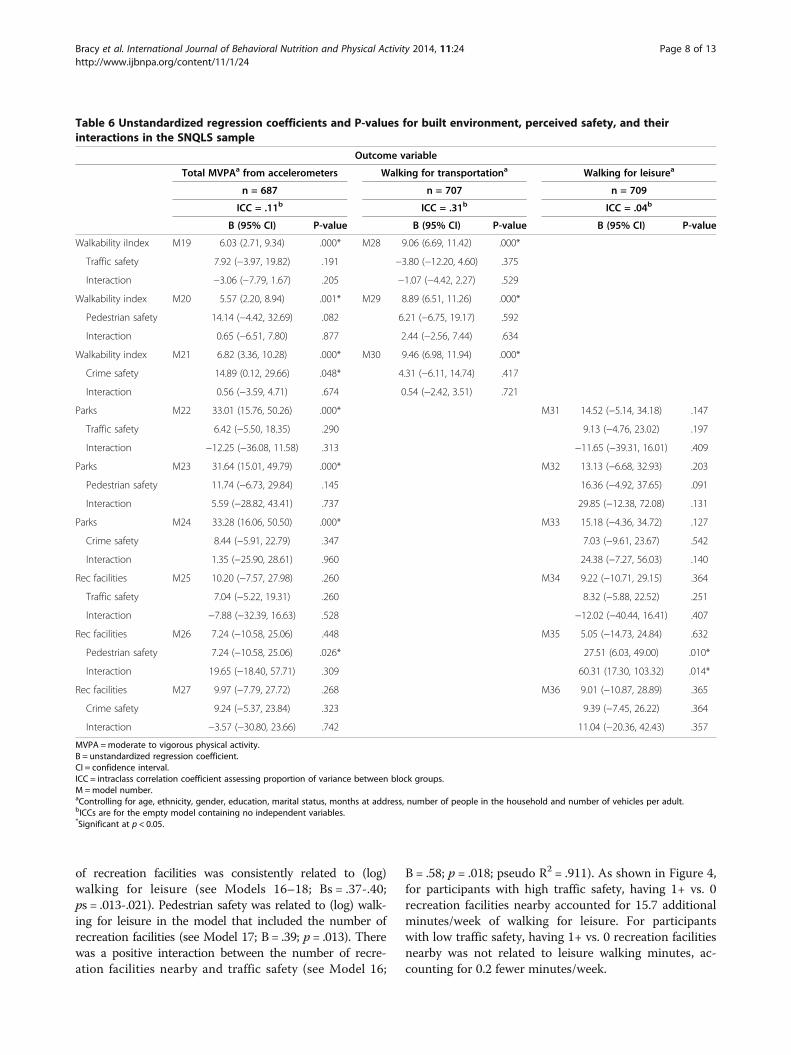
Table 6 Unstandardized regression coefficients and P-values for built environment, perceived safety, and theirinteractions in the SNQLS sample
Outcome variable
Total MVPAa from accelerometers Walking for transportationa Walking for leisurea
n = 687 n = 707 n = 709
ICC = .11b ICC = .31b ICC = .04b
B (95% CI) P-value B (95% CI) P-value B (95% CI) P-value
Walkability iIndex M19 6.03 (2.71, 9.34) .000* M28 9.06 (6.69, 11.42) .000*
Traffic safety 7.92 (−3.97, 19.82) .191 −3.80 (−12.20, 4.60) .375
Interaction −3.06 (−7.79, 1.67) .205 −1.07 (−4.42, 2.27) .529
Walkability index M20 5.57 (2.20, 8.94) .001* M29 8.89 (6.51, 11.26) .000*
Pedestrian safety 14.14 (−4.42, 32.69) .082 6.21 (−6.75, 19.17) .592
Interaction 0.65 (−6.51, 7.80) .877 2.44 (−2.56, 7.44) .634
Walkability index M21 6.82 (3.36, 10.28) .000* M30 9.46 (6.98, 11.94) .000*
Crime safety 14.89 (0.12, 29.66) .048* 4.31 (−6.11, 14.74) .417
Interaction 0.56 (−3.59, 4.71) .674 0.54 (−2.42, 3.51) .721
Parks M22 33.01 (15.76, 50.26) .000* M31 14.52 (−5.14, 34.18) .147
Traffic safety 6.42 (−5.50, 18.35) .290 9.13 (−4.76, 23.02) .197
Interaction −12.25 (−36.08, 11.58) .313 −11.65 (−39.31, 16.01) .409
Parks M23 31.64 (15.01, 49.79) .000* M32 13.13 (−6.68, 32.93) .203
Pedestrian safety 11.74 (−6.73, 29.84) .145 16.36 (−4.92, 37.65) .091
Interaction 5.59 (−28.82, 43.41) .737 29.85 (−12.38, 72.08) .131
Parks M24 33.28 (16.06, 50.50) .000* M33 15.18 (−4.36, 34.72) .127
Crime safety 8.44 (−5.91, 22.79) .347 7.03 (−9.61, 23.67) .542
Interaction 1.35 (−25.90, 28.61) .960 24.38 (−7.27, 56.03) .140
Rec facilities M25 10.20 (−7.57, 27.98) .260 M34 9.22 (−10.71, 29.15) .364
Traffic safety 7.04 (−5.22, 19.31) .260 8.32 (−5.88, 22.52) .251
Interaction −7.88 (−32.39, 16.63) .528 −12.02 (−40.44, 16.41) .407
Rec facilities M26 7.24 (−10.58, 25.06) .448 M35 5.05 (−14.73, 24.84) .632
Pedestrian safety 7.24 (−10.58, 25.06) .026* 27.51 (6.03, 49.00) .010*
Interaction 19.65 (−18.40, 57.71) .309 60.31 (17.30, 103.32) .014*
Rec facilities M27 9.97 (−7.79, 27.72) .268 M36 9.01 (−10.87, 28.89) .365
Crime safety 9.24 (−5.37, 23.84) .323 9.39 (−7.45, 26.22) .364
Interaction −3.57 (−30.80, 23.66) .742 11.04 (−20.36, 42.43) .357
MVPA =moderate to vigorous physical activity.B = unstandardized regression coefficient.CI = confidence interval.ICC = intraclass correlation coefficient assessing proportion of variance between block groups.M =model number.aControlling for age, ethnicity, gender, education, marital status, months at address, number of people in the household and number of vehicles per adult.bICCs are for the empty model containing no independent variables.*Significant at p < 0.05.
Bracy et al. International Journal of Behavioral Nutrition and Physical Activity 2014, 11:24 Page 8 of 13http://www.ijbnpa.org/content/11/1/24
SNQLS modelsTotal MVPASNQLS participants engaged in an average of 93.6 mi-nutes/week of accelerometer-based total MVPA. As shownin Table 6, walkability (see Models 19–21; Bs = 5.57 to6.82) and number of parks (see Models 22–24; Bs = 31.64to 33.28) were consistently associated with total MVPAminutes/week (p-values < 0.01) within the SNQLS sam-ple. Crime safety (see Model 21; B = 14.89; p = .048)was associated with total MVPA minutes/week in themodel that included the walkability index. Pedestriansafety (see Model 26; B = 19.55; p = .026) was associatedwith total MVPA minutes/week in the model that in-cluded the number of recreation facilities nearby. Therewere no interactions in models explaining total MVPA.
Walking for transportationSNQLS participants reported an average of 40.9 mi-nutes/week of walking for transportation. As shown inTable 6, walkability was consistently associated with
minutes/week of walking for transportation (see Models28–30; Bs = 8.89 to 9.46; p-values < 0.01). No safety vari-ables were related to walking for transportation and therewere no interactions.
Walking for leisureSNQLS participants reported an average of 99.5 mi-nutes/week of walking for leisure. As shown in Table 6,pedestrian safety was associated with walking for leisure(see Model 35; B = 27.51; p = .012). There was a positiveinteraction between number of recreation facilitiesnearby and pedestrian safety (see Model 35; B = 60.31;p = .014; pseudo R2 = .49) in explaining minutes/weekof walking for leisure. As shown in Figure 5, for partici-pants with high pedestrian safety, having 1+ recreationfacilities nearby accounted for 32.8 additional minutes/week of walking for leisure compared to 0 facilities;for participants with low pedestrian safety, having 1+recreation facilities nearby accounted for 22.7 fewer
Figure 1 Significant interaction between pedestrian safety andwalkability index related to total moderate to vigorous physicalactivity among younger adults (M2).
Figure 2 Significant interaction between pedestrian safety andpresence of nearby parks related to total moderate to vigorousphysical activity among younger adults (M5).
Figure 3 Significant interaction between crime safety andwalkability index related to total moderate to vigorous physicalactivity among younger adults (M3).
Figure 4 Significant interaction between traffic safety andpresence of nearby private recreation facilities related towalking for leisure among younger adults (M16).
Bracy et al. International Journal of Behavioral Nutrition and Physical Activity 2014, 11:24 Page 9 of 13http://www.ijbnpa.org/content/11/1/24

minutes/week of walking for leisure compared to thosewith 0 facilities.
DiscussionThe current study examined interactions between per-ceived safety and built environment variables in explain-ing physical activity in samples of younger adults andolder adults selected from the same regions and fromneighborhoods that varied by walkability and income.The results did not support the expected interactioneffects between neighborhood environment and safetyvariables in either sample, particularly for older adults.There were only 5 significant interactions out of 36models, and only two of the patterns of association con-firmed hypotheses that physical activity would be highestwhen built environments were favorable and perceivedsafety was high. The observed pattern of results is inter-preted as not supporting perceived safety related tocrime, traffic, or pedestrian infrastructure as moderatingthe relation of built environment variables to physical ac-tivity. Thus, the nature of the few significant interactionsis not interpreted.Present findings regarding main effects of perceived
safety variables were inconsistent, which has been thecase in prior studies. Six of 18 models with the NQLSsample of younger adults had significant safety main ef-fects: 4 involved pedestrian safety and 2 involved trafficsafety. Only 3 of 18 models with the SNQLS sample hadsignificant main effects, two involving pedestrian safetyand one involving crime safety. The pedestrian safetyscale was the most frequently significant as a main ef-fect, as it was related to 5 of the 6 outcomes in at leastone model. Across the two age groups, it was related tototal MVPA minutes and walking for leisure in severaldifferent models. This scale assessed built environmentattributes that could protect pedestrians from traffic,such as design of intersections, presence of crosswalks,
and presence and quality of sidewalks. The relativelyconsistent support for pedestrian safety main effectsmay be because the scale assessed perceptions of specificelements in the built environment (e.g., qualities ofstreet crossings), rather than more subjective concernsabout crime or volume of traffic. These positive main ef-fects also suggest that neighborhood pedestrian safetymay be one of the more important factors in people’sleisure walking and overall physical activity. Further, ped-estrian safety factors can be modified, and the presentfindings suggest that improving such features can posi-tively impact physical activity and walking. There wereonly two main effects of traffic safety, so improving mea-sures and testing more complex models may be needed toadvance evidence for this variable. The crime scale thatdealt with concerns about personal safety had no sig-nificant main effect in any of the models. Thus, directassociations between perceived crime safety and physicalactivity were not supported, consistent with most previousliterature [12].The mixed main effects and null interaction effects
suggest that one or more of the following may be true:the current measures of perceived safety (in this case,from the NEWS) lack sensitivity to detect these relation-ships, the current outcomes (accelerometer-measuredMVPA, and self-reported walking for leisure and trans-portation scales from the IPAQ and CHAMPS ) lackspecificity, perceived safety variables are not associatedwith physical activity, or the links between perceivedsafety and physical activity are even more complex thancould be assessed with these interactions.The measures of crime, traffic, and pedestrian safety
used here may not be sufficiently valid or sensitive toperceptions of safety, warranting better measures. Thehigh mean scores and somewhat small standard devia-tions suggest a lack of variability and potential ceiling ef-fect, suggesting it may be necessary to develop improvedmeasures or design studies to purposefully select partici-pants with wide variation in perceived safety to ensurehypotheses can be adequately evaluated. The limitedvariation in safety scores is somewhat surprising becausethe samples were selected to represent diverse socioeco-nomic status, and safety variables were documented to dif-fer significantly by neighborhood income [32]. It may alsobe that the cross-sectional design of the current study is aless sensitive way to uncover these relationships, as op-posed to prospective designs. An even better approachwould be to conduct quasi-experimental evaluations of ef-forts to reduce crime, enhance traffic safety, or improvethe pedestrian environment.There are some clues in the criminology literature that
could lead to improved measurement and models. First,this literature distinguishes between two related con-cepts: fear of crime and an assessment of one’s own
Figure 5 Significant interaction between pedestrian safety andnumber of nearby private recreation facilities related towalking for leisure among older adults (M35).
Bracy et al. International Journal of Behavioral Nutrition and Physical Activity 2014, 11:24 Page 10 of 13http://www.ijbnpa.org/content/11/1/24
personal risk of victimization. Fear of crime refers toemotional reactions where perceived risk of victimizationis a cognitive judgment of risk [33]. Future research mayparse apart these distinctions to assess whether one orboth are related to outdoor physical activity behaviors.Further, having witnessed or been the victim of crime canheighten perception of crime [34], so adding such histor-ical variables as a covariate or third variable in the interac-tions could be informative. Protective strategies to manageperceived crime and traffic safety, such as avoiding“dangerous” places or routes, traveling with a companion,or carrying a cell phone, could also affect associations withphysical activity, so future studies could include such vari-ables in analyses.The physical activity outcomes examined in this study
may lack sufficient specificity to illuminate connectionsto perceived safety. The amount of physical activity thatparticipants reported on the IPAQ (NQLS) or CHAMPS(SNQLS) or that was demonstrated via use of acceler-ometers did not necessarily occur in the participants’neighborhoods. There was a mismatch in locations be-tween the non-specific physical activity measures andneighborhood-specific NEWS safety items. Location-specific physical activity outcomes may help to elucidatethese relationships.Research has pointed to the potential negative effects
of safety perceptions on physical activity, particularly forolder adults who tend to be more fearful and less activeoverall [12,35]. However, both the sample of youngeradults and the sample of older adults in the presentstudy had similarly high perceptions of safety fromcrime and related personal dangers, indicating thatcrime safety may not be as much of a driving factor inolder adults’ low levels of physical activity as has beenproposed [36,37].This was one of the first studies to use an ecological
model to examine built environment by safety interac-tions in explaining physical activity in seniors and youn-ger adults [38]. The present study employed parallelanalyses across two large samples using similar methods,which were also strengths. The weaknesses of thepresent study were that it relied on cross-sectional data,limiting the conclusions that can be drawn, and that theresults have limited generalizability due to sampling bias(high percentages in both samples were white andcollege-educated). Though the age groupings used in thepresent study differentiating the younger sample fromthe older sample are fairly standard, the younger adultsample had a very wide age range (20–65 years), so it ispossible there are age-related differences within theyounger adult sample that were not revealed in presentanalyses. The IPAQ has been shown to be valid for totalMVPA, but validity of component scores, such as walk-ing, has not been demonstrated [27]. The same is true of
the CHAMPS. It is not known from these data where theparticipants’ MVPA, leisure, or transportation walkingactually took place. To the extent the activities occurredoutside of the neighborhood, any impact of the safetyvariables would likely be obscured. The analytic approachof separate models for each interaction was based on adesire to be as sensitive as possible to detecting signifi-cant interactions, but this method raises the likelihood oftype 1 error. Given that the findings were generally null,type 1 error was not a problem.
ConclusionFew main effects of perceived safety factors or their in-teractions with objective built environment factors weresignificant correlates of objectively measured total phys-ical activity or self-reported walking for leisure or trans-portation across samples of younger and older adults.The null results are generally consistent with prior stud-ies [39-41]. The proposed hypotheses about crime, traf-fic, and pedestrian safety warrant future exploration withmore refined methods and interactions with differentvariables. Location-specific physical activity outcomesmay prove to be more informative. Future researchshould draw on insights from criminological research onworry about crime and constrained behaviors, whichsuggests there may be other factors influencing andmoderating these relationships, such as the use of pro-tective strategies, having been a victim of a crime, wit-ness to a crime, or having knowledge of someone beingvictimized [34]. Associations between safety perceptionsand physical activity may vary by sex and socioeconomicstatus, so these interactions should also be examined.We encourage continued exploration of multiple safetydomains, including improved measurement approachesas well as consideration of personal crime- or injury-related histories. Quasi-experimental studies of interven-tions to improve crime, traffic safety, and pedestriansafety infrastructure on physical activity may also beinstructive [37].
AbbreviationsCHAMPS: Community Healthy Activities Model Program for Seniors;IPAQ: International Physical Activity Questionnaire; NEWS: NeighborhoodEnvironment Walkability Scale; NQLS: Neighborhood Quality of Life Study;MVPA: Moderate to Vigorous Physical Activity; SNQLS: Senior NeighborhoodQuality of Life Study.
Competing interestsSallis is stockholder and on the Board of Directors of Santech Inc. The otherauthors have no competing interests to disclose.
Authors’ contributionsNLB conceptualized and drafted the current manuscript, analyzed andinterpreted data. RAM analyzed and interpreted data and drafted sections ofthis manuscript. JAC analyzed and interpreted data and drafted sections ofthis manuscript. JFS was the primary investigator of NQLS and Co-PI ofSNQLS. He contributed to the conceptualization of the study questions,drafted sections of the manuscript, and offered revisions on the entiremanuscript. KLC directed the data collection on both SNQLS and NQLS
Bracy et al. International Journal of Behavioral Nutrition and Physical Activity 2014, 11:24 Page 11 of 13http://www.ijbnpa.org/content/11/1/24
studies, compiled and analyzed the accelerometer data reported here. TLCwas co-investigator on both SNQLS and NQLS studies; she prepared bothdata sets for analysis, helped to design the analysis plan for this manuscript,and offered feedback on drafts of the manuscript. BES was a key investigatoron the NQLS study who contributed substantially to the conception anddesign of the study of younger adults and revised drafts of the currentmanuscript. LDF was a key investigator on both SNQLS and NQLS studieswho led the GIS component of these studies, including analysis andinterpretation of these data; he edited the manuscript. ACK was PI ofSNQLS study and contributed substantially to the conception and designof the study of older adults and revised drafts of the current manuscript.JK was a key investigator on both SNQLS and NQLS studies who contributedsubstantially to the conception and design of both studies and revised draftsof the current manuscript. All authors gave their final approval of the submittedversion.
AcknowledgementsThis study was supported by National Institutes of Health grants HL67350and HL077141.
Author details1Harder + Company Community Research and San Diego State University,School of Public Affairs, 3965 Fifth Avenue, Suite 420, San Diego, CA 92103,USA. 2SDSU/UCSD Joint Doctoral Program in Clinical Psychology, 3900 FifthAvenue, Suite 310, San Diego, CA 92103, USA. 3Department of Family andPreventive Medicine, University of California, San Diego, 3900 Fifth Avenue,Suite 310, San Diego, CA 92103, USA. 4Department of Pediatrics, University ofWashington & Seattle Children’s Research Institute, 2001 Eighth Avenue,Suite 400, Seattle, WA 98121, USA. 5School of Community and RegionalPlanning, University of British Columbia, Vancouver BC, #433-6333 MemorialRoad, Vancouver BC V6T 1Z2, Canada. 6Department of Health Research &Policy and Stanford Prevention Research Center, Department of Medicine,Stanford University School of Medicine, 259 Campus Drive, HRP RedwoodBuilding, T221, Stanford, CA 94305-5405, USA.
Received: 2 March 2013 Accepted: 14 February 2014Published: 24 February 2014
References1. Troiano RP, Berrigan D, Dodd KW, Masse LC, Tilert T, McDowell M: Physical
activity in the United States measured by accelerometer. Med Sci SportsExerc 2008, 40(1):181–188.
2. Berke EM, Koepsell TD, Moudon AV, Hoskins RE, Larson EB: Association ofthe built environment with physical activity and obesity in olderpersons. Am J Public Health 2007, 97:486–492.
3. Mowen A, Orsega-Smith E, Payne L, Ainsworth B, Godbey G: The role ofpark proximity and social support in shaping park visitation, physicalactivity, and perceived health among older adults. J Phys Act Health 2005,4:167–179.
4. Saelens BE, Handy SL: Built environment correlates of walking: a review.Med Sci Sports Exerc 2008, 40:S550–S566.
5. Bauman AE, Bull FC: Environmental correlates of physical activity and walkingin adults and children: A review of the reviews. London, U.K: National Instituteof Health and Clinical Excellence; 2007.
6. King AC, Castro C, Wilcox S, Eyler AA, Sallis JF, Brownson RC: Personal andenvironmental factors associated with physical activity among differentracial-ethnic groups of U.S. middle-aged and older-aged women. J HealthPsychol 2000, 19(4):354–364.
7. Owen N, Humpel N, Leslie E, Bauman AE, Sallis JF: Understandingenvironmental influences on walking: review and research agenda.Am J Prev Med 2004, 27:67–76.
8. Sallis JF, Owen N, Fisher EB: Ecological models of health behavior. InHealth Behavior and Health Education: Theory, Research, and Practice. 4thedition. Edited by Glanz K, Rimer BK, Viswanath K. San Francisco: Jossey-Bass;2008:465–486.
9. Centers for Disease Control and Prevention: Neighborhood safety andprevalence of physical inactivity in selected states, 1996. MMWR MorbMortal Wkly Rep 1999, 48:143–146.
10. Giles-Corti B, Donovan R, Holman CD: Factors influencing the use ofphysical activity facilities: results from qualitative research. Health PromotJ Austr 1996, 6(i):16–21.
11. DiGuiseppi C, Roberts L, Li L, Allen D: Determinants of car travel on dailyjourneys to school: cross sectional survey of primary school children.Br Med J 1998, 316:1426–1428.
12. Foster S, Giles-Corti B: The built environment, neighborhood crime andconstrained physical activity: an exploration of inconsistent findings.Prev Med 2008, 47:241–251.
13. Van Cauwenberg J, De Bourdeaudhuij I, De Meester F, Van Dyck D, Salmon J,Clarys P, Deforche B: Relationship between the physical environment andphysical activity in older adults: a systematic review. Health Place 2011,17:458–469.
14. Li F, Fisher KJ, Brownson RC, Bosworth M: Multilevel modeling of builtenvironment characteristics related to neighbourhood walking activity inolder adults. J Epidemiol Community Health 2005, 59:558–564.
15. Mota J, Lacerda A, Santos MP, Ribeiro JC, Carvalho J: Perceivedneighborhood environments and physical activity in an elderly sample.Percept Mot Skills 2007, 104:438–444.
16. Wilcox S, Bopp M, Oberrecht L, Kammermann S, McElmurray C:Psychosocial and perceived environmental correlates of physical activityin rural and older African-American and White women. J Gerontol PsycholSci 2003, 58:329–337.
17. Frank LD, Sallis JF, Saelens BE, Leary L, Cain K, Conway TL, Hess PM: Thedevelopment of a walkability index: Application to the NeighborhoodQuality of Life Study. Br J Sports Med 2010, 44:924–933.
18. Sallis JF, Saelens BE, Frank LD, Conway TL, Slymen DJ, Cain KL, Chapman JE,Kerr J: Neighborhood built environment and income: Examining multiplehealth outcomes. Soc Sci Med 2009, 68:1285–1293.
19. King AC, Sallis JF, Frank LD, Saelens BE, Cain K, Conway TL, Chapman JE,Ahn DK, Kerr J: Aging in neighborhoods differing in walkability andincome: Associations with physical activity and obesity in older adults.Soc Sci Med 2011, 73(10):1525–1533.
20. Cerin E, Leslie E, Owen N, Bauman A: An Australian version of theNeighborhood Environment Walkability Scale: validity evidence. MeasPhys Educ Exerc Sci 2008, 12:31–51.
21. De Bourdeaudhuij I, Sallis JF, Saelens BE: Environmental correlates ofphysical activity in a sample of Belgian adults. Am J Health Promot 2003,18:83–92.
22. Saelens BE, Sallis JF, Black JB, Chen D: Neighborhood-based differences inphysical activity: an environment scale evaluation. Am J Public Health2003, 93:1552–1558.
23. Abercrombie LC, Sallis JF, Conway TL, Frank LD, Saelens BE, Chapman JE:Income and racial disparities in access to public parks and privaterecreation facilities. Am J Prev Med 2008, 34:9–15.
24. Welk GJ: Use of accelerometry-based activity monitors to assess physicalactivity. In Physical activity assessments for health-related research. Edited byWelk GJ. Champaign, IL: Human Kinetics; 2002:125–142.
25. Buman MP, Hekler EB, Haskell WL, Pruitt L, Conway TL, Cain KL, Sallis JF,Saelens BE, Frank LD, King AC: Objective light-intensity physical activityassociations with rated health in older adults. Am J Epidemiol 2010,172(10):1155–1165.
26. Freedson PS, Melanson E, Sirard J: Calibration of the computer scienceand applications, Inc. accelerometer. Med Sci Sports Exerc 1998,30:777–781.
27. Craig CL, Marshall AL, Sjostrom M, Bauman AE, Booth ML, Ainsworth BE,Pratt M, Ekelund U, Yngve A, Sallis JF, Oja P: International physical activityquestionnaire: 12-country reliability and validity. Med Sci Sports Exerc2003, 35:1381–1395.
28. Stewart AL, Mills KM, King AC, Haskell WL, Gillis D, Ritter PL: CHAMPSphysical activity questionnaire for older adults: outcomes forinterventions. Med Sci Sports Exerc 2001, 33:1126–1141.
29. Giles-Corti B, Timperio A, Bull F, Pikora T: Understanding physical activityenvironmental correlates: increased specificity for ecological models.Exerc Sport Sci Rev 2005, 33(4):175–181.
30. Sallis JF, Cervero RB, Ascher W, Henderson KA, Kraft MK, Kerr J: Anecological approach to creating active living communities. Annu RevPublic Health 2006, 27:297–322.
31. Saelens B, Sallis JF, Frank LD, Cain KL, Conway TL, Chapman JE, Slymen DJ,Kerr J: Neighborhood environment and psychosocial correlates of adults’physical activity. Med Sci Sports Exerc 2012, 44(4):637–646.
32. Sallis JF, Slymen DJ, Conway TL, Frank LD, Saelens BE, Cain K, Chapman J:Income disparities in perceived neighborhood built and socialenvironment attributes. Health Place 2011, 17(6):1274–1283.
Bracy et al. International Journal of Behavioral Nutrition and Physical Activity 2014, 11:24 Page 12 of 13http://www.ijbnpa.org/content/11/1/24
33. Rountree PW, Land KC: Perceived risk versus fear of crime: empiricalevidence of conceptually distinct reactions in survey data. Soc Forces1996, 74(4):1353–1376.
34. Skogan WG: The impact of victimization on fear. Crime Delinq 1987,33(1):135–154.
35. Lindquist JH, Duke J: The elderly victim at risk: explaining the fear-victimization paradox. Criminology 1987, 20:115–126.
36. Braungart M, Braungart R, Hoyer W: Age, sex, and social factors in fear ofcrime. Sociol Focus 1980, 13:55–66.
37. Clemente F, Kleiman MB: Fear of crime among the aged. Br J Criminol1976, 22:49–62.
38. King AC, Toobert D, Ahn D, Resnicow K, Coday M, Riebe D, Garber CE,Hurtz S, Morton J, Sallis JF: Perceived environments as physicalactivity correlates and moderators of intervention in five studies.Am J Health Promot 2006, 21(1):24–35.
39. Ainsworth B, Wilcox S, Thompson W, Richter D, Henderson K: Personal,social, and physical environmental correlates of physical activity inAfrican-American women in South Carolina. Am J Prev Med 2003,25:23–29.
40. Lim K, Taylor L: Factors associated with physical activity among olderpeople—a population-based study. Prev Med 2005, 40:33–40.
41. Young DR, Voorhees CC: Personal, social, and environmental correlates ofphysical activity in urban African-American women. Am J Prev Med 2003,25:38–44.
doi:10.1186/1479-5868-11-24Cite this article as: Bracy et al.: Is the relationship between the builtenvironment and physical activity moderated by perceptions of crimeand safety? International Journal of Behavioral Nutrition and Physical Activity2014 11:24.
Submit your next manuscript to BioMed Centraland take full advantage of:
• Convenient online submission
• Thorough peer review
• No space constraints or color figure charges
• Immediate publication on acceptance
• Inclusion in PubMed, CAS, Scopus and Google Scholar
• Research which is freely available for redistribution
Submit your manuscript at www.biomedcentral.com/submit
Bracy et al. International Journal of Behavioral Nutrition and Physical Activity 2014, 11:24 Page 13 of 13http://www.ijbnpa.org/content/11/1/24