is there a role for statistics in artificial intelligence?
TRANSCRIPT

Advances in Data Analysis and Classificationhttps://doi.org/10.1007/s11634-021-00455-6
REGULAR ART ICLE
Is there a role for statistics in artificial intelligence?
Sarah Friedrich, et al. [full author details at the end of the article]
Received: 13 September 2020 / Revised: 6 July 2021 / Accepted: 7 July 2021© The Author(s) 2021
AbstractThe research on and application of artificial intelligence (AI) has triggered a com-prehensive scientific, economic, social and political discussion. Here we argue thatstatistics, as an interdisciplinary scientific field, plays a substantial role both for thetheoretical and practical understanding of AI and for its future development. Statis-tics might even be considered a core element of AI. With its specialist knowledgeof data evaluation, starting with the precise formulation of the research question andpassing through a study design stage on to analysis and interpretation of the results,statistics is a natural partner for other disciplines in teaching, research and practice.This paper aims at highlighting the relevance of statistical methodology in the contextof AI development. In particular, we discuss contributions of statistics to the field ofartificial intelligence concerning methodological development, planning and designof studies, assessment of data quality and data collection, differentiation of causalityand associations and assessment of uncertainty in results. Moreover, the paper alsodiscusses the equally necessary and meaningful extensions of curricula in schools anduniversities to integrate statistical aspects into AI teaching.
Keywords Statistics · Artificial intelligence · Machine learning · Data science
Mathematics Subject Classification 68T01 · 62-02
1 Introduction
The research on and application of artificial intelligence (AI) has triggered a com-prehensive scientific, economic, social and political discussion. Here we argue thatstatistics, as an interdisciplinary scientific field, plays a substantial role, both for thetheoretical and practical understanding of AI and for its further development.
Contrary to the public perception, AI is not a new phenomenon. AI was alreadymentioned in 1956 at the Dartmouth Conference (Moor 2006; Solomonoff 1985), andthe first data-driven algorithms such as Perceptron (Rosenblatt 1958), backpropagation(Kelley 1960) and the so-called ‘Lernmatrix’, an early neural system (Steinbuch 1961;Hilberg 1995), were developed in the 50s and 60s. The Lighthill Report in 1973 made
123

S. Friedrich et al.
a predominantly negative judgment on AI research in Great Britain and led to thefact that the financial support for AI research was almost completely stopped (theso-called first AI winter). The following phase of predominantly knowledge-baseddevelopment ended in 1987 with the so-called second AI winter. A period of reducedpublic interest and funding in AI began. Nonetheless, in 1988, Judea Pearl publishedhis book ‘Probabilistic Reasoning in Intelligent Systems’, for which he received theTuring Award in 2011 (Pearl 1988). From the beginning of the 1990s, AI has beendeveloping again with major breakthroughs like Support Vector Machines (Cortes andVapnik 1995), Random Forest (Breiman 2001), Bayesian Methods (Zhu et al. 2017),Boosting and Bagging (Freund and Schapire 1997; Breiman 1996), Deep Learning(Schmidhuber 2015) and Extreme Learning Machines (Huang et al. 2006).
Today, AI plays an increasingly important role in many areas of life. Internationalorganizations and national governments have currently positioned themselves or intro-duced new regulatory frameworks for AI. Examples are, among others, the AI strategyof the German government (Bundesregierung 2018), the statement of the Data EthicsCommission (Data Ethics Commission of the Federal Government, Federal Min-istry of the Interior, Building and Community 2019) from 2019 and the report of theNuffield Foundation in the UK (Nuffield Foundation 2019). Similarly, the EuropeanCommission recently published a white paper on AI (European Commission 2020b).Furthermore, regulatory authorities such as the US Food and Drug Administration(FDA) are now also dealing with AI topics and their evaluation. In 2018, for example,the electrocardiogram function of the Apple Watch was the first AI application to beapproved by the FDA (MedTechIntelligence 2018).
There is no unique and comprehensive definition of artificial intelligence. Twoconcepts are commonly used distinguishingweak and strong AI. Searle (1980) definedthem as follows: ‘According to weak AI, the principal value of the computer in thestudy of the mind is that it gives us a very powerful tool. [...] But according to strongAI, the computer is not merely a tool in the study of the mind; rather, the appropriatelyprogrammed computer really is a mind [...]’. Thus, strong AI essentially describesa form of machine intelligence that is equal to human intelligence or even improvesupon it, while weak AI (sometimes also referred to as narrowAI) is limited to tractableapplications in specific domains. Following this definition, wewill focus onweakAI inthis paper in the sense thatwe consider self-learning systems,which are solving specificapplication problems based on methods from mathematics, statistics and computerscience. Consequently, we will focus on the data-driven aspects of AI in this paper.In addition, there are many areas in AI that deal with the processing of and drawinginference from symbolic data (Bock and Diday 2000; Billard and Diday 2006). Incontrast to standard data tables, symbolic data may consist of, e.g. lists, intervals, etc.Thus, special methods for data aggregation and analysis are necessary, which will notbe discussed here.
As for AI, there is neither a single definition nor a uniform assignment of methodsto the field of machine learning (ML) in literature and practice. Often, ML is con-sidered a subset of AI approaches. Based on Simon’s definition from 1983 (Simon1983), learning describes changes of a system in such a way that a similar task can beperformed more effectively or efficiently the next time it is performed. Bishop (2006)describes machine learning as the ‘automatic discovery of regularities in data through
123
Is there a role for statistics in artificial intelligence?
the use of computer algorithms [...]’. Following these concepts, we use AI in a verygeneral sense in this paper whereas ML is used to refer to more specific (statistical)algorithms.
Often the terms AI and ML are mentioned along with Big Data (Gudivada et al.2015) or Data Science, sometimes even used interchangeably. However, neither areAI methods necessary to solve Big Data problems, nor are methods from AI onlyapplicable to Big Data. Data Science, on the other hand, is usually considered asan intersection of computer science, statistics and the respective scientific discipline.Therefore, it is not bound to certain methods or certain data conditions.
This paper aims at contributing to the current discussion aboutAI byhighlighting therelevance of statistical methodology in the context of AI development and application.Statistics can make important contributions to a more successful and secure use of AIsystems, for example with regard to
1. Design (Sect. 3): bias reduction; validation; representativity; selection of variables2. Assessment of data quality (Sect. 4): standards for the quality of diagnostic tests
and audits; dealing with missing values3. Differentiation between causality and associations (Sect. 5): consideration of
covariate effects; answering causal questions; simulation of interventions4. Assessment of certainty or uncertainty in results (Sect. 6): Increasing interpretabil-
ity; mathematical validity proofs or theoretical properties in certain AI contexts;providing stochastic simulation designs; accurate analysis of the quality criteriaof algorithms in the AI context
The remainder of the paper is organized as follows: First, we present an overview ofAI applications and methods in Sect. 2. We continue by expanding on the points 1.–4.in Sects. 3, 4, 5 and 6. We conclude with Sect. 7. There, we also discuss the increasedneed for teaching and further education targeting the increase of AI-related literacy(particularly with respect to the underlying statistical concepts) at all educationallevels.
2 Applications andmethods of AI
Important categories of AI approaches are supervised learning, unsupervised learn-ing and reinforcement learning (Sutton and Barto 2018). In supervised learning, AIsystems learn from training data with known output such as true class labels orresponses. Thus, the aim is to learn some function g : X → Y describing the rela-tionship between an n × p matrix of given features X ⊂ X and the vector of labelsY = (y1, . . . , yn)′ ⊂ Y . Here, n denotes the number of observations, p is the numberof features and X and Y describe the input and output space, respectively. Examplesinclude, among others, support-vector machines, linear and logistic regression or deci-sion trees. In contrast, unsupervised learning extracts patterns from unlabeled data, i.e.without the yi s in the notation above. The most well-known examples include prin-cipal component analysis and clustering. Finally, reinforcement learning originatesfrom robotics and describes the situation where an ‘agent’ (i.e. an autonomous entitywith the ability to act and direct its activity towards achieving goals) learns through
123
S. Friedrich et al.
trial-and-error search. Markov decision processes from probability theory play animportant role here (Sutton and Barto 2018). The input data to an AI algorithm can bemeasured values such as stock market prices, audio signals, climate data or texts, butmay also describe very complex relationships, such as chess games. In the following,we provide some specific examples of AI applications.
2.1 Applications of AI
AI has made remarkable progress in various fields of application. These include auto-mated face recognition, automated speech recognition and translation (Barrachina et al.2009), object tracking in film material, autonomous driving, and the field of strategygames such as chess or go, where computer programs now beat the best human players(Koch 2016; Silver et al. 2018).
Especially for tasks in speech recognition as well as text analysis and translation,Hidden Markov models from statistics are used and further developed with greatsuccess (Juang and Rabiner 1991; Kozielski et al. 2013) because they are capable ofrepresenting grammars. Nowadays, automatic language translation systems can eventranslate languages such as Chinese into languages of the European language family inreal time and are used, for example, by theEU (EuropeanCommission 2020a).Anothergrowing area for AI applications is medicine. Here, AI is used, e.g., to improve theearly detection of diseases, formore accurate diagnoses, or to predict acute events (Burtet al. 2018; Chen et al. 2018), see also Friedrich et al. (2021) for a recent overview.Directions for future developments include personalized medicine aiming at tailoringtreatments to patient subgroups (strata) or even individual patients (Hamburg andCollins 2010; Blasiak et al. 2020; Schork 2019). Furthermore, official statistics usesAI methods for classification as well as for recognition, estimation and/or imputationof relevant characteristic values of statistical units (Beck et al. 2018; Ramosaj andPauly 2019b; Ramosaj et al. 2020; UNECE 2020; Thurow et al. 2021). In economicsand econometrics, AI methods are also applied and further developed, for example,to draw conclusions about macroeconomic developments from large amounts of dataon individual consumer behavior (McCracken and Ng 2016; Ng 2018).
Despite these positive developments that also dominate the public debate, somecaution is advisable. There are a number of reports about the limits of AI, e.g., in thecase of a fatal accident involving an autonomously driving vehicle (Wired.com 2019).Due to the potentially serious consequences of false positive or false negative decisionsin AI applications, careful consideration of these systems is required (AInow 2020).This is especially true in applications such as video surveillance of public spaces. Forinstance, a pilot study conducted by the German Federal Police at the Südkreuz sub-urban railway station in Berlin has shown that automated facial recognition systemsfor identification of violent offenders currently have false acceptance rates of 0.67%(test phase 1) and 0.34% (test phase 2) on average (Bundespolizeipräsidium Potsdam2018). Thismeans that almost one in 150 (or one in 294) passers-by is falsely classifiedas a violent offender. In medicine, wrong decisions can also have drastic and nega-tive effects, such as an unnecessary surgery and chemotherapy in the case of wrongcancer diagnoses. Corresponding test procedures for assessing such diagnostic tests
123

Is there a role for statistics in artificial intelligence?
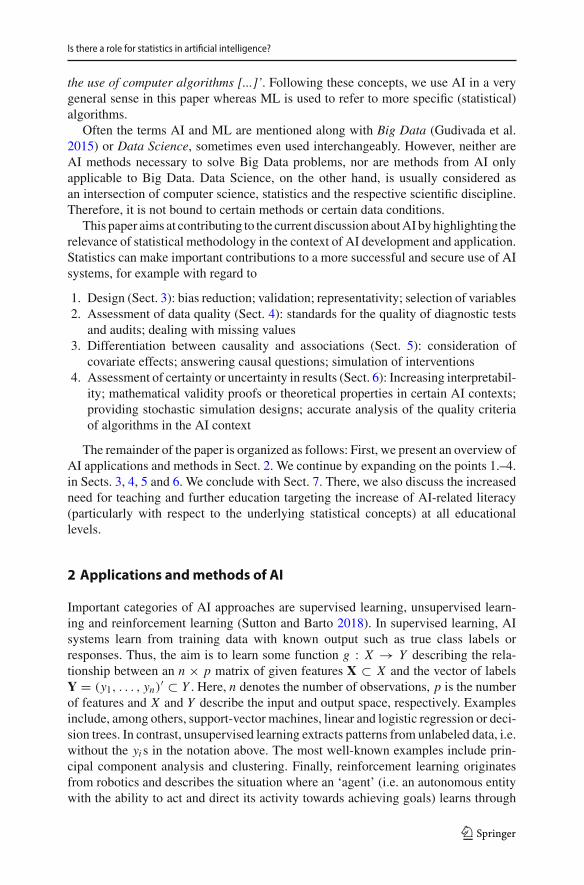
Fig. 1 Flow chart of study planning, design, analysis and interpretation
for medicine are currently being developed by regulators such as the US FDA (FDA2019).
2.2 Methods for AI and the role of statistics
Even thoughmany of the contributions toAI systems originate from computer science,statistics has played an important role throughout. Early examples occurred in thecontext of realizing the relationship between backpropagation and nonlinear leastsquares methods, see, e.g., Warner and Misra (1996). Important ML methods such asrandom forests (Breiman 2001) or support vector machines (Cortes and Vapnik 1995)were developed by statisticians. Others, like radial basis function networks (Chen et al.1991), can also be considered and studied as nonlinear regression models in statistics.Recent developments such as extreme learning machines or broad learning systems(Chen and Liu 2018) have close links to multiple multivariate and ridge regression,i.e. to statistical methods. The theoretical validity of machine learning methods, e.g.,through consistency statements and generalization bounds (Györfi et al. 2002; Vapnik1998), also requires substantial knowledge of mathematical statistics and probabilitytheory.
To capture the role and relevance of statistics, we consider the entire process ofestablishing an AI application. As illustrated in Fig. 1, various steps are necessaryto examine a research question empirically. For more details on these steps see, e.g.,Weihs and Ickstadt (2018). Starting with the precise formulation of the research ques-tion the process then runs through a study design stage (including sample size planningand bias control) to the mathematical formulation (e.g. as an optimization problem)and the numerical analysis. Finally, the results must be interpreted. AI often focuses onthe step of data analysiswhile the other stages receive less attention or are even ignored.This may result in critical issues and possibly misleading interpretations, such as sam-pling bias or the application of inappropriate analysis tools requiring assumptions notmet by the chosen design.
3 Statistical approaches for study design and validation
The design of a study and the data to be considered is the basis for the validity ofthe conclusions. Unfortunately, AI applications often use data that were collected fora different purpose (so-called secondary data, observational studies). The collectionand compilation of secondary data is in general not based on a specific purpose ora research question. Instead, it is collected for other purposes such as accounting orstorage purposes. A typical case is the scientific use of routine data. For example, the
123

S. Friedrich et al.
AI models in a recent study about predicting medical events (such as hospitalization)are based on medical billing data (Lin et al. 2019). Another typical case concernsconvenience samples, that is, samples that are not randomly drawn but instead dependon ‘availability’. Well-known examples are online questionnaires, which only reachthose people who visit the corresponding homepage and take the time to answer thequestions. The concept of knowledge discovery in databases (Fayyad et al. 1996) veryclearly reflects the assumption that data are regarded as a given basis from whichinformation and knowledge can be extracted by AI procedures. This is contrary to thetraditional empirical research process, in which empirically testable research ques-tions are derived from theoretical questions by conceptualizing and operationalizing.Importantly, the resulting measurement variables are then collected for this specificpurpose.
3.1 Validation
Statistics distinguishes between two types of validity (Shadish et al. 2002):
1. Internal validity is the ability to attribute a change in an outcome of a study to theinvestigated causes. In clinical research, e.g., this type of validity is ensured throughrandomization in controlled trials. Internal validity in the context of AI and MLcan also refer to avoiding systematic bias (such as systematically underestimatedrisks).
2. External validity is the ability to transfer the observed effects and relationships tolarger or different populations, environments, situations, etc. In the social sciences(e.g. in the context of opinion research), an attempt to achieve this type of validityis survey sampling, which comprises sampling methods that aim at representativesamples in the sense of Gabler and Häder (2018), see also Kruskal and Mosteller(1979a, b, c, 1980).
These validation aspects are important, but different traditions exist for AI algo-rithms and statistics: While ML has a longstanding benchmarking tradition and oftenuses many datasets for evaluation, statistics tends to rely on theory and simulationsaugmented by one or two convincing data examples. Here, statistics makes use ofprobabilistic models in order to reflect a diversity of real life situations. In addition tomathematical validity proofs and theoretical investigations, detailed simulation studiesare carried out to evaluate the methods’ limits (by exceeding the assumptions made)and finite sample properties in situations where certain properties can only be provenasymptotically. This statistical perspective provides useful insights.
Concepts and guidelines for designing, structuring and reporting simulation studieshave a longstanding tradition inmedical statistics, see for example Burton et al. (2006),Friede et al. (2010), Benda et al. (2010), Morris et al. (2019).
A particular challenge for validation of AI systems are the ever faster developmentcycles which require continuous investigations. This can even be aggravated whenturning to development processes of mobile apps or online learning systems such asrecommender systems in online shoppingportals.Here, the developments are dynamic,de facto never ending processes, which therefore require continuous validation.
123

Is there a role for statistics in artificial intelligence?
Another important factor for the validity and reliability of a study is the sample size(Meng 2018). For high-dimensional models, an additional factor is ‘sparsity’: In manyapplications, the input data for theAI techniques are very high-dimensional, i.e. a largenumber of variables p (also called features) are observed with diverse ranges of pos-sible values. In addition, non-linear relationships with complex interactions are oftenconsidered for prediction. It is well known that high-dimensional data are difficult tohandle if sample sizes are small, i.e. if p � n. However, even with sample sizes in theorder of millions, the problem of the curse of dimensionality arises (Bellman 1957),because data is thin and sparse in a high-dimensional space, i.e. only few variables arerelated to the outcome. Therefore, learning the structure of the high-dimensional spacefrom these thin data typically requires an enormous amount of training data. Throughstatistical models and corresponding mathematical approximations or numerical sim-ulations, statisticians can assess the potentials and limits of an AI application for agiven number of cases or estimate the necessary number of cases in the planning stageof a study. This is not routine work; instead, it requires advanced statistical training,competence, and experience.
Thus, statistics can help in collecting and processing data for subsequent use inAI pipelines. Basic statistical techniques that are relevant for this aspect include, forexample, the modeling of the data generating process, restrictions on data sets (Rubin2008), and factorial design of experiments, which is a controlled variation of factorshighlighting their respective influence. In addition, the various phases in the devel-opment of a diagnostic test are well known in statistics (Pepe 2003), with (external)validation on independent data playing a crucial role. In many AI applications, how-ever, the final evaluation phase on external data is never reached, since the initialalgorithms have been replaced in the meantime. Also, statistical measures of qualitysuch as sensitivity, specificity, ROC curves and calibration are used in the evaluation ofAI methods. And finally, statistics can help in the assessment of uncertainty (Sect. 6).
3.2 Representativity
Thenaive expectation that sufficiently large data automatically leads to representativityis wrong (Meng 2018; Meng and Xie 2014). A prominent example is Google Flu(Lazer et al. 2014), where flu outbreaks were predicted on the basis of search queries:it turned out that the actual prevalence of the flu was overestimated considerably.Another example is Microsoft’s chatbot Tay (Davis 2016; Wolf et al. 2017), whichwas designed to mimic the speech pattern of a 19-year-old American girl and to learnfrom interactions with human users on Twitter: after only a short time, the bot postedoffensive and insulting tweets, forcing Microsoft to shut down the service just 16hours after it started. And yet another example is the recently published Apple HeartStudy (Perez et al. 2019), which examined the ability of Apple Watch to detect atrialfibrillation: there were more than 400,000 participants, but the average age was 41years, which is particularly problematic in view of atrial fibrillation occurring almostexclusively in people over 65 years of age.
123

S. Friedrich et al.
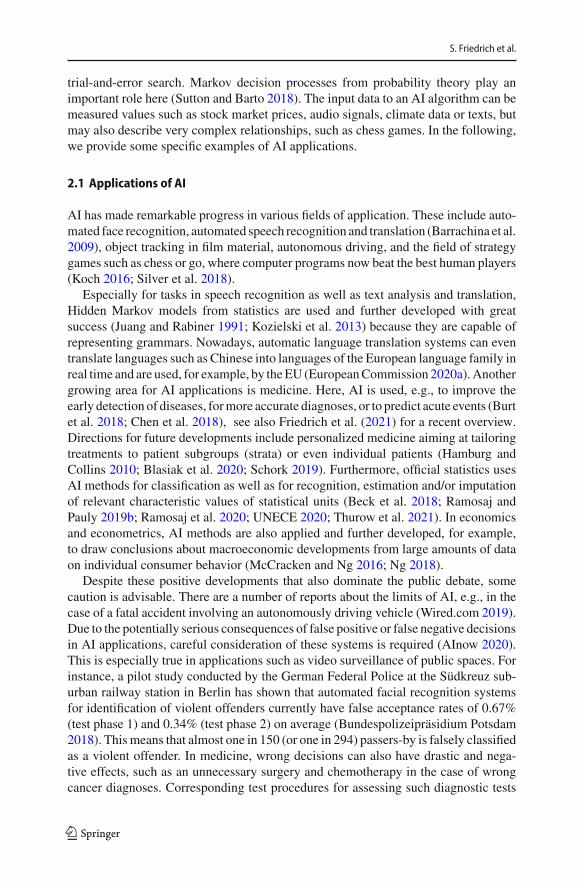
Fig. 2 Simpson’s paradox for continuous data: a positive trend is visible for both groups individually (redand blue), but a negative trend (dashed line) appears when the data are pooled across groups (Wikipedia2020) (color figure online)
3.3 Bias
If careful data collection is not accounted for, spurious correlations and bias can falsifythe conclusions. Many forms of bias exist, such as selection, attribution, performance,and detection bias. While bias in the context of statistics usually refers to the deviationbetween the estimated and the true value of a parameter, there are also other conceptssuch as cognitive biases or, as Ntoutsi et al. (2020) put it ‘the inclination or prejudice ofa decisionmade by anAI systemwhich is for or against one person or group, especiallyin a way considered to be unfair’. A classic example of such falsification is Simpson’sparadox (Simpson 1951), which describes a reversal of group-specific trends whensubgroups are disregarded, see Fig. 2. Further examples are biases inflicted by howthe data are collected, such as length time bias (Porta 2016) or prejudices introducedby AI, see Ntoutsi et al. (2020) for a recent overview of this topic.
Statistics provides methods and principles for minimizing bias. Examples includethe assessment of the risk of bias in medicine (Higgins et al. 2011), stratification,marginal analyses, consideration of interactions,meta-analyses, and techniques specif-ically designed for data collection such as (partial) randomization, (partial) blinding,and methods of so-called optimal designs (Karlin and Studden 1966). Statistics alsoprovides designs that allow for the verification of internal and external validity (Bartelset al. 2018; Braver and Smith 1996; Roe and Just 2009).
3.4 Model stability and reproducibility
Whether there is interest in a model for prediction or in a descriptive model, modelstability, i.e. the robustness of the model towards small changes in the input values,plays an important role. Variable selection methods are used to derive descriptivemodels andmodel complexity has an important influence on the choice of themethods.In a recent review of variable selection procedures, Heinze et al. (2018) emphasize the
123

Is there a role for statistics in artificial intelligence?
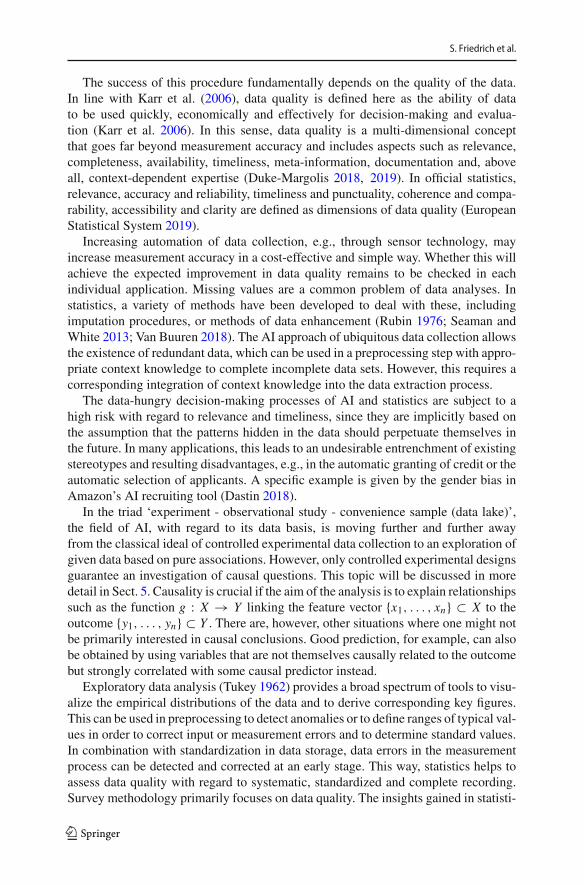
Fig. 3 Data relevancy and quality are equivalent components of a fit-for-purpose real-world data set. Figureaccording to Duke-Margolis (2018)
important role of stability investigations. This issue is alsomentioned in Sauerbrei et al.(2020) as one of the main target parameters for the comparison of variable selectionstrategies. Statistical concepts have been introduced by Meinshausen and Bühlmann(2010) as well as in the context of random forests (Breiman 2001).
Conscientiously sticking to the principles mentioned above and adhering to a previ-ously defined study design also counteracts the so-called replication crisis (Pashler andWagenmakers 2012). In this methodological crisis, which has been ongoing since thebeginning of the 2010s, it has become clear that many studies, especially in medicineand the social sciences, are difficult or impossible to reproduce. Since reproducibilityof experimental results is an essential part of scientific methodology (Staddon 2017),an inability to replicate the studies of others can have grave consequences for manyfields of science. The replication crisis has been particularly widely discussed in psy-chology and medicine, where a number of efforts have been made to re-investigateprevious findings in order to determine their reliability (Begley and Ellis 2012; Makelet al. 2012). A related issue is transparency. While this is an important concept inany empirical analysis, it has especially become an issue discussed in the context ofAI applications, see for example Flake and Fried (2020), Haibe-Kains et al. (2020),Simons et al. (2017).
4 Statistics for the assessment of data quality
‘Data is the new oil of the global economy.’ According to, e.g., the New York Times(New York Times 2018) or the Economist (The Economist 2017), this credo echoesincessantly through start-up conferences and founder forums. This metaphor is notonly popular but false. First of all, data in this context corresponds to crude oil, whichneeds further refining before it can be used. In addition, the resource crude oil islimited. ‘For a start, while oil is a finite resource, data is effectively infinitely durableand reusable’ [BernardMarr in Forbes (2018)]. All the more important is a responsibleapproach to data preprocessing (Fig. 3).
Ensuring data quality is of great importance in all analyses, according to the pop-ular slogan ‘Garbage in, garbage out.’ As already mentioned in the previous section,we mainly use secondary data in the context of AI. In AI, the process of operational-ization is often replaced by the ETL process: ‘Extract, Transform, Load’ (Theodorouet al. 2017). Relevant measurements are to be extracted from the data lake(s), thentransformed and finally loaded into the (automated) analysis procedures. Many AIprocedures are thereby expected to be able to distill relevant influencing variablesfrom high-dimensional data.
123
S. Friedrich et al.
The success of this procedure fundamentally depends on the quality of the data.In line with Karr et al. (2006), data quality is defined here as the ability of datato be used quickly, economically and effectively for decision-making and evalua-tion (Karr et al. 2006). In this sense, data quality is a multi-dimensional conceptthat goes far beyond measurement accuracy and includes aspects such as relevance,completeness, availability, timeliness, meta-information, documentation and, aboveall, context-dependent expertise (Duke-Margolis 2018, 2019). In official statistics,relevance, accuracy and reliability, timeliness and punctuality, coherence and compa-rability, accessibility and clarity are defined as dimensions of data quality (EuropeanStatistical System 2019).
Increasing automation of data collection, e.g., through sensor technology, mayincrease measurement accuracy in a cost-effective and simple way. Whether this willachieve the expected improvement in data quality remains to be checked in eachindividual application. Missing values are a common problem of data analyses. Instatistics, a variety of methods have been developed to deal with these, includingimputation procedures, or methods of data enhancement (Rubin 1976; Seaman andWhite 2013; Van Buuren 2018). The AI approach of ubiquitous data collection allowsthe existence of redundant data, which can be used in a preprocessing step with appro-priate context knowledge to complete incomplete data sets. However, this requires acorresponding integration of context knowledge into the data extraction process.
The data-hungry decision-making processes of AI and statistics are subject to ahigh risk with regard to relevance and timeliness, since they are implicitly based onthe assumption that the patterns hidden in the data should perpetuate themselves inthe future. In many applications, this leads to an undesirable entrenchment of existingstereotypes and resulting disadvantages, e.g., in the automatic granting of credit or theautomatic selection of applicants. A specific example is given by the gender bias inAmazon’s AI recruiting tool (Dastin 2018).
In the triad ‘experiment - observational study - convenience sample (data lake)’,the field of AI, with regard to its data basis, is moving further and further awayfrom the classical ideal of controlled experimental data collection to an exploration ofgiven data based on pure associations. However, only controlled experimental designsguarantee an investigation of causal questions. This topic will be discussed in moredetail in Sect. 5. Causality is crucial if the aim of the analysis is to explain relationshipssuch as the function g : X → Y linking the feature vector {x1, . . . , xn} ⊂ X to theoutcome {y1, . . . , yn} ⊂ Y . There are, however, other situations where one might notbe primarily interested in causal conclusions. Good prediction, for example, can alsobe obtained by using variables that are not themselves causally related to the outcomebut strongly correlated with some causal predictor instead.
Exploratory data analysis (Tukey 1962) provides a broad spectrum of tools to visu-alize the empirical distributions of the data and to derive corresponding key figures.This can be used in preprocessing to detect anomalies or to define ranges of typical val-ues in order to correct input or measurement errors and to determine standard values.In combination with standardization in data storage, data errors in the measurementprocess can be detected and corrected at an early stage. This way, statistics helps toassess data quality with regard to systematic, standardized and complete recording.Survey methodology primarily focuses on data quality. The insights gained in statisti-
123
Is there a role for statistics in artificial intelligence?
cal survey research to ensure data quality with regard to internal and external validityprovide a profound foundation for corresponding developments in the context of AI.Furthermore, various procedures for imputing missing data are known in statistics,which can be used to complete the data depending on the existing context and exper-tise (Rubin 1976; Seaman andWhite 2013; Van Buuren 2018). Statisticians have dealtintensively with the treatment of missing values under different development pro-cesses [non-response, missing not at random, missing at random, missing completelyat random (Rubin 1976; Molenberghs et al. 2014)], selection bias and measurementerror (Keogh et al. 2020; Shaw et al. 2020).
Another point worth mentioning is parameter tuning, i.e. the determination ofso-called hyperparameters, which control the learning behavior of ML algorithms:comprehensive parameter tuning of methods in the AI context often requires verylarge amounts of data. For smaller data volumes it is almost impossible to use suchprocedures. However, certain model-based (statistical) methods can still be used inthis case (Richter et al. 2019).
5 Distinguishing between causality and association
Only a fewdecades ago, the greatest challenge ofAI researchwas to programmachinesto associate a potential cause to a set of observable feature values, e.g. throughBayesiannetworks (Pearl 1988). The rapid development of AI in recent years (both in termsof the theory and methodology of statistical learning processes and the computingpower of computers) has led to a multitude of algorithms and methods that have nowmastered this task. One example are deep learningmethods, which are used in robotics(Levine et al. 2018) and autonomous driving (Teichmann et al. 2018), as well as incomputer-aided detection and diagnostic systems [e.g., for breast cancer diagnosis(Burt et al. 2018)], drug discovery in pharmaceutical research (Chen et al. 2018) andagriculture (Kamilaris and Prenafeta-Boldú 2018). With their often high predictivepower, AI methods can uncover structures and relationships in large volumes of databased on associations. Due to the excellent performance of AI methods in large datasets, they are also frequently used in medicine to analyze register and observationaldata that have not been collected within the strict framework of a randomized studydesign (Sect. 3). However, the discovery of correlations and associations (especiallyin this context) is not equivalent to establishing causal claims.
An important step in the further development of AI is therefore to replace associa-tional argumentation with causal argumentation. Pearl (2010) describes the differenceas follows: ‘An associational concept is any relationship that can be defined in termsof a joint distribution of observed variables, and a causal concept is any relationshipthat cannot be defined from the distribution alone.’
Even the formal definition of a causal effect is not trivial. The fields of statistics andclinical epidemiology, for example, use the Bradford Hill criteria (Hill 1965) and thecounterfactual framework introduced by Rubin (1974). The central problem in obser-vational data are covariate effects, which, in contrast to the randomized controlled trial,are not excluded by design and whose (non-)consideration leads to distorted estimatesof causal effects. In this context, a distinction must be made between confounders,
123

S. Friedrich et al.
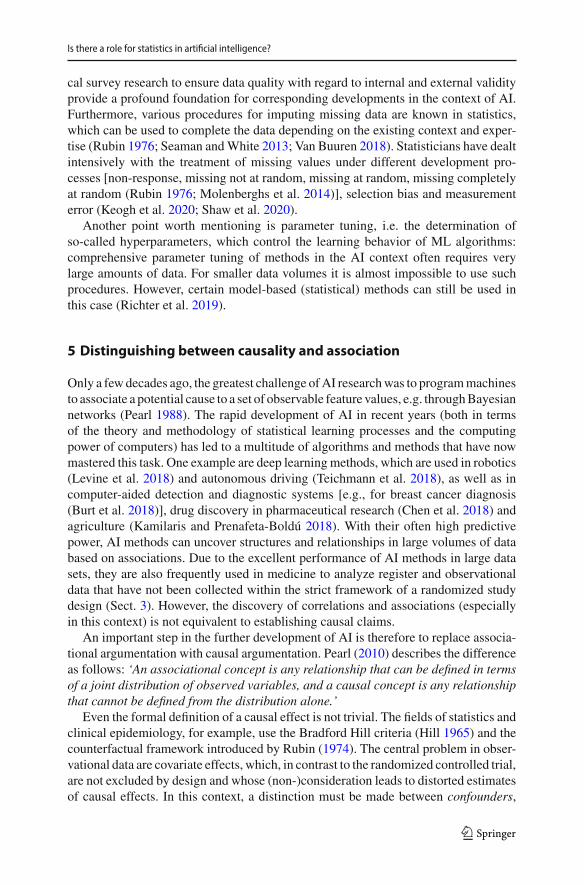
Fig. 4 Covariate effects in observational data, according to Catalogue of bias collaboration (2019)
colliders, and mediators (Pearl 2009). Confounders are unobserved or unconsideredvariables that influence both the exposure and the outcome, see Fig. 4a. This can distortthe effects of exposure if naively correlated. Fisher identified this problem in his book‘The Design of Experiments’ published in 1935. A formal definition was developed inthe field of epidemiology in the 1980s (Greenland and Robins 1986). Later, graphicalcriteria such as the Back-Door Criterion (Greenland et al. 1999; Pearl 1993) weredeveloped to define the term confounding.
In statistics, the problem of confounding is taken into account either in the design(e.g., randomized study, stratification, etc.) or evaluation [propensity score methods(Cochran and Rubin 1973), marginal structural models (Robins et al. 2000), graphicalmodels (Didelez 2007)]. In this context, it is interesting to note that randomized studies(which have a long tradition in the medical field) have recently been increasinglyused in econometric studies (Athey and Imbens 2017; Duflo et al. 2007; Kohavi et al.2020). In the case of observational data, econometrics has made many methodologicalcontributions to the identification of treatment effects, e.g., via the potential outcomeapproach (Rosenbaum 2017, 2002, 2010; Rubin 1974, 2006) as well as the work onpolicy evaluation (Heckman 2001).
In contrast to confounders, colliders and mediators lead to distorted estimates ofcausal effects precisely when they are taken into account during estimation. Whereascolliders represent common consequences of treatment and outcome (Fig. 4b), medi-ators are variables that represent part of the causal mechanism by which the treatmentaffects the outcome (Fig. 4c). Especially in the case of longitudinal data, it is thereforenecessary to differentiate in a theoretically informed manner which relationships thecovariates in the observed data have with the treatment and outcome variables, thusavoiding bias in the causal effect estimates by (not) having taken them into account.
By integrating appropriate statistical theories and methods into AI, it will be possi-ble to answer causal questions and simulate interventions. In medicine, e.g., questionssuch as ‘What would be the effect of a general smoking ban on the German health caresystem’ could then be investigated and reliable statements could be made, even with-out randomized studies which would not be possible here. Pearl’s idea goes beyond
123

Is there a role for statistics in artificial intelligence?
the use of MLmethods in causal analyses (which are used, for example, in connectionwith targeted learning (Van der Laan and Rose 2011) or causal random forest (Atheyand Imbens 2015)). His vision is rather to integrate the causal framework (Pearl 2010)described by him with ML algorithms to enable the machines to draw causal conclu-sions and simulate interventions.
The integration of statistical methods to detect causality in AI also contributes toincreasing its transparency and thus the acceptance of AI methods, since a referenceto probabilities or statistical correlations in the context of an explanation is not aseffective as a reference to causes and causal effects (Miller 2019).
6 Statistical approaches for evaluating uncertainty andinterpretability
Uncertainty quantification is often neglected in AI applications. One reason may bethe above discussedmisconception that ‘BigData’ automatically leads to exact results,making uncertainty quantification redundant. Another key reason is the complexity ofthe methods which hampers the construction of statistically valid uncertainty assess-ments. However, most statisticians would agree that any comprehensive data analysisshould contain methods to quantify the uncertainty of estimates and predictions. Itsimportance is also stressed by the American statistician David B. Dunson who writesthat: ‘it is crucial to not over-state the results and appropriately characterize the (oftenimmense) uncertainty to avoid flooding the scientific literature with false findings.’(Dunson 2018).
In fact, in order to achieve themain goal of highly accurate predictions, assumptionsabout underlying distributions and functional relationships are deliberately droppedin AI applications. On the one hand, this allows for a greater flexibility of the proce-dures. On the other hand, however, this also complicates an accurate quantificationof uncertainty, e.g., to specify valid prediction and confidence regions for target vari-ables and parameters of interest. As Bühlmann and colleagues put it: ‘The statisticaltheory serves as guard against cheating with data: you cannot beat the uncertaintyprinciple.’ (Bühlmann and van de Geer 2018). In recent years, proposals for uncer-tainty quantification in AImethods have already been developed by invoking Bayesianapproximations, bootstrapping, jackknifing and other cross-validation techniques,Gaussian processes, Monte Carlo dropout etc., see e. g., Gal and Ghahramani (2016),Garnelo et al. (2018), Osband et al. (2016), Srivastava et al. (2014),Wager et al. (2014).However, their theoretical validity (e.g., that a prediction interval actually covers futurevalues 95% of the time) has either not been demonstrated yet or has only been provenunder very restrictive or at least partially unrealistic assumptions.
In contrast, algorithmic methods could be embedded in statistical models. Whilepotentially less flexible, they permit a better quantification of the underlying uncer-tainty by specifying valid prediction and confidence intervals or allow for a betterinterpretation of the results. We give two examples: In time-to-event analyses math-ematically valid simultaneous confidence bands for cumulative incidence functionscan be constructed by combinations of nonparametric estimators of Kaplan-Meier orAalen-Johansen-type and algorithmic resampling (Bluhmki et al. 2018; Dobler et al.
123

S. Friedrich et al.
2017). Similarly, in the context of time series prediction, hybrid combinations of arti-ficial neural networks with ARIMAmodels or within hierarchical structures allow forbetter explainability (Aburto and Weber 2007; Wickramasuriya et al. 2019).
Moreover, the estimated parameters of many AI approaches (such as deep learn-ing) are difficult to interpret. Pioneering work from computer science on this topic is,for example, Valiant (1984, 2013), for which Leslie Valiant was awarded the TuringAward in 2010. Further research is nevertheless needed to improve interpretability.This also includes uncertainty quantification of patterns identified by an AI method,which heavily rely on statistical techniques. A tempting approach to achieve moreinterpretable AI methods is the use of auxiliary models. These are comparatively sim-ple statistical models which, after adaptation of a deep learning approach, describethe most important patterns represented by the AI method and potentially can also beused to quantify uncertainty (Molnar 2019; Peltola 2018; Ribeiro et al. 2016a, b). Infact, as in computational and statistical learning theory (Györfi et al. 2002; Kearns andVazirani 1994; Vapnik 1998), statistical methods and AI learning approaches can (andshould) complement each other. Another important aspect is the model complexitywhich can, e.g., be captured by entropies (such as VC dimensions) or compressionbarriers (Langford 2005). These concepts as well as different forms of regularization(Tibshirani 1996; Wager et al. 2013; Zaremba et al. 2014), i.e. the restriction of theparameter space, allow to recognize or even to correct an overfitting of a learning pro-cedure. Here, the application of complexity reducing concepts can be seen as a directimplementation of the Lex Parsimoniae principle and often increases the interpretabil-ity of resulting models (Ross et al. 2017; Tibshirani 1997). In fact, regularization andcomplexity reducing concepts are an integral part of many AI methods. However, theyare also basic principles of modern statistics, which were already proposed beforetheir introduction to AI. Examples are given in connection with empirical Bayesian orshrinkage methods (Röver and Friede 2020). In addition to that, AI and statistics havenumerous concepts in common which give rise to an exchange of methods in thesefields.
Furthermore, uncertainty aspects also apply to quality criteria (e.g., accuracy, sensi-tivity and specificity) of AI algorithms. The corresponding estimators are also randombut their uncertainty is usually not quantified at all.
Statistics can help to increase the validity and interpretability of AI methods byproviding contributions to the quantification of uncertainty. To achieve this, we canassume specific probabilistic and statistical models or dependency structures whichallow comprehensive mathematical investigations (Athey et al. 2019; Bartlett et al.2004; Devroye et al. 2013; Györfi et al. 2002; Scornet et al. 2015; Wager and Athey2018; Ramosaj and Pauly 2019a), e.g., by investigating robustness properties, provingasymptotic consistency or (finite) error bounds. On the other hand this also includes theelaboration of (stochastic) simulation designs (Morris et al. 2019) and the specificationof easy to interpret auxiliary statistical models. Finally, it allows for a detailed analysisof quality criteria of AI algorithms.
123

Is there a role for statistics in artificial intelligence?
7 Conclusion and discussion
AI has been a growing research area for years, and its development will probablycontinue in the coming decades. In addition to ethical and legal problems, there arestill many open questions regarding the collection and processing of data. Statisticalmethods must be considered as integral part of AI systems, from the formulation ofthe research questions, the development of the research design, through the analysisup to the interpretation of the results. Particularly in the field of methodological devel-opment, statistics can, e.g., serve as multiplier and strengthen the scientific exchangeby establishing broad and strongly interconnected networks between users and devel-opers.
In the context of clinical trials, statistics also provides guidelines for importantaspects of trial design, data analysis and reporting. Many of these guidelines arecurrently being extended for AI applications, e.g. the TRIPOD statement (Collins et al.2015; Collins and Moons 2019) or the CONSORT and SPIRIT guidelines (Liu et al.2020; Rivera et al. 2020). Moreover, initiatives such as STRATOS (STRengtheningAnalytical Thinking for Observational Studies, https://stratos-initiative.org/) aim toprovide guidance for applied statisticians and other data analysts with varying levelsof statistical education.
As a core element ofAI, statistics is the natural partner for other disciplines in teach-ing, research and practice. Therefore, it is advisable to incorporate statistical aspectsinto AI teaching and to bridge the gap between the two disciplines. This begins withschool education, where statistics and computer science should be integral elements ofthe curricula, and continues with higher education as well as professional developmentand training. By developing professional networks, participating methodologists canbe brought together with users/experts to establish or maintain a continuous exchangebetween the disciplines. In addition to AI methods, these events should also cover thetopics of data curation, management of data quality and data integration.
Statistics is a broad cross-scientific discipline. Statisticians provide knowledge andexperience of all aspects of data evaluation: startingwith the research question throughdesign and analysis to the interpretation. In particular, the following contributions ofstatistics to the field of artificial intelligence can be summarized:
1. Methodological development: The development ofAI systems and their theoreticalunderpinning has benefited greatly from research in computer science and statis-tics, and many procedures have been developed by statisticians. Recent advancessuch as extreme learning machines show that statistics also provides importantcontributions to the design of AI systems, for example, by improved learningalgorithms based on penalized or robust estimation methods.
2. Planning and design: Statistics can help to optimize data collection or preparation(sample size, sampling design, weighting, restriction of the data set, design ofexperiments, etc.) for subsequent evaluation with AI methods. Furthermore, thequality measures of statistics and their associated inference methods can help inthe evaluation of AI models.
3. Assessment of data quality and data collection: Exploratory data analysis providesa wide range of tools to visualize the empirical distribution of the data and to derive
123

S. Friedrich et al.
appropriate metrics, which can be used to detect anomalies or to define ranges oftypical values, to correct input errors, to determine norm values and to imputemissing values. In combination with standardization in data storage, errors in themeasurement process can be detected and corrected at an early stage. With thehelp of model-based statistical methods, comprehensive parameter tuning is alsopossible, even for small data sets.
4. Differentiation of causality and associations: In statistics, methods for dealingwith covariate effects are known. Here, it is important to differentiate theoreti-cally informed between the different relationships covariates can have to treatmentand outcome in order to avoid bias in the estimation of causal effects. Pearl’scausal framework enables the analysis of causal effects and the simulation ofinterventions. The integration of causal methods into AI can also contribute to thetransparency and acceptance of AI methods.
5. Assessment of certainty or uncertainty in results: Statistics can help to enable orimprove the quantification of uncertainty in and the interpretability of AI meth-ods. By adopting specific statistical models, mathematical proofs of validity canalso be provided. In addition, limitations of the methods can be explored through(stochastic) simulation designs.
6. Conscientious implementation of points 2 to 5, including a previously definedevaluation plan, also counteracts the replication crisis (Pashler and Wagenmak-ers 2012) in many scientific disciplines. This aspect does not only hold for AIapplications, but generally concerns all empirical studies.
7. Education, advanced vocational training and public relations: With its specializedknowledge, statistics is the natural partner for other disciplines in teaching andtraining. Especially in the further development ofmethods of artificial intelligence,statistics can strengthen scientific exchange.
With respect to some points raised in this paper, a few comments are in place. First,as mentioned in the introduction there is no unique definition of AI or ML accordingto the literature and distinguishing between the two is not easy. A broader consensus inthe scientific community is necessary to facilitate common discussions. Second, as ananonymous referee commented, it might be helpful to distinguish between differentframeworks concerning data and problems. The proposal is to distinguish between(a) problems and data with random or partly random aspects and (b) problems with adeterministic background such as graph theoretical structures or optimum configura-tions. While the first is a natural field of application for statistics, the second may alsobenefit from statistical approaches, e.g. concerning robustness or sensitivity. A relatedissue concerns the fact that the evaluation of AI methods must be seen in the contextof the corresponding application. In life sciences and medicine we often assume theexistence of some underlying ‘ground truth’ which needs to be estimated. Thus, mod-eling concepts such as bias or accuracy can be used for evaluation. In other areas suchas economy or marketing, the idea rather is to derive a somewhat ‘useful’ or ‘effective’strategy from the data. In such a situation, statistics can still be used for evaluation,for example by making predictions and comparing their accuracy with the observeddata.
123

Is there a role for statistics in artificial intelligence?
Another important aspect concerns the combination of data and results obtainedfrom different studies. In evidence based medicine, systematic reviews and meta-analyses play a key role in combining results frommultiple studies to give a quantitativesummary of the literature. In contrast, meta-analysis methods to combine resultsfrom AI applications have not been developed yet. Initiatives to enable the sharingof data and models in AI include federated learning and software frameworks suchas DataSHIELD (DataSHIELD 2018; Gaye et al. 2014), which enables remote andnondisclosive analysis of sensitive data, see also Bonofiglio et al. (2020). Thus, bothfields could profit from an exchange of methods in this context.
The objective of statistics related to AI must be to facilitate or enable the interpre-tation of data. As Pearl puts it: ‘Data alone are hardly a science, regardless how bigthey get and how skillfully they are manipulated’ (Pearl 2018). What is important isthe knowledge gained that will enable future interventions.
Acknowledgements We would like to thank Rolf Biehler for his valuable input on Data Science projectsat schools. Moreover, Willi Sauerbrei (University Freiburg) and Kaspar Rufibach (F. Hoffmann-La RocheLtd) provided valuable comments. This paper is based on the position paper ‘DAGStat Stellungnahme: DieRolle der Statistik in der Künstlichen Intelligenz‘ (https://www.dagstat.de/fileadmin/dagstat/documents/DAGStat_KI_Stellungnahme_200303.pdf), which has been drafted by a working group of the GermanConsortium in Statistics (DAGStat) and approved by the members.
Funding Open Access funding enabled and organized by Projekt DEAL.
Declarations
Conflict of interest The authors declare that they have no conflict of interest.
OpenAccess This article is licensedunder aCreativeCommonsAttribution 4.0 InternationalLicense,whichpermits use, sharing, adaptation, distribution and reproduction in any medium or format, as long as you giveappropriate credit to the original author(s) and the source, provide a link to the Creative Commons licence,and indicate if changes were made. The images or other third party material in this article are includedin the article’s Creative Commons licence, unless indicated otherwise in a credit line to the material. Ifmaterial is not included in the article’s Creative Commons licence and your intended use is not permittedby statutory regulation or exceeds the permitted use, you will need to obtain permission directly from thecopyright holder. To view a copy of this licence, visit http://creativecommons.org/licenses/by/4.0/.
References
Aburto L, Weber R (2007) Improved supply chain management based on hybrid demand forecasts. ApplSoft Comput 7(1):136–144
AInow (2020) https://ainowinstitute.org/, accessed 02.02.2020Athey S, Imbens GW (2015) Machine learning for estimating heterogeneous causal effects. Stanford Uni-
versity, Graduate School of Business, Tech. repAthey S, Imbens GW (2017) The econometrics of randomized experiments. Handbook of Economic Field
Experiments, vol 1. Elsevier, Amsterdam, pp 73–140Athey S, Tibshirani J, Wager S (2019) Generalized random forests. Ann Stat 47(2):1148–1178Barrachina S, Bender O, Casacuberta F, Civera J, Cubel E, Khadivi S, Lagarda A, Ney H, Tomás J, Vidal E,
Vilar JM (2009) Statistical approaches to computer-assisted translation. Comput Linguistics 35(1):3–28. https://doi.org/10.1162/coli.2008.07-055-r2-06-29
123

S. Friedrich et al.
Bartels DM, Hastie R, Urminsky O (2018) Connecting laboratory and field research in judgment anddecision making: causality and the breadth of external validity. J Appl Res Memory Cogn 7(1):11–15.https://doi.org/10.1016/j.jarmac.2018.01.001
Bartlett PL, Bickel PJ, Bühlmann P, Freund Y, Friedman J, Hastie T, Jiang W, Jordan MJ, Koltchinskii V,Lugosi G et al (2004) Discussions of boosting papers, and rejoinders. Ann Stat 32(1):85–134
Beck M, Dumpert F, Feuerhake J (2018) Machine Learning in Official Statistics. arXiv preprintarXiv:1812.10422
Begley CG, Ellis LM (2012) Raise standards for preclinical cancer research. Nature 483(7391):531–533Bellman R (1957) Dynamic programming. Princeton University Press, Princeton, New JerseyBenda N, Branson M, Maurer W, Friede T (2010) Aspects of modernizing drug development using clinical
scenario planning and evaluation. Drug Inf J DIJ/Drug Inf Assoc 44(3):299–315Billard L, Diday E (2006) Symbolic data analysis: conceptual statistics and data mining. Wiley, Chichester,
West SussexBishop CM (2006) Pattern recognition and machine learning. Springer, New YorkBlasiak A, Khong J, Kee T (2020) CURATE.AI: optimizing personalized medicine with artificial intelli-
gence. SLAS TECHNOLOGY: Trans Life Sci Innov 25(2):95–105Bluhmki T, Schmoor C, Dobler D, PaulyM, Finke J, SchumacherM, Beyersmann J (2018) Awild bootstrap
approach for the Aalen–Johansen estimator. Biometrics 74(3):977–985Bock HH, Diday E (2000) Analysis of symbolic data. Springer, HeidelbergBonofiglio F, Schumacher M, Binder H (2020) Recovery of original individual person data (ipd) inferences
from empirical ipd summaries only: applications to distributed computing under disclosure constraints.Stat Med 39(8):1183–1198
Braver SL, SmithMC (1996)Maximizing both external and internal validity in longitudinal true experimentswith voluntary treatments: The “combined modified” design. Eval Prog Planning 19(4):287–300.https://doi.org/10.1016/s0149-7189(96)00029-8
Breiman L (1996) Bagging predictors. Mach Learn 24(2):123–140. https://doi.org/10.1007/bf00058655Breiman L (2001) Random forests. Mach Learn 45(1):5–32Bühlmann P, van de Geer S (2018) Statistics for big data: A perspective. Stat Prob Lett 136:37–41Bundespolizeipräsidium Potsdam (2018) Abschlussbericht Teilprojekt 1 “Biometrische Gesicht-
serkennung”. https://www.bundespolizei.de/Web/DE/04Aktuelles/01Meldungen/2018/10/181011_abschlussbericht_gesichtserkennung_down.pdf?__blob=publicationFile=1, accessed 07.05.2020
Bundesregierung (2018) Artificial intelligence strategy. https://www.ki-strategie-deutschland.de/home.html?file=files/downloads/Nationale_KI-Strategie_engl.pdf, accessed 07.05.2020
Burt JR, Torosdagli N, Khosravan N, RaviPrakash H, Mortazi A, Tissavirasingham F, Hussein S, Bagci U(2018) Deep learning beyond cats and dogs: recent advances in diagnosing breast cancer with deepneural networks. British J Radiol 91(1089):20170545
Burton A, Altman DG, Royston P, Holder RL (2006) The design of simulation studies in medical statistics.Stat Med 25(24):4279–4292
Catalogue of bias collaboration, Lee H, Aronson JK, Nunan D (2019) Catalogue of bias: Collider bias.https://catalogofbias.org/biases/collider-bias, accessed 12.02.2020
Chen CLP, Liu Z (2018) Broad learning system: an effective and efficient incremental learning systemwithout the need for deep architecture. IEEE Trans Neural Netw Learn Syst 29(1):10–24. https://doi.org/10.1109/tnnls.2017.2716952
Chen H, Engkvist O,Wang Y, OlivecronaM, Blaschke T (2018) The rise of deep learning in drug discovery.Drug Discovery Today 23(6):1241–1250
Chen S, Cowan CFN, Grant PM (1991) Orthogonal least squares learning algorithm for radial basis functionnetworks. IEEE Trans Neural Netw 2(2):302–309. https://doi.org/10.1109/72.80341
Cochran WG, Rubin DB (1973) Controlling bias in observational studies: A review. Sankhya: The Ind JStat Ser A 35(4):417–446
Collins GS, Moons KG (2019) Reporting of artificial intelligence prediction models. The Lancet393(10181):1577–1579
Collins GS, Reitsma JB, Altman DG, Moons KG (2015) Transparent reporting of a multivariable pre-diction model for individual prognosis or diagnosis (TRIPOD) the TRIPOD statement. Circulation131(2):211–219
Cortes C, Vapnik V (1995) Support-vector networks. Mach Learn 20(3):273–297. https://doi.org/10.1007/bf00994018
123

Is there a role for statistics in artificial intelligence?
Dastin J (2018) Amazon scraps secret AI recruiting tool that showed bias against women. Reuters (2018).https://www.reuters.com/article/us-amazon-com-jobs-automation-insight/amazon-scraps-secret-ai-recruiting-tool-that-showed-bias-against-women-idUSKCN1MK08G, accessed 27.11.2019
Data Ethics Commission of the Federal Government, Federal Ministry of the Interior, Building andCommunity (2019) Opinion of the data ethics commission. https://www.bmi.bund.de/SharedDocs/downloads/EN/themen/it-digital-policy/datenethikkommission-abschlussgutachten-lang.pdf?__blob=publicationFile&v=4, accessed 07.05.2020
DataSHIELD (2018) https://www.datashield.ac.ukDavis E (2016) AI amusements: the tragic tale of Tay the chatbot. AI Matters 2(4):20–24Devroye L, Györfi L, Lugosi G (2013) A probabilistic theory of pattern recognition, vol 31. Springer, New
YorkDidelez V (2007) Graphical models for composable finite Markov processes. Scand J Stat 34(1):169–185Dobler D, Beyersmann J, Pauly M (2017) Non-strange weird resampling for complex survival data.
Biometrika 104(3):699–711Duflo E, Glennerster R, Kremer M (2007) Using randomization in development economics research: A
toolkit. Handbook of development economics 4:3895–3962Duke-Margolis (2018) https://healthpolicy.duke.edu/sites/default/files/2020-03/characterizing_rwd.pdf.
Accessed 13 May 2020Duke-Margolis (2019) https://healthpolicy.duke.edu/sites/default/files/2019-11/rwd_reliability.pdf.
Accessed 13 May 2020Dunson DB (2018) Statistics in the big data era: Failures of the machine. Stat Prob Lett 136:4–9European Commission (2020a) https://ec.europa.eu/info/resources-partners/machine-translation-public-
administrations-etranslation_en#translateonline, accessed 13.05.2020European Commission (2020b) On Artificial Intelligence - A European approach to excellence
and trust. https://ec.europa.eu/info/sites/info/files/commission-white-paper-artificial-intelligence-feb2020_en.pdf, accessed 29.07.2020
European Statistical System (2019) Quality assurance framework of the european statistical system. https://ec.europa.eu/eurostat/documents/64157/4392716/ESS-QAF-V1-2final.pdf/bbf5970c-1adf-46c8-afc3-58ce177a0646, accessed 07.05.2020
Fayyad U, Piatetsky-Shapiro G, Smyth P (1996) From data mining to knowledge discovery in databases.AI Magazine 17(3):37–37
FDA (2019) https://www.fda.gov/media/122535/download, accessed 13.05.2020Flake JK, Fried EI (2020) Measurement schmeasurement: questionable measurement practices and
how to avoid them. Adv Methods Practices Psychol Sci 3(4):456–465. https://doi.org/10.1177/2515245920952393
Forbes (2018) https://www.forbes.com/sites/bernardmarr/2018/03/05/heres-why-data-is-not-the-new-oil/#45b487143aa9, accessed 27.04.2020
Freund Y, Schapire RE (1997) A decision-theoretic generalization of on-line learning and an application toboosting. J Comput Syst Sci 55(1):119–139. https://doi.org/10.1006/jcss.1997.1504
Friede T, Nicholas R, Stallard N, Todd S, Parsons N, Valdés-Márquez E, Chataway J (2010) Refinement ofthe clinical scenario evaluation framework for assessment of competing development strategies withan application to multiple sclerosis. Drug Inf J: DIJ/Drug Inf Assoc 44(6):713–718
Friedrich S, Groß S, König IR, Engelhardt S, BahlsM, Heinz J, Huber C, Kaderali L, KelmM, Leha A, RühlJ, Schaller J, Scherer C, Vollmer M, Seidler T, Friede T (2021) Applications of AI/ML approachesin cardiovascular medicine: A systematic review with recommendations. European Heart Journal -Digital Health. https://doi.org/10.1093/ehjdh/ztab054
Gabler S, Häder S (2018) Repräsentativität: Versuch einer Begriffsbestimmung. In: Telefonumfragenin Deutschland, Springer Fachmedien Wiesbaden, pp 81–112, https://doi.org/10.1007/978-3-658-23950-3_5, https://doi.org/10.1007%2F978-3-658-23950-3_5
Gal Y, Ghahramani Z (2016) Dropout as a Bayesian approximation: Representingmodel uncertainty in deeplearning. In: Balcan MF, Weinberger KQ (eds) Proceedings of The 33rd international conference onmachine learning, PMLR, New York, New York, USA, Proceedings of Machine Learning Research,vol 48, pp 1050–1059
GarneloM, RosenbaumD,Maddison CJ, Ramalho T, Saxton D, ShanahanM, TehYW, Rezende DJ, EslamiS (2018) Conditional neural processes. arXiv preprint arXiv:1807.01613
123

S. Friedrich et al.
Gaye A, Marcon Y, Isaeva J, LaFlamme P, Turner A, Jones EM, Minion J, Boyd AW, Newby CJ, NuotioML (2014) DataSHIELD: taking the analysis to the data, not the data to the analysis. Int J Epidemiol43(6):1929–1944
Greenland S, Robins JM (1986) Identifiability, exchangeability, and epidemiological confounding. Int JEpidemiol 15(3):413–419
Greenland S, Robins JM, Pearl J (1999) Confounding and collapsibility in causal inference. Stat Sci14(1):29–46
Gudivada VN, Baeza-Yates R, Raghavan VV (2015) Big data: Promises and problems. Computer 48(3):20–23. https://doi.org/10.1109/MC.2015.62
Györfi L, Kohler M, Krzyzak A, Walk H (2002) A distribution-free theory of nonparametric regression.Springer, New York. https://doi.org/10.1007/b97848
Haibe-Kains B, Adam GA, Hosny A, Khodakarami F, Waldron L, Wang B, McIntosh C, Goldenberg A,Kundaje A, Greene CS et al (2020) Transparency and reproducibility in artificial intelligence. Nature586(7829):E14–E16
Hamburg MA, Collins FS (2010) The path to personalized medicine. N Engl J Med 363(4):301–304Heckman JJ (2001) Micro data, heterogeneity, and the evaluation of public policy: nobel lecture. J Political
Econ 109(4):673–748. https://doi.org/10.1086/322086HeinzeG,WallischC,DunklerD (2018)Variable selection-a review and recommendations for the practicing
statistician. Biomet J 60(3):431–449Higgins JP, Altman DG, Gøtzsche PC, Jüni P, Moher D, Oxman AD, Savovic J, Schulz KF, Weeks L,
Sterne JA (2011) The Cochrane Collaboration’s tool for assessing risk of bias in randomised trials.Bmj 343:d5928
Hilberg W (1995) Karl Steinbuch, ein zu Unrecht vergessener Pionier der künstlichen neuronalen Systeme.Frequenz 49(1–2):28–36
Hill AB (1965) The environment and disease: association or causation? Proc Royal SocMed 58(5):295–300HuangGB, ZhuQY, SiewCK (2006) Extreme learningmachine: Theory and applications. Neurocomputing
70(1–3):489–501. https://doi.org/10.1016/j.neucom.2005.12.126Juang BH, Rabiner LR (1991) Hidden markov models for speech recognition. Technometrics 33(3):251–
272. https://doi.org/10.1080/00401706.1991.10484833Kamilaris A, Prenafeta-Boldú FX (2018) Deep learning in agriculture: A survey. Comput Electron Agric
147:70–90Karlin S, Studden WJ (1966) Optimal experimental designs. Ann Math Stat 37(4):783–815Karr AF, Sanil AP, Banks DL (2006) Data quality: A statistical perspective. Stat Methodol 3(2):137–173KearnsMJ,VaziraniU (1994)An introduction to computational learning theory. TheMITPress, Cambridge,
MA. https://doi.org/10.7551/mitpress/3897.001.0001Kelley HJ (1960) Gradient theory of optimal flight paths. ARS J 30(10):947–954. https://doi.org/10.2514/
8.5282Keogh RH, Shaw PA, Gustafson P, Carroll RJ, Deffner V, Dodd KW, Küchenhoff H, Tooze JA, Wallace
MP, Kipnis V et al (2020) Stratos guidance document on measurement error and misclassification ofvariables in observational epidemiology: part 1–basic theory and simple methods of adjustment. StatMed 39(16):2197–2231
Koch C (2016) How the computer beat the go player. Sci Am Mind 27(4):20–23. https://doi.org/10.1038/scientificamericanmind0716-20
Kohavi R, Tang D, Xu Y, Hemkens LG, Ioannidis JPA (2020) Online randomized controlled experimentsat scale: lessons and extensions to medicine. Trials 21(1), https://doi.org/10.1186/s13063-020-4084-y, https://doi.org/10.1186%2Fs13063-020-4084-y
Kozielski M, Doetsch P, Ney H (2013) Improvements in RWTH’s System for Off-Line Handwriting Recog-nition. In: 2013 12th international conference on document analysis and recognition, IEEE, https://doi.org/10.1109/icdar.2013.190, https://doi.org/10.1109%2Ficdar.2013.190
KruskalW,Mosteller F (1979a) Representative sampling, I: non-scientific literature. International StatisticalReview/Revue Internationale de Statistique pp 13–24
Kruskal W, Mosteller F (1979b) Representative sampling. Scientific literature, excluding statistics. Inter-national Statistical Review/Revue Internationale de Statistique, II, pp 111–127
Kruskal W, Mosteller F (1979c) Representative sampling. The current statistical literature. InternationalStatistical Review/Revue Internationale de Statistique, III, pp 245–265
Kruskal W, Mosteller F (1980) Representative sampling, IV: The history of the concept in statistics, 1895-1939. International Statistical Review/Revue Internationale de Statistique pp 169–195
123

Is there a role for statistics in artificial intelligence?
Van der Laan MJ, Rose S (2011) Targeted learning: causal inference for observational and experimentaldata. Springer, New York
Langford J (2005) Tutorial on practical prediction theory for classification. J Mach Learn Res 6:273–306Lazer D, Kennedy R, King G, Vespignani A (2014) The parable of Google Flu: traps in big data analysis.
Science 343(6176):1203–1205Levine S, Pastor P, Krizhevsky A, Ibarz J, Quillen D (2018) Learning hand-eye coordination for robotic
grasping with deep learning and large-scale data collection. Int J Robot Res 37(4–5):421–436Lin EJD, Hefner JL, Zeng X, Moosavinasab S, Huber T, Klima J, Liu C, Lin SM (2019) A deep learning
model for pediatric patient risk stratification. Am J Managed Care 25(10):e310–e315Liu X, Rivera SC, Moher D, Calvert MJ, Denniston AK (2020) Reporting guidelines for clinical trial
reports for interventions involving artificial intelligence: the CONSORT-AI extension. British Med J370:m3164
Makel MC, Plucker JA, Hegarty B (2012) Replications in psychology research: How often do they reallyoccur? Perspec Psychol Sci 7(6):537–542
McCracken MW, Ng S (2016) FRED-MD: a monthly database for macroeconomic research. J BusinessEcon Stat 34(4):574–589. https://doi.org/10.1080/07350015.2015.1086655
MedTechIntelligence (2018) https://www.medtechintelligence.com/news_article/apple-watch-4-gets-fda-clearance/, accessed 13.05.2020
Meinshausen N, Bühlmann P (2010) Stability selection. J Royal Stat Soc: Ser B (Statistical Methodology)72(4):417–473
Meng XL (2018) Statistical paradises and paradoxes in big data (I): Law of large populations, big dataparadox, and the 2016 US presidential election. Ann Appl Stat 12(2):685–726
Meng XL, Xie X (2014) I got more data, my model is more refined, but my estimator is getting worse! AmI just dumb? Econom Rev 33(1–4):218–250
Miller T (2019) Explanation in artificial intelligence: Insights from the social sciences. Artif Intell 267:1–38(2014) Handbook of missing data methodology. Chapman and Hall/CRC, Boca Raton, FL,. https://doi.org/
10.1201/b17622Molnar C (2019) Interpretable machine learning. https://christophm.github.io/interpretable-ml-book/.
Accessed 29 July 2020Moor J (2006) The Dartmouth College artificial intelligence conference: The next fifty years. AI Magazine
27(4):87–87Morris TP, White IR, Crowther MJ (2019) Using simulation studies to evaluate statistical methods. Stat
Med 38(11):2074–2102New York A (2018) https://www.nytimes.com/2018/12/18/technology/facebook-privacy.html, accessed
27.04.2020Ng S (2018) Opportunities and challenges: lessons from analyzing terabytes of scanner data. In: Honore
B, Pakes A, Piazzesi M, Samuelson L (eds) Advances in economics and econometrics, Cam-bridge University Press, pp 1–34, https://doi.org/10.1017/9781108227223.001, https://doi.org/10.1017%2F9781108227223.001
Ntoutsi E, Fafalios P, Gadiraju U, Iosifidis V, Nejdl W, Vidal ME, Ruggieri S, Turini F, Papadopoulos S,Krasanakis E et al (2020) Bias in data-driven artificial intelligence systems. An introductory survey.Wiley Interdisciplin Rev: Data Mining Knowl Discovery 10(3):e1356
Nuffield Foundation (2019) Ethical and societal implications of algorithms, data, and artificial intelli-gence: a roadmap for research. https://www.nuffieldfoundation.org/sites/default/files/files/Ethical-and-Societal-Implications-of-Data-and-AI-report-Nuffield-Foundat.pdf, accessed 27.04.2021
Osband I, Blundell C, Pritzel A, Van Roy B (2016) Deep exploration via bootstrapped DQN. In: Advancesin neural information processing systems, pp 4026–4034
Pashler H, Wagenmakers EJ (2012) Editors’ introduction to the special section on replicability in psycho-logical science: A crisis of confidence? Perspect Psychol Sci 7(6):528–530
Pearl J (1988) Probabilistic reasoning in intelligent systems: Networks of plausible inference. MorganKaufmann Publisher Inc, San Francisco, CA
Pearl J (1993) Aspects of graphical models connected with causality. In: Proceedings of the 49th sessionof the international statistical science institute
Pearl J (2009) Causality. Cambridge University Press, New YorkPearl J (2010) The foundations of causal inference. Sociol Methodol 40(1):75–149Pearl J (2018) Theoretical impediments to machine learning with seven sparks from the causal revolution.
arXiv preprint arXiv:18010.4016v1
123
S. Friedrich et al.
Peltola T (2018) Local interpretable model-agnostic explanations of bayesian predictive models viaKullback–Leibler projections. arXiv preprint arXiv:18100.2678v1
Pepe MS (2003) The statistical evaluation of medical tests for classification and prediction. Oxford Uni-versity Press, New York
Perez MV, Mahaffey KW, Hedlin H, Rumsfeld JS, Garcia A, Ferris T, Balasubramanian V, Russo AM,RajmaneA, CheungL et al (2019) Large-scale assessment of a smartwatch to identify atrial fibrillation.N Engl J Med 381(20):1909–1917
Porta M (ed) (2016) A Dictionary of Epidemiology, 6th edn. Oxford University Press, New YorkRamosaj B, Pauly M (2019a) Consistent estimation of residual variance with random forest Out-Of-Bag
errors. Stat Probab Lett 151:49–57Ramosaj B, PaulyM (2019b) Predicting missing values: a comparative study on non-parametric approaches
for imputation. Comput Stat 34(4):1741–1764Ramosaj B, Amro L, Pauly M (2020) A cautionary tale on using imputation methods for inference in
matched pairs design. Bioinformatics 36(10):3099–3106Ribeiro M, Singh S, Guestrin C (2016a) “Why Should I Trust You?”: Explaining the predictions of any
classifier. In: Proceedings of the 2016 conference of the north american chapter of the association forcomputational linguistics: Demonstrations, Association for Computational Linguistics, https://doi.org/10.18653/v1/n16-3020, https://doi.org/10.18653%2Fv1%2Fn16-3020
RibeiroMT,SinghS,GuestrinC (2016b)Model-agnostic interpretability ofmachine learning. arXiv preprintarXiv:16060.5386v1
Richter J, Madjar K, Rahnenführer J (2019) Model-based optimization of subgroup weights for survivalanalysis. Bioinformatics 35(14):484–491
Rivera SC, Liu X, Chan AW, Denniston AK, Calvert MJ (2020) Guidelines for clinical trial protocols forinterventions involving artificial intelligence: the SPIRIT-AI extension. British Med J 370:m3210
Robins JM, Hernán MÁ, Brumback B (2000) Marginal structural models and causal inference in epidemi-ology. Epidemiology 11(5):550–560. https://doi.org/10.1097/00001648-200009000-00011
RoeBE, JustDR (2009) Internal and external validity in economics research: tradeoffs between experiments,field experiments, natural experiments, andfield data.AmJAgricult Econom91(5):1266–1271. https://doi.org/10.1111/j.1467-8276.2009.01295.x
Rosenbaum P (2002) Observational studies. In: Springer Series in Statistics, Springer New York, pp 1–17,https://doi.org/10.1007/978-1-4757-3692-2_1, https://doi.org/10.1007%2F978-1-4757-3692-2_1
Rosenbaum P (2010) Design of observational studies. Springer, New York. https://doi.org/10.1007/978-1-4419-1213-8
Rosenbaum P (2017) Observation and experiment. Harvard University Press, Cambridge, MA. https://doi.org/10.4159/9780674982697
Rosenblatt F (1958) The perceptron: A probabilistic model for information storage and organization in thebrain. Psychol Rev 65(6):386–408. https://doi.org/10.1037/h0042519
Ross A, Lage I, Doshi-Velez F (2017) The neural lasso: Local linear sparsity for interpretable explanations.In: Workshop on transparent and interpretable machine learning in safety critical environments, 31stconference on neural information processing systems, Long Beach, CA
Röver C, Friede T (2020)Dynamically borrowing strength from another study through shrinkage estimation.Stat Methods Med Res 29:293–308
Rubin DB (1974) Estimating causal effects of treatments in randomized and nonrandomized studies. J EducPsychol 66(5):688
Rubin DB (1976) Inference and missing data. Biometrika 63(3):581–592Rubin DB (2006) Matched sampling for causal effects. Cambridge University Press, Cambridge, MA.
https://doi.org/10.1017/cbo9780511810725Rubin DB (2008) For objective causal inference, design trumps analysis. Ann Appl Stat 2(3):808–840Sauerbrei W, Perperoglou A, Schmid M, Abrahamowicz M, Becher H, Binder H, Dunkler D, Harrell FE,
Royston P, Heinze G, others for TG2 of the STRATOS initiative (2020) State of the art in selection ofvariables and functional forms in multivariable analysis - outstanding issues. Diagnostic PrognosticRes 4:1–18
Schmidhuber J (2015) Deep learning in neural networks: An overview. Neural Netw 61:85–117. https://doi.org/10.1016/j.neunet.2014.09.003
Schork NJ (2019) Artificial intelligence and personalized medicine. In: Von Hoff D, Han H (eds) Precisionmedicine in cancer therapy, cancer treatment and research. Springer, Cham
Scornet E, Biau G, Vert JP (2015) Consistency of random forests. Ann Stat 43(4):1716–1741
123

Is there a role for statistics in artificial intelligence?
Seaman SR, White IR (2013) Review of inverse probability weighting for dealing with missing data. StatMethods Med Res 22(3):278–295
Searle J (1980) Minds, Brains and Programs. Behavioral Brain Sci 3(3):417–457ShadishWR, Cook TD, Campbell DT (2002) Experimental and quasi-experimental designs for generalized
causal inference. Houghton Mifflin, BostonShaw PA, Gustafson P, Carroll RJ, Deffner V, Dodd KW, Keogh RH, Kipnis V, Tooze JA, Wallace MP,
Küchenhoff H et al (2020) Stratos guidance document on measurement error and misclassification ofvariables in observational epidemiology: Part 2–more complex methods of adjustment and advancedtopics. Stat Med 39(16):2232–2263
Silver D, Hubert T, Schrittwieser J, Antonoglou I, Lai M, Guez A, Lanctot M, Sifre L, Kumaran D,Graepel T, Lillicrap T, Simonyan K, Hassabis D (2018) A general reinforcement learning algorithmthat masters chess, shogi, and Go through self-play. Science 362(6419):1140–1144. https://doi.org/10.1126/science.aar6404
SimonHA (1983)Why shouldmachines learn? In:Michalski RS, Carbonell JG,Mitchell TM (eds)Machinelearning. Morgan Kaufmann, San Francisco, CA, pp 25–37
Simons DJ, Shoda Y, Lindsay DS (2017) Constraints on generality (COG): A proposed addition to allempirical papers. Perspect Psychol Sci 12(6):1123–1128
SimpsonEH (1951) The interpretation of interaction in contingency tables. J Roy Stat Soc: Ser B (Methodol)13(2):238–241
Solomonoff RJ (1985) The time scale of artificial intelligence: Reflections on social effects. Human SystManag 5(2):149–153
Srivastava N, Hinton G, Krizhevsky A, Sutskever I, Salakhutdinov R (2014) Dropout: a simple way toprevent neural networks from overfitting. J Mach Learn Res 15(1):1929–1958
Staddon J (2017) Scientific method: how science works, fails to work, and pretends to work. Taylor &Francis Group, New York
Steinbuch K (1961) Die Lernmatrix. Kybernetik 1(1):36–45Sutton RS, Barto AG (2018) Reinforcement learning: An introduction. MIT press, Cambridge, MATeichmann M, Weber M, Zoellner M, Cipolla R, Urtasun R (2018) Multinet: Real-time joint semantic
reasoning for autonomous driving. In: 2018 IEEE intelligent vehicles symposium (IV), IEEE, pp1013–1020
The Economist (2017) https://www.economist.com/leaders/2017/05/06/the-worlds-most-valuable-resource-is-no-longer-oil-but-data, accessed 27.04.2020
Theodorou V, Abelló A, Thiele M, Lehner W (2017) Frequent patterns in ETL workflows: An empiricalapproach. Data Knowl Eng 112:1–16. https://doi.org/10.1016/j.datak.2017.08.004
Thurow M, Dumpert F, Ramosaj B, Pauly M (2021) Goodness (of fit) of imputation accuracy: The Good-Impact analysis. arXiv preprint arXiv:2101.07532
Tibshirani R (1996) Regression shrinkage and selection via the lasso. J Royal Stat Soc Ser B Stat Methodol58(1):267–288. https://doi.org/10.1111/j.2517-6161.1996.tb02080.x
Tibshirani R (1997) The LASSO method for variable selection in the Cox model. Stat Med 16(4):385–395.https://doi.org/10.1002/(sici)1097-0258(19970228)16:4h385::aid-sim380i3.0.co;2-3
Tukey JW (1962) The future of data analysis. Ann Math Stat 33(1):1–67UNECE (2020) Machine learning for official statistics – HLG-MOS machine learning project. https://
statswiki.unece.org/display/ML/HLG-MOS+Machine+Learning+ProjectValiant LG (1984) A theory of the learnable. Commun ACM 27(11):1134–1142. https://doi.org/10.1145/
1968.1972Valiant LG (2013) Probably approximately correct: nature’s algorithms for learning and prospering in a
complexworld.ChoiceRevOnline 51(05):51-2716–51-2716. https://doi.org/10.5860/choice.51-2716Van Buuren S (2018) Flexible imputation of missing data. CRC Press, Boca Raton, FLVapnik V (1998) Statistical learning theory. Wiley, New YorkWager S, Athey S (2018) Estimation and inference of heterogeneous treatment effects using random forests.
J Am Stat Assoc 113(523):1228–1242Wager S, Wang S, Liang PS (2013) Dropout training as adaptive regularization. In: Burges CJC,
Bottou L, Welling M, Ghahramani Z, Weinberger KQ (eds) Advances in neural information pro-cessing systems, vol 26. Curran Associates, Inc. https://proceedings.neurips.cc/paper/2013/file/38db3aed920cf82ab059bfccbd02be6a-Paper.pdf
Wager S, Hastie T, Efron B (2014) Confidence intervals for random forests: The jackknife and the infinites-imal jackknife. J Mach Learn Res 15(1):1625–1651
123

S. Friedrich et al.
Warner B, Misra M (1996) Understanding neural networks as statistical tools. Am Stat 50(4):284–293Weihs C, Ickstadt K (2018) Data science: the impact of statistics. Int J Data Sci Anal 6(3):189–194Wickramasuriya SL, Athanasopoulos G, Hyndman RJ (2019) Optimal forecast reconciliation for hierarchi-
cal and grouped time series through trace minimization. J Am Stat Assoc 114(526):804–819Wikipedia (2020) https://en.wikipedia.org/wiki/Simpson%27s_paradox#/media/File:Simpson’s_
paradox_continuous.svg. Accessed 28 July 2020Wiredcom (2019) https://www.wired.com/story/ubers-self-driving-car-didnt-know-pedestrians-could-
jaywalk/. 13 May 2020WolfMJ,Miller K, Grodzinsky FS (2017)Whywe should have seen that coming: comments onMicrosoft’s
tay experiment, and wider implications. ACM SIGCAS Comput Soc 47(3):54–64Zaremba W, Sutskever I, Vinyals O (2014) Recurrent Neural Network Regularization. arXiv preprint
arXiv:1409.2329v5Zhu J, Chen J, HuW, Zhang B (2017) Big Learningwith Bayesianmethods. National Sci Rev 4(4):627–651.
https://doi.org/10.1093/nsr/nwx044
Publisher’s Note Springer Nature remains neutral with regard to jurisdictional claims in published mapsand institutional affiliations.
Affiliations
Sarah Friedrich1 · Gerd Antes2 · Sigrid Behr3 · Harald Binder2 ·Werner Brannath4 · Florian Dumpert5 · Katja Ickstadt6 · Hans A. Kestler7 ·Johannes Lederer8 · Heinz Leitgöb9 ·Markus Pauly6 · Ansgar Steland10 ·Adalbert Wilhelm11 · Tim Friede1
B Tim [email protected]
1 Department of Medical Statistics, University Medical Center Göttingen, Göttingen, Germany
2 Faculty of Medicine and Medical Center, University of Freiburg, Freiburg, Germany
3 Novartis Pharma AG, Basel, Switzerland
4 Competence Center for Clinical Trials and Institute of Statistics, University Bremen, Bremen,Germany
5 Federal Statistical Office of Germany, Wiesbaden, Germany
6 Department of Statistics, TU Dortmund University, Dortmund, Germany
7 Institute of Medical Systems Biology, Ulm University, Ulm, Germany
8 Faculty of Mathematics, Ruhr-Universität Bochum, Bochum, Germany
9 Department of Sociology, University of Eichstätt-Ingolstadt, Ingolstadt, Germany
10 RWTH Aachen University, Aachen, Germany
11 Jacobs University Bremen, Bremen, Germany
123