isabella county equalization reports
TRANSCRIPT

200 N. MAIN STMOUNT PLEASANT, MI 48858
989.317.4074 Ext. 242
Isabella County
2019
Equalization Reports
Prepared by:
Isabella CountyEqualization Department
H:\Jcn Excel\Equal_19\EQ REPORT TABLE OF CONTENTs 2019-12-31.xlsx

ISABELLA COUNTY
EQUALIZATION REPORT - 2019
Table Of ContentsPage
L-4024 Personal & Real Property Totals 1 to 3
Equalization Values 4 to 18
2018 to 2019 C.E.V. Comparison 19
2008 to 2019 C.E.V. Comparison 20
County Equalized Valuations Summary 21
Taxable Values to C.E.V. Percent Comparison 22
C.E.V. & T.V. Percent Increase by Class 23
C.E.V. & T.V. Charts 24 to 25
L-4046 2019 Report of Taxable Valuations 26 to 28
Taxable Value Summary 29
2018 to 2019 Taxable Comparison 30
2008 to 2019 Taxable Comparison 31
Parcel Count by Classification 2019 32
Classification Percent Report 2019 33 to 34
Industrial Facilities Tax Certificates Report (PA 198 of 1974) 35 to 37
DNR Lands (PA 513 of 2004 & PA 603 of 2012) 2019 38
QFP- Qualified Forest Program (PA 42 of 2013) 39 to 40
2019 Tax Increment Finance Capture Value Estimates 41
Top 20 Tax Payers Listing 2019 42 to 43
2018 Millage Rates 44 to 49
School District Numbers Defined 50 to 51
School District Valuations 2019 52 to 80
Property Class/Unit Code Key 81
2019 Local Unit Certification Levels 82
Local Supervisors and/or Assessors 83 to 84
H:\Jcn Excel\Equal_19\EQ REPORT TABLE OF CONTENTs 2019-12-31.xlsx

1

2

3

4

Equalization Report
ISABELLA
Page: DB: Isabella County Current A
04/15/201902:51 PM
1/6
Totals 39,762,500 39,762,500 972,900 50.00 972,900 40,735,400 40,735,400 1.67Developmental 0 50.00 0 1.000000Timber-Cutover 0 50.00 0 1.000000Residential 29,209,300 49.37 29,209,300 1.000000Industrial 258,400 49.83 258,400 1.000000Commercial 516,800 49.07 516,800 1.000000Agricultural 9,778,000 49.31 9,778,000 1.000000
-- 04 COLDWATER --
Totals 133,010,400 133,010,400 39,227,532 50.00 39,227,532 172,237,932 172,237,932 7.06Developmental 0 50.00 0 1.000000Timber-Cutover 0 50.00 0 1.000000Residential 61,863,600 49.79 61,863,600 1.000000Industrial 209,100 49.87 209,100 1.000000Commercial 8,690,900 49.72 8,690,900 1.000000Agricultural 62,246,800 49.80 62,246,800 1.000000
-- 03 COE --
Totals 110,857,600 110,857,600 12,088,000 50.00 12,088,000 122,945,600 122,945,600 5.04Developmental 0 50.00 0 1.000000Timber-Cutover 0 50.00 0 1.000000Residential 89,648,300 49.87 89,648,300 1.000000Industrial 354,100 49.80 354,100 1.000000Commercial 9,523,300 49.91 9,523,300 1.000000Agricultural 11,331,900 49.94 11,331,900 1.000000
-- 02 CHIPPEWA --
Totals 89,267,100 89,267,100 5,252,500 50.00 5,252,500 94,519,600 94,519,600 3.88Developmental 0 50.00 0 1.000000Timber-Cutover 0 50.00 0 1.000000Residential 69,905,600 49.57 69,905,600 1.000000Industrial 2,708,000 49.96 2,708,000 1.000000Commercial 1,764,900 49.21 1,764,900 1.000000Agricultural 14,888,600 49.30 14,888,600 1.000000
-- 01 BROOMFIELD --
Unit Real Ratio Real Factor Personal Ratio Personal Total Total TotalAssessment Assessed Equalized Assessed Equalized Assessed Equalized % County
5

Equalization Report
ISABELLA
Page: DB: Isabella County Current A
04/15/201902:51 PM
2/6
Totals 70,306,800 70,306,800 1,515,800 50.00 1,515,800 71,822,600 71,822,600 2.95Developmental 0 50.00 0 1.000000Timber-Cutover 0 50.00 0 1.000000Residential 58,033,200 49.74 58,033,200 1.000000Industrial 0 50.00 0 1.000000Commercial 216,900 50.00 216,900 1.000000Agricultural 12,056,700 49.39 12,056,700 1.000000
-- 08 GILMORE --
Totals 76,234,400 76,234,400 2,198,700 50.00 2,198,700 78,433,100 78,433,100 3.22Developmental 0 50.00 0 1.000000Timber-Cutover 0 50.00 0 1.000000Residential 38,399,400 49.87 38,399,400 1.000000Industrial 9,914,100 49.86 9,914,100 1.000000Commercial 685,200 49.80 685,200 1.000000Agricultural 27,235,700 49.97 27,235,700 1.000000
-- 07 FREMONT --
Totals 47,795,300 47,795,300 1,786,400 50.00 1,786,400 49,581,700 49,581,700 2.03Developmental 0 50.00 0 1.000000Timber-Cutover 0 50.00 0 1.000000Residential 26,415,200 49.51 26,415,200 1.000000Industrial 0 50.00 0 1.000000Commercial 674,900 49.50 674,900 1.000000Agricultural 20,705,200 49.87 20,705,200 1.000000
-- 06 DENVER --
Totals 151,834,400 151,834,400 4,532,600 50.00 4,532,600 156,367,000 156,367,000 6.41Developmental 0 50.00 0 1.000000Timber-Cutover 0 50.00 0 1.000000Residential 123,604,400 49.93 123,604,400 1.000000Industrial 1,948,500 49.53 1,948,500 1.000000Commercial 1,375,300 49.27 1,375,300 1.000000Agricultural 24,906,200 49.53 24,906,200 1.000000
-- 05 DEERFIELD --
Unit Real Ratio Real Factor Personal Ratio Personal Total Total TotalAssessment Assessed Equalized Assessed Equalized Assessed Equalized % County
6
Equalization Report
ISABELLA
Page: DB: Isabella County Current A
04/15/201902:51 PM
3/6
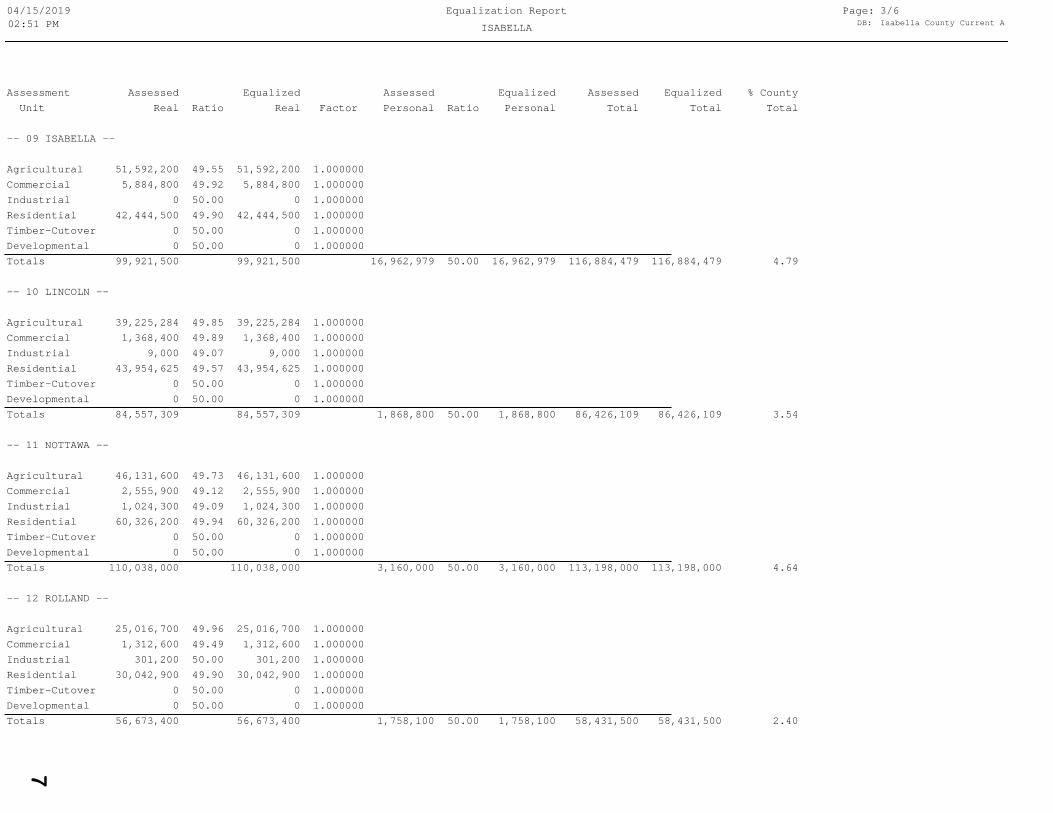
Totals 56,673,400 56,673,400 1,758,100 50.00 1,758,100 58,431,500 58,431,500 2.40Developmental 0 50.00 0 1.000000Timber-Cutover 0 50.00 0 1.000000Residential 30,042,900 49.90 30,042,900 1.000000Industrial 301,200 50.00 301,200 1.000000Commercial 1,312,600 49.49 1,312,600 1.000000Agricultural 25,016,700 49.96 25,016,700 1.000000
-- 12 ROLLAND --
Totals 110,038,000 110,038,000 3,160,000 50.00 3,160,000 113,198,000 113,198,000 4.64Developmental 0 50.00 0 1.000000Timber-Cutover 0 50.00 0 1.000000Residential 60,326,200 49.94 60,326,200 1.000000Industrial 1,024,300 49.09 1,024,300 1.000000Commercial 2,555,900 49.12 2,555,900 1.000000Agricultural 46,131,600 49.73 46,131,600 1.000000
-- 11 NOTTAWA --
Totals 84,557,309 84,557,309 1,868,800 50.00 1,868,800 86,426,109 86,426,109 3.54Developmental 0 50.00 0 1.000000Timber-Cutover 0 50.00 0 1.000000Residential 43,954,625 49.57 43,954,625 1.000000Industrial 9,000 49.07 9,000 1.000000Commercial 1,368,400 49.89 1,368,400 1.000000Agricultural 39,225,284 49.85 39,225,284 1.000000
-- 10 LINCOLN --
Totals 99,921,500 99,921,500 16,962,979 50.00 16,962,979 116,884,479 116,884,479 4.79Developmental 0 50.00 0 1.000000Timber-Cutover 0 50.00 0 1.000000Residential 42,444,500 49.90 42,444,500 1.000000Industrial 0 50.00 0 1.000000Commercial 5,884,800 49.92 5,884,800 1.000000Agricultural 51,592,200 49.55 51,592,200 1.000000
-- 09 ISABELLA --
Unit Real Ratio Real Factor Personal Ratio Personal Total Total TotalAssessment Assessed Equalized Assessed Equalized Assessed Equalized % County
7

Equalization Report
ISABELLA
Page: DB: Isabella County Current A
04/15/201902:51 PM
4/6
Totals 53,726,200 53,726,200 1,804,200 50.00 1,804,200 55,530,400 55,530,400 2.28Developmental 0 50.00 0 1.000000Timber-Cutover 0 50.00 0 1.000000Residential 23,686,900 49.95 23,686,900 1.000000Industrial 0 50.00 0 1.000000Commercial 1,491,400 49.84 1,491,400 1.000000Agricultural 28,547,900 49.97 28,547,900 1.000000
-- 16 WISE --
Totals 66,390,250 66,390,250 7,268,600 50.00 7,268,600 73,658,850 73,658,850 3.02Developmental 0 50.00 0 1.000000Timber-Cutover 0 50.00 0 1.000000Residential 30,129,600 49.91 30,129,600 1.000000Industrial 65,100 49.99 65,100 1.000000Commercial 1,916,200 49.15 1,916,200 1.000000Agricultural 34,279,350 49.82 34,279,350 1.000000
-- 15 VERNON --
Totals 418,268,600 418,268,600 32,838,600 50.00 32,838,600 451,107,200 451,107,200 18.50Developmental 0 50.00 0 1.000000Timber-Cutover 0 50.00 0 1.000000Residential 164,806,600 49.60 164,806,600 1.000000Industrial 4,221,100 49.32 4,221,100 1.000000Commercial 229,214,400 49.62 229,214,400 1.000000Agricultural 20,026,500 49.75 20,026,500 1.000000
-- 14 UNION --
Totals 119,015,500 119,015,500 4,415,900 50.00 4,415,900 123,431,400 123,431,400 5.06Developmental 0 50.00 0 1.000000Timber-Cutover 0 50.00 0 1.000000Residential 103,984,400 49.70 103,984,400 1.000000Industrial 578,200 49.18 578,200 1.000000Commercial 4,822,400 49.32 4,822,400 1.000000Agricultural 9,630,500 49.41 9,630,500 1.000000
-- 13 SHERMAN --
Unit Real Ratio Real Factor Personal Ratio Personal Total Total TotalAssessment Assessed Equalized Assessed Equalized Assessed Equalized % County
8

Equalization Report
ISABELLA
Page: DB: Isabella County Current A
04/15/201902:51 PM
5/6
Totals 8,865,000 8,865,000 1,306,400 50.00 1,306,400 10,171,400 10,171,400 0.42Developmental 0 50.00 0 1.000000Timber-Cutover 0 50.00 0 1.000000Residential 865,000 49.33 865,000 1.000000Industrial 3,778,900 49.88 3,778,900 1.000000Commercial 4,221,100 49.35 4,221,100 1.000000Agricultural 0 50.00 0 1.000000
-- 18 CLARE --
Totals 534,700,475 534,700,475 28,265,000 50.00 28,265,000 562,965,475 562,965,475 23.09Developmental 0 50.00 0 1.000000Timber-Cutover 0 50.00 0 1.000000Residential 267,769,675 49.86 267,769,675 1.000000Industrial 9,228,700 49.87 9,228,700 1.000000Commercial 257,702,100 49.58 257,702,100 1.000000Agricultural 0 50.00 0 1.000000
-- 17 MT. PLEASANT --
Unit Real Ratio Real Factor Personal Ratio Personal Total Total TotalAssessment Assessed Equalized Assessed Equalized Assessed Equalized % County
9

Equalization Report
ISABELLA
Page: DB: Isabella County Current A
04/15/201902:51 PM
6/6
2,271,224,734 2,271,224,734 100.00 167,223,011 167,223,011 100.00 100.00 2,438,447,745 2,438,447,745Personal 167,223,011 167,223,011 6.86 6.86Developmental 0 0 0.00 0.00 0.00Timber-Cutover 0 0 0.00 0.00 0.00Residential 1,265,089,400 1,265,089,400 55.70 51.88 51.88Industrial 34,598,700 34,598,700 1.52 1.42 1.42Commercial 533,937,500 533,937,500 23.51 21.90 21.90Agricultural 437,599,134 437,599,134 19.27 17.95 17.95
Real Real Total Personal Personal % County % County Total TotalGrand Totals Assessed Equalized % Real Assessed Equalized Assessed Equalized Assessed Equalized
10

ISABELLA COUNTY
RECOMMENDED REAL & PERSONAL C.E.V.'S
2019
TOTAL TOTALUNIT UNIT TOTAL REAL PERSONAL REAL & PERSONAL# NAME C.E.V. C.E.V. C.E.V.--------- -------------------- ------------------------- ------------------------- ---------------------------01 BROOMFIELD 89,267,100 5,252,500 94,519,60002 CHIPPEWA 110,857,600 12,088,000 122,945,60003 COE 133,010,400 39,227,532 172,237,93204 COLDWATER 39,762,500 972,900 40,735,400
05 DEERFIELD 151,834,400 4,532,600 156,367,00006 DENVER 47,795,300 1,786,400 49,581,70007 FREMONT 76,234,400 2,198,700 78,433,10008 GILMORE 70,306,800 1,515,800 71,822,600
09 ISABELLA 99,921,500 16,962,979 116,884,47910 LINCOLN 84,557,309 1,868,800 86,426,10911 NOTTAWA 110,038,000 3,160,000 113,198,00012 ROLLAND 56,673,400 1,758,100 58,431,500
13 SHERMAN 119,015,500 4,415,900 123,431,40014 UNION 418,268,600 32,838,600 451,107,20015 VERNON 66,390,250 7,268,600 73,658,85016 WISE 53,726,200 1,804,200 55,530,400
------------------------- ------------------------- ---------------------------TOWNSHIPTOTALS 1,727,659,259 137,651,611 1,865,310,870
------------------------- ------------------------- ---------------------------
17 MT PLEASANT 534,700,475 28,265,000 562,965,47518 CLARE 8,865,000 1,306,400 10,171,400
------------------------- ------------------------- ---------------------------CITIESTOTAL 543,565,475 29,571,400 573,136,875
------------------------- ------------------------- ---------------------------
COUNTYTOTAL 2,271,224,734 167,223,011 2,438,447,745
============== ============== ===============
VILLAGE TOTALS (ALREADY ADDED INTO ABOVE TOWNSHIP TOTALS)21 LAKE ISABELLA 91,921,600 939,600 92,861,200
21-01 BROOMFIELD 37,969,500 203,800 38,173,300
22-13 SHERMAN 53,952,100 735,800 54,687,900
31 SHEPHERD 33,387,300 942,500 34,329,80091 ROSBUSH 9,925,400 6,130,400 16,055,800
------------------------- ------------------------- ---------------------------TOTAL 135,234,300 8,012,500 143,246,800
------------------------- ------------------------- ---------------------------
H:\Jcn Excel\Equal_19\EQ REPORT SEV TOTALS...2019 WITH CERT TEST 2019-04-15.xls
11

ISABELLA COUNTY
UNIT UNIT ASSESSED RECOMM'D RECOMMENDED %# NAME VALUE RATIO T.C.V. FACTOR C.E.V. OF CLASS--------- -------------------- -------------------- ------------ -------------------- ------------- ----------------------- ---------------01 BROOMFIELD 14,888,600 49.30% 30,200,791 1.0000 14,888,600 3.40%02 CHIPPEWA 11,331,900 49.94% 22,688,988 1.0000 11,331,900 2.59%03 COE 62,246,800 49.80% 124,998,223 1.0000 62,246,800 14.22%04 COLDWATER 9,778,000 49.31% 19,827,823 1.0000 9,778,000 2.23%
05 DEERFIELD 24,906,200 49.53% 50,284,839 1.0000 24,906,200 5.69%06 DENVER 20,705,200 49.87% 41,515,269 1.0000 20,705,200 4.73%07 FREMONT 27,235,700 49.97% 54,506,297 1.0000 27,235,700 6.22%08 GILMORE 12,056,700 49.39% 24,410,020 1.0000 12,056,700 2.76%
09 ISABELLA 51,592,200 49.55% 104,115,414 1.0000 51,592,200 11.79%10 LINCOLN 39,225,284 49.85% 78,681,909 1.0000 39,225,284 8.96%11 NOTTAWA 46,131,600 49.73% 92,772,067 1.0000 46,131,600 10.54%12 ROLLAND 25,016,700 49.96% 50,072,538 1.0000 25,016,700 5.72%
13 SHERMAN 9,630,500 49.41% 19,492,150 1.0000 9,630,500 2.20%14 UNION 20,026,500 49.75% 40,256,896 1.0000 20,026,500 4.58%15 VERNON 34,279,350 49.82% 68,803,916 1.0000 34,279,350 7.83%16 WISE 28,547,900 49.97% 57,126,098 1.0000 28,547,900 6.52%
-------------------- ------------ -------------------- ------------- ----------------------- ---------------TOWNSHIPTOTALS 437,599,134 49.74% 879,753,238 437,599,134 100.00%
-------------------- ------------ -------------------- ------------- ----------------------- ---------------
17 MT PLEASANT 0 0.00% 0 1.0000 0 0.00%18 CLARE 0 0.00% 0 1.0000 0 0.00%
0 0.00% 0 0.0000 0 0.00%-------------------- ------------ -------------------- ------------- ----------------------- ---------------
CITIESTOTAL 0 0.00% 0 0 0.00%
-------------------- ------------ -------------------- ------------- ----------------------- ---------------
COUNTYTOTAL 437,599,134 49.74% 879,753,238 437,599,134 100.00%
=========== ====== =========== ======= ============= ========
VILLAGE TOTALS (ALREADY ADDED INTO ABOVE TOWNSHIP TOTALS)21 LAKE ISABELLA 0 0 0 0.00%
21-01 BROOMFIELD 0 0.00% 0 1.0000 0 0.00%
22-13 SHERMAN 0 0.00% 0 1.0000 0 0.00%
31 SHEPHERD 48,600 49.80% 97,594 1.0000 48,600 0.01%91 ROSEBUSH 510,500 49.55% 1,030,212 1.0000 510,500 0.12%
-------------------- ------------ -------------------- ------------- ----------------------- ---------------TOTAL 559,100 49.57% 1,127,806 559,100 0.13%
-------------------- ------------ -------------------- ------------- ----------------------- ---------------
::
AGRICULTURAL CLASS (101)
2019
H:\Jcn Excel\Equal_19\EQ REPORT SEV TOTALS...2019 WITH CERT TEST 2019-04-15.xls
12

ISABELLA COUNTY
UNIT UNIT ASSESSED RECOMM'D RECOMMENDED %# NAME VALUE RATIO T.C.V. FACTOR C.E.V. OF CLASS--------- -------------------- -------------------- ------------ -------------------- ------------- ----------------------- ---------------01 BROOMFIELD 1,764,900 49.21% 3,586,368 1.0000 1,764,900 0.33%02 CHIPPEWA 9,523,300 49.91% 19,079,701 1.0000 9,523,300 1.78%03 COE 8,690,900 49.72% 17,479,271 1.0000 8,690,900 1.63%04 COLDWATER 516,800 49.07% 1,053,225 1.0000 516,800 0.10%
05 DEERFIELD 1,375,300 49.27% 2,791,189 1.0000 1,375,300 0.26%06 DENVER 674,900 49.50% 1,363,329 1.0000 674,900 0.13%07 FREMONT 685,200 49.80% 1,375,926 1.0000 685,200 0.13%08 GILMORE RA 216,900 50.00% 433,800 1.0000 216,900 0.04%
09 ISABELLA 5,884,800 49.92% 11,789,129 1.0000 5,884,800 1.10%10 LINCOLN 1,368,400 49.89% 2,742,705 1.0000 1,368,400 0.26%11 NOTTAWA 2,555,900 49.12% 5,202,952 1.0000 2,555,900 0.48%12 ROLLAND 1,312,600 49.49% 2,652,083 1.0000 1,312,600 0.25%
13 SHERMAN 4,822,400 49.32% 9,778,474 1.0000 4,822,400 0.90%14 UNION 229,214,400 49.62% 461,927,882 1.0000 229,214,400 42.93%15 VERNON 1,916,200 49.15% 3,898,700 1.0000 1,916,200 0.36%16 WISE 1,491,400 49.84% 2,992,327 1.0000 1,491,400 0.28%
-------------------- ------------ -------------------- ------------- ----------------------- ---------------TOWNSHIPTOTALS 272,014,300 49.62% 548,147,061 272,014,300 50.94%
-------------------- ------------ -------------------- ------------- ----------------------- ---------------
17 MT PLEASANT 257,702,100 49.58% 519,780,626 1.0000 257,702,100 48.26%18 CLARE 4,221,100 49.35% 8,552,987 1.0000 4,221,100 0.79%
-------------------- ------------ -------------------- ------------- ----------------------- ---------------CITIESTOTAL 261,923,200 49.58% 528,333,613 261,923,200 49.06%
-------------------- ------------ -------------------- ------------- ----------------------- ---------------
COUNTYTOTAL 533,937,500 49.60% 1,076,480,674 533,937,500 100.00%
=========== ====== =========== ======= ============= ========
VILLAGE TOTALS (ALREADY ADDED INTO ABOVE TOWNSHIP TOTALS)21 LAKE ISABELLA 2,414,300 4,898,526 2,414,300 0.45%
21-01 BROOMFIELD 693,200 49.21% 1,408,618 1.0000 693,200 0.13%
22-13 SHERMAN 1,721,100 49.32% 3,489,908 1.0000 1,721,100 0.32%
31 SHEPHERD 6,121,000 49.72% 12,310,649 1.0000 6,121,000 1.15%91 ROSEBUSH 3,232,900 49.92% 6,476,529 1.0000 3,232,900 0.61%
-------------------- ------------ -------------------- ------------- ----------------------- ---------------TOTAL 11,768,200 49.68% 23,685,704 11,768,200 2.20%
-------------------- ------------ -------------------- ------------- ----------------------- ---------------::
2019
COMMERCIAL CLASS (201)
H:\Jcn Excel\Equal_19\EQ REPORT SEV TOTALS...2019 WITH CERT TEST 2019-04-15.xls
13

ISABELLA COUNTY
UNIT UNIT ASSESSED RECOMM'D RECOMMENDED %# NAME VALUE RATIO T.C.V. FACTOR C.E.V. OF CLASS--------- -------------------- -------------------- ------------ -------------------- ------------- ----------------------- ---------------01 BROOMFIELD 2,708,000 49.96% 5,420,004 1.0000 2,708,000 7.83%02 CHIPPEWA 354,100 49.80% 711,083 1.0000 354,100 1.02%03 COE 209,100 49.87% 419,322 1.0000 209,100 0.60%04 COLDWATER 258,400 49.83% 518,535 1.0000 258,400 0.75%
05 DEERFIELD 1,948,500 49.53% 3,934,142 1.0000 1,948,500 5.63%06 DENVER 0 0.00% 0 1.0000 0 0.00%07 FREMONT 9,914,100 49.86% 19,883,056 1.0000 9,914,100 28.65%08 GILMORE 0 0.00% 0 1.0000 0 0.00%
09 ISABELLA 0 0.00% 0 1.0000 0 0.00%10 LINCOLN 9,000 49.07% 18,343 1.0000 9,000 0.03%11 NOTTAWA 1,024,300 49.09% 2,086,420 1.0000 1,024,300 2.96%12 ROLLAND 301,200 50.00% 602,444 1.0000 301,200 0.87%
13 SHERMAN 578,200 49.18% 1,175,769 1.0000 578,200 1.67%14 UNION 4,221,100 49.32% 8,557,884 1.0000 4,221,100 12.20%15 VERNON 65,100 49.99% 130,231 1.0000 65,100 0.19%16 WISE 0 0.00% 0 1.0000 0 0.00%
-------------------- ------------ -------------------- ------------- ----------------------- ---------------TOWNSHIPTOTALS 21,591,100 49.68% 43,457,233 21,591,100 62.40%
-------------------- ------------ -------------------- ------------- ----------------------- ---------------
17 MT PLEASANT 9,228,700 49.87% 18,505,890 1.0000 9,228,700 26.67%18 CLARE 3,778,900 49.88% 7,576,669 1.0000 3,778,900 10.92%
-------------------- ------------ -------------------- ------------- ----------------------- ---------------CITIESTOTAL 13,007,600 49.87% 26,082,559 13,007,600 37.60%
-------------------- ------------ -------------------- ------------- ----------------------- ---------------
COUNTYTOTAL 34,598,700 #DIV/0! 0 34,598,700 100.00%
=========== ====== =========== ======= ============= ========
VILLAGE TOTALS (ALREADY ADDED INTO ABOVE TOWNSHIP TOTALS)21 LAKE ISABELLA 249,600 507,561 249,600 0.72%
21-01 BROOMFIELD 0 0.00% 0 1.0000 0 0.00%
22-13 SHERMAN 249,600 49.18% 507,561 1.0000 249,600 0.72%
31 SHEPHERD 192,200 49.87% 385,431 1.0000 192,200 0.56%91 ROSEBUSH 0 0.00% 0 1.0000 0 0.00%
-------------------- ------------ -------------------- ------------- ----------------------- ---------------TOTAL 441,800 49.47% 892,992 441,800 1.28%
-------------------- ------------ -------------------- ------------- ----------------------- ---------------::
INDUSTRIAL CLASS (301)
2019
H:\Jcn Excel\Equal_19\EQ REPORT SEV TOTALS...2019 WITH CERT TEST 2019-04-15.xls
14

ISABELLA COUNTY
UNIT UNIT ASSESSED RECOMM'D RECOMMENDED %# NAME VALUE RATIO T.C.V. FACTOR C.E.V. OF CLASS--------- -------------------- -------------------- ------------ -------------------- ------------- ----------------------- ---------------01 BROOMFIELD 69,905,600 49.57% 141,036,323 1.0000 69,905,600 5.53%02 CHIPPEWA 89,648,300 49.87% 179,764,033 1.0000 89,648,300 7.09%03 COE 61,863,600 49.79% 124,240,851 1.0000 61,863,600 4.89%04 COLDWATER 29,209,300 49.37% 59,163,555 1.0000 29,209,300 2.31%
05 DEERFIELD 123,604,400 49.93% 247,562,140 1.0000 123,604,400 9.77%06 DENVER 26,415,200 49.51% 53,349,677 1.0000 26,415,200 2.09%07 FREMONT 38,399,400 49.87% 77,006,235 1.0000 38,399,400 3.04%08 GILMORE 58,033,200 49.74% 116,674,581 1.0000 58,033,200 4.59%
09 ISABELLA 42,444,500 49.90% 85,063,233 1.0000 42,444,500 3.36%10 LINCOLN 43,954,625 49.57% 88,665,980 1.0000 43,954,625 3.47%11 NOTTAWA 60,326,200 49.94% 120,792,166 1.0000 60,326,200 4.77%12 ROLLAND 30,042,900 49.90% 60,211,739 1.0000 30,042,900 2.37%
13 SHERMAN 103,984,400 49.70% 209,219,539 1.0000 103,984,400 8.22%14 UNION 164,806,600 49.60% 332,239,484 1.0000 164,806,600 13.03%15 VERNON 30,129,600 49.91% 60,369,946 1.0000 30,129,600 2.38%16 WISE 23,686,900 49.95% 47,424,453 1.0000 23,686,900 1.87%
-------------------- ------------ -------------------- ------------- ----------------------- ---------------TOWNSHIPTOTALS 996,454,725 49.75% 2,002,783,935 996,454,725 78.77%
-------------------- ------------ -------------------- ------------- ----------------------- ---------------
17 MT PLEASANT 267,769,675 49.86% 537,066,423 1.0000 267,769,675 21.17%18 CLARE 865,000 49.33% 1,753,638 1.0000 865,000 0.07%
-------------------- ------------ -------------------- ------------- ----------------------- ---------------CITIESTOTAL 268,634,675 49.86% 538,820,061 268,634,675 21.23%
-------------------- ------------ -------------------- ------------- ----------------------- ---------------
COUNTYTOTAL 1,265,089,400 49.78% 2,541,603,996 1,265,089,400 100.00%
=========== ====== =========== ======= ============= ========
VILLAGE TOTALS (ALREADY ADDED INTO ABOVE TOWNSHIP TOTALS)21 LAKE ISABELLA 89,257,700 179,793,922 89,257,700 7.06%
21-01 BROOMFIELD 37,276,300 49.57% 75,205,882 1.0000 37,276,300 2.95%
22-13 SHERMAN 51,981,400 49.70% 104,588,040 1.0000 51,981,400 4.11%
31 SHEPHERD 27,025,500 49.79% 54,275,392 1.0000 27,025,500 2.14%91 ROSEBUSH 6,182,000 49.90% 12,389,377 1.0000 6,182,000 0.49%
-------------------- ------------ -------------------- ------------- ----------------------- ---------------TOTAL 122,465,200 49.69% 246,458,691 122,465,200 9.68%
-------------------- ------------ -------------------- ------------- ----------------------- ---------------::
RESIDENTIAL CLASS (401)
2019
H:\Jcn Excel\Equal_19\EQ REPORT SEV TOTALS...2019 WITH CERT TEST 2019-04-15.xls
15
ISABELLA COUNTY
UNIT UNIT ASSESSED RECOMM'D RECOMMENDED %# NAME VALUE RATIO T.C.V. FACTOR C.E.V. OF CLASS--------- -------------------- -------------------- ------------ -------------------- ------------- ----------------------- ---------------01 BROOMFIELD 236,200 50.00% 472,400 1.0000 236,200 0.42%02 CHIPPEWA 2,970,600 50.00% 5,941,200 1.0000 2,970,600 5.26%03 COE 1,001,500 50.00% 2,003,000 1.0000 1,001,500 1.77%04 COLDWATER 0 0.00% 0 1.0000 0 0.00%
05 DEERFIELD 1,919,500 50.00% 3,839,000 1.0000 1,919,500 3.40%06 DENVER 0 0.00% 0 1.0000 0 0.00%07 FREMONT 222,800 50.00% 445,600 1.0000 222,800 0.39%08 GILMORE 28,400 50.00% 56,800 1.0000 28,400 0.05%
09 ISABELLA 6,088,079 50.00% 12,176,158 1.0000 6,088,079 10.77%10 LINCOLN 279,600 50.00% 559,200 1.0000 279,600 0.49%11 NOTTAWA 430,500 50.00% 861,000 1.0000 430,500 0.76%12 ROLLAND 95,300 50.00% 190,600 1.0000 95,300 0.17%
13 SHERMAN 301,100 50.00% 602,200 1.0000 301,100 0.53%14 UNION 19,101,300 50.00% 38,202,600 1.0000 19,101,300 33.81%15 VERNON 2,081,300 50.00% 4,162,600 1.0000 2,081,300 3.68%16 WISE 317,100 50.00% 634,200 1.0000 317,100 0.56%
-------------------- ------------ -------------------- ------------- ----------------------- ---------------TOWNSHIPTOTALS 35,073,279 50.00% 70,146,558 35,073,279 62.07%
-------------------- ------------ -------------------- ------------- ----------------------- ---------------
17 MT PLEASANT 20,891,700 50.00% 41,783,400 1.0000 20,891,700 36.97%18 CLARE 537,900 50.00% 1,075,800 1.0000 537,900 0.95%
-------------------- ------------ -------------------- ------------- ----------------------- ---------------CITIESTOTAL 21,429,600 50.00% 42,859,200 21,429,600 37.93%
-------------------- ------------ -------------------- ------------- ----------------------- ---------------
COUNTYTOTAL 56,502,879 50.00% 113,005,758 56,502,879 100.00%
=========== ====== =========== ======= ============= ========
VILLAGE TOTALS (ALREADY ADDED INTO ABOVE TOWNSHIP TOTALS)21 LAKE ISABELLA 76,600 153,200 76,600 0.14%
21-01 BROOMFIELD 0 50.00% 0 1.0000 0 0.00%
22-13 SHERMAN 76,600 50.00% 153,200 1.0000 76,600 0.14%
31 SHEPHERD 63,000 50.00% 126,000 1.0000 63,000 0.11%91 ROSEBUSH 5,701,600 50.00% 11,403,200 1.0000 5,701,600 10.09%
-------------------- ------------ -------------------- ------------- ----------------------- ---------------TOTAL 5,841,200 50.00% 11,682,400 5,841,200 10.34%
-------------------- ------------ -------------------- ------------- ----------------------- ---------------::
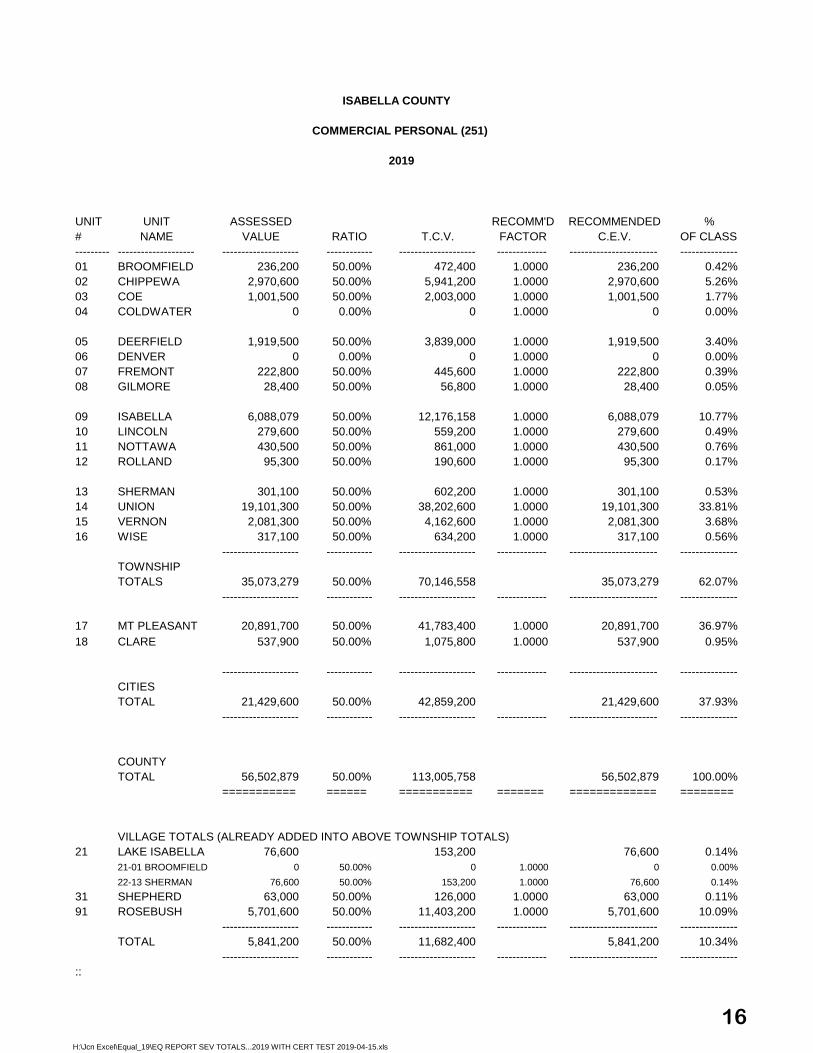
2019
COMMERCIAL PERSONAL (251)
H:\Jcn Excel\Equal_19\EQ REPORT SEV TOTALS...2019 WITH CERT TEST 2019-04-15.xls
16

ISABELLA COUNTY
UNIT UNIT ASSESSED RECOMM'D RECOMMENDED %# NAME VALUE RATIO T.C.V. FACTOR C.E.V. OF CLASS--------- -------------------- -------------------- ------------ -------------------- ------------- ----------------------- ---------------01 BROOMFIELD 2,904,600 50.00% 5,809,200 1.0000 2,904,600 7.74%02 CHIPPEWA 290,700 50.00% 581,400 1.0000 290,700 0.77%03 COE 30,405,000 50.00% 60,810,000 1.0000 30,405,000 81.02%04 COLDWATER 0 0.00% 0 1.0000 0 0.00%
05 DEERFIELD 0 0.00% 0 1.0000 0 0.00%06 DENVER 0 0.00% 0 1.0000 0 0.00%07 FREMONT 673,900 50.00% 1,347,800 1.0000 673,900 1.80%08 GILMORE 0 0.00% 0 1.0000 0 0.00%
09 ISABELLA 0 0.00% 0 1.0000 0 0.00%10 LINCOLN 0 0.00% 0 1.0000 0 0.00%11 NOTTAWA 208,400 50.00% 416,800 1.0000 208,400 0.56%12 ROLLAND 38,200 50.00% 76,400 1.0000 38,200 0.10%
13 SHERMAN 6,200 50.00% 12,400 1.0000 6,200 0.02%14 UNION 2,228,700 50.00% 4,457,400 1.0000 2,228,700 5.94%15 VERNON 0 0.00% 0 1.0000 0 0.00%16 WISE 0 0.00% 0 1.0000 0 0.00%
-------------------- ------------ -------------------- ------------- ----------------------- ---------------TOWNSHIPTOTALS 36,755,700 50.00% 73,511,400 36,755,700 97.94%
-------------------- ------------ -------------------- ------------- ----------------------- ---------------
17 MT PLEASANT 581,900 50.00% 1,163,800 1.0000 581,900 1.55%18 CLARE 189,700 50.00% 379,400 1.0000 189,700 0.51%
-------------------- ------------ -------------------- ------------- ----------------------- ---------------CITIESTOTAL 771,600 50.00% 1,543,200 771,600 2.06%
-------------------- ------------ -------------------- ------------- ----------------------- ---------------
COUNTYTOTAL 37,527,300 50.00% 75,054,600 37,527,300 100.00%
=========== ====== =========== ======= ============= ========
VILLAGE TOTALS (ALREADY ADDED INTO ABOVE TOWNSHIP TOTALS)21 LAKE ISABELLA 0 0 0 0.00%
21-01 BROOMFIELD 0 0.00% 0 1.0000 0 0.00%
22-13 SHERMAN 0 0.00% 0 1.0000 0 0.00%
31 SHEPHERD 63,000 50.00% 126,000 1.0000 63,000 0.17%91 ROSEBUSH 0 0.00% 0 1.0000 0 0.00%
-------------------- ------------ -------------------- ------------- ----------------------- ---------------TOTAL 63,000 50.00% 126,000 63,000 0.17%
-------------------- ------------ -------------------- ------------- ----------------------- ---------------::
INDUSTRIAL PERSONAL (351)
2019
H:\Jcn Excel\Equal_19\EQ REPORT SEV TOTALS...2019 WITH CERT TEST 2019-04-15.xls
17

ISABELLA COUNTY
UNIT UNIT ASSESSED RECOMM'D RECOMMENDED %# NAME VALUE RATIO T.C.V. FACTOR C.E.V. OF CLASS--------- -------------------- -------------------- ------------ -------------------- ------------- ----------------------- ---------------01 BROOMFIELD 2,111,700 50.00% 4,223,400 1.0000 2,111,700 2.89%02 CHIPPEWA 8,826,700 50.00% 17,653,400 1.0000 8,826,700 12.06%03 COE 7,821,032 50.00% 15,642,064 1.0000 7,821,032 10.69%04 COLDWATER 972,900 50.00% 1,945,800 1.0000 972,900 1.33%
05 DEERFIELD 2,613,100 50.00% 5,226,200 1.0000 2,613,100 3.57%06 DENVER 1,786,400 50.00% 3,572,800 1.0000 1,786,400 2.44%07 FREMONT 1,302,000 50.00% 2,604,000 1.0000 1,302,000 1.78%08 GILMORE 1,487,400 50.00% 2,974,800 1.0000 1,487,400 2.03%
09 ISABELLA 10,874,900 50.00% 21,749,800 1.0000 10,874,900 14.86%10 LINCOLN 1,589,200 50.00% 3,178,400 1.0000 1,589,200 2.17%11 NOTTAWA 2,521,100 50.00% 5,042,200 1.0000 2,521,100 3.44%12 ROLLAND 1,624,600 50.00% 3,249,200 1.0000 1,624,600 2.22%
13 SHERMAN 4,108,600 50.00% 8,217,200 1.0000 4,108,600 5.61%14 UNION 11,508,600 50.00% 23,017,200 1.0000 11,508,600 15.72%15 VERNON 5,187,300 50.00% 10,374,600 1.0000 5,187,300 7.09%16 WISE 1,487,100 50.00% 2,974,200 1.0000 1,487,100 2.03%
-------------------- ------------ -------------------- ------------- ----------------------- ---------------TOWNSHIPTOTALS 65,822,632 50.00% 131,645,264 65,822,632 89.93%
-------------------- ------------ -------------------- ------------- ----------------------- ---------------
17 MT PLEASANT 6,791,400 50.00% 13,582,800 1.0000 6,791,400 9.28%18 CLARE 578,800 50.00% 1,157,600 1.0000 578,800 0.79%
-------------------- ------------ -------------------- ------------- ----------------------- ---------------CITIESTOTAL 7,370,200 50.00% 14,740,400 7,370,200 10.07%
-------------------- ------------ -------------------- ------------- ----------------------- ---------------
COUNTYTOTAL 73,192,832 50.00% 146,385,664 73,192,832 100.00%
=========== ====== =========== ======= ============= ========
VILLAGE TOTALS (ALREADY ADDED INTO ABOVE TOWNSHIP TOTALS)21 LAKE ISABELLA 863,000 1,726,000 863,000 1.18%
21-01 BROOMFIELD 203,800 50.00% 407,600 1.0000 203,800 0.28%
22-13 SHERMAN 659,200 50.00% 1,318,400 1.0000 659,200 0.90%
31 SHEPHERD 816,500 50.00% 1,633,000 1.0000 816,500 1.12%91 ROSEBUSH 428,800 50.00% 857,600 1.0000 428,800 0.59%
-------------------- ------------ -------------------- ------------- ----------------------- ---------------TOTAL 2,108,300 50.00% 4,216,600 2,108,300 1.70%
-------------------- ------------ -------------------- ------------- ----------------------- ---------------::
UTILITY PERSONAL (551)
2019
H:\Jcn Excel\Equal_19\EQ REPORT SEV TOTALS...2019 WITH CERT TEST 2019-04-15.xls
18
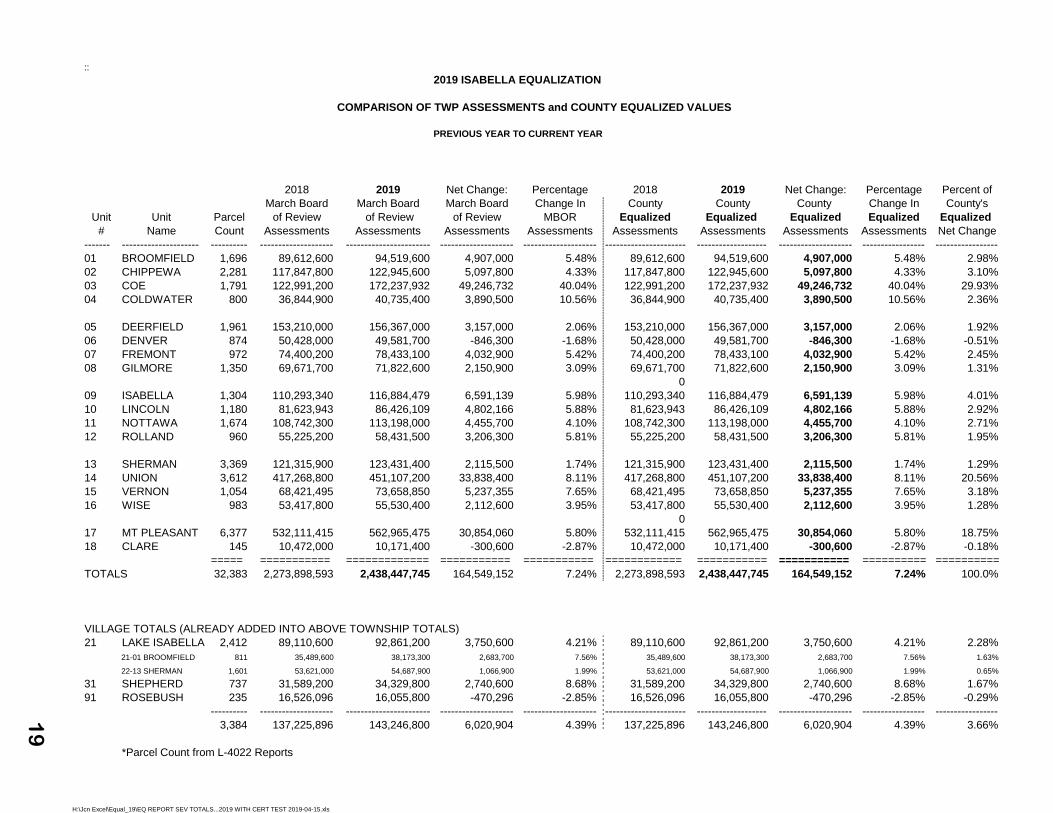
::2019 ISABELLA EQUALIZATION
COMPARISON OF TWP ASSESSMENTS and COUNTY EQUALIZED VALUES
PREVIOUS YEAR TO CURRENT YEAR
2018 2019 Net Change: Percentage 2018 2019 Net Change: Percentage Percent ofMarch Board March Board March Board Change In County County County Change In County's
Unit Unit Parcel of Review of Review of Review MBOR Equalized Equalized Equalized Equalized Equalized # Name Count Assessments Assessments Assessments Assessments Assessments Assessments Assessments Assessments Net Change
------- --------------------- ---------- -------------------- ----------------------- -------------------- -------------------- ---------------------- ------------------- -------------------- ----------------- -----------------01 BROOMFIELD 1,696 89,612,600 94,519,600 4,907,000 5.48% 89,612,600 94,519,600 4,907,000 5.48% 2.98%02 CHIPPEWA 2,281 117,847,800 122,945,600 5,097,800 4.33% 117,847,800 122,945,600 5,097,800 4.33% 3.10%03 COE 1,791 122,991,200 172,237,932 49,246,732 40.04% 122,991,200 172,237,932 49,246,732 40.04% 29.93%04 COLDWATER 800 36,844,900 40,735,400 3,890,500 10.56% 36,844,900 40,735,400 3,890,500 10.56% 2.36%
05 DEERFIELD 1,961 153,210,000 156,367,000 3,157,000 2.06% 153,210,000 156,367,000 3,157,000 2.06% 1.92%06 DENVER 874 50,428,000 49,581,700 -846,300 -1.68% 50,428,000 49,581,700 -846,300 -1.68% -0.51%07 FREMONT 972 74,400,200 78,433,100 4,032,900 5.42% 74,400,200 78,433,100 4,032,900 5.42% 2.45%08 GILMORE 1,350 69,671,700 71,822,600 2,150,900 3.09% 69,671,700 71,822,600 2,150,900 3.09% 1.31%
009 ISABELLA 1,304 110,293,340 116,884,479 6,591,139 5.98% 110,293,340 116,884,479 6,591,139 5.98% 4.01%10 LINCOLN 1,180 81,623,943 86,426,109 4,802,166 5.88% 81,623,943 86,426,109 4,802,166 5.88% 2.92%11 NOTTAWA 1,674 108,742,300 113,198,000 4,455,700 4.10% 108,742,300 113,198,000 4,455,700 4.10% 2.71%12 ROLLAND 960 55,225,200 58,431,500 3,206,300 5.81% 55,225,200 58,431,500 3,206,300 5.81% 1.95%
13 SHERMAN 3,369 121,315,900 123,431,400 2,115,500 1.74% 121,315,900 123,431,400 2,115,500 1.74% 1.29%14 UNION 3,612 417,268,800 451,107,200 33,838,400 8.11% 417,268,800 451,107,200 33,838,400 8.11% 20.56%15 VERNON 1,054 68,421,495 73,658,850 5,237,355 7.65% 68,421,495 73,658,850 5,237,355 7.65% 3.18%16 WISE 983 53,417,800 55,530,400 2,112,600 3.95% 53,417,800 55,530,400 2,112,600 3.95% 1.28%
017 MT PLEASANT 6,377 532,111,415 562,965,475 30,854,060 5.80% 532,111,415 562,965,475 30,854,060 5.80% 18.75%18 CLARE 145 10,472,000 10,171,400 -300,600 -2.87% 10,472,000 10,171,400 -300,600 -2.87% -0.18%
===== =========== ============= =========== =========== ============ =========== =========== ========== ==========TOTALS 32,383 2,273,898,593 2,438,447,745 164,549,152 7.24% 2,273,898,593 2,438,447,745 164,549,152 7.24% 100.0%
VILLAGE TOTALS (ALREADY ADDED INTO ABOVE TOWNSHIP TOTALS)21 LAKE ISABELLA 2,412 89,110,600 92,861,200 3,750,600 4.21% 89,110,600 92,861,200 3,750,600 4.21% 2.28%
21-01 BROOMFIELD 811 35,489,600 38,173,300 2,683,700 7.56% 35,489,600 38,173,300 2,683,700 7.56% 1.63%
22-13 SHERMAN 1,601 53,621,000 54,687,900 1,066,900 1.99% 53,621,000 54,687,900 1,066,900 1.99% 0.65%
31 SHEPHERD 737 31,589,200 34,329,800 2,740,600 8.68% 31,589,200 34,329,800 2,740,600 8.68% 1.67%91 ROSEBUSH 235 16,526,096 16,055,800 -470,296 -2.85% 16,526,096 16,055,800 -470,296 -2.85% -0.29%
---------- -------------------- ----------------------- -------------------- -------------------- ---------------------- ------------------- -------------------- ----------------- -----------------3,384 137,225,896 143,246,800 6,020,904 4.39% 137,225,896 143,246,800 6,020,904 4.39% 3.66%
*Parcel Count from L-4022 Reports
H:\Jcn Excel\Equal_19\EQ REPORT SEV TOTALS...2019 WITH CERT TEST 2019-04-15.xls
19

ISABELLA COUNTY - Comparison of County Equalized Valuations - Years 2008 to 2019 (50% of True Cash Valuation) C.E.V.
UNIT 2008 2009 2010 2011 2012 2013 2014 2015 2016 2017 2018 2019
--------------------- ---------------------- ---------------------- ---------------------- ---------------------- ----------------------- ---------------------- ----------------------------------------------------------------------------------------------------------------------------------------------------
BROOMFIELD 94,912,000 91,987,599 87,869,475 83,490,529 83,653,100 83,390,756 84,109,249 87,503,500 91,148,600 89,954,293 89,612,600 94,519,600
CHIPPEWA 128,582,450 125,554,150 119,060,750 114,534,250 103,908,100 107,664,800 108,462,400 112,698,200 117,797,300 114,199,300 117,847,800 122,945,600
COE 110,527,281 105,828,650 101,948,332 98,981,500 97,309,900 100,218,200 104,900,900 114,313,861 117,632,400 118,619,200 122,991,200 172,237,932
COLDWATER 40,381,661 41,522,027 35,677,172 34,975,969 31,170,700 33,588,800 32,959,300 33,545,400 30,878,600 33,218,700 36,844,900 40,735,400
DEERFIELD 145,420,700 140,451,468 136,371,100 131,094,300 124,887,300 125,806,800 130,408,800 139,766,100 146,936,700 152,090,200 153,210,000 156,367,000
DENVER 47,668,649 48,451,000 46,419,700 44,563,150 41,834,200 42,980,900 44,297,000 47,620,000 50,367,100 49,953,500 50,428,000 49,581,700
FREMONT 70,194,651 69,845,524 59,866,032 60,026,000 66,613,700 69,224,600 69,689,300 72,784,500 71,786,600 72,469,900 74,400,200 78,433,100
GILMORE 69,812,700 66,933,400 67,101,700 62,944,400 59,432,500 59,117,000 62,625,300 63,111,400 63,917,200 68,440,100 69,671,700 71,822,600
ISABELLA 82,156,670 79,426,484 78,076,210 77,934,966 78,784,339 82,645,711 86,491,678 92,875,959 96,947,266 104,238,100 110,293,340 116,884,479
LINCOLN 81,835,517 76,863,365 75,366,346 72,540,976 70,766,016 75,337,648 76,538,736 79,027,412 78,339,383 80,782,389 81,623,943 86,426,109
NOTTAWA 98,498,315 98,013,652 92,277,712 89,963,841 89,901,000 87,149,300 92,861,900 102,036,800 104,471,200 108,886,900 108,742,300 113,198,000
ROLLAND 48,775,650 50,844,500 50,144,800 48,695,000 48,597,000 48,715,500 50,677,200 51,470,700 53,572,100 54,147,500 55,225,200 58,431,500
SHERMAN 117,970,370 120,958,300 110,881,900 109,729,700 104,611,800 106,637,900 107,480,100 110,096,200 112,938,600 118,653,900 121,315,900 123,431,400
UNION 422,062,700 424,107,000 394,030,201 388,900,450 375,654,723 386,011,450 383,901,150 431,356,200 433,367,037 419,823,928 417,268,800 451,107,200
VERNON 61,166,391 59,266,092 59,980,367 57,303,838 53,964,500 58,538,460 62,551,000 67,968,500 67,196,500 67,887,600 68,421,495 73,658,850
WISE 51,672,640 48,953,168 48,302,608 46,356,862 44,439,532 43,217,000 46,305,900 49,904,700 51,422,400 51,877,500 53,417,800 55,530,400
MT PLEASANT 507,103,203 510,001,164 486,303,671 482,528,078 477,203,680 474,591,617 475,189,506 484,344,653 481,106,054 516,364,602 532,111,415 562,965,475
CLARE 11,198,400 13,190,600 12,542,100 11,086,500 12,093,000 12,778,500 12,631,400 13,467,400 10,837,900 11,166,000 10,472,000 10,171,400
---------------------- ---------------------- ---------------------- ---------------------- ------------------- ---------------------- ------------------- ------------------- -------------------- ---------------------- -----------------------------------------------
TOTALS 2,189,939,948 2,172,198,143 2,062,220,176 2,015,650,309 1,964,825,090 1,997,614,942 2,032,080,819 2,153,891,485 2,180,662,940 2,232,773,612 2,273,898,593 2,438,447,745
Percent Change 69,193,418 -17,741,805 -109,977,967 -46,569,867 -50,825,219 32,789,852 34,465,877 121,810,666 26,771,455 52,110,672 41,124,981 164,549,152
from Year to Year: -0.81% -5.06% -2.26% -2.52% 1.67% 1.73% 5.99% 1.24% 2.39% 1.84% 7.24%
Percent Change
from 2008: -0.81% -5.83% -7.96% -10.28% -8.78% -7.21% -1.65% -0.42% 1.96% 3.83% 11.35%
Note: 1999 C.E.V. = 1,036,301,595 … Percent Change in CEV from 1999 to 2019 = 135.30% C.E.V.
H:\Jcn Excel\Equal_19\EQ REPORT Isabella SEV from 2001 TO 2019 2019-12-31.xlsx20

Isabella County Board of Commissioners, Mt Pleasant, MI April 15, 2019 2019 COUNTY EQUALIZED VALUATIONS (C.E.V.)
After review of the 2019 assessment rolls for the sixteen townships and the two cities in Isabella County, this board adopts the following equalized values as stated.This is adopted in compliance with (Section 211.34 MCL 1948) as amended.
2019UNIT UNIT PARCEL AG. COM. IND. RES. TIM/CUT DEV. TOTAL COM. PER. IND. PER. RES. PER. UTL. PER. TOTAL CEV %
# NAME COUNT * 101 201 301 401 501 601 REAL 251 351 451 551 PERS. TOTAL
------- --------------------- ---------- -------------------- ---------------------- -------------------- -------------------- --------------------- ------------------- -------------------- ----------------- ----------------- ----------------- ----------------- -------------------- ------------------------- -------------
01 BROOMFIELD 1,696 14,888,600 1,764,900 2,708,000 69,905,600 0 0 89,267,100 236,200 2,904,600 0 2,111,700 5,252,500 94,519,600 3.9%
02 CHIPPEWA 2,281 11,331,900 9,523,300 354,100 89,648,300 0 0 110,857,600 2,970,600 290,700 0 8,826,700 12,088,000 122,945,600 5.0%
03 COE 1,791 62,246,800 8,690,900 209,100 61,863,600 0 0 133,010,400 1,001,500 30,405,000 0 7,821,032 39,227,532 172,237,932 7.1%
04 COLDWATER 800 9,778,000 516,800 258,400 29,209,300 0 0 39,762,500 0 0 0 972,900 972,900 40,735,400 1.7%
05 DEERFIELD 1,961 24,906,200 1,375,300 1,948,500 123,604,400 0 0 151,834,400 1,919,500 0 0 2,613,100 4,532,600 156,367,000 6.4%
06 DENVER 874 20,705,200 674,900 0 26,415,200 0 0 47,795,300 0 0 0 1,786,400 1,786,400 49,581,700 2.0%
07 FREMONT 972 27,235,700 685,200 9,914,100 38,399,400 0 0 76,234,400 222,800 673,900 0 1,302,000 2,198,700 78,433,100 3.2%
08 GILMORE 1,350 12,056,700 216,900 0 58,033,200 0 0 70,306,800 28,400 0 0 1,487,400 1,515,800 71,822,600 2.9%
09 ISABELLA 1,304 51,592,200 5,884,800 0 42,444,500 0 0 99,921,500 6,088,079 0 0 10,874,900 16,962,979 116,884,479 4.8%
10 LINCOLN 1,180 39,225,284 1,368,400 9,000 43,954,625 0 0 84,557,309 279,600 0 0 1,589,200 1,868,800 86,426,109 3.5%
11 NOTTAWA 1,674 46,131,600 2,555,900 1,024,300 60,326,200 0 0 110,038,000 430,500 208,400 0 2,521,100 3,160,000 113,198,000 4.6%
12 ROLLAND 960 25,016,700 1,312,600 301,200 30,042,900 0 0 56,673,400 95,300 38,200 0 1,624,600 1,758,100 58,431,500 2.4%
13 SHERMAN 3,369 9,630,500 4,822,400 578,200 103,984,400 0 0 119,015,500 301,100 6,200 0 4,108,600 4,415,900 123,431,400 5.1%
14 UNION 3,612 20,026,500 229,214,400 4,221,100 164,806,600 0 0 418,268,600 19,101,300 2,228,700 0 11,508,600 32,838,600 451,107,200 18.5%
15 VERNON 1,054 34,279,350 1,916,200 65,100 30,129,600 0 0 66,390,250 2,081,300 0 0 5,187,300 7,268,600 73,658,850 3.0%
16 WISE 983 28,547,900 1,491,400 0 23,686,900 0 0 53,726,200 317,100 0 0 1,487,100 1,804,200 55,530,400 2.3%
17 MT PLEASANT 6,377 0 257,702,100 9,228,700 267,769,675 0 0 534,700,475 20,891,700 581,900 0 6,791,400 28,265,000 562,965,475 23.1%
18 CLARE 145 0 4,221,100 3,778,900 865,000 0 0 8,865,000 537,900 189,700 0 578,800 1,306,400 10,171,400 0.4%
====== =========== ============= =========== =========== ============ =========== =========== ========== ========== ========== ========== =========== =============== ======
TOTALS 32,383 437,599,134 533,937,500 34,598,700 1,265,089,400 0 0 2,271,224,734 56,502,879 37,527,300 0 73,192,832 167,223,011 2,438,447,745 100.0%
% OF COUNTY 17.9% 21.9% 1.4% 51.9% 0.0% 0.0% 93.1% 2.3% 1.5% 0.0% 3.0% 6.9% 100.0%
VILLAGE TOTALS (ALREADY ADDED INTO ABOVE TOWNSHIP TOTALS)
21 LAKE ISABELLA 2,412 0 2,414,300 249,600 89,257,700 0 0 91,921,600 76,600 0 0 863,000 939,600 92,861,200 3.8%
21-01 BROOMFIELD 811 0 693,200 0 37,276,300 0 0 37,969,500 0 0 0 203,800 203,800 38,173,300 1.6%
22-13 SHERMAN 1,601 0 1,721,100 249,600 51,981,400 0 0 53,952,100 76,600 0 0 659,200 735,800 54,687,900 2.2%
31 SHEPHERD 737 48,600 6,121,000 192,200 27,025,500 0 0 33,387,300 63,000 63,000 0 816,500 942,500 34,329,800 1.4%
91 ROSEBUSH 235 510,500 3,232,900 0 6,182,000 0 0 9,925,400 5,701,600 0 0 428,800 6,130,400 16,055,800 0.7%
---------- -------------------- ---------------------- -------------------- -------------------- --------------------- ------------------- -------------------- ----------------- ----------------- ----------------- ----------------- -------------------- ------------------------- ---------
3,384 559,100 11,768,200 441,800 122,465,200 0 0 135,234,300 5,841,200 63,000 0 2,108,300 8,012,500 143,246,800 5.9%
--2019 COUNTY A.V.-- 2,438,447,745 -- 2018 COUNTY A.V. -- 2,273,898,593 **COUNTY ASSESSED VALUE DECREASE / INCREASE** 164,549,152
7.23%
*Parcel Count from L-4022 Reports
H:\Jcn Excel\Equal_19\EQ REPORT SEV TOTALS...2019 WITH CERT TEST 2019-04-15.xls
21
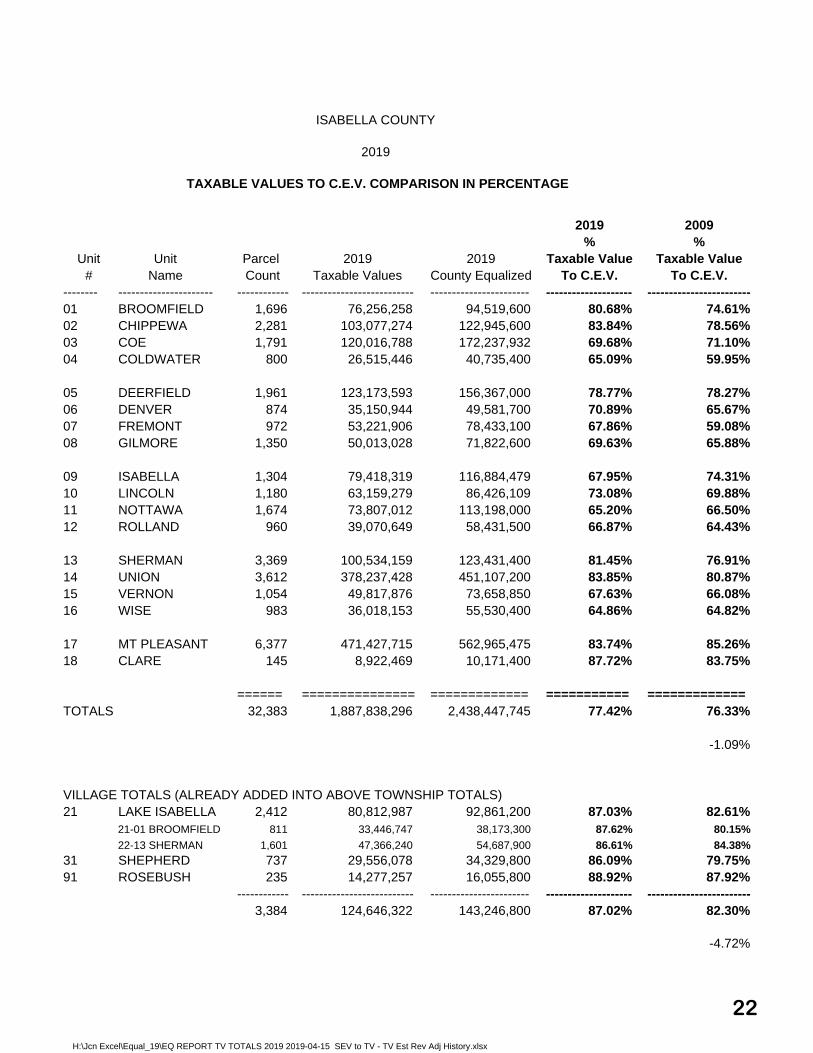
TAXABLE VALUES TO C.E.V. COMPARISON IN PERCENTAGE
2019 2009% %
Unit Unit Parcel 2019 2019 Taxable Value Taxable Value# Name Count Taxable Values County Equalized To C.E.V. To C.E.V.
-------- ---------------------- ------------ -------------------------- ----------------------- -------------------- ------------------------01 BROOMFIELD 1,696 76,256,258 94,519,600 80.68% 74.61%02 CHIPPEWA 2,281 103,077,274 122,945,600 83.84% 78.56%03 COE 1,791 120,016,788 172,237,932 69.68% 71.10%04 COLDWATER 800 26,515,446 40,735,400 65.09% 59.95%
05 DEERFIELD 1,961 123,173,593 156,367,000 78.77% 78.27%06 DENVER 874 35,150,944 49,581,700 70.89% 65.67%07 FREMONT 972 53,221,906 78,433,100 67.86% 59.08%08 GILMORE 1,350 50,013,028 71,822,600 69.63% 65.88%
09 ISABELLA 1,304 79,418,319 116,884,479 67.95% 74.31%10 LINCOLN 1,180 63,159,279 86,426,109 73.08% 69.88%11 NOTTAWA 1,674 73,807,012 113,198,000 65.20% 66.50%12 ROLLAND 960 39,070,649 58,431,500 66.87% 64.43%
13 SHERMAN 3,369 100,534,159 123,431,400 81.45% 76.91%14 UNION 3,612 378,237,428 451,107,200 83.85% 80.87%15 VERNON 1,054 49,817,876 73,658,850 67.63% 66.08%16 WISE 983 36,018,153 55,530,400 64.86% 64.82%
17 MT PLEASANT 6,377 471,427,715 562,965,475 83.74% 85.26%18 CLARE 145 8,922,469 10,171,400 87.72% 83.75%
====== =============== ============= =========== =============TOTALS 32,383 1,887,838,296 2,438,447,745 77.42% 76.33%
-1.09%
VILLAGE TOTALS (ALREADY ADDED INTO ABOVE TOWNSHIP TOTALS)21 LAKE ISABELLA 2,412 80,812,987 92,861,200 87.03% 82.61%
21-01 BROOMFIELD 811 33,446,747 38,173,300 87.62% 80.15%
22-13 SHERMAN 1,601 47,366,240 54,687,900 86.61% 84.38%
31 SHEPHERD 737 29,556,078 34,329,800 86.09% 79.75%91 ROSEBUSH 235 14,277,257 16,055,800 88.92% 87.92%
------------ -------------------------- ----------------------- -------------------- ------------------------3,384 124,646,322 143,246,800 87.02% 82.30%
-4.72%
ISABELLA COUNTY
2019
H:\Jcn Excel\Equal_19\EQ REPORT TV TOTALS 2019 2019-04-15 SEV to TV - TV Est Rev Adj History.xlsx
22

2019 ISABELLA COUNTY C.E.V. PERCENT CHANGE BY CLASS COUNTY EQUALIZED VALUATIONS (C.E.V.) 2019April 15, 2019
Year AG. COM. IND. RES. TIM/CUT DEV. TOTAL COM. PER. IND. PER. RES. PER. UTL. PER. TOTAL UNIT
101 201 301 401 501 601 REAL 251 351 451 551 PERS. TOTAL
-------- --------------------- ---------- ------------------- ---------------------- ------------------- ------------------- ---------------------- ---------------------- ------------------- ----------------- ----------------- ----------------- ----------------- ------------------- -------------------------
2019 437,599,134 533,937,500 34,598,700 1,265,089,400 0 0 2,271,224,734 56,502,879 37,527,300 0 73,192,832 167,223,011 2,438,447,745
2018 418,794,570 490,826,024 33,904,000 1,204,077,970 0 0 2,147,602,564 55,235,326 8,202,100 0 62,858,603 126,296,029 2,273,898,593
Net Change 18,804,564 43,111,476 694,700 61,011,430 0 0 123,622,170 1,267,553 29,325,200 0 10,334,229 40,926,982 164,549,152
Percent Change 4.49% 8.78% 2.04% 5.06% #DIV/0! #DIV/0! 5.75% 2.29% 357.53% 0.00% 16.44% 32.40% 7.23%
2019 ISABELLA COUNTY TAXABLE PERCENT CHANGE BY CLASS **Tentative Valuations until after Final State Equalization by the STC on 05/28/2019** TAXABLE VALUES ( T.V. ) 2019
Year AG. COM. IND. RES. TIM/CUT DEV. TOTAL COM. PER. IND. PER. RES. PER. UTL. PER. TOTAL UNIT
101 201 301 401 501 601 REAL 251 351 451 551 PERS. TOTAL
-------- --------------------- ---------- ------------------- ---------------------- ------------------- ------------------- ---------------------- ---------------------- ------------------- ----------------- ----------------- ----------------- ----------------- ------------------- -------------------------
2019 200,518,533 409,616,094 28,697,604 1,081,790,661 0 0 1,720,622,892 56,495,272 37,527,300 0 73,192,832 167,215,404 1,887,838,296
2018 195,986,884 402,923,583 27,774,933 1,053,199,689 0 0 1,679,885,089 55,201,397 8,202,100 0 62,857,545 126,261,042 1,806,146,131
Net Change 4,531,649 6,692,511 922,671 28,590,972 0 0 40,737,803 1,293,875 29,325,200 0 10,335,287 40,954,362 81,692,165
Percent Change 2.31% 1.66% 3.32% 2.71% #DIV/0! #DIV/0! 2.42% 2.34% 357.53% 0.00% 16.44% 32.43% 4.52%
April 15, 2019
H:\Jcn Excel\Equal_19\EQ REPORT TV TOTALS 2019 2019-04-15 SEV to TV - TV Est Rev Adj History.xlsx
23

2019 BSA County Equalization Pie Graphs: 2019-04-16
24

2019 BSA County Equalization – Real Property Trend Graphs: 2019-04-16
25
Taxable Valuations, Isabella County Page 1 of 3
Michigan Department of Treasury2795 (Rev. 8-08)
Issued under the General Property Tax Act, Section 211.27d. Filing is mandatory.
Statement of taxable valuation in the year 2019. File this form with the State Tax Commission on or before the fourth Monday in June.
L-4046
(Col. 7)Total Real Property
(Col. 6)Developmental
(Col. 5)Timber-Cutover
(Col. 4)Residential
(Col. 3)Industrial
(Col. 2)Commercial
(Col. 1)AgriculturalTownship or City
REAL PROPERTY Taxable Valuations as of the Fourth Monday in May. (Do not Report Assessed Valuations or Equalized Valuations on This Form.)
71,003,7580058,008,2612,458,2541,541,6378,995,606Broomfield
90,989,2740077,973,587259,5756,787,3705,968,742Chippewa
80,789,2560051,789,991202,5187,877,45020,919,297Coe
25,542,5460019,787,788144,371173,0565,437,331Coldwater
118,640,99300105,751,6381,154,6311,275,64110,459,083Deerfield
33,364,5440021,923,8930646,07310,794,578Denver
51,023,2060028,490,8059,847,909570,82012,113,672Fremont
48,497,2280041,146,8820204,9707,145,376Gilmore
62,455,3400035,838,27305,108,79121,508,276Isabella
61,296,9290038,964,5121,6261,298,07821,032,713Lincoln
70,647,0120048,963,542987,0602,010,58218,685,828Nottawa
37,312,5490023,874,847300,568846,58312,290,551Rolland
96,118,2590086,315,242425,4163,898,5985,479,003Sherman
345,398,82800145,836,2333,586,266186,658,4059,317,924Union
42,549,2760023,987,35119,4191,701,56916,840,937Vernon
34,213,9530019,288,16501,396,17213,529,616Wise
443,163,87200253,082,3845,790,931184,290,5570Mount Pleasant
7,616,06900767,2673,519,0603,329,7420Clare
Report the Taxable Valuations for the six classifications of real property in columns 1 through 6 onpage 1. Then report the Total Taxable Valuations for real property in column 7 on page 1.Report the Taxable Valuations for the five classifications of Personal Property in columns 8 through12 on page 2. Then enter the total Taxable Valuations for personal property in column 13 on page2.Add the total Taxable Valuations for real property (column 7, page 1) and personal property (column13, page 2) and enter in column 14 on page 3.Report the Total Taxable Valuations of entire township or city for Homeowner's Principal Residence,Qualified Agricultural property and Qualified Forest Property in column 15, and Non-Homestead andNon-Qualified Agricultural Personal Property, and Non-Qualified Forest property except Commercialand Industrial Personal Property, in column 18. Report the Total Taxable Value of CommercialPersonal Property in column 16. Report the Total Taxable Value of Industrial Personal property incolumn 17.
qualified agricultural property exemption, split the taxable value between Homeowner'sPrincipal Residence (column 15) and Non-Homestead (column 18)
Where there is a partial Homeowner's Principal Residence Exemption or partialNOTE:
for each township and city within the county. The Taxable Valuations reported here arethe final Taxable Valuations as of the fourth Monday in May, NOT the Tentative TaxableValuations. Final Taxable Valuations may be different from Tentative Taxable Valuationswhen a township or city receives a county and/or state equalization factor more or lessthan was used to calculate Tentative Taxable Valuations
This form is used to report total Taxable Valuations, by classiciation,INSTRUCTIONS:
1,720,622,892001,081,790,66128,697,604409,616,094200,518,533Total for County
26

Page 2 of 3
Michigan Department of Treasury2795 (Rev. 8-08)
Taxable Valuations, Isabella CountyIssued under the General Property Tax Act, Section 211.27d. Filing is mandatory.
Statement of taxable valuation in the year 2019. File this form with the State Tax Comission on or before the fourth Monday in June.
L-4046
(Col. 13)Total Personal Property
(Col. 12)Utility
(Col. 11)Residential
(Col. 10)Industrial
(Col. 9)Commercial
(Col. 8)AgriculturalTownship or City
PERSONAL PROPERTY Taxable Valuations as of the Fourth Monday in May. (Do not Report Assessed Valuations or Equalized Valuations on This Form.)
5,252,5002,111,70002,904,600236,2000Broomfield
12,088,0008,826,7000290,7002,970,6000Chippewa
39,227,5327,821,032030,405,0001,001,5000Coe
972,900972,9000000Coldwater
4,532,6002,613,100001,919,5000Deerfield
1,786,4001,786,4000000Denver
2,198,7001,302,0000673,900222,8000Fremont
1,515,8001,487,4000028,4000Gilmore
16,962,97910,874,900006,088,0790Isabella
1,862,3501,589,20000273,1500Lincoln
3,160,0002,521,1000208,400430,5000Nottawa
1,758,1001,624,600038,20095,3000Rolland
4,415,9004,108,60006,200301,1000Sherman
32,838,60011,508,60002,228,70019,101,3000Union
7,268,6005,187,300002,081,3000Vernon
1,804,2001,487,10000317,1000Wise
28,263,8436,791,4000581,90020,890,5430Mount Pleasant
1,306,400578,8000189,700537,9000Clare
167,215,40473,192,832037,527,30056,495,2720Total for County
27

28
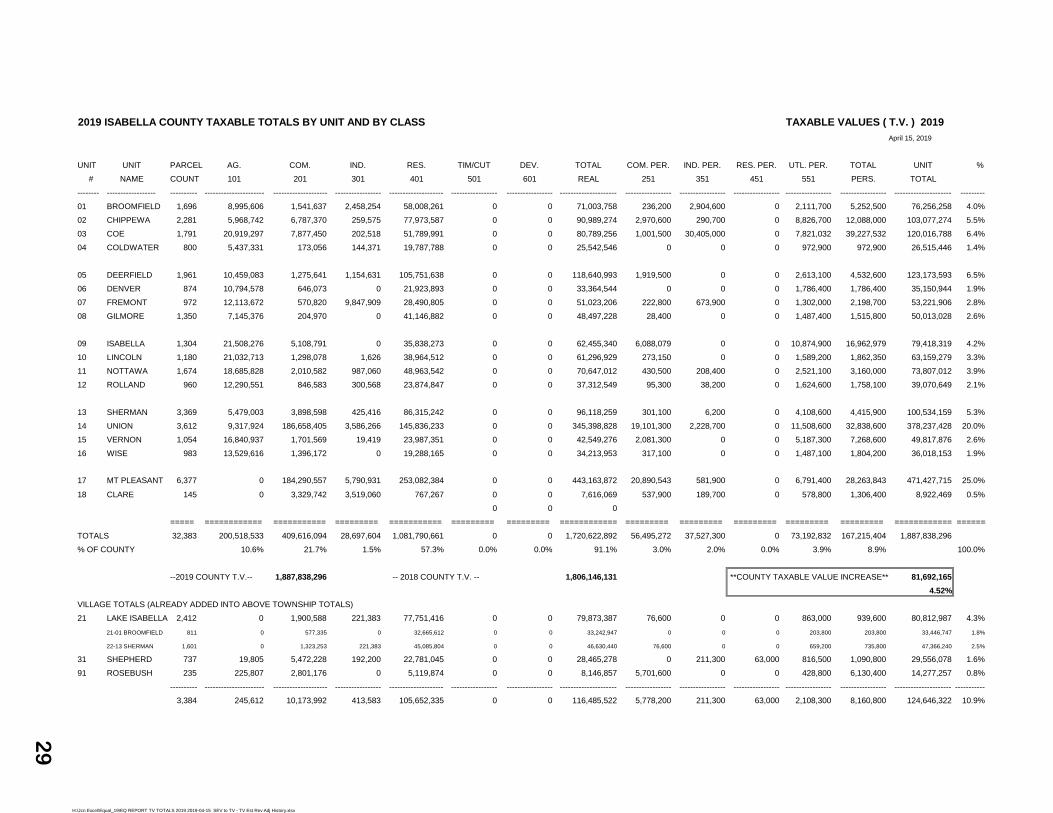
2019 ISABELLA COUNTY TAXABLE TOTALS BY UNIT AND BY CLASS TAXABLE VALUES ( T.V. ) 2019
UNIT UNIT PARCEL AG. COM. IND. RES. TIM/CUT DEV. TOTAL COM. PER. IND. PER. RES. PER. UTL. PER. TOTAL UNIT %
# NAME COUNT 101 201 301 401 501 601 REAL 251 351 451 551 PERS. TOTAL
-------- ------------------ ---------- ---------------------- -------------------- ----------------- -------------------- ----------------- ----------------- --------------------- ----------------- ----------------- ----------------- ----------------- ----------------- --------------------- ---------
01 BROOMFIELD 1,696 8,995,606 1,541,637 2,458,254 58,008,261 0 0 71,003,758 236,200 2,904,600 0 2,111,700 5,252,500 76,256,258 4.0%
02 CHIPPEWA 2,281 5,968,742 6,787,370 259,575 77,973,587 0 0 90,989,274 2,970,600 290,700 0 8,826,700 12,088,000 103,077,274 5.5%
03 COE 1,791 20,919,297 7,877,450 202,518 51,789,991 0 0 80,789,256 1,001,500 30,405,000 0 7,821,032 39,227,532 120,016,788 6.4%
04 COLDWATER 800 5,437,331 173,056 144,371 19,787,788 0 0 25,542,546 0 0 0 972,900 972,900 26,515,446 1.4%
05 DEERFIELD 1,961 10,459,083 1,275,641 1,154,631 105,751,638 0 0 118,640,993 1,919,500 0 0 2,613,100 4,532,600 123,173,593 6.5%
06 DENVER 874 10,794,578 646,073 0 21,923,893 0 0 33,364,544 0 0 0 1,786,400 1,786,400 35,150,944 1.9%
07 FREMONT 972 12,113,672 570,820 9,847,909 28,490,805 0 0 51,023,206 222,800 673,900 0 1,302,000 2,198,700 53,221,906 2.8%
08 GILMORE 1,350 7,145,376 204,970 0 41,146,882 0 0 48,497,228 28,400 0 0 1,487,400 1,515,800 50,013,028 2.6%
09 ISABELLA 1,304 21,508,276 5,108,791 0 35,838,273 0 0 62,455,340 6,088,079 0 0 10,874,900 16,962,979 79,418,319 4.2%
10 LINCOLN 1,180 21,032,713 1,298,078 1,626 38,964,512 0 0 61,296,929 273,150 0 0 1,589,200 1,862,350 63,159,279 3.3%
11 NOTTAWA 1,674 18,685,828 2,010,582 987,060 48,963,542 0 0 70,647,012 430,500 208,400 0 2,521,100 3,160,000 73,807,012 3.9%
12 ROLLAND 960 12,290,551 846,583 300,568 23,874,847 0 0 37,312,549 95,300 38,200 0 1,624,600 1,758,100 39,070,649 2.1%
13 SHERMAN 3,369 5,479,003 3,898,598 425,416 86,315,242 0 0 96,118,259 301,100 6,200 0 4,108,600 4,415,900 100,534,159 5.3%
14 UNION 3,612 9,317,924 186,658,405 3,586,266 145,836,233 0 0 345,398,828 19,101,300 2,228,700 0 11,508,600 32,838,600 378,237,428 20.0%
15 VERNON 1,054 16,840,937 1,701,569 19,419 23,987,351 0 0 42,549,276 2,081,300 0 0 5,187,300 7,268,600 49,817,876 2.6%
16 WISE 983 13,529,616 1,396,172 0 19,288,165 0 0 34,213,953 317,100 0 0 1,487,100 1,804,200 36,018,153 1.9%
17 MT PLEASANT 6,377 0 184,290,557 5,790,931 253,082,384 0 0 443,163,872 20,890,543 581,900 0 6,791,400 28,263,843 471,427,715 25.0%
18 CLARE 145 0 3,329,742 3,519,060 767,267 0 0 7,616,069 537,900 189,700 0 578,800 1,306,400 8,922,469 0.5%
0 0 0
===== ============ =========== ========= =========== ========= ========= ============ ========= ========= ========= ========= ========= ============ =======
TOTALS 32,383 200,518,533 409,616,094 28,697,604 1,081,790,661 0 0 1,720,622,892 56,495,272 37,527,300 0 73,192,832 167,215,404 1,887,838,296
% OF COUNTY 10.6% 21.7% 1.5% 57.3% 0.0% 0.0% 91.1% 3.0% 2.0% 0.0% 3.9% 8.9% 100.0%
--2019 COUNTY T.V.-- 1,887,838,296 -- 2018 COUNTY T.V. -- 1,806,146,131 **COUNTY TAXABLE VALUE INCREASE** 81,692,165
4.52%
VILLAGE TOTALS (ALREADY ADDED INTO ABOVE TOWNSHIP TOTALS)
21 LAKE ISABELLA 2,412 0 1,900,588 221,383 77,751,416 0 0 79,873,387 76,600 0 0 863,000 939,600 80,812,987 4.3%
21-01 BROOMFIELD 811 0 577,335 0 32,665,612 0 0 33,242,947 0 0 0 203,800 203,800 33,446,747 1.8%
22-13 SHERMAN 1,601 0 1,323,253 221,383 45,085,804 0 0 46,630,440 76,600 0 0 659,200 735,800 47,366,240 2.5%
31 SHEPHERD 737 19,805 5,472,228 192,200 22,781,045 0 0 28,465,278 0 211,300 63,000 816,500 1,090,800 29,556,078 1.6%
91 ROSEBUSH 235 225,807 2,801,176 0 5,119,874 0 0 8,146,857 5,701,600 0 0 428,800 6,130,400 14,277,257 0.8%
---------- ---------------------- -------------------- ----------------- -------------------- ----------------- ----------------- --------------------- ----------------- ----------------- ----------------- ----------------- ----------------- --------------------- -----------
3,384 245,612 10,173,992 413,583 105,652,335 0 0 116,485,522 5,778,200 211,300 63,000 2,108,300 8,160,800 124,646,322 10.9%
April 15, 2019
H:\Jcn Excel\Equal_19\EQ REPORT TV TOTALS 2019 2019-04-15 SEV to TV - TV Est Rev Adj History.xlsx
29

ISABELLA COUNTY EQUALIZATION REPORT APRIL 2019 April 15, 2019
DEPARTMENT RECOMMENDED VALUES
TAXABLE VALUES COMPARISON FROM PREVIOUS YEAR TO CURRENT YEAR (CPI used against 2018 Taxable Values to Calculated 2019 Taxable Values = 1.024)
Difference Overall Percent Percent of Unit Unit Parcel 2018 2019 2018 to 2019 Change County's
# Name Count Taxable Values Taxables Values Taxable Values In Each Unit Net Change-------- --------------------- ----------- ------------------------- ----------------------- ------------------- ----------------------- -------------------01 BROOMFIELD 1,696 74,566,590 76,256,258 1,689,668 2.27% 2.07%02 CHIPPEWA 2,281 101,105,095 103,077,274 1,972,179 1.95% 2.41%03 COE 1,791 82,844,511 120,016,788 37,172,277 44.87% 45.50%04 COLDWATER 800 25,665,741 26,515,446 849,705 3.31% 1.04%
05 DEERFIELD 1,961 120,715,138 123,173,593 2,458,455 2.04% 3.01%06 DENVER 874 34,522,492 35,150,944 628,452 1.82% 0.77%07 FREMONT 972 51,636,729 53,221,906 1,585,177 3.07% 1.94%08 GILMORE 1,350 49,128,822 50,013,028 884,206 1.80% 1.08%
09 ISABELLA 1,304 75,886,460 79,418,319 3,531,859 4.65% 4.32%10 LINCOLN 1,180 61,707,012 63,159,279 1,452,267 2.35% 1.78%11 NOTTAWA 1,674 71,954,036 73,807,012 1,852,976 2.58% 2.27%12 ROLLAND 960 37,722,041 39,070,649 1,348,608 3.58% 1.65%
13 SHERMAN 3,369 98,501,044 100,534,159 2,033,115 2.06% 2.49%14 UNION 3,612 363,707,992 378,237,428 14,529,436 3.99% 17.79%15 VERNON 1,054 46,821,052 49,817,876 2,996,824 6.40% 3.67%16 WISE 983 34,817,560 36,018,153 1,200,593 3.45% 1.47%
17 MT PLEASANT 6,377 465,859,512 471,427,715 5,568,203 1.20% 6.82%18 CLARE 145 8,984,304 8,922,469 -61,835 -0.69% -0.08%
====== ============== ============= =========== ============= ===========TOTALS 32,383 1,806,146,131 1,887,838,296 81,692,165 1.0000
% OF COUNTY CHANGE 4.52%
VILLAGE TOTALS (ALREADY ADDED INTO ABOVE TOWNSHIP TOTALS)21 LAKE ISABELLA 2,412 78,780,795 80,812,987 2,032,192 2.58% 2.49%
21-01 BROOMFIELD 811 32,449,470 33,446,747 997,277 3.07% 1.22%
22-13 SHERMAN 1,601 46,331,325 47,366,240 1,034,915 2.23% 1.27%
31 SHEPHERD 737 28,676,305 29,556,078 879,773 3.07% 1.08%91 ROSEBUSH 235 14,926,597 14,277,257 -649,340 -4.35% -0.79%
----------- ------------------------- ----------------------- ------------------- ----------------------- -------------------3,384 122,383,697 124,646,322 2,262,625 2.77%
1.84%
H:\Jcn Excel\Equal_19\EQ REPORT TV TOTALS 2019 2019-04-15 SEV to TV - TV Est Rev Adj History.xlsx
30
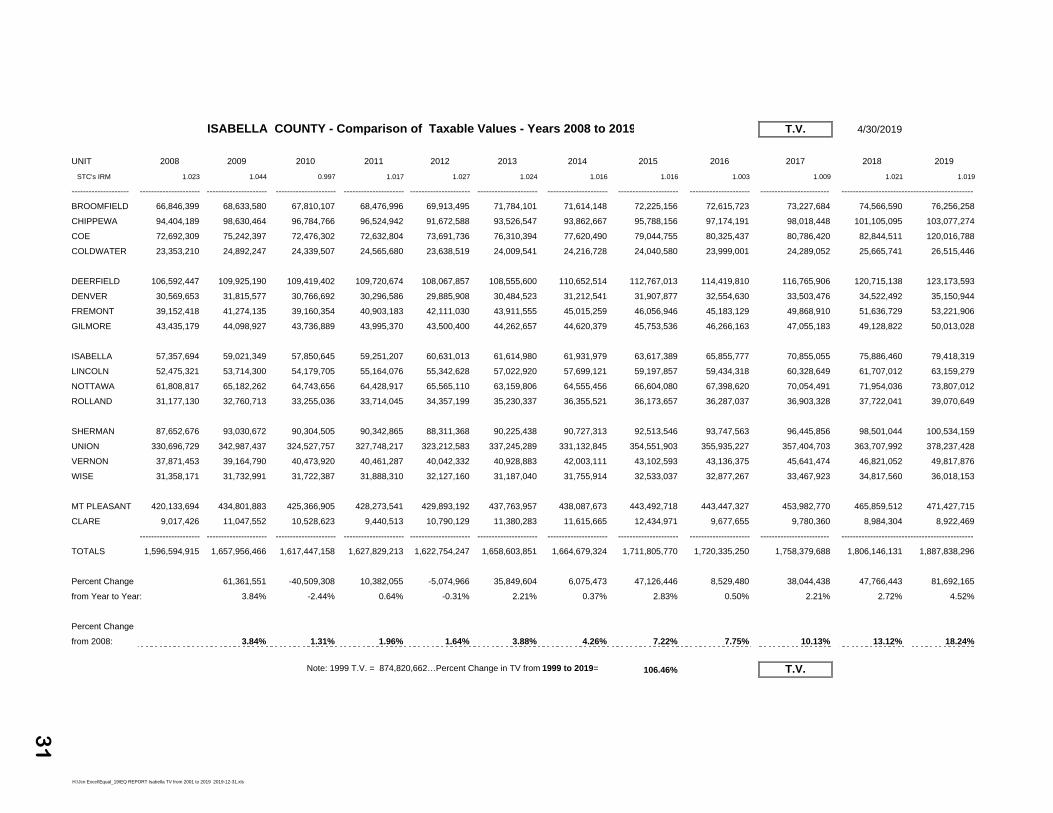
ISABELLA COUNTY - Comparison of Taxable Values - Years 2008 to 2019 T.V. 4/30/2019
UNIT 2008 2009 2010 2011 2012 2013 2014 2015 2016 2017 2018 2019
STC's IRM 1.023 1.044 0.997 1.017 1.027 1.024 1.016 1.016 1.003 1.009 1.021 1.019
-------------------- --------------------- --------------------- --------------------- --------------------- --------------------- --------------------- --------------------- --------------------- --------------------- ------------------------ ----------------------------------------------
BROOMFIELD 66,846,399 68,633,580 67,810,107 68,476,996 69,913,495 71,784,101 71,614,148 72,225,156 72,615,723 73,227,684 74,566,590 76,256,258
CHIPPEWA 94,404,189 98,630,464 96,784,766 96,524,942 91,672,588 93,526,547 93,862,667 95,788,156 97,174,191 98,018,448 101,105,095 103,077,274
COE 72,692,309 75,242,397 72,476,302 72,632,804 73,691,736 76,310,394 77,620,490 79,044,755 80,325,437 80,786,420 82,844,511 120,016,788
COLDWATER 23,353,210 24,892,247 24,339,507 24,565,680 23,638,519 24,009,541 24,216,728 24,040,580 23,999,001 24,289,052 25,665,741 26,515,446
DEERFIELD 106,592,447 109,925,190 109,419,402 109,720,674 108,067,857 108,555,600 110,652,514 112,767,013 114,419,810 116,765,906 120,715,138 123,173,593
DENVER 30,569,653 31,815,577 30,766,692 30,296,586 29,885,908 30,484,523 31,212,541 31,907,877 32,554,630 33,503,476 34,522,492 35,150,944
FREMONT 39,152,418 41,274,135 39,160,354 40,903,183 42,111,030 43,911,555 45,015,259 46,056,946 45,183,129 49,868,910 51,636,729 53,221,906
GILMORE 43,435,179 44,098,927 43,736,889 43,995,370 43,500,400 44,262,657 44,620,379 45,753,536 46,266,163 47,055,183 49,128,822 50,013,028
ISABELLA 57,357,694 59,021,349 57,850,645 59,251,207 60,631,013 61,614,980 61,931,979 63,617,389 65,855,777 70,855,055 75,886,460 79,418,319
LINCOLN 52,475,321 53,714,300 54,179,705 55,164,076 55,342,628 57,022,920 57,699,121 59,197,857 59,434,318 60,328,649 61,707,012 63,159,279
NOTTAWA 61,808,817 65,182,262 64,743,656 64,428,917 65,565,110 63,159,806 64,555,456 66,604,080 67,398,620 70,054,491 71,954,036 73,807,012
ROLLAND 31,177,130 32,760,713 33,255,036 33,714,045 34,357,199 35,230,337 36,355,521 36,173,657 36,287,037 36,903,328 37,722,041 39,070,649
SHERMAN 87,652,676 93,030,672 90,304,505 90,342,865 88,311,368 90,225,438 90,727,313 92,513,546 93,747,563 96,445,856 98,501,044 100,534,159
UNION 330,696,729 342,987,437 324,527,757 327,748,217 323,212,583 337,245,289 331,132,845 354,551,903 355,935,227 357,404,703 363,707,992 378,237,428
VERNON 37,871,453 39,164,790 40,473,920 40,461,287 40,042,332 40,928,883 42,003,111 43,102,593 43,136,375 45,641,474 46,821,052 49,817,876
WISE 31,358,171 31,732,991 31,722,387 31,888,310 32,127,160 31,187,040 31,755,914 32,533,037 32,877,267 33,467,923 34,817,560 36,018,153
MT PLEASANT 420,133,694 434,801,883 425,366,905 428,273,541 429,893,192 437,763,957 438,087,673 443,492,718 443,447,327 453,982,770 465,859,512 471,427,715
CLARE 9,017,426 11,047,552 10,528,623 9,440,513 10,790,129 11,380,283 11,615,665 12,434,971 9,677,655 9,780,360 8,984,304 8,922,469
--------------------- --------------------- --------------------- --------------------- --------------------- --------------------- --------------------- --------------------- --------------------- ------------------------ ----------------------------------------------
TOTALS 1,596,594,915 1,657,956,466 1,617,447,158 1,627,829,213 1,622,754,247 1,658,603,851 1,664,679,324 1,711,805,770 1,720,335,250 1,758,379,688 1,806,146,131 1,887,838,296
Percent Change 61,361,551 -40,509,308 10,382,055 -5,074,966 35,849,604 6,075,473 47,126,446 8,529,480 38,044,438 47,766,443 81,692,165
from Year to Year: 3.84% -2.44% 0.64% -0.31% 2.21% 0.37% 2.83% 0.50% 2.21% 2.72% 4.52%
Percent Change
from 2008: 3.84% 1.31% 1.96% 1.64% 3.88% 4.26% 7.22% 7.75% 10.13% 13.12% 18.24%
Note: 1999 T.V. = 874,820,662…Percent Change in TV from 1999 to 2019= 106.46% T.V.
H:\Jcn Excel\Equal_19\EQ REPORT Isabella TV from 2001 to 2019 2019-12-31.xls
31

UNIT UNIT REAL REAL REAL REAL REAL REAL TOTAL PERS PERS PERS PERS PERS TOTAL SUB- TAX TOTAL IFT DNR Grand# NAME AGR. COM. IND. RES. T/C. DEV. REAL AG. COM. IND. RES. UTL. PERS. TOTAL EXEM. Real/ COUNT COUNT Total
(101) (201) (301) (401) (501) (601) (151) (251) (351) (451) (551) (700) Pers. (PA198) (PA513)------- ------------------- ---------- ---------- -------- ----------- -------- -------- ------------- -------- ---------- -------- -------- -------- ---------- ------------- ---------- ------------ ------------- --------------- ----------01 BROOMFIELD 198 19 5 1,394 0 0 1,616 0 32 3 0 12 47 1,663 33 1,696 6 0 1,70202 CHIPPEWA 130 65 12 1,868 0 0 2,075 0 62 2 0 8 72 2,147 134 2,281 0 0 2,28103 COE 325 112 4 1,134 0 0 1,575 0 99 37 0 8 144 1,719 72 1,791 7 0 1,79804 COLDWATER 114 14 2 648 0 0 778 0 11 1 0 4 16 794 6 800 0 0 800
05 DEERFIELD 202 11 20 1,633 0 0 1,866 0 34 0 0 13 47 1,913 48 1,961 0 0 1,96106 DENVER 213 3 0 569 0 0 785 0 13 0 0 11 24 809 65 874 0 4 87807 FREMONT 216 16 11 655 0 0 898 0 29 3 0 15 47 945 30 975 0 3 97808 GILMORE 143 4 0 1,170 0 0 1,317 0 8 0 0 11 19 1,336 14 1,350 0 2 1,352
09 ISABELLA 401 63 0 730 0 0 1,194 0 63 0 0 9 72 1,266 38 1,304 1 0 1,30510 LINCOLN 347 14 1 776 0 0 1,138 0 20 0 0 9 29 1,167 13 1,180 0 0 1,18011 NOTTAWA 369 41 9 1,160 0 0 1,579 0 46 3 0 9 58 1,637 36 1,673 2 0 1,67512 ROLLAND 202 34 2 652 0 0 890 0 37 1 0 4 42 932 28 960 0 2 962
13 SHERMAN 138 69 9 2,929 0 0 3,145 0 82 2 0 6 90 3,235 134 3,369 0 0 3,36914 UNION 161 490 12 2,276 0 0 2,939 0 506 5 0 8 519 3,458 154 3,612 8 0 3,62015 VERNON 286 29 4 665 0 0 984 0 36 0 0 22 58 1,042 13 1,055 0 1 1,05616 WISE 296 24 0 593 0 0 913 0 30 0 0 8 38 951 32 983 0 0 983
---------- ---------- -------- ----------- -------- -------- ------------- -------- ---------- -------- -------- -------- ---------- ------------- ---------- ------------ ------------- --------------- ----------TOWNSHIPSTOTAL 3,741 1,008 91 18,852 0 0 23,692 0 1,108 57 0 157 1,322 25,014 850 25,864 24 12 25,900
17 MT PLEASANT 0 762 21 4,322 0 0 5,105 0 928 8 0 2 938 6,043 334 6,377 16 0 6,39318 CLARE 0 31 15 28 0 0 74 0 51 6 0 2 59 133 12 145 16 0 161
---------- ---------- -------- ----------- -------- -------- ------------- -------- ---------- -------- -------- -------- ---------- ------------- ---------- ------------ ------------- --------------- ----------CITIESTOTAL 0 793 36 4,350 0 0 5,179 0 979 14 0 4 997 6,176 346 6,522 32 0 6,554
COUNTYTOTAL 3,741 1,801 127 23,202 0 0 28,871 0 2,087 71 0 161 2,319 31,190 1,196 32,386 56 12 32,454
===== ===== ==== ===== ==== ==== ====== ==== ===== ==== ==== ==== ===== ====== ===== ====== ======= ======= =====11.55% 5.56% 0.39% 71.64% 0.00% 0.00% 89.15% 0.00% 6.44% 0.22% 0.00% 0.50% 7.16% 96.31% 3.69% 100.00%
VILLAGE COUNT (ALREADY ADDED INTO RESPECTIVE TOWNSHIP TOTALS)21 LAKE ISABELLA 0 20 1 2,246 0 0 2,267 0 25 0 0 3 28 2,295 117 2,412 0 0 2,412
21-01 Broomfield 0 6 0 784 0 0 790 0 4 0 0 1 5 795 16 811 0 0 811
22-13 Sherman 0 14 1 1,462 0 0 1,477 0 21 0 0 2 23 1,500 101 1,601 0 0 1,601
31 SHEPHERD 1 88 1 539 0 0 629 0 57 1 0 2 60 689 48 737 7 0 74491 ROSEBUSH 8 35 0 156 0 0 199 0 22 0 0 2 24 223 12 235 0 0 235
---------- ---------- -------- ----------- -------- -------- ------------- -------- ---------- -------- -------- -------- ---------- ------------- ---------- ------------ ---------- ---------- ----------TOTAL 9 143 2 2,941 0 0 3,095 0 104 1 0 7 112 3,207 177 3,384 7 0 3,391
Mostly From L-4022's
ISABELLA COUNTY - PARCEL COUNT BY CLASSIFICATION - 2019
H:\Jcn Excel\Equal_19\EQ REPORT PCOUNT 2019 on 2019-05-30.xlsx
32
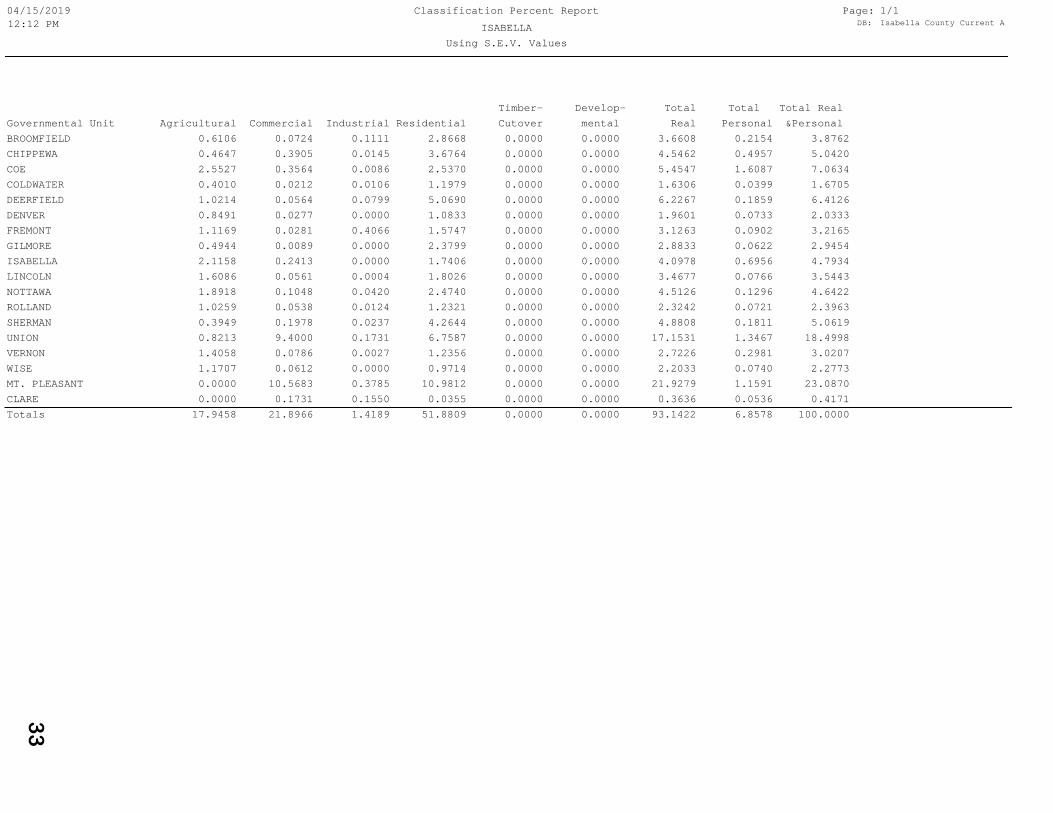
Using S.E.V. Values
Classification Percent Report
ISABELLA
Page: DB: Isabella County Current A
04/15/201912:12 PM
1/1
Totals 17.9458 21.8966 1.4189 51.8809 0.0000 0.0000 93.1422 6.8578 100.0000CLARE 0.0000 0.1731 0.1550 0.0355 0.0000 0.0000 0.3636 0.0536 0.4171MT. PLEASANT 0.0000 10.5683 0.3785 10.9812 0.0000 0.0000 21.9279 1.1591 23.0870WISE 1.1707 0.0612 0.0000 0.9714 0.0000 0.0000 2.2033 0.0740 2.2773VERNON 1.4058 0.0786 0.0027 1.2356 0.0000 0.0000 2.7226 0.2981 3.0207UNION 0.8213 9.4000 0.1731 6.7587 0.0000 0.0000 17.1531 1.3467 18.4998SHERMAN 0.3949 0.1978 0.0237 4.2644 0.0000 0.0000 4.8808 0.1811 5.0619ROLLAND 1.0259 0.0538 0.0124 1.2321 0.0000 0.0000 2.3242 0.0721 2.3963NOTTAWA 1.8918 0.1048 0.0420 2.4740 0.0000 0.0000 4.5126 0.1296 4.6422LINCOLN 1.6086 0.0561 0.0004 1.8026 0.0000 0.0000 3.4677 0.0766 3.5443ISABELLA 2.1158 0.2413 0.0000 1.7406 0.0000 0.0000 4.0978 0.6956 4.7934GILMORE 0.4944 0.0089 0.0000 2.3799 0.0000 0.0000 2.8833 0.0622 2.9454FREMONT 1.1169 0.0281 0.4066 1.5747 0.0000 0.0000 3.1263 0.0902 3.2165DENVER 0.8491 0.0277 0.0000 1.0833 0.0000 0.0000 1.9601 0.0733 2.0333DEERFIELD 1.0214 0.0564 0.0799 5.0690 0.0000 0.0000 6.2267 0.1859 6.4126COLDWATER 0.4010 0.0212 0.0106 1.1979 0.0000 0.0000 1.6306 0.0399 1.6705COE 2.5527 0.3564 0.0086 2.5370 0.0000 0.0000 5.4547 1.6087 7.0634CHIPPEWA 0.4647 0.3905 0.0145 3.6764 0.0000 0.0000 4.5462 0.4957 5.0420BROOMFIELD 0.6106 0.0724 0.1111 2.8668 0.0000 0.0000 3.6608 0.2154 3.8762Governmental Unit Agricultural Commercial Industrial Residential Cutover mental Real Personal &Personal
Timber- Develop- Total Total Total Real
33

Using Taxable Values
Classification Percent Report
ISABELLA
Page: DB: Isabella County Current A
04/15/201912:20 PM
1/1
Totals 10.6216 21.6976 1.5201 57.3031 0.0000 0.0000 91.1425 8.8575 100.0000CLARE 0.0000 0.1764 0.1864 0.0406 0.0000 0.0000 0.4034 0.0692 0.4726MT. PLEASANT 0.0000 9.7620 0.3067 13.4059 0.0000 0.0000 23.4747 1.4972 24.9718WISE 0.7167 0.0740 0.0000 1.0217 0.0000 0.0000 1.8123 0.0956 1.9079VERNON 0.8921 0.0901 0.0010 1.2706 0.0000 0.0000 2.2539 0.3850 2.6389UNION 0.4936 9.8874 0.1900 7.7250 0.0000 0.0000 18.2960 1.7395 20.0355SHERMAN 0.2902 0.2065 0.0225 4.5722 0.0000 0.0000 5.0914 0.2339 5.3254ROLLAND 0.6510 0.0448 0.0159 1.2647 0.0000 0.0000 1.9765 0.0931 2.0696NOTTAWA 0.9898 0.1065 0.0523 2.5936 0.0000 0.0000 3.7422 0.1674 3.9096LINCOLN 1.1141 0.0688 0.0001 2.0640 0.0000 0.0000 3.2469 0.0986 3.3456ISABELLA 1.1393 0.2706 0.0000 1.8984 0.0000 0.0000 3.3083 0.8985 4.2068GILMORE 0.3785 0.0109 0.0000 2.1796 0.0000 0.0000 2.5689 0.0803 2.6492FREMONT 0.6417 0.0302 0.5217 1.5092 0.0000 0.0000 2.7027 0.1165 2.8192DENVER 0.5718 0.0342 0.0000 1.1613 0.0000 0.0000 1.7673 0.0946 1.8620DEERFIELD 0.5540 0.0676 0.0612 5.6017 0.0000 0.0000 6.2845 0.2401 6.5246COLDWATER 0.2880 0.0092 0.0076 1.0482 0.0000 0.0000 1.3530 0.0515 1.4045COE 1.1081 0.4173 0.0107 2.7433 0.0000 0.0000 4.2795 2.0779 6.3574CHIPPEWA 0.3162 0.3595 0.0137 4.1303 0.0000 0.0000 4.8198 0.6403 5.4601BROOMFIELD 0.4765 0.0817 0.1302 3.0727 0.0000 0.0000 3.7611 0.2782 4.0393Governmental Unit Agricultural Commercial Industrial Residential Cutover mental Real Personal &Personal
Timber- Develop- Total Total Total Real
34
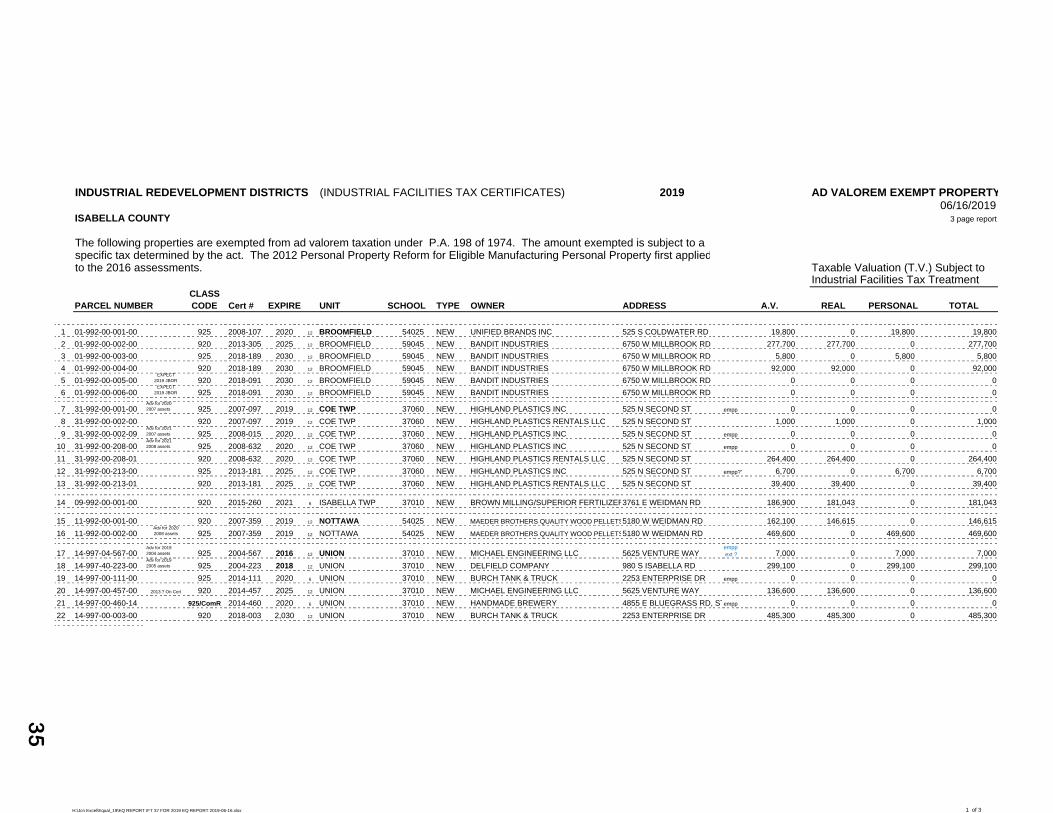
INDUSTRIAL REDEVELOPMENT DISTRICTS (INDUSTRIAL FACILITIES TAX CERTIFICATES) 2019 AD VALOREM EXEMPT PROPERTY06/16/2019
ISABELLA COUNTY 3 page report
The following properties are exempted from ad valorem taxation under P.A. 198 of 1974. The amount exempted is subject to a specific tax determined by the act. The 2012 Personal Property Reform for Eligible Manufacturing Personal Property first appliedto the 2016 assessments. Taxable Valuation (T.V.) Subject to
Industrial Facilities Tax TreatmentCLASS
PARCEL NUMBER CODE Cert # EXPIRE UNIT SCHOOL TYPE OWNER ADDRESS A.V. REAL PERSONAL TOTAL
1 01-992-00-001-00 925 2008-107 2020 12 BROOMFIELD 54025 NEW UNIFIED BRANDS INC 525 S COLDWATER RD 19,800 0 19,800 19,800
2 01-992-00-002-00 920 2013-305 2025 12 BROOMFIELD 59045 NEW BANDIT INDUSTRIES 6750 W MILLBROOK RD 277,700 277,700 0 277,700
3 01-992-00-003-00 925 2018-189 2030 12 BROOMFIELD 59045 NEW BANDIT INDUSTRIES 6750 W MILLBROOK RD 5,800 0 5,800 5,800
4 01-992-00-004-00 920 2018-189 2030 12 BROOMFIELD 59045 NEW BANDIT INDUSTRIES 6750 W MILLBROOK RD 92,000 92,000 0 92,000
5 01-992-00-005-00EXPECT
2019 JBOR 920 2018-091 2030 12 BROOMFIELD 59045 NEW BANDIT INDUSTRIES 6750 W MILLBROOK RD 0 0 0 0
6 01-992-00-006-00EXPECT
2019 JBOR 925 2018-091 2030 12 BROOMFIELD 59045 NEW BANDIT INDUSTRIES 6750 W MILLBROOK RD 0 0 0 0
7 31-992-00-001-00Adv for 20202007 assets 925 2007-097 2019 12 COE TWP 37060 NEW HIGHLAND PLASTICS INC 525 N SECOND ST empp 0 0 0 0
8 31-992-00-002-00 920 2007-097 2019 12 COE TWP 37060 NEW HIGHLAND PLASTICS RENTALS LLC 525 N SECOND ST 1,000 1,000 0 1,000
9 31-992-00-002-09Adv for 20212007 assets 925 2008-015 2020 12 COE TWP 37060 NEW HIGHLAND PLASTICS INC 525 N SECOND ST empp 0 0 0 0
10 31-992-00-208-00Adv for 20212008 assets 925 2008-632 2020 12 COE TWP 37060 NEW HIGHLAND PLASTICS INC 525 N SECOND ST empp 0 0 0 0
11 31-992-00-208-01 920 2008-632 2020 12 COE TWP 37060 NEW HIGHLAND PLASTICS RENTALS LLC 525 N SECOND ST 264,400 264,400 0 264,400
12 31-992-00-213-00 925 2013-181 2025 12 COE TWP 37060 NEW HIGHLAND PLASTICS INC 525 N SECOND ST empp?? 6,700 0 6,700 6,700
13 31-992-00-213-01 920 2013-181 2025 12 COE TWP 37060 NEW HIGHLAND PLASTICS RENTALS LLC 525 N SECOND ST 39,400 39,400 0 39,400
14 09-992-00-001-00 920 2015-260 2021 6 ISABELLA TWP 37010 NEW BROWN MILLING/SUPERIOR FERTILIZER3761 E WEIDMAN RD 186,900 181,043 0 181,043
15 11-992-00-001-00 920 2007-359 2019 12 NOTTAWA 54025 NEW MAEDER BROTHERS QUALITY WOOD PELLETS5180 W WEIDMAN RD 162,100 146,615 0 146,615
16 11-992-00-002-00Adv for 20202008 assets 925 2007-359 2019 12 NOTTAWA 54025 NEW MAEDER BROTHERS QUALITY WOOD PELLETS5180 W WEIDMAN RD 469,600 0 469,600 469,600
17 14-997-04-567-00Adv for 20192004 assets 925 2004-567 2016 12 UNION 37010 NEW MICHAEL ENGINEERING LLC 5625 VENTURE WAY
empp ext ? 7,000 0 7,000 7,000
18 14-997-40-223-00Adv for 20192005 assets 925 2004-223 2018 12 UNION 37010 NEW DELFIELD COMPANY 980 S ISABELLA RD 299,100 0 299,100 299,100
19 14-997-00-111-00 925 2014-111 2020 6 UNION 37010 NEW BURCH TANK & TRUCK 2253 ENTERPRISE DR empp 0 0 0 0
20 14-997-00-457-00 2013 ? On Cert 920 2014-457 2025 12 UNION 37010 NEW MICHAEL ENGINEERING LLC 5625 VENTURE WAY 136,600 136,600 0 136,600
21 14-997-00-460-14 925/ComR 2014-460 2020 6 UNION 37010 NEW HANDMADE BREWERY 4855 E BLUEGRASS RD, STempp 0 0 0 0
22 14-997-00-003-00 920 2018-003 2,030 12 UNION 37010 NEW BURCH TANK & TRUCK 2253 ENTERPRISE DR 485,300 485,300 0 485,300
H:\Jcn Excel\Equal_19\EQ REPORT IFT 37 FOR 2019 EQ REPORT 2019-06-16.xlsx 1 of 3
35

INDUSTRIAL REDEVELOPMENT DISTRICTS (INDUSTRIAL FACILITIES TAX CERTIFICATES) 2019 AD VALOREM EXEMPT PROPERTY06/16/2019
ISABELLA COUNTY 3 page report
The following properties are exempted from ad valorem taxation under P.A. 198 of 1974. The amount exempted is subject to a specific tax determined by the act. The 2012 Personal Property Reform for Eligible Manufacturing Personal Property first appliedto the 2016 assessments. Taxable Valuation (T.V.) Subject to
Industrial Facilities Tax TreatmentCLASS
PARCEL NUMBER CODE Cert # EXPIRE UNIT SCHOOL TYPE OWNER ADDRESS A.V. REAL PERSONAL TOTAL
23 17-992-00-034-00 921 2007-118 2019 12 MT PLEASANT 37010 NEW ANTLER DEVELOPMENT CO LLC 1790 GOVER PARKWAY 234,700 234,700 0 234,700
24 17-992-00-035-00 922 2007-394 2019 12 MT PLEASANT 37010 NEW BILLS CUSTOM FAB INC 1836 GOVER PARKWAY empp 0 0 0 0
25 17-992-00-036-00To Adv for 20192008 assets 922/004 2007-270 2013 6 MT PLEASANT 37010 NEW CME CORPORATION 2945 THREE LEAVES DR 0 0 0 0
26 17-992-00-037-00To Adv for 20192007 assets 922/004 2007-271 2013 6 MT PLEASANT 37010 NEW CME CORPORATION 2945 THREE LEAVES DR 0 0 0 0
27 17-992-00-041-00To Adv for 20212010 assets 922 2009-193 2015 6 MT PLEASANT 37010 NEW CME CORPORATION 2945 THREE LEAVES DR empp 278,300 0 278,300 278,300
28 17-992-00-042-00adval 2023--20102011 2012 assets 922 2010-260 2022 12 MT PLEASANT 37010 NEW CME CORPORATION 2945 THREE LEAVES DR empp 882,100 0 882,100 882,100
29 17-992-00-043-00 921 2010-260 2022 12 MT PLEASANT 37010 NEW CME CORPORATION 2945 THREE LEAVES DR 99,900 99,900 0 99,900
30 17-992-00-045-00 921 2010-322 2022 12 MT PLEASANT 37010 NEW Q-SAGE INC 2150 JBS TRL 45,000 45,000 0 45,000
31 17-992-00-047-002018 form5076 922 2013-442 2019 6 MT PLEASANT 37010 NEW ON THE MARK 801 INDUSTRIAL PARK DR 25,000 0 25,000 25,000
32 17-992-00-048-00 922/ComR 2013-304 2019 6 MT PLEASANT 37010 NEW MTW INDUSTRIES LLC 706 W PICKARD ST 109,400 0 109,400 109,400
33 17-992-00-049-00 921 2014-063 2026 12 MT PLEASANT 37010 NEW Q-SAGE INC 2150 JBS TRL 224,700 224,700 0 224,700
34 17-992-00-050-00 922 2014-063 2020 12 MT PLEASANT 37010 NEW Q-SAGE INC 2150 JBS TRL 49,700 0 49,700 49,700
35 17-992-00-051-00 921 2014-228 2024 10 MT PLEASANT 37010 NEW DAYCO 1799 GOVER PKWY 881,300 881,300 0 881,300
36 17-992-00-052-00 922 2014-228 2020 6 MT PLEASANT 37010 NEW DAYCO 1799 GOVER PKWY empp 0 0 0 0
37 17-992-00-053-00 921 2014-350 2026 12 MT PLEASANT 37010 NEW J & J LAND MANAGEMENT LLC 1900 GOVER PARKWAY 143,800 143,800 0 143,800
38 17-992-00-054-00 922 2014-350 2020 6 MT PLEASANT 37010 NEW J & J LAND MANAGEMENT LLC 1900 GOVER PARKWAY 7,200 0 7,200 7,200
39 17-992-00-055-00 2019 install 921 2018-182 2030 12 MT PLEASANT 37010 NEW AMERICAN MITSUBA CORPORATION 2945 THREE LEAVES DR 0 0 0 0
40 17-992-00-056-00 2019 install 922 2018-182 2030 12 MT PLEASANT 37010 NEW AMERICAN MITSUBA CORPORATION 2945 THREE LEAVES DR 0 0 0 0
H:\Jcn Excel\Equal_19\EQ REPORT IFT 37 FOR 2019 EQ REPORT 2019-06-16.xlsx 2 of 3
36

INDUSTRIAL REDEVELOPMENT DISTRICTS (INDUSTRIAL FACILITIES TAX CERTIFICATES) 2019 AD VALOREM EXEMPT PROPERTY06/16/2019
ISABELLA COUNTY 3 page report
The following properties are exempted from ad valorem taxation under P.A. 198 of 1974. The amount exempted is subject to a specific tax determined by the act. The 2012 Personal Property Reform for Eligible Manufacturing Personal Property first appliedto the 2016 assessments. Taxable Valuation (T.V.) Subject to
Industrial Facilities Tax TreatmentCLASS
PARCEL NUMBER CODE Cert # EXPIRE UNIT SCHOOL TYPE OWNER ADDRESS A.V. REAL PERSONAL TOTAL
41 18-990-00-014-10To Adv for 2019prior 2003 assets 925 2002-135 2014 12 CLARE 18010 NEW LETHERER TRUSS INC 851 INDUSTRIAL CT empp 0 0 0 0
42 18-990-00-016-00To Adv for 2019prior 2004 assets 925 2003-586 2016 12 CLARE 18010 NEW LETHERER TRUSS INC 851 INDUSTRIAL CT empp 0 0 0 0
43 18-990-00-018-00To Adv 2019prior 2003 assets 925 2002-542 2015 12 CLARE 18010 NEW INTERGRITY PRINTING INC 760 INDUSTRIAL DR empp 0 0 0 0
44 18-990-00-019-00To Adv 2019prior 2004 assets 925 2003-224 2015 12 CLARE 18010 NEW INTERGRITY PRINTING INC 760 INDUSTRIAL DR empp 0 0 0 0
45 18-990-00-205-01To Adv 20192005 assets 925 2005-441 2017 12 CLARE 18010 NEW INTERGRITY PRINTING INC 760 INDUSTRIAL DR empp 0 0 0 0
46 18-990-00-207-01To Adv 2019prior 2007 assets 925 2006-004 2018 12 CLARE 18010 NEW INTERGRITY PRINTING INC 760 INDUSTRIAL DR empp 0 0 0 0
47 18-990-00-208-01To Adv 2020prior 2007 assets 925 2007-062 2019 12 CLARE 18010 NEW INTERGRITY PRINTING INC 760 INDUSTRIAL DR empp 0 0 0 0
48 18-990-00-208-02 925 2008-017 2020 12 CLARE 18010 NEW ALRO STEEL CORPORATION 500 INDUSTRIAL DR empp 0 0 0 0
49 18-990-00-210-01 2009 assets 925 2009-409 2021 12 CLARE 18010 NEW INTERGRITY PRINTING INC 760 INDUSTRIAL DR empp 26,900 0 26,900 26,900
50 18-990-00-212-01 2010 assets 925 2011-121 2023 12 CLARE 18010 NEW JD METALWORKS INC 635 INDUSTRIAL DR empp 34,300 0 34,300 34,300
51 18-990-00-212-02 2011 assets 925 2011-389 2023 12 CLARE 18010 NEW ALRO STEEL CORPORATION 500 INDUSTRIAL DR empp 0 0 0 0
52 18-990-00-214-02 2012 assets 925 2013-048 2025 12 CLARE 18010 NEW JD METALWORKS INC 635 INDUSTRIAL DR empp 32,200 0 32,200 32,200
53 18-990-00-214-03 920 2013-048 2025 12 CLARE 18010 NEW JD METALWORKS INC 635 INDUSTRIAL DR 32,000 31,951 0 31,951
54 18-990-00-215-01 2013 assets 925 2014-074 2026 12 CLARE 18010 NEW JD METALWORKS INC 635 INDUSTRIAL DR empp 0 0 0 0
------------ --------------------- ------------ -------- - -------------------------------- ----------------- -------------- -------------- ----------------------NUMBER UNIT TYPE OWNER ADDRESS A.V. REAL PERSONAL TOTAL
IFT REAL PROPERTY 920 & 921 TOTALS by Local Unit: BROOMFIELD TWP 6 395,300 369,700 25,600 395,300
IFT PERSONAL PROPERTY 922 & 925 COE TWP - Shepherd 7 311,500 304,800 6,700 311,500
ISABELLA TWP 1 186,900 181,043 0 181,043
NOTTAWA TWP 2 631,700 146,615 469,600 616,215
SHERMAN- Lake Isabella - revoked 2016 0 0 0 0 0
UNION 6 928,000 621,900 306,100 928,000
MT PLEASANT 18 2,981,100 1,629,400 1,351,700 2,981,100
CLARE 14 125,400 31,951 93,400 125,351
2,769,255 = EQUIVALENT TAX BASE VALUE ========= == ========= == ==============
ISABELLA COUNTY 54 5,559,900 3,285,409 2,253,100 5,538,509
::
TOTALS by School Dist: SCHOOL
Clare Schools 18010 14 125,400 31,951 93,400 125,351
SCHOOL
Mt Pleasant Schools 37010 25 4,096,000 2,432,343 1,657,800 4,090,143
SCHOOL
Shepherd Schools 37060 7 311,500 304,800 6,700 311,500
SCHOOL
Chippewa Hills Schools 54025 3 651,500 146,615 489,400 636,015
SCHOOL
Montabella Schools 59045 5 375,500 369,700 5,800 375,500
54 5,559,900 3,285,409 2,253,100 5,538,509
includes hidden rows
H:\Jcn Excel\Equal_19\EQ REPORT IFT 37 FOR 2019 EQ REPORT 2019-06-16.xlsx 3 of 3
37

Isabella County Public Act 513 of 2004 DNR Lands Subject to PILT PaymentsStarting in 2005, TV of DNR lands subject to PILT in 2004 shall remain the same through the 2008 assessment year. (STC LTR 01-25-2005 and STC Bulletin #15 of 2005)
Starting in 2009 the TV shall not increase by more than the increase in the general price level from the previous year or 5% whichever is less.
Millage Rates shall not include: 1) Assessments for special improvements. 2) Any millage in excess of the millage rate levied in 2004. 3) The State Education Tax (SET). 4) The 18 mills of local school operating tax.
Per Public Act 603 of 2012 -- Bulletin 8 of 2013 DNR PILT Property:Starting 2013 Valuations adjusted to traditional valuation process by STATE staff and current year millage rates and special assessments where applicable should be applied.
Starting 2013 shall not include: 1) The State Education Tax (SET). 2) The 18 mills of local school operating tax. 3) Administrative Fees.
Parcel Number Owner DNR Previous Real Class State 2019 2004 Qualified Acres Sec. Town Range
PILT Parcel Number Equalized Taxable Taxable Ag.
Number Value Value Value % Sch# Name
1. 06-D25-10-001-00 Dept of Natural Resources 31263 06-025-10-001-00 103 13,800 3,209 2,356 100 40.00 37010 Mt Pleasant 25 15N 03W
2. 06-D26-20-002-00 Dept of Natural Resources 32393 06-026-20-002-00 103 98,400 42,404 31,111 100 80.00 37010 Mt Pleasant 26 15N 03W
3. 06-D27-30-001-00 Dept of Natural Resources 2133 06-027-30-001-00 103 98,400 33,866 24,847 100 80.00 37010 Mt Pleasant 27 15N 03W
4. 06-D35-20-001-00 Dept of Natural Resources 32786 06-035-20-001-00 103 49,800 16,433 12,058 100 40.00 37010 Mt Pleasant 35 15N 03W
5. 07-D31-30-002-00 Dept of Natural Resources 2134 07-031-30-002-00 713 48,700 18,711 13,729 100 40.00 59045 Montabella 31 13N 05W
6. 07-D31-40-001-00 Dept of Natural Resources 33786 07-031-40-001-00 713 120,000 126,968 New DNR PILT
for 2015 100 80.00 59045 Montabella 31 13N 05W
7. 07-D34-40-001-00 Dept of Natural Resources 31128 07-034-40-001-00 713 339,600 119,373 87,579 100 360.00 59150 Vestaburg 34 13N 05W
8. 08-D17-30-004-00 Dept of Natural Resources 2135 08-017-30-004-00 103 37,400 33,529 24,599 100 2.4 16.00 54025 Chip. Hills 17 16N 05W
9. 08-D18-40-006-10 Dept of Natural Resources 33341 08-018-40-006-10 103 70,000 67,478 New DNR PILT
for 2008 100 10.65 54025 Chip. Hills 18 16N 05W
10. 12-D35-40-002-00 Dept of Natural Resources 2136 12-035-40-002-00 103 98,700 30,579 22,436 100 80.00 59045 Montabella 35 13N 06W
11. 12-D36-40-001-00 Dept of Natural Resources 2137 12-036-40-001-00 103 241,100 74,360 54,556 100 200.00 59045 Montabella 36 13N 06W
12. 15-D19-40-006-00 Dept of Natural Resources 2138 15-019-40-006-00 103 30,200 16,303 11,962 100 0.95 18010 Clare 19 16N 04W
Count 12 Totals 1,246,100 583,213 285,233 1,027.60
Unit Name Count S.E.V, T.V. Acres Count School Name
Denver Twp 4 260,400 95,912 240.00 1
Freemont Twp 3 508,300 265,052 480.00 4
Gilmore Twp 2 107,400 101,007 13.05? 26.65 2
Rolland Twp 2 339,800 104,939 280.00 4
Vernon Twp 1 30,200 16,303 0.95 1
ISABELLA COUNTY 12 1,246,100 583,213 1027.60 12
2019
Vestaburg Schools
School
District
Clare Schools
Mt Pleasant Schools
Chippewa Hills Schools
Montabella Schools
6/16/2019
H:\Jcn Excel\Equal_19\EQ REPORT DNR Pilt List 2019 2019-06-16.xls
38
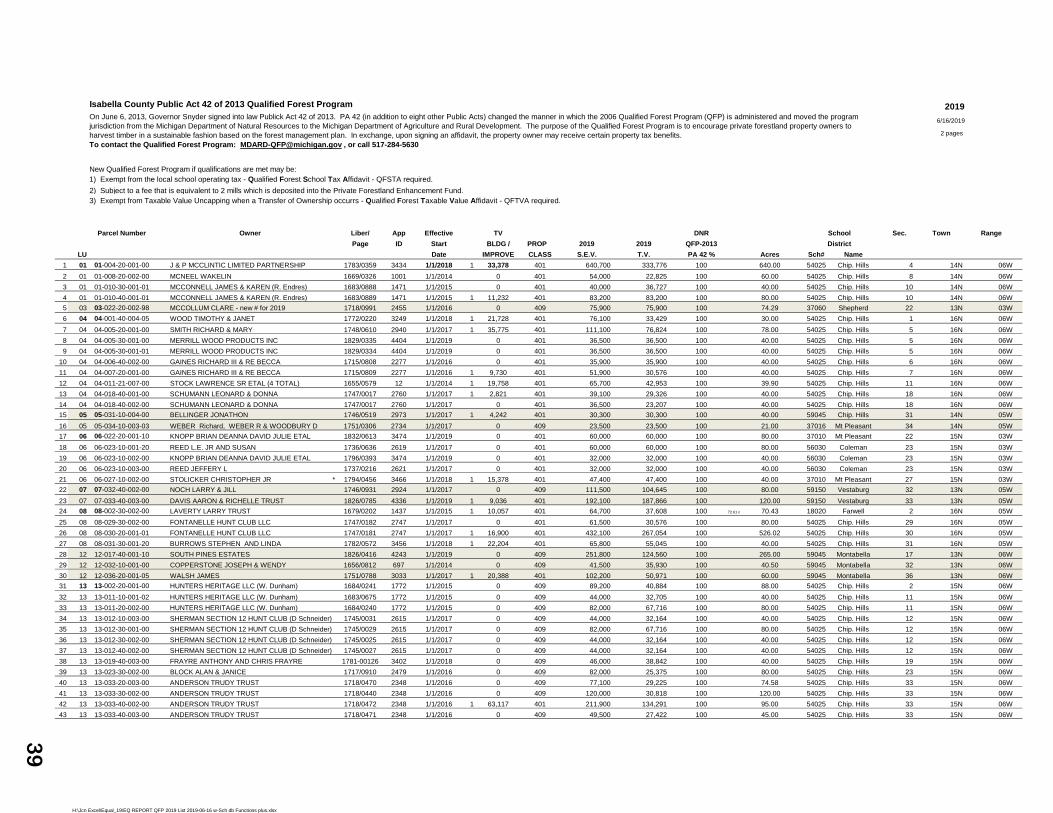
Isabella County Public Act 42 of 2013 Qualified Forest Program
2 pages
New Qualified Forest Program if qualifications are met may be: 1) Exempt from the local school operating tax - Qualified Forest School Tax Affidavit - QFSTA required.
2) Subject to a fee that is equivalent to 2 mills which is deposited into the Private Forestland Enhancement Fund.3) Exempt from Taxable Value Uncapping when a Transfer of Ownership occurrs - Qualified Forest Taxable Value Affidavit - QFTVA required.
Parcel Number Owner Liber/ App Effective TV DNR Sec. Town Range
Page ID Start BLDG / PROP 2019 2019 QFP-2013
LU Date IMPROVE CLASS S.E.V. T.V. PA 42 % Acres Sch# Name
1 01 01-004-20-001-00 J & P MCCLINTIC LIMITED PARTNERSHIP 1783/0359 3434 1/1/2018 1 33,378 401 640,700 333,776 100 640.00 54025 Chip. Hills 4 14N 06W
2 01 01-008-20-002-00 MCNEEL WAKELIN 1669/0326 1001 1/1/2014 0 401 54,000 22,825 100 60.00 54025 Chip. Hills 8 14N 06W
3 01 01-010-30-001-01 MCCONNELL JAMES & KAREN (R. Endres) 1683/0888 1471 1/1/2015 0 401 40,000 36,727 100 40.00 54025 Chip. Hills 10 14N 06W
4 01 01-010-40-001-01 MCCONNELL JAMES & KAREN (R. Endres) 1683/0889 1471 1/1/2015 1 11,232 401 83,200 83,200 100 80.00 54025 Chip. Hills 10 14N 06W
5 03 03-022-20-002-98 MCCOLLUM CLARE - new # for 2019 1718/0991 2455 1/1/2016 0 409 75,900 75,900 100 74.29 37060 Shepherd 22 13N 03W
6 04 04-001-40-004-05 WOOD TIMOTHY & JANET 1772/0220 3249 1/1/2018 1 21,728 401 76,100 33,429 100 30.00 54025 Chip. Hills 1 16N 06W
7 04 04-005-20-001-00 SMITH RICHARD & MARY 1748/0610 2940 1/1/2017 1 35,775 401 111,100 76,824 100 78.00 54025 Chip. Hills 5 16N 06W
8 04 04-005-30-001-00 MERRILL WOOD PRODUCTS INC 1829/0335 4404 1/1/2019 0 401 36,500 36,500 100 40.00 54025 Chip. Hills 5 16N 06W
9 04 04-005-30-001-01 MERRILL WOOD PRODUCTS INC 1829/0334 4404 1/1/2019 0 401 36,500 36,500 100 40.00 54025 Chip. Hills 5 16N 06W
10 04 04-006-40-002-00 GAINES RICHARD III & RE BECCA 1715/0808 2277 1/1/2016 0 401 35,900 35,900 100 40.00 54025 Chip. Hills 6 16N 06W
11 04 04-007-20-001-00 GAINES RICHARD III & RE BECCA 1715/0809 2277 1/1/2016 1 9,730 401 51,900 30,576 100 40.00 54025 Chip. Hills 7 16N 06W
12 04 04-011-21-007-00 STOCK LAWRENCE SR ETAL (4 TOTAL) 1655/0579 12 1/1/2014 1 19,758 401 65,700 42,953 100 39.90 54025 Chip. Hills 11 16N 06W
13 04 04-018-40-001-00 SCHUMANN LEONARD & DONNA 1747/0017 2760 1/1/2017 1 2,821 401 39,100 29,326 100 40.00 54025 Chip. Hills 18 16N 06W
14 04 04-018-40-002-00 SCHUMANN LEONARD & DONNA 1747/0017 2760 1/1/2017 0 401 36,500 23,207 100 40.00 54025 Chip. Hills 18 16N 06W
15 05 05-031-10-004-00 BELLINGER JONATHON 1746/0519 2973 1/1/2017 1 4,242 401 30,300 30,300 100 40.00 59045 Chip. Hills 31 14N 05W
16 05 05-034-10-003-03 WEBER Richard, WEBER R & WOODBURY D 1751/0306 2734 1/1/2017 0 409 23,500 23,500 100 21.00 37016 Mt Pleasant 34 14N 05W
17 06 06-022-20-001-10 KNOPP BRIAN DEANNA DAVID JULIE ETAL 1832/0613 3474 1/1/2019 0 401 60,000 60,000 100 80.00 37010 Mt Pleasant 22 15N 03W
18 06 06-023-10-001-20 REED L.E. JR AND SUSAN 1736/0636 2619 1/1/2017 0 401 60,000 60,000 100 80.00 56030 Coleman 23 15N 03W
19 06 06-023-10-002-00 KNOPP BRIAN DEANNA DAVID JULIE ETAL 1796/0393 3474 1/1/2019 0 401 32,000 32,000 100 40.00 56030 Coleman 23 15N 03W
20 06 06-023-10-003-00 REED JEFFERY L 1737/0216 2621 1/1/2017 0 401 32,000 32,000 100 40.00 56030 Coleman 23 15N 03W
21 06 06-027-10-002-00 STOLICKER CHRISTOPHER JR * 1794/0456 3466 1/1/2018 1 15,378 401 47,400 47,400 100 40.00 37010 Mt Pleasant 27 15N 03W
22 07 07-032-40-002-00 NOCH LARRY & JILL 1746/0931 2924 1/1/2017 0 409 111,500 104,645 100 80.00 59150 Vestaburg 32 13N 05W
23 07 07-033-40-003-00 DAVIS AARON & RICHELLE TRUST 1826/0785 4336 1/1/2019 1 9,036 401 192,100 187,866 100 120.00 59150 Vestaburg 33 13N 05W
24 08 08-002-30-002-00 LAVERTY LARRY TRUST 1679/0202 1437 1/1/2015 1 10,057 401 64,700 37,608 100 72.61 m 70.43 18020 Farwell 2 16N 05W
25 08 08-029-30-002-00 FONTANELLE HUNT CLUB LLC 1747/0182 2747 1/1/2017 0 401 61,500 30,576 100 80.00 54025 Chip. Hills 29 16N 05W
26 08 08-030-20-001-01 FONTANELLE HUNT CLUB LLC 1747/0181 2747 1/1/2017 1 16,900 401 432,100 267,054 100 526.02 54025 Chip. Hills 30 16N 05W
27 08 08-031-30-001-20 BURROWS STEPHEN AND LINDA 1782/0572 3456 1/1/2018 1 22,204 401 65,800 55,045 100 40.00 54025 Chip. Hills 31 16N 05W
28 12 12-017-40-001-10 SOUTH PINES ESTATES 1826/0416 4243 1/1/2019 0 409 251,800 124,560 100 265.00 59045 Montabella 17 13N 06W
29 12 12-032-10-001-00 COPPERSTONE JOSEPH & WENDY 1656/0812 697 1/1/2014 0 409 41,500 35,930 100 40.50 59045 Montabella 32 13N 06W
30 12 12-036-20-001-05 WALSH JAMES 1751/0788 3033 1/1/2017 1 20,388 401 102,200 50,971 100 60.00 59045 Montabella 36 13N 06W
31 13 13-002-20-001-00 HUNTERS HERITAGE LLC (W. Dunham) 1684/0241 1772 1/1/2015 0 409 89,200 40,884 100 88.00 54025 Chip. Hills 2 15N 06W
32 13 13-011-10-001-02 HUNTERS HERITAGE LLC (W. Dunham) 1683/0675 1772 1/1/2015 0 409 44,000 32,705 100 40.00 54025 Chip. Hills 11 15N 06W
33 13 13-011-20-002-00 HUNTERS HERITAGE LLC (W. Dunham) 1684/0240 1772 1/1/2015 0 409 82,000 67,716 100 80.00 54025 Chip. Hills 11 15N 06W
34 13 13-012-10-003-00 SHERMAN SECTION 12 HUNT CLUB (D Schneider) 1745/0031 2615 1/1/2017 0 409 44,000 32,164 100 40.00 54025 Chip. Hills 12 15N 06W
35 13 13-012-30-001-00 SHERMAN SECTION 12 HUNT CLUB (D Schneider) 1745/0029 2615 1/1/2017 0 409 82,000 67,716 100 80.00 54025 Chip. Hills 12 15N 06W
36 13 13-012-30-002-00 SHERMAN SECTION 12 HUNT CLUB (D Schneider) 1745/0025 2615 1/1/2017 0 409 44,000 32,164 100 40.00 54025 Chip. Hills 12 15N 06W
37 13 13-012-40-002-00 SHERMAN SECTION 12 HUNT CLUB (D Schneider) 1745/0027 2615 1/1/2017 0 409 44,000 32,164 100 40.00 54025 Chip. Hills 12 15N 06W
38 13 13-019-40-003-00 FRAYRE ANTHONY AND CHRIS FRAYRE 1781-00126 3402 1/1/2018 0 409 46,000 38,842 100 40.00 54025 Chip. Hills 19 15N 06W
39 13 13-023-30-002-00 BLOCK ALAN & JANICE 1717/0910 2479 1/1/2016 0 409 82,000 25,375 100 80.00 54025 Chip. Hills 23 15N 06W
40 13 13-033-20-003-00 ANDERSON TRUDY TRUST 1718/0470 2348 1/1/2016 0 409 77,100 29,225 100 74.58 54025 Chip. Hills 33 15N 06W
41 13 13-033-30-002-00 ANDERSON TRUDY TRUST 1718/0440 2348 1/1/2016 0 409 120,000 30,818 100 120.00 54025 Chip. Hills 33 15N 06W
42 13 13-033-40-002-00 ANDERSON TRUDY TRUST 1718/0472 2348 1/1/2016 1 63,117 401 211,900 134,291 100 95.00 54025 Chip. Hills 33 15N 06W
43 13 13-033-40-003-00 ANDERSON TRUDY TRUST 1718/0471 2348 1/1/2016 0 409 49,500 27,422 100 45.00 54025 Chip. Hills 33 15N 06W
2019On June 6, 2013, Governor Snyder signed into law Publick Act 42 of 2013. PA 42 (in addition to eight other Public Acts) changed the manner in which the 2006 Qualified Forest Program (QFP) is administered and moved the program jurisdiction from the Michigan Department of Natural Resources to the Michigan Department of Agriculture and Rural Development. The purpose of the Qualified Forest Program is to encourage private forestland property owners to harvest timber in a sustainable fashion based on the forest management plan. In exchange, upon signing an affidavit, the property owner may receive certain property tax benefits.To contact the Qualified Forest Program: [email protected] , or call 517-284-5630
6/16/2019
School
District
H:\Jcn Excel\Equal_19\EQ REPORT QFP 2019 List 2019-06-16 w-Sch db Functions plus.xlsx
39

Isabella County Public Act 42 of 2013 Qualified Forest Program
2 pages
New Qualified Forest Program if qualifications are met may be: 1) Exempt from the local school operating tax - Qualified Forest School Tax Affidavit - QFSTA required.
2) Subject to a fee that is equivalent to 2 mills which is deposited into the Private Forestland Enhancement Fund.3) Exempt from Taxable Value Uncapping when a Transfer of Ownership occurrs - Qualified Forest Taxable Value Affidavit - QFTVA required.
Parcel Number Owner Liber/ App Effective TV DNR Sec. Town Range
Page ID Start BLDG / PROP 2019 2019 QFP-2013
LU Date IMPROVE CLASS S.E.V. T.V. PA 42 % Acres Sch# Name
2019On June 6, 2013, Governor Snyder signed into law Publick Act 42 of 2013. PA 42 (in addition to eight other Public Acts) changed the manner in which the 2006 Qualified Forest Program (QFP) is administered and moved the program jurisdiction from the Michigan Department of Natural Resources to the Michigan Department of Agriculture and Rural Development. The purpose of the Qualified Forest Program is to encourage private forestland property owners to harvest timber in a sustainable fashion based on the forest management plan. In exchange, upon signing an affidavit, the property owner may receive certain property tax benefits.To contact the Qualified Forest Program: [email protected] , or call 517-284-5630
6/16/2019
School
District
44 15 15-007-30-001-00 GLASS LAKE PROPERTY LLC 1826/0527 4426 1/1/2019 0 401 182,300 34,742 100 135.20 18010 Clare 7 16N 04W
45 16 16-001-20-002-00 MIZE (Mike) TRUST & AUGUSTINE TRUST 1680/0183 1553 1/1/2015 0 409 36,600 36,600 100 41.50 18010 Clare 1 16N 03W
Count 45 Totals 295,744 4,226,100 2,739,926 3,944.42
Count 15
BLDG / T.V.
Unit Name Count IMPROVE S.E.V, T.V. w/o IMPROVE Acres School # TV Acres
01 Broomfield Twp 4 44,610 817,900 476,528 431,918 820.00 18010 2 71,342 176.70
03 Coe Twp 1 0 75,900 75,900 75,900 74.29 18020 1 37,608 70.43
04 Coldwater Twp 9 89,812 489,300 345,215 255,403 387.90 37010 3 130,900 141.00
05 Deerfield Twp 2 4,242 53,800 53,800 49,558 61.00 37040 0 0 0.00
06 Denver 5 15,378 231,400 231,400 216,022 280.00 37060 1 75,900 74.29
07 Fremont Twp 2 9,036 303,600 292,511 283,475 200.00 54025 29 1,765,904 2,716.50
08 Gilmore Twp 4 49,161 624,100 390,283 341,122 716.45 56030 3 124,000 160.00
12 Rolland Twp 3 20,388 395,500 211,461 191,073 365.50 59045 4 241,761 405.50
13 Sherman Twp 13 63,117 1,015,700 591,486 528,369 862.58 59150 2 292,511 200.00
15 Vernon Twp 1 0 182,300 34,742 34,742 135.20
16 Wise Twp 1 0 36,600 36,600 36,600 41.50
ISABELLA COUNTY 45 295,744 4,226,100 2,739,926 2,444,182 3,944.42 45 2,739,926 3,944.42
H:\Jcn Excel\Equal_19\EQ REPORT QFP 2019 List 2019-06-16 w-Sch db Functions plus.xlsx
40

8/13/2019
BASE CURRENT EST. T.V. % of UNITCAPTURING PARCEL TAXABLE TAXABLE SUBJECT TV SUBJECTDISTRICT COUNT VALUES VALUES TO CAPTURE TO CAPTURE
*ad val count *base tv less current tv
UNION TOWNSHIP Total TV 3,612 378,237,428 19.42%
DDA East 690 8,706,767 55,906,112 47,199,345
DDA West 375 1,714,875 27,978,222 26,263,347
Unit Total 1,065 10,421,642 83,884,334 73,462,692
CITY OF MT PLEASANT Total TV 6,377 471,427,715 15.21%
BROWNFIELDS 35 4,024,914 10,319,549 6,418,965
OPRA 2 0 0 0
INDUSTRIAL PARK NORTH - TIFA 27 1,636,750 3,203,680 1,566,930 no capture requestedfor 2018 - 2020
UNIVERSITY PARK - LDFA 24 0 10,246,030 10,246,030
CENTRAL BUSINESS DISTR. - TIFA 558 6,051,650 17,060,660 11,009,010 no capture requested2019 & 2020
MISSION STREET - DDA 869 32,043,650 74,503,157 42,459,507
Unit Total 1,515 43,756,964 115,333,076 71,700,442
City of Clare Total TV 0 0 0.00% *
LDFA Ad Val 0 0 0 0No capture District in the Isabella County Portion of City of Clare since +- 2011
Unit Total 0 0 0 0
TOTALS 2,580 54,178,606 199,217,410 145,163,134
Isabella County Total TV 32,383 1,887,838,296 145,163,134 7.69%
2019 Tax Increment Finance Taxable Value Capture Estimates
H:\Jcn Excel\Equal_19\EQ REPORT TIF CAPTURED VALUE EST 2019 2019-08-06 with Pete's tab.xlsx
41
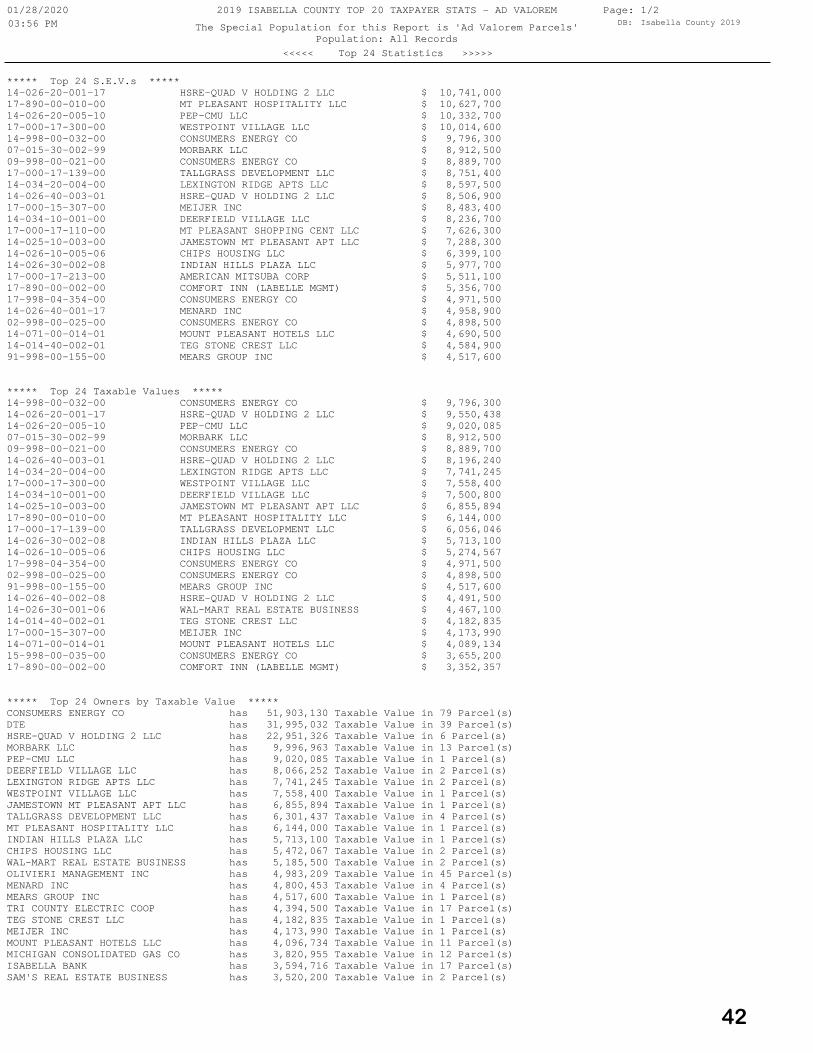
Population: All Records
2019 ISABELLA COUNTY TOP 20 TAXPAYER STATS - AD VALOREM
The Special Population for this Report is 'Ad Valorem Parcels'
Page: DB: Isabella County 2019
01/28/202003:56 PM
1/2
<<<<< Top 24 Statistics >>>>>
SAM'S REAL ESTATE BUSINESS has 3,520,200 Taxable Value in 2 Parcel(s)ISABELLA BANK has 3,594,716 Taxable Value in 17 Parcel(s)MICHIGAN CONSOLIDATED GAS CO has 3,820,955 Taxable Value in 12 Parcel(s)MOUNT PLEASANT HOTELS LLC has 4,096,734 Taxable Value in 11 Parcel(s)MEIJER INC has 4,173,990 Taxable Value in 1 Parcel(s)TEG STONE CREST LLC has 4,182,835 Taxable Value in 1 Parcel(s)TRI COUNTY ELECTRIC COOP has 4,394,500 Taxable Value in 17 Parcel(s)MEARS GROUP INC has 4,517,600 Taxable Value in 1 Parcel(s)MENARD INC has 4,800,453 Taxable Value in 4 Parcel(s)OLIVIERI MANAGEMENT INC has 4,983,209 Taxable Value in 45 Parcel(s)WAL-MART REAL ESTATE BUSINESS has 5,185,500 Taxable Value in 2 Parcel(s)CHIPS HOUSING LLC has 5,472,067 Taxable Value in 2 Parcel(s)INDIAN HILLS PLAZA LLC has 5,713,100 Taxable Value in 1 Parcel(s)MT PLEASANT HOSPITALITY LLC has 6,144,000 Taxable Value in 1 Parcel(s)TALLGRASS DEVELOPMENT LLC has 6,301,437 Taxable Value in 4 Parcel(s)JAMESTOWN MT PLEASANT APT LLC has 6,855,894 Taxable Value in 1 Parcel(s)WESTPOINT VILLAGE LLC has 7,558,400 Taxable Value in 1 Parcel(s)LEXINGTON RIDGE APTS LLC has 7,741,245 Taxable Value in 2 Parcel(s)DEERFIELD VILLAGE LLC has 8,066,252 Taxable Value in 2 Parcel(s)PEP-CMU LLC has 9,020,085 Taxable Value in 1 Parcel(s)MORBARK LLC has 9,996,963 Taxable Value in 13 Parcel(s)HSRE-QUAD V HOLDING 2 LLC has 22,951,326 Taxable Value in 6 Parcel(s)DTE has 31,995,032 Taxable Value in 39 Parcel(s)CONSUMERS ENERGY CO has 51,903,130 Taxable Value in 79 Parcel(s)***** Top 24 Owners by Taxable Value *****
17-890-00-002-00 COMFORT INN (LABELLE MGMT) $ 3,352,35715-998-00-035-00 CONSUMERS ENERGY CO $ 3,655,20014-071-00-014-01 MOUNT PLEASANT HOTELS LLC $ 4,089,13417-000-15-307-00 MEIJER INC $ 4,173,99014-014-40-002-01 TEG STONE CREST LLC $ 4,182,83514-026-30-001-06 WAL-MART REAL ESTATE BUSINESS $ 4,467,10014-026-40-002-08 HSRE-QUAD V HOLDING 2 LLC $ 4,491,50091-998-00-155-00 MEARS GROUP INC $ 4,517,60002-998-00-025-00 CONSUMERS ENERGY CO $ 4,898,50017-998-04-354-00 CONSUMERS ENERGY CO $ 4,971,50014-026-10-005-06 CHIPS HOUSING LLC $ 5,274,56714-026-30-002-08 INDIAN HILLS PLAZA LLC $ 5,713,10017-000-17-139-00 TALLGRASS DEVELOPMENT LLC $ 6,056,04617-890-00-010-00 MT PLEASANT HOSPITALITY LLC $ 6,144,00014-025-10-003-00 JAMESTOWN MT PLEASANT APT LLC $ 6,855,89414-034-10-001-00 DEERFIELD VILLAGE LLC $ 7,500,80017-000-17-300-00 WESTPOINT VILLAGE LLC $ 7,558,40014-034-20-004-00 LEXINGTON RIDGE APTS LLC $ 7,741,24514-026-40-003-01 HSRE-QUAD V HOLDING 2 LLC $ 8,196,24009-998-00-021-00 CONSUMERS ENERGY CO $ 8,889,70007-015-30-002-99 MORBARK LLC $ 8,912,50014-026-20-005-10 PEP-CMU LLC $ 9,020,08514-026-20-001-17 HSRE-QUAD V HOLDING 2 LLC $ 9,550,43814-998-00-032-00 CONSUMERS ENERGY CO $ 9,796,300***** Top 24 Taxable Values *****
91-998-00-155-00 MEARS GROUP INC $ 4,517,60014-014-40-002-01 TEG STONE CREST LLC $ 4,584,90014-071-00-014-01 MOUNT PLEASANT HOTELS LLC $ 4,690,50002-998-00-025-00 CONSUMERS ENERGY CO $ 4,898,50014-026-40-001-17 MENARD INC $ 4,958,90017-998-04-354-00 CONSUMERS ENERGY CO $ 4,971,50017-890-00-002-00 COMFORT INN (LABELLE MGMT) $ 5,356,70017-000-17-213-00 AMERICAN MITSUBA CORP $ 5,511,10014-026-30-002-08 INDIAN HILLS PLAZA LLC $ 5,977,70014-026-10-005-06 CHIPS HOUSING LLC $ 6,399,10014-025-10-003-00 JAMESTOWN MT PLEASANT APT LLC $ 7,288,30017-000-17-110-00 MT PLEASANT SHOPPING CENT LLC $ 7,626,30014-034-10-001-00 DEERFIELD VILLAGE LLC $ 8,236,70017-000-15-307-00 MEIJER INC $ 8,483,40014-026-40-003-01 HSRE-QUAD V HOLDING 2 LLC $ 8,506,90014-034-20-004-00 LEXINGTON RIDGE APTS LLC $ 8,597,50017-000-17-139-00 TALLGRASS DEVELOPMENT LLC $ 8,751,40009-998-00-021-00 CONSUMERS ENERGY CO $ 8,889,70007-015-30-002-99 MORBARK LLC $ 8,912,50014-998-00-032-00 CONSUMERS ENERGY CO $ 9,796,30017-000-17-300-00 WESTPOINT VILLAGE LLC $ 10,014,60014-026-20-005-10 PEP-CMU LLC $ 10,332,70017-890-00-010-00 MT PLEASANT HOSPITALITY LLC $ 10,627,70014-026-20-001-17 HSRE-QUAD V HOLDING 2 LLC $ 10,741,000***** Top 24 S.E.V.s *****
42

Population: All Records
2019 ISABELLA COUNTY TOP 20 TAXPAYER STATS - AD VALOREM
The Special Population for this Report is 'Ad Valorem Parcels'
Page: DB: Isabella County 2019
01/28/202003:56 PM
2/2
<<<<< Top 24 Statistics >>>>>
ISABELLA COUNTY PARKS has 769.95 Total Acres in 31 Parcel(s)SCHUMACHER FARMS INC has 779.50 Total Acres in 14 Parcel(s)TMS LANDS LLC has 785.58 Total Acres in 8 Parcel(s)WHITEVILLE FARMS LLC has 796.40 Total Acres in 9 Parcel(s)LEE WENDEL & JEAN REVOCABLE TRUST has 799.82 Total Acres in 17 Parcel(s)UNION FARMS LLC has 807.75 Total Acres in 14 Parcel(s)CITY OF MT PLEASANT has 879.96 Total Acres in 20 Parcel(s)OPLINGER EARL ETUX has 905.66 Total Acres in 16 Parcel(s)GRAHAM FARMS has 919.35 Total Acres in 12 Parcel(s)GROSS RAYMOND L & has 949.11 Total Acres in 19 Parcel(s)WISE FARMS LLC has 977.59 Total Acres in 13 Parcel(s)MIBELLOON INVESTMENTS LLC has 1,006.55 Total Acres in 17 Parcel(s)DEPT OF NATURAL RESOURCES has 1,027.60 Total Acres in 12 Parcel(s)MACDONALD FARMS LLC has 1,076.04 Total Acres in 21 Parcel(s)ANDERSEN FARMS LLC has 1,206.47 Total Acres in 23 Parcel(s)SCHUMACHER DAVID W TRUST has 1,216.26 Total Acres in 22 Parcel(s)RAWSON RAY TRUST & has 1,241.11 Total Acres in 25 Parcel(s)HUBSCHER RESOURCES LLC has 1,253.21 Total Acres in 26 Parcel(s)KLUMPP KIM & VIRGINIA has 1,271.08 Total Acres in 20 Parcel(s)FODOR FARMS LLC has 1,370.07 Total Acres in 24 Parcel(s)GLASS LAKE PROPERTY LLC has 1,718.97 Total Acres in 22 Parcel(s)NORTH VALLEY FARMS LLC has 1,771.74 Total Acres in 28 Parcel(s)STATE OF MICH - DNR - GRANTS has 1,966.67 Total Acres in 25 Parcel(s)SAGINAW CHIPPEWA INDIAN TRIBE has 3,385.87 Total Acres in 140 Parcel(s)***** Top 24 Owners by Acreage *****
MOUNT PLEASANT HOTELS LLC has 4,698,100 S.E.V. Value in 11 Parcel(s)WAL-MART REAL ESTATE BUSINESS has 5,185,500 S.E.V. Value in 2 Parcel(s)MCGUIRK MINI STORAGE INC has 5,242,000 S.E.V. Value in 17 Parcel(s)COMFORT INN (LABELLE MGMT) has 5,356,700 S.E.V. Value in 1 Parcel(s)NORTH VALLEY FARMS LLC has 5,495,400 S.E.V. Value in 28 Parcel(s)AMERICAN MITSUBA CORP has 5,511,100 S.E.V. Value in 1 Parcel(s)OLIVIERI MANAGEMENT INC has 5,573,800 S.E.V. Value in 45 Parcel(s)INDIAN HILLS PLAZA LLC has 5,977,700 S.E.V. Value in 1 Parcel(s)ISABELLA BANK has 6,221,000 S.E.V. Value in 17 Parcel(s)CHIPS HOUSING LLC has 6,596,600 S.E.V. Value in 2 Parcel(s)MENARD INC has 6,868,600 S.E.V. Value in 4 Parcel(s)JAMESTOWN MT PLEASANT APT LLC has 7,288,300 S.E.V. Value in 1 Parcel(s)MT PLEASANT SHOPPING CENT LLC has 7,684,200 S.E.V. Value in 2 Parcel(s)MEIJER INC has 8,483,400 S.E.V. Value in 1 Parcel(s)LEXINGTON RIDGE APTS LLC has 8,597,500 S.E.V. Value in 2 Parcel(s)DEERFIELD VILLAGE LLC has 8,838,700 S.E.V. Value in 2 Parcel(s)TALLGRASS DEVELOPMENT LLC has 9,136,800 S.E.V. Value in 4 Parcel(s)MORBARK LLC has 10,008,800 S.E.V. Value in 13 Parcel(s)WESTPOINT VILLAGE LLC has 10,014,600 S.E.V. Value in 1 Parcel(s)PEP-CMU LLC has 10,332,700 S.E.V. Value in 1 Parcel(s)MT PLEASANT HOSPITALITY LLC has 10,627,700 S.E.V. Value in 1 Parcel(s)HSRE-QUAD V HOLDING 2 LLC has 25,711,800 S.E.V. Value in 6 Parcel(s)DTE has 31,995,032 S.E.V. Value in 39 Parcel(s)CONSUMERS ENERGY CO has 52,495,700 S.E.V. Value in 79 Parcel(s)***** Top 24 Owners by S.E.V. Value *****
43
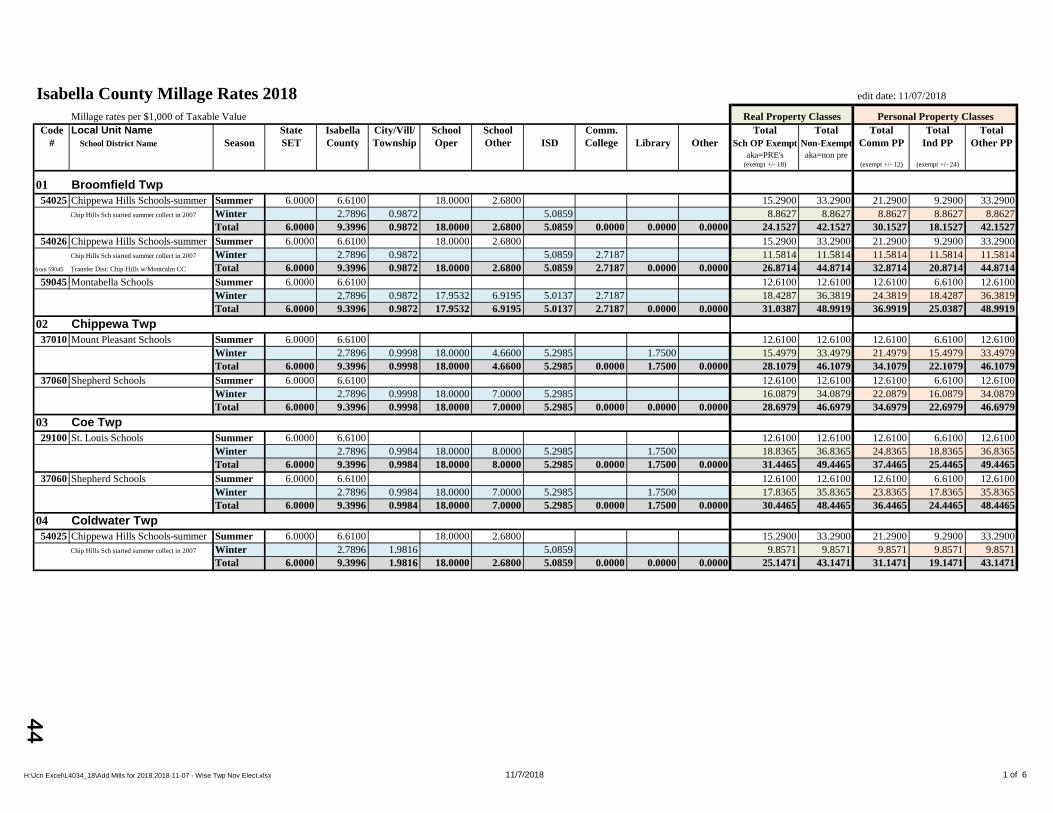
Isabella County Millage Rates 2018 edit date: 11/07/2018
Millage rates per $1,000 of Taxable ValueCode Local Unit Name State Isabella City/Vill/ School School Comm. Total Total Total Total Total
# School District Name Season SET County Township Oper Other ISD College Library Other Sch OP Exempt Non-Exempt Comm PP Ind PP Other PPaka=PRE's aka=non pre
(exempt +/- 18) (exempt +/- 12) (exempt +/- 24)
01 Broomfield Twp54025 Chippewa Hills Schools-summer Summer 6.0000 6.6100 18.0000 2.6800 15.2900 33.2900 21.2900 9.2900 33.2900
Chip Hills Sch started summer collect in 2007 Winter 2.7896 0.9872 5.0859 8.8627 8.8627 8.8627 8.8627 8.8627Total 6.0000 9.3996 0.9872 18.0000 2.6800 5.0859 0.0000 0.0000 0.0000 24.1527 42.1527 30.1527 18.1527 42.1527
54026 Chippewa Hills Schools-summer 2Summer 6.0000 6.6100 18.0000 2.6800 15.2900 33.2900 21.2900 9.2900 33.2900Chip Hills Sch started summer collect in 2007 Winter 2.7896 0.9872 5.0859 2.7187 11.5814 11.5814 11.5814 11.5814 11.5814
from 59045 Transfer Dist: Chip Hills w/Montcalm CC Total 6.0000 9.3996 0.9872 18.0000 2.6800 5.0859 2.7187 0.0000 0.0000 26.8714 44.8714 32.8714 20.8714 44.871459045 Montabella Schools Summer 6.0000 6.6100 12.6100 12.6100 12.6100 6.6100 12.6100
Winter 2.7896 0.9872 17.9532 6.9195 5.0137 2.7187 18.4287 36.3819 24.3819 18.4287 36.3819Total 6.0000 9.3996 0.9872 17.9532 6.9195 5.0137 2.7187 0.0000 0.0000 31.0387 48.9919 36.9919 25.0387 48.9919
02 Chippewa Twp37010 Mount Pleasant Schools Summer 6.0000 6.6100 12.6100 12.6100 12.6100 6.6100 12.6100
Winter 2.7896 0.9998 18.0000 4.6600 5.2985 1.7500 15.4979 33.4979 21.4979 15.4979 33.4979Total 6.0000 9.3996 0.9998 18.0000 4.6600 5.2985 0.0000 1.7500 0.0000 28.1079 46.1079 34.1079 22.1079 46.1079
37060 Shepherd Schools Summer 6.0000 6.6100 12.6100 12.6100 12.6100 6.6100 12.6100Winter 2.7896 0.9998 18.0000 7.0000 5.2985 16.0879 34.0879 22.0879 16.0879 34.0879Total 6.0000 9.3996 0.9998 18.0000 7.0000 5.2985 0.0000 0.0000 0.0000 28.6979 46.6979 34.6979 22.6979 46.6979
03 Coe Twp29100 St. Louis Schools Summer 6.0000 6.6100 12.6100 12.6100 12.6100 6.6100 12.6100
Winter 2.7896 0.9984 18.0000 8.0000 5.2985 1.7500 18.8365 36.8365 24.8365 18.8365 36.8365Total 6.0000 9.3996 0.9984 18.0000 8.0000 5.2985 0.0000 1.7500 0.0000 31.4465 49.4465 37.4465 25.4465 49.4465
37060 Shepherd Schools Summer 6.0000 6.6100 12.6100 12.6100 12.6100 6.6100 12.6100Winter 2.7896 0.9984 18.0000 7.0000 5.2985 1.7500 17.8365 35.8365 23.8365 17.8365 35.8365Total 6.0000 9.3996 0.9984 18.0000 7.0000 5.2985 0.0000 1.7500 0.0000 30.4465 48.4465 36.4465 24.4465 48.4465
04 Coldwater Twp54025 Chippewa Hills Schools-summer Summer 6.0000 6.6100 18.0000 2.6800 15.2900 33.2900 21.2900 9.2900 33.2900
Chip Hills Sch started summer collect in 2007 Winter 2.7896 1.9816 5.0859 9.8571 9.8571 9.8571 9.8571 9.8571Total 6.0000 9.3996 1.9816 18.0000 2.6800 5.0859 0.0000 0.0000 0.0000 25.1471 43.1471 31.1471 19.1471 43.1471
Real Property Classes Personal Property Classes
H:\Jcn Excel\L4034_18\Add Mills for 2018 2018-11-07 - Wise Twp Nov Elect.xlsx 11/7/2018 1 of 6
44

Isabella County Millage Rates 2018 edit date: 11/07/2018
Millage rates per $1,000 of Taxable ValueCode Local Unit Name State Isabella City/Vill/ School School Comm. Total Total Total Total Total
# School District Name Season SET County Township Oper Other ISD College Library Other Sch OP Exempt Non-Exempt Comm PP Ind PP Other PPaka=PRE's aka=non pre
(exempt +/- 18) (exempt +/- 12) (exempt +/- 24)
Real Property Classes Personal Property Classes
05 Deerfield Twp37010 Mount Pleasant Schools Summer 6.0000 6.6100 12.6100 12.6100 12.6100 6.6100 12.6100
Winter 2.7896 2.9731 18.0000 4.6600 5.2985 1.7500 17.4712 35.4712 23.4712 17.4712 35.4712Total 6.0000 9.3996 2.9731 18.0000 4.6600 5.2985 0.0000 1.7500 0.0000 30.0812 48.0812 36.0812 24.0812 48.0812
37013 Mount Pleasant Schools Summer 6.0000 6.6100 12.6100 12.6100 12.6100 6.6100 12.6100from 59045 Transfer Dist: Mt. Pleas Sch w/Montcalm CC Winter 2.7896 2.9731 18.0000 4.6600 5.2985 2.7187 1.7500 20.1899 38.1899 26.1899 20.1899 38.1899
Total 6.0000 9.3996 2.9731 18.0000 4.6600 5.2985 2.7187 1.7500 0.0000 32.7999 50.7999 38.7999 26.7999 50.799937016 Mount Pleasant Schools Summer 6.0000 6.6100 12.6100 12.6100 12.6100 6.6100 12.6100
from 59045 Transfer Dist: Mt. Pleas Sch w/Montcalm CC Winter 2.7896 2.9731 18.0000 4.6600 5.2985 2.7187 1.7500 20.1899 38.1899 26.1899 20.1899 38.1899Total 6.0000 9.3996 2.9731 18.0000 4.6600 5.2985 2.7187 1.7500 0.0000 32.7999 50.7999 38.7999 26.7999 50.7999
37040 Beal City Schools Summer 6.0000 6.6100 12.6100 12.6100 12.6100 6.6100 12.6100Winter 2.7896 2.9731 18.0000 7.0000 5.2985 18.0612 36.0612 24.0612 18.0612 36.0612Total 6.0000 9.3996 2.9731 18.0000 7.0000 5.2985 0.0000 0.0000 0.0000 30.6712 48.6712 36.6712 24.6712 48.6712
37060 Shepherd Schools Summer 6.0000 6.6100 12.6100 12.6100 12.6100 6.6100 12.6100Winter 2.7896 2.9731 18.0000 7.0000 5.2985 18.0612 36.0612 24.0612 18.0612 36.0612Total 6.0000 9.3996 2.9731 18.0000 7.0000 5.2985 0.0000 0.0000 0.0000 30.6712 48.6712 36.6712 24.6712 48.6712
37061 Shepherd Schools Summer 6.0000 6.6100 12.6100 12.6100 12.6100 6.6100 12.6100from 59045 Transfer Dist: Shep Sch w/Montcalm CC Winter 2.7896 2.9731 18.0000 7.0000 5.2985 2.7187 20.7799 38.7799 26.7799 20.7799 38.7799
Total 6.0000 9.3996 2.9731 18.0000 7.0000 5.2985 2.7187 0.0000 0.0000 33.3899 51.3899 39.3899 27.3899 51.389954025 Chippewa Hills Schools-summer Summer 6.0000 6.6100 18.0000 2.6800 15.2900 33.2900 21.2900 9.2900 33.2900
Chip Hills Sch started summer collect in 2007 Winter 2.7896 2.9731 5.0859 10.8486 10.8486 10.8486 10.8486 10.8486Total 6.0000 9.3996 2.9731 18.0000 2.6800 5.0859 0.0000 0.0000 0.0000 26.1386 44.1386 32.1386 20.1386 44.1386
59045 Montabella Schools Summer 6.0000 6.6100 12.6100 12.6100 12.6100 6.6100 12.6100Winter 2.7896 2.9731 17.9532 6.9195 5.0137 2.7187 20.4146 38.3678 26.3678 20.4146 38.3678Total 6.0000 9.3996 2.9731 17.9532 6.9195 5.0137 2.7187 0.0000 0.0000 33.0246 50.9778 38.9778 27.0246 50.9778
06 Denver Twp37010 Mount Pleasant Schools Summer 6.0000 6.6100 12.6100 12.6100 12.6100 6.6100 12.6100
Winter 2.7896 0.9971 18.0000 4.6600 5.2985 1.7500 15.4952 33.4952 21.4952 15.4952 33.4952Total 6.0000 9.3996 0.9971 18.0000 4.6600 5.2985 0.0000 1.7500 0.0000 28.1052 46.1052 34.1052 22.1052 46.1052
37060 Shepherd Schools Summer 6.0000 6.6100 12.6100 12.6100 12.6100 6.6100 12.6100Winter 2.7896 0.9971 18.0000 7.0000 5.2985 16.0852 34.0852 22.0852 16.0852 34.0852Total 6.0000 9.3996 0.9971 18.0000 7.0000 5.2985 0.0000 0.0000 0.0000 28.6952 46.6952 34.6952 22.6952 46.6952
56030 Coleman Schools Summer 6.0000 6.6100 12.6100 12.6100 12.6100 6.6100 12.6100Winter 2.7896 0.9971 18.0000 3.7500 2.6756 10.2123 28.2123 16.2123 10.2123 28.2123Total 6.0000 9.3996 0.9971 18.0000 3.7500 2.6756 0.0000 0.0000 0.0000 22.8223 40.8223 28.8223 16.8223 40.8223
H:\Jcn Excel\L4034_18\Add Mills for 2018 2018-11-07 - Wise Twp Nov Elect.xlsx 11/7/2018 2 of 6
45

Isabella County Millage Rates 2018 edit date: 11/07/2018
Millage rates per $1,000 of Taxable ValueCode Local Unit Name State Isabella City/Vill/ School School Comm. Total Total Total Total Total
# School District Name Season SET County Township Oper Other ISD College Library Other Sch OP Exempt Non-Exempt Comm PP Ind PP Other PPaka=PRE's aka=non pre
(exempt +/- 18) (exempt +/- 12) (exempt +/- 24)
Real Property Classes Personal Property Classes
07 Fremont Twp37010 Mount Pleasant Schools Summer 6.0000 6.6100 12.6100 12.6100 12.6100 6.6100 12.6100
Winter 2.7896 2.2750 18.0000 4.6600 5.2985 1.7500 16.7731 34.7731 22.7731 16.7731 34.7731Total 6.0000 9.3996 2.2750 18.0000 4.6600 5.2985 0.0000 1.7500 0.0000 29.3831 47.3831 35.3831 23.3831 47.3831
37060 Shepherd Schools Summer 6.0000 6.6100 12.6100 12.6100 12.6100 6.6100 12.6100Winter 2.7896 2.2750 18.0000 7.0000 5.2985 1.7500 19.1131 37.1131 25.1131 19.1131 37.1131Total 6.0000 9.3996 2.2750 18.0000 7.0000 5.2985 0.0000 1.7500 0.0000 31.7231 49.7231 37.7231 25.7231 49.7231
37061 Shepherd Schools Summer 6.0000 6.6100 12.6100 12.6100 12.6100 6.6100 12.6100from 59045 Transfer Dist: Shep Sch w/Montcalm CC Winter 2.7896 2.2750 18.0000 7.0000 5.2985 2.7187 1.7500 21.8318 39.8318 27.8318 21.8318 39.8318
Total 6.0000 9.3996 2.2750 18.0000 7.0000 5.2985 2.7187 1.7500 0.0000 34.4418 52.4418 40.4418 28.4418 52.441859045 Montabella Schools Summer 6.0000 6.6100 12.6100 12.6100 12.6100 6.6100 12.6100
Winter 2.7896 2.2750 17.9532 6.9195 5.0137 2.7187 1.7500 21.4665 39.4197 27.4197 21.4665 39.4197Total 6.0000 9.3996 2.2750 17.9532 6.9195 5.0137 2.7187 1.7500 0.0000 34.0765 52.0297 40.0297 28.0765 52.0297
59150 Vestaburg Schools Summer 6.0000 6.6100 12.6100 12.6100 12.6100 6.6100 12.6100Winter 2.7896 2.2750 18.0000 7.0000 5.0137 2.7187 1.7500 21.5470 39.5470 27.5470 21.5470 39.5470Total 6.0000 9.3996 2.2750 18.0000 7.0000 5.0137 2.7187 1.7500 0.0000 34.1570 52.1570 40.1570 28.1570 52.1570
08 Gilmore Twp 18020 Farwell Schools Summer 6.0000 6.6100 12.6100 12.6100 12.6100 6.6100 12.6100
Winter 2.7896 1.9604 18.0000 2.3700 3.0385 1.2232 11.3817 29.3817 17.3817 11.3817 29.3817Total 6.0000 9.3996 1.9604 18.0000 2.3700 3.0385 1.2232 0.0000 0.0000 23.9917 41.9917 29.9917 17.9917 41.9917
37040 Beal City Schools Summer 6.0000 6.6100 12.6100 12.6100 12.6100 6.6100 12.6100Winter 2.7896 1.9604 18.0000 7.0000 5.2985 17.0485 35.0485 23.0485 17.0485 35.0485Total 6.0000 9.3996 1.9604 18.0000 7.0000 5.2985 0.0000 0.0000 0.0000 29.6585 47.6585 35.6585 23.6585 47.6585
54025 Chippewa Hills Schools-summer Summer 6.0000 6.6100 18.0000 2.6800 15.2900 33.2900 21.2900 9.2900 33.2900Chip Hills Sch started summer collect in 2007 Winter 2.7896 1.9604 5.0859 9.8359 9.8359 9.8359 9.8359 9.8359
Total 6.0000 9.3996 1.9604 18.0000 2.6800 5.0859 0.0000 0.0000 0.0000 25.1259 43.1259 31.1259 19.1259 43.125909 Isabella Twp37010 Mount Pleasant Schools Summer 6.0000 6.6100 12.6100 12.6100 12.6100 6.6100 12.6100
Winter 2.7896 0.9999 18.0000 4.6600 5.2985 1.7500 15.4980 33.4980 21.4980 15.4980 33.4980Total 6.0000 9.3996 0.9999 18.0000 4.6600 5.2985 0.0000 1.7500 0.0000 28.1080 46.1080 34.1080 22.1080 46.1080
37040 Beal City Schools Summer 6.0000 6.6100 12.6100 12.6100 12.6100 6.6100 12.6100Winter 2.7896 0.9999 18.0000 7.0000 5.2985 16.0880 34.0880 22.0880 16.0880 34.0880Total 6.0000 9.3996 0.9999 18.0000 7.0000 5.2985 0.0000 0.0000 0.0000 28.6980 46.6980 34.6980 22.6980 46.6980
H:\Jcn Excel\L4034_18\Add Mills for 2018 2018-11-07 - Wise Twp Nov Elect.xlsx 11/7/2018 3 of 6
46

Isabella County Millage Rates 2018 edit date: 11/07/2018
Millage rates per $1,000 of Taxable ValueCode Local Unit Name State Isabella City/Vill/ School School Comm. Total Total Total Total Total
# School District Name Season SET County Township Oper Other ISD College Library Other Sch OP Exempt Non-Exempt Comm PP Ind PP Other PPaka=PRE's aka=non pre
(exempt +/- 18) (exempt +/- 12) (exempt +/- 24)
Real Property Classes Personal Property Classes
10 Lincoln Twp29010 Alma Schools Summer 6.0000 6.6100 12.6100 12.6100 12.6100 6.6100 12.6100
Winter 2.7896 1.0000 17.9370 7.0000 5.2985 16.0881 34.0251 22.0251 16.0881 34.0251Total 6.0000 9.3996 1.0000 17.9370 7.0000 5.2985 0.0000 0.0000 0.0000 28.6981 46.6351 34.6351 22.6981 46.6351
37010 Mount Pleasant Schools Summer 6.0000 6.6100 12.6100 12.6100 12.6100 6.6100 12.6100Winter 2.7896 1.0000 18.0000 4.6600 5.2985 1.7500 15.4981 33.4981 21.4981 15.4981 33.4981Total 6.0000 9.3996 1.0000 18.0000 4.6600 5.2985 0.0000 1.7500 0.0000 28.1081 46.1081 34.1081 22.1081 46.1081
37060 Shepherd Schools Summer 6.0000 6.6100 12.6100 12.6100 12.6100 6.6100 12.6100Winter 2.7896 1.0000 18.0000 7.0000 5.2985 16.0881 34.0881 22.0881 16.0881 34.0881Total 6.0000 9.3996 1.0000 18.0000 7.0000 5.2985 0.0000 0.0000 0.0000 28.6981 46.6981 34.6981 22.6981 46.6981
59150 Vestaburg Schools Summer 6.0000 6.6100 12.6100 12.6100 12.6100 6.6100 12.6100Winter 2.7896 1.0000 18.0000 7.0000 5.0137 2.7187 18.5220 36.5220 24.5220 18.5220 36.5220Total 6.0000 9.3996 1.0000 18.0000 7.0000 5.0137 2.7187 0.0000 0.0000 31.1320 49.1320 37.1320 25.1320 49.1320
11 Nottawa Twp18020 Farwell Schools Summer 6.0000 6.6100 12.6100 12.6100 12.6100 6.6100 12.6100
Winter 2.7896 1.0000 18.0000 2.3700 3.0385 1.2232 10.4213 28.4213 16.4213 10.4213 28.4213Total 6.0000 9.3996 1.0000 18.0000 2.3700 3.0385 1.2232 0.0000 0.0000 23.0313 41.0313 29.0313 17.0313 41.0313
37010 Mount Pleasant Schools Summer 6.0000 6.6100 12.6100 12.6100 12.6100 6.6100 12.6100Winter 2.7896 1.0000 18.0000 4.6600 5.2985 1.7500 15.4981 33.4981 21.4981 15.4981 33.4981Total 6.0000 9.3996 1.0000 18.0000 4.6600 5.2985 0.0000 1.7500 0.0000 28.1081 46.1081 34.1081 22.1081 46.1081
37040 Beal City Schools Summer 6.0000 6.6100 12.6100 12.6100 12.6100 6.6100 12.6100Winter 2.7896 1.0000 18.0000 7.0000 5.2985 16.0881 34.0881 22.0881 16.0881 34.0881Total 6.0000 9.3996 1.0000 18.0000 7.0000 5.2985 0.0000 0.0000 0.0000 28.6981 46.6981 34.6981 22.6981 46.6981
37043 Beal City Schools Summer 6.0000 6.6100 12.6100 12.6100 12.6100 6.6100 12.6100from 18020 Transfer Dist: Beal City Sch w/Mid Mich CC Winter 2.7896 1.0000 18.0000 7.0000 5.2985 1.2232 17.3113 35.3113 23.3113 17.3113 35.3113
Total 6.0000 9.3996 1.0000 18.0000 7.0000 5.2985 1.2232 0.0000 0.0000 29.9213 47.9213 35.9213 23.9213 47.921354025 Chippewa Hills Schools-summer Summer 6.0000 6.6100 18.0000 2.6800 15.2900 33.2900 21.2900 9.2900 33.2900
Chip Hills Sch started summer collect in 2007 Winter 2.7896 1.0000 5.0859 8.8755 8.8755 8.8755 8.8755 8.8755Total 6.0000 9.3996 1.0000 18.0000 2.6800 5.0859 0.0000 0.0000 0.0000 24.1655 42.1655 30.1655 18.1655 42.1655
12 Rolland Twp59045 Montabella Schools Summer 6.0000 6.6100 12.6100 12.6100 12.6100 6.6100 12.6100
Winter 2.7896 5.4970 17.9532 6.9195 5.0137 2.7187 1.7500 24.6885 42.6417 30.6417 24.6885 42.6417Total 6.0000 9.3996 5.4970 17.9532 6.9195 5.0137 2.7187 1.7500 0.0000 37.2985 55.2517 43.2517 31.2985 55.2517
H:\Jcn Excel\L4034_18\Add Mills for 2018 2018-11-07 - Wise Twp Nov Elect.xlsx 11/7/2018 4 of 6
47

Isabella County Millage Rates 2018 edit date: 11/07/2018
Millage rates per $1,000 of Taxable ValueCode Local Unit Name State Isabella City/Vill/ School School Comm. Total Total Total Total Total
# School District Name Season SET County Township Oper Other ISD College Library Other Sch OP Exempt Non-Exempt Comm PP Ind PP Other PPaka=PRE's aka=non pre
(exempt +/- 18) (exempt +/- 12) (exempt +/- 24)
Real Property Classes Personal Property Classes
13 Sherman Twp54025 Chippewa Hills Schools-summer Summer 6.0000 6.6100 18.0000 2.6800 15.2900 33.2900 21.2900 9.2900 33.2900
Chip Hills Sch started summer collect in 2007 Winter 2.7896 2.7364 5.0859 10.6119 10.6119 10.6119 10.6119 10.6119Total 6.0000 9.3996 2.7364 18.0000 2.6800 5.0859 0.0000 0.0000 0.0000 25.9019 43.9019 31.9019 19.9019 43.9019
14 Union Twp37010 Mount Pleasant Schools Summer 6.0000 6.6100 12.6100 12.6100 12.6100 6.6100 12.6100
Winter 2.7896 3.0000 18.0000 4.6600 5.2985 1.7500 17.4981 35.4981 23.4981 17.4981 35.4981Total 6.0000 9.3996 3.0000 18.0000 4.6600 5.2985 0.0000 1.7500 0.0000 30.1081 48.1081 36.1081 24.1081 48.1081
37040 Beal City Schools Summer 6.0000 6.6100 12.6100 12.6100 12.6100 6.6100 12.6100Winter 2.7896 3.0000 18.0000 7.0000 5.2985 1.7500 19.8381 37.8381 25.8381 19.8381 37.8381Total 6.0000 9.3996 3.0000 18.0000 7.0000 5.2985 0.0000 1.7500 0.0000 32.4481 50.4481 38.4481 26.4481 50.4481
15 Vernon Twp18010 Clare Schools Summer 6.0000 6.6100 12.6100 12.6100 12.6100 6.6100 12.6100
Winter 2.7896 2.9954 18.0000 2.9000 3.0385 1.2232 0.9931 13.9398 31.9398 19.9398 13.9398 31.9398Total 6.0000 9.3996 2.9954 18.0000 2.9000 3.0385 1.2232 0.9931 0.0000 26.5498 44.5498 32.5498 20.5498 44.5498
18020 Farwell Schools Summer 6.0000 6.6100 12.6100 12.6100 12.6100 6.6100 12.6100Winter 2.7896 2.9954 18.0000 2.3700 3.0385 1.2232 0.9931 13.4098 31.4098 19.4098 13.4098 31.4098Total 6.0000 9.3996 2.9954 18.0000 2.3700 3.0385 1.2232 0.9931 0.0000 26.0198 44.0198 32.0198 20.0198 44.0198
37010 Mount Pleasant Schools Summer 6.0000 6.6100 12.6100 12.6100 12.6100 6.6100 12.6100Winter 2.7896 2.9954 18.0000 4.6600 5.2985 1.7500 17.4935 35.4935 23.4935 17.4935 35.4935Total 6.0000 9.3996 2.9954 18.0000 4.6600 5.2985 0.0000 1.7500 0.0000 30.1035 48.1035 36.1035 24.1035 48.1035
37015 Mount Pleasant Schools Summer 6.0000 6.6100 12.6100 12.6100 12.6100 6.6100 12.6100from 18010 Transfer Dist: Mt. Pleas Sch w/Mid Mich CC Winter 2.7896 2.9954 18.0000 4.6600 5.2985 1.2232 1.7500 18.7167 36.7167 24.7167 18.7167 36.7167
Total 6.0000 9.3996 2.9954 18.0000 4.6600 5.2985 1.2232 1.7500 0.0000 31.3267 49.3267 37.3267 25.3267 49.326737040 Beal City Schools Summer 6.0000 6.6100 12.6100 12.6100 12.6100 6.6100 12.6100
Winter 2.7896 2.9954 18.0000 7.0000 5.2985 0.9931 19.0766 37.0766 25.0766 19.0766 37.0766Total 6.0000 9.3996 2.9954 18.0000 7.0000 5.2985 0.0000 0.9931 0.0000 31.6866 49.6866 37.6866 25.6866 49.6866
16 Wise Twp18010 Clare Schools Summer 6.0000 6.6100 12.6100 12.6100 12.6100 6.6100 12.6100
Winter 2.7896 5.0904 18.0000 2.9000 3.0385 1.2232 0.9931 16.0348 34.0348 22.0348 16.0348 34.0348Total 6.0000 9.3996 5.0904 18.0000 2.9000 3.0385 1.2232 0.9931 0.0000 28.6448 46.6448 34.6448 22.6448 46.6448
37010 Mount Pleasant Schools Summer 6.0000 6.6100 12.6100 12.6100 12.6100 6.6100 12.6100Winter 2.7896 5.0904 18.0000 4.6600 5.2985 1.7500 19.5885 37.5885 25.5885 19.5885 37.5885Total 6.0000 9.3996 5.0904 18.0000 4.6600 5.2985 0.0000 1.7500 0.0000 32.1985 50.1985 38.1985 26.1985 50.1985
56030 Coleman Schools Summer 6.0000 6.6100 12.6100 12.6100 12.6100 6.6100 12.6100Winter 2.7896 5.0904 18.0000 3.7500 2.6756 0.9931 15.2987 33.2987 21.2987 15.2987 33.2987Total 6.0000 9.3996 5.0904 18.0000 3.7500 2.6756 0.0000 0.9931 0.0000 27.9087 45.9087 33.9087 21.9087 45.9087
H:\Jcn Excel\L4034_18\Add Mills for 2018 2018-11-07 - Wise Twp Nov Elect.xlsx 11/7/2018 5 of 6
48
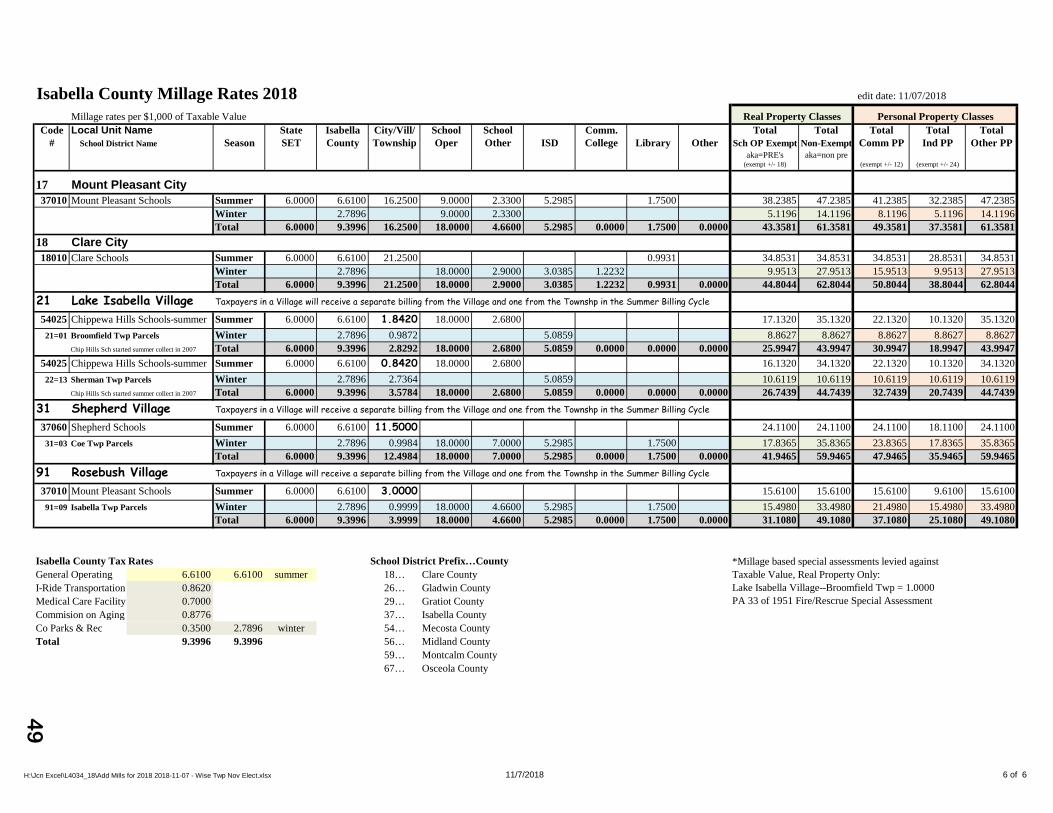
Isabella County Millage Rates 2018 edit date: 11/07/2018
Millage rates per $1,000 of Taxable ValueCode Local Unit Name State Isabella City/Vill/ School School Comm. Total Total Total Total Total
# School District Name Season SET County Township Oper Other ISD College Library Other Sch OP Exempt Non-Exempt Comm PP Ind PP Other PPaka=PRE's aka=non pre
(exempt +/- 18) (exempt +/- 12) (exempt +/- 24)
Real Property Classes Personal Property Classes
17 Mount Pleasant City37010 Mount Pleasant Schools Summer 6.0000 6.6100 16.2500 9.0000 2.3300 5.2985 1.7500 38.2385 47.2385 41.2385 32.2385 47.2385
Winter 2.7896 9.0000 2.3300 5.1196 14.1196 8.1196 5.1196 14.1196Total 6.0000 9.3996 16.2500 18.0000 4.6600 5.2985 0.0000 1.7500 0.0000 43.3581 61.3581 49.3581 37.3581 61.3581
18 Clare City18010 Clare Schools Summer 6.0000 6.6100 21.2500 0.9931 34.8531 34.8531 34.8531 28.8531 34.8531
Winter 2.7896 18.0000 2.9000 3.0385 1.2232 9.9513 27.9513 15.9513 9.9513 27.9513Total 6.0000 9.3996 21.2500 18.0000 2.9000 3.0385 1.2232 0.9931 0.0000 44.8044 62.8044 50.8044 38.8044 62.8044
21 Lake Isabella Village Taxpayers in a Village will receive a separate billing from the Village and one from the Townshp in the Summer Billing Cycle
54025 Chippewa Hills Schools-summer Summer 6.0000 6.6100 1.8420 18.0000 2.6800 17.1320 35.1320 22.1320 10.1320 35.132021=01 Broomfield Twp Parcels Winter 2.7896 0.9872 5.0859 8.8627 8.8627 8.8627 8.8627 8.8627
Chip Hills Sch started summer collect in 2007 Total 6.0000 9.3996 2.8292 18.0000 2.6800 5.0859 0.0000 0.0000 0.0000 25.9947 43.9947 30.9947 18.9947 43.994754025 Chippewa Hills Schools-summer Summer 6.0000 6.6100 0.8420 18.0000 2.6800 16.1320 34.1320 22.1320 10.1320 34.1320
22=13 Sherman Twp Parcels Winter 2.7896 2.7364 5.0859 10.6119 10.6119 10.6119 10.6119 10.6119Chip Hills Sch started summer collect in 2007 Total 6.0000 9.3996 3.5784 18.0000 2.6800 5.0859 0.0000 0.0000 0.0000 26.7439 44.7439 32.7439 20.7439 44.7439
31 Shepherd Village Taxpayers in a Village will receive a separate billing from the Village and one from the Townshp in the Summer Billing Cycle
37060 Shepherd Schools Summer 6.0000 6.6100 11.5000 24.1100 24.1100 24.1100 18.1100 24.110031=03 Coe Twp Parcels Winter 2.7896 0.9984 18.0000 7.0000 5.2985 1.7500 17.8365 35.8365 23.8365 17.8365 35.8365
Total 6.0000 9.3996 12.4984 18.0000 7.0000 5.2985 0.0000 1.7500 0.0000 41.9465 59.9465 47.9465 35.9465 59.946591 Rosebush Village Taxpayers in a Village will receive a separate billing from the Village and one from the Townshp in the Summer Billing Cycle
37010 Mount Pleasant Schools Summer 6.0000 6.6100 3.0000 15.6100 15.6100 15.6100 9.6100 15.610091=09 Isabella Twp Parcels Winter 2.7896 0.9999 18.0000 4.6600 5.2985 1.7500 15.4980 33.4980 21.4980 15.4980 33.4980
Total 6.0000 9.3996 3.9999 18.0000 4.6600 5.2985 0.0000 1.7500 0.0000 31.1080 49.1080 37.1080 25.1080 49.1080
Isabella County Tax Rates School District Prefix…CountyGeneral Operating 6.6100 6.6100 summer 18… Clare CountyI-Ride Transportation 0.8620 26… Gladwin CountyMedical Care Facility 0.7000 29… Gratiot CountyCommision on Aging 0.8776 37… Isabella CountyCo Parks & Rec 0.3500 2.7896 winter 54… Mecosta CountyTotal 9.3996 9.3996 56… Midland County
59… Montcalm County67… Osceola County
*Millage based special assessments levied against Taxable Value, Real Property Only:Lake Isabella Village--Broomfield Twp = 1.0000PA 33 of 1951 Fire/Rescrue Special Assessment
H:\Jcn Excel\L4034_18\Add Mills for 2018 2018-11-07 - Wise Twp Nov Elect.xlsx 11/7/2018 6 of 6
49

H:\Jcn Excel\Equal_19\EQ REPORT SCHOOL DISTRICT Pages 2019-08-01.docx
ISABELLA COUNTY SCHOOL DISTRICTS – September 21, 2012
18010 Clare Op. & Debt /Mid Mich College Op. & Debt/Clare-Glad. ISD Op. & Debt
18020 Farwell Op. & Debt/Mid Mich College Op. & Debt/Clare-Glad. ISD Op. & Debt 18021 = 18020 Farwell Op. & Debt/Mid Mich College Op. & Debt/
/Clare-Glad ISD Op. & Debt (From Beal) – No Parcel Records in 2011 data
29010 Alma Op. & Debt /No College/Grat-Isab. ISD Op. & Debt
29100 St Louis Op. & Debt /No College/Grat-Isab. ISD Op. & Debt
37010 Mt Pleasant Op. & Debt/No College/Grat-Isab ISD Op. & Debt 37012 Chip Hills To Mt Pleasant – No Parcel Records in 2011 data
37013 Mt. Pleasant Op. & Debt/Montabella 78 Debt (paid 2007)/Montcalm Com College Op. & Debt/ (2007 - 37013 & 37016 are now the same rate) /Grat-Isab ISD Op. & Debt/ (from Montabella)
37014 = 37010 Mt. Pleasant Op. & Debt/No College/Grat-Isab ISD Op. & Debt/ (from Beal) – No Parcel Records in 2011 data
37015 Mt. Pleasant Op. & Debt/Mid Mich College Op. & Debt/Grat-Isab ISD Op. & Debt/ (from Clare) 37016 Mt. Pleasant Op. & Debt/Montcalm Com College Op. & Debt
/Grat-Isab ISD Op. & Debt/ (from Montabella)
37017 Mt. Pleasant Op. & Debt/Farwell 85 Debt (paid 2005)/Mid Mich College Op. & Debt/ (2006 - 37015 & 37017 are now the same rate) /Grat-Isab ISD Op. & Debt/ (from Farwell) – No Parcel Records in 2011 data
37040 Beal City Op. & Debt /No College/Grat-Isab ISD Op. & Debt 37041 Chip Hills To Beal City – No Parcel Records in 2011 data
37043 Beal City Op. & Debt/ Farwell 85 Debt (paid 2005)/Mid Mich College Op. & Debt/ /Grat-Isab ISD/ (from Farwell)
37060 Shepherd Op. & Debt/No College/ Grat-Isab ISD Op. & Debt 37061 Shepherd Op. & Debt/Montcalm Com College Op. & Debt/
/Grat-Isab ISD Op. & Debt/ (from Montabella) 37062 Vestaburg to Shepherd – No Parcel Records in 2011 data
54025 Chippewa Hills Op. & Debt/No College/Mec-Osc ISD Op. & Debt 54026 Chippewa Hills Op. & Debt/Montcalm Com College Op. & Debt/
/Mec-Osc ISD Op. & Debt/ (from Montabella) 54028 = 54025 (From Beal City) Chippewa Hills Op. & Debt/No College/ Mec-Osc ISD Op. & Debt –No Parcels Records in 2011 data
56030 Coleman Op. & Debt/No College/Midland ISD Op. & Debt
59045 Montabella Op. & Debt/Montcalm Com College Op. & Debt/Montcalm ISD Op. & Debt
59150 Vestaburg Op. & Debt/Montcalm Com College Op. & Debt/Montcalm ISD Op. & Debt
Chippewa River District Library Op. & Debt is applied to Mt. Pleasant School Districts, City of Mt. Pleasant, and All of Union Township. Added Coe Twp, Fremont Twp and Rolland Twp 11-2010 .
Pere Marquette District Library Op. & Debt is applied to City of Clare, Vernon Twp and Wise Twp properties that are not Mt. Pleasant School Operating.
50

H:\Jcn Excel\Equal_19\EQ REPORT SCHOOL DISTRICT Pages 2019-08-01.docx
School District Name Counties in District Intermediate District Isabella Units in District
18010 Clare Schools 18 Clare County (HC) Clare-Gladwin RESD 15, 16, 18 37 Isabella County
18020 Farwell Schools 18 Clare County (HC) Clare-Gladwin RESD 08, 11, 15 37 Isabella County
29010 Alma Schools 29 Gratiot County (HC) Gratiot-Isabella RESD 10 37 Isabella County
59 Montcalm County
29100 St Louis Schools 29 Gratiot County (HC) Gratiot-Isabella RESD 03 37 Isabella County
56 Midland County
37010 Mt Pleasant Schools 37 Isabella County (HC) Gratiot-Isabella RESD 02, 05, 06, 07, 09, 10, 11,14, 15, 16, 17
37040 Beal Schools 37 Isabella County (HC) Gratiot-Isabella RESD 05, 08, 09, 11, 14, 15
37060 Shepherd Schools 29 Gratiot County Gratiot-Isabella RESD 02, 03, 05, 06, 07, 10 37 Isabella County (HC)
56 Midland County
54025 Chippewa Hills Schools 37 Isabella County Mecosta-Osceola Co ISD 01, 04, 05, 08, 11, 13 54 Mecosta County (HC)
67 Osceola County
56030 Coleman Schools 37 Isabella County Midland County ESA 06, 16 56 Midland County (HC)
59045 Montabella Schools 37 Isabella County Montcalm County ISD 01, 05, 07, 12 54 Mecosta County
59 Montcalm County (HC)
59150 Vestaburg Schools 29 Gratiot County Montcalm County ISD 07, 10 37 Isabella County
59 Montcalm County (HC)
Mid Michigan Comm College 18 Clare County (HC) Twp: 08, 11, 15, 16, 18 26 Gladwin County Sch Dist #’s: 18010, 18020, 18021 37 Isabella County
37015, 37043
Montcalm Comm College 29 Gratiot County Twp: 01, 05, 07, 10, 12 37 Isabella County Sch Dist #’s: 37013, 37016, 37061 54 Mecosta County
54026, 59045, 59150 59 Montcalm County (HC)
HC = Home County
51

H:\Jcn Excel\Equal_19\EQ REPORT SCHOOL DISTRICT Pages 2019-08-01.docx
School District Valuations – 2019
52
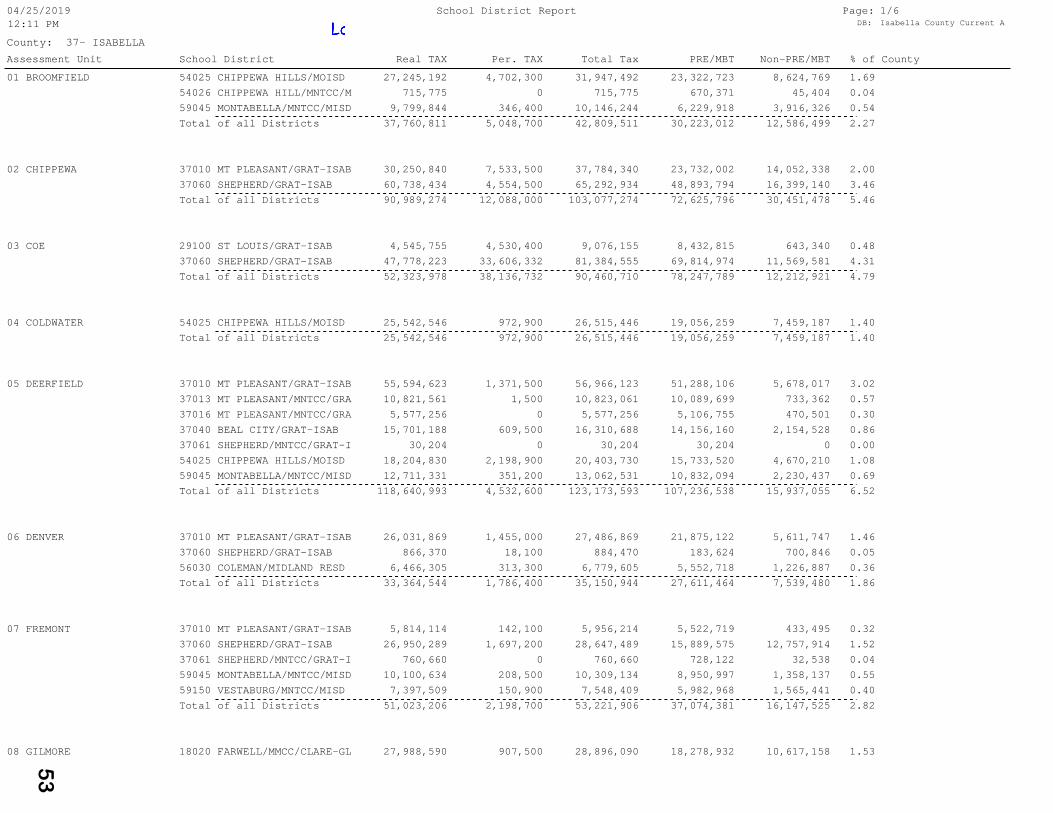
County: 37- ISABELLA
School District Report Page: DB: Isabella County Current A
04/25/201912:11 PM
1/6
Assessment Unit School District Real TAX Per. TAX Total Tax PRE/MBT Non-PRE/MBT % of County
08 GILMORE 18020 FARWELL/MMCC/CLARE-GL 27,988,590 907,500 28,896,090 18,278,932 10,617,158 1.53
Total of all Districts 51,023,206 2,198,700 53,221,906 37,074,381 16,147,525 2.8259150 VESTABURG/MNTCC/MISD 7,397,509 150,900 7,548,409 5,982,968 1,565,441 0.4059045 MONTABELLA/MNTCC/MISD 10,100,634 208,500 10,309,134 8,950,997 1,358,137 0.5537061 SHEPHERD/MNTCC/GRAT-I 760,660 0 760,660 728,122 32,538 0.0437060 SHEPHERD/GRAT-ISAB 26,950,289 1,697,200 28,647,489 15,889,575 12,757,914 1.52
07 FREMONT 37010 MT PLEASANT/GRAT-ISAB 5,814,114 142,100 5,956,214 5,522,719 433,495 0.32
Total of all Districts 33,364,544 1,786,400 35,150,944 27,611,464 7,539,480 1.8656030 COLEMAN/MIDLAND RESD 6,466,305 313,300 6,779,605 5,552,718 1,226,887 0.3637060 SHEPHERD/GRAT-ISAB 866,370 18,100 884,470 183,624 700,846 0.05
06 DENVER 37010 MT PLEASANT/GRAT-ISAB 26,031,869 1,455,000 27,486,869 21,875,122 5,611,747 1.46
Total of all Districts 118,640,993 4,532,600 123,173,593 107,236,538 15,937,055 6.5259045 MONTABELLA/MNTCC/MISD 12,711,331 351,200 13,062,531 10,832,094 2,230,437 0.6954025 CHIPPEWA HILLS/MOISD 18,204,830 2,198,900 20,403,730 15,733,520 4,670,210 1.0837061 SHEPHERD/MNTCC/GRAT-I 30,204 0 30,204 30,204 0 0.0037040 BEAL CITY/GRAT-ISAB 15,701,188 609,500 16,310,688 14,156,160 2,154,528 0.8637016 MT PLEASANT/MNTCC/GRA 5,577,256 0 5,577,256 5,106,755 470,501 0.3037013 MT PLEASANT/MNTCC/GRA 10,821,561 1,500 10,823,061 10,089,699 733,362 0.57
05 DEERFIELD 37010 MT PLEASANT/GRAT-ISAB 55,594,623 1,371,500 56,966,123 51,288,106 5,678,017 3.02
Total of all Districts 25,542,546 972,900 26,515,446 19,056,259 7,459,187 1.4004 COLDWATER 54025 CHIPPEWA HILLS/MOISD 25,542,546 972,900 26,515,446 19,056,259 7,459,187 1.40
Total of all Districts 52,323,978 38,136,732 90,460,710 78,247,789 12,212,921 4.7937060 SHEPHERD/GRAT-ISAB 47,778,223 33,606,332 81,384,555 69,814,974 11,569,581 4.31
03 COE 29100 ST LOUIS/GRAT-ISAB 4,545,755 4,530,400 9,076,155 8,432,815 643,340 0.48
Total of all Districts 90,989,274 12,088,000 103,077,274 72,625,796 30,451,478 5.4637060 SHEPHERD/GRAT-ISAB 60,738,434 4,554,500 65,292,934 48,893,794 16,399,140 3.46
02 CHIPPEWA 37010 MT PLEASANT/GRAT-ISAB 30,250,840 7,533,500 37,784,340 23,732,002 14,052,338 2.00
Total of all Districts 37,760,811 5,048,700 42,809,511 30,223,012 12,586,499 2.2759045 MONTABELLA/MNTCC/MISD 9,799,844 346,400 10,146,244 6,229,918 3,916,326 0.5454026 CHIPPEWA HILL/MNTCC/M 715,775 0 715,775 670,371 45,404 0.04
01 BROOMFIELD 54025 CHIPPEWA HILLS/MOISD 27,245,192 4,702,300 31,947,492 23,322,723 8,624,769 1.69
53

County: 37- ISABELLA
School District Report Page: DB: Isabella County Current A
04/25/201912:11 PM
2/6
Assessment Unit School District Real TAX Per. TAX Total Tax PRE/MBT Non-PRE/MBT % of County
Total of all Districts 42,549,276 7,268,600 49,817,876 38,213,913 11,603,963 2.6437040 BEAL CITY/GRAT-ISAB 153,060 0 153,060 123,978 29,082 0.0137015 MT PLEASANT/MMCC/GRAT 118,378 0 118,378 118,378 0 0.0137010 MT PLEASANT/GRAT-ISAB 6,560,774 899,400 7,460,174 6,296,887 1,163,287 0.4018020 FARWELL/MMCC/CLARE-GL 3,265,053 439,100 3,704,153 2,971,314 732,839 0.20
15 VERNON 18010 CLARE/MMCC/CLARE-GLAD 32,452,011 5,930,100 38,382,111 28,703,356 9,678,755 2.03
Total of all Districts 345,398,828 32,838,600 378,237,428 155,749,040 222,488,388 20.0437040 BEAL CITY/GRAT-ISAB 2,150,072 74,400 2,224,472 2,008,432 216,040 0.12
14 UNION 37010 MT PLEASANT/GRAT-ISAB 343,248,756 32,764,200 376,012,956 153,740,608 222,272,348 19.92
Total of all Districts 49,487,819 3,680,100 53,167,919 34,554,357 18,613,562 2.8213 SHERMAN 54025 CHIPPEWA HILLS/MOISD 49,487,819 3,680,100 53,167,919 34,554,357 18,613,562 2.82
Total of all Districts 37,312,549 1,758,100 39,070,649 32,246,166 6,824,483 2.0712 ROLLAND 59045 MONTABELLA/MNTCC/MISD 37,312,549 1,758,100 39,070,649 32,246,166 6,824,483 2.07
Total of all Districts 70,647,012 3,160,000 73,807,012 58,530,762 15,276,250 3.9154025 CHIPPEWA HILLS/MOISD 10,412,339 596,200 11,008,539 7,350,537 3,658,002 0.5837043 BEAL CITY/MMCC/GRAT-I 287,872 0 287,872 287,872 0 0.0237040 BEAL CITY/GRAT-ISAB 58,694,271 2,529,600 61,223,871 49,639,823 11,584,048 3.2437010 MT PLEASANT/GRAT-ISAB 999,523 21,600 1,021,123 999,523 21,600 0.05
11 NOTTAWA 18020 FARWELL/MMCC/CLARE-GL 253,007 12,600 265,607 253,007 12,600 0.01
Total of all Districts 61,296,929 1,862,350 63,159,279 56,299,716 6,859,563 3.3559150 VESTABURG/MNTCC/MISD 88,576 0 88,576 88,576 0 0.0037060 SHEPHERD/GRAT-ISAB 49,177,347 1,402,650 50,579,997 45,403,101 5,176,896 2.6837010 MT PLEASANT/GRAT-ISAB 11,987,506 459,700 12,447,206 10,764,539 1,682,667 0.66
10 LINCOLN 29010 ALMA/GRAT-ISAB 43,500 0 43,500 43,500 0 0.00
Total of all Districts 54,308,483 10,832,579 65,141,062 49,617,588 15,523,474 3.4537040 BEAL CITY/GRAT-ISAB 12,853,358 628,200 13,481,558 11,903,850 1,577,708 0.71
09 ISABELLA 37010 MT PLEASANT/GRAT-ISAB 41,455,125 10,204,379 51,659,504 37,713,738 13,945,766 2.74
Total of all Districts 48,497,228 1,515,800 50,013,028 29,967,389 20,045,639 2.6554025 CHIPPEWA HILLS/MOISD 19,769,268 591,200 20,360,468 10,958,231 9,402,237 1.0837040 BEAL CITY/GRAT-ISAB 739,370 17,100 756,470 730,226 26,244 0.04
54
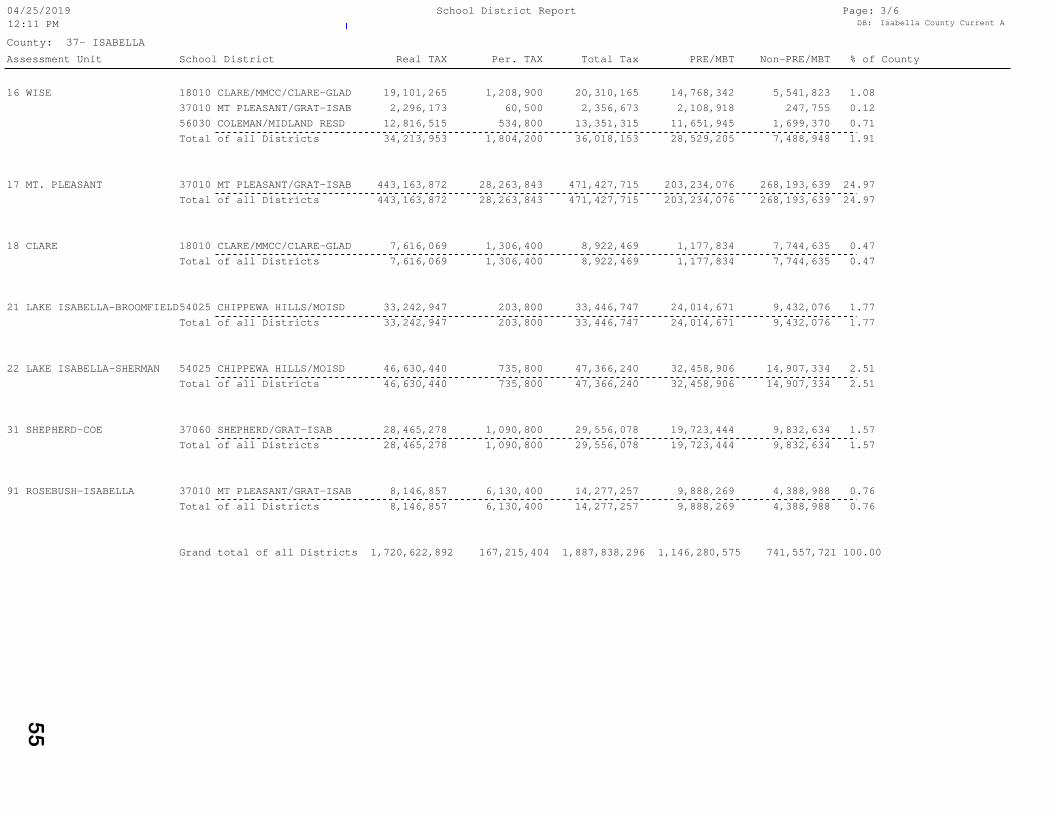
County: 37- ISABELLA
School District Report Page: DB: Isabella County Current A
04/25/201912:11 PM
3/6
Assessment Unit School District Real TAX Per. TAX Total Tax PRE/MBT Non-PRE/MBT % of County
Grand total of all Districts 1,720,622,892 167,215,404 1,887,838,296 1,146,280,575 741,557,721 100.00
Total of all Districts 8,146,857 6,130,400 14,277,257 9,888,269 4,388,988 0.7691 ROSEBUSH-ISABELLA 37010 MT PLEASANT/GRAT-ISAB 8,146,857 6,130,400 14,277,257 9,888,269 4,388,988 0.76
Total of all Districts 28,465,278 1,090,800 29,556,078 19,723,444 9,832,634 1.5731 SHEPHERD-COE 37060 SHEPHERD/GRAT-ISAB 28,465,278 1,090,800 29,556,078 19,723,444 9,832,634 1.57
Total of all Districts 46,630,440 735,800 47,366,240 32,458,906 14,907,334 2.5122 LAKE ISABELLA-SHERMAN 54025 CHIPPEWA HILLS/MOISD 46,630,440 735,800 47,366,240 32,458,906 14,907,334 2.51
Total of all Districts 33,242,947 203,800 33,446,747 24,014,671 9,432,076 1.7721 LAKE ISABELLA-BROOMFIELD54025 CHIPPEWA HILLS/MOISD 33,242,947 203,800 33,446,747 24,014,671 9,432,076 1.77
Total of all Districts 7,616,069 1,306,400 8,922,469 1,177,834 7,744,635 0.4718 CLARE 18010 CLARE/MMCC/CLARE-GLAD 7,616,069 1,306,400 8,922,469 1,177,834 7,744,635 0.47
Total of all Districts 443,163,872 28,263,843 471,427,715 203,234,076 268,193,639 24.9717 MT. PLEASANT 37010 MT PLEASANT/GRAT-ISAB 443,163,872 28,263,843 471,427,715 203,234,076 268,193,639 24.97
Total of all Districts 34,213,953 1,804,200 36,018,153 28,529,205 7,488,948 1.9156030 COLEMAN/MIDLAND RESD 12,816,515 534,800 13,351,315 11,651,945 1,699,370 0.7137010 MT PLEASANT/GRAT-ISAB 2,296,173 60,500 2,356,673 2,108,918 247,755 0.12
16 WISE 18010 CLARE/MMCC/CLARE-GLAD 19,101,265 1,208,900 20,310,165 14,768,342 5,541,823 1.08
55

County: 37- ISABELLA
School District Report Page: DB: Isabella County Current A
04/25/201912:11 PM
4/6
School District Assessment Unit Real TAX Per. TAX Total Tax PRE/MBT Non-PRE/MBT % of County
Total of all Units 5,577,256 0 5,577,256 5,106,755 470,501 0.3037016 MT PLEASANT/MNTCC/GRAT-IS05 DEERFIELD 5,577,256 0 5,577,256 5,106,755 470,501 0.30
Total of all Units 118,378 0 118,378 118,378 0 0.0137015 MT PLEASANT/MMCC/GRAT-ISA15 VERNON 118,378 0 118,378 118,378 0 0.01
Total of all Units 10,821,561 1,500 10,823,061 10,089,699 733,362 0.5737013 MT PLEASANT/MNTCC/GRAT-IS05 DEERFIELD 10,821,561 1,500 10,823,061 10,089,699 733,362 0.57
Total of all Units 975,550,032 89,306,122 1,064,856,154 527,164,507 537,691,647 56.4191 ROSEBUSH-ISABELLA 8,146,857 6,130,400 14,277,257 9,888,269 4,388,988 0.7617 MT. PLEASANT 443,163,872 28,263,843 471,427,715 203,234,076 268,193,639 24.9716 WISE 2,296,173 60,500 2,356,673 2,108,918 247,755 0.1215 VERNON 6,560,774 899,400 7,460,174 6,296,887 1,163,287 0.4014 UNION 343,248,756 32,764,200 376,012,956 153,740,608 222,272,348 19.9211 NOTTAWA 999,523 21,600 1,021,123 999,523 21,600 0.0510 LINCOLN 11,987,506 459,700 12,447,206 10,764,539 1,682,667 0.6609 ISABELLA 41,455,125 10,204,379 51,659,504 37,713,738 13,945,766 2.7407 FREMONT 5,814,114 142,100 5,956,214 5,522,719 433,495 0.3206 DENVER 26,031,869 1,455,000 27,486,869 21,875,122 5,611,747 1.4605 DEERFIELD 55,594,623 1,371,500 56,966,123 51,288,106 5,678,017 3.02
37010 MT PLEASANT/GRAT-ISAB02 CHIPPEWA 30,250,840 7,533,500 37,784,340 23,732,002 14,052,338 2.00
Total of all Units 4,545,755 4,530,400 9,076,155 8,432,815 643,340 0.4829100 ST LOUIS/GRAT-ISAB 03 COE 4,545,755 4,530,400 9,076,155 8,432,815 643,340 0.48
Total of all Units 43,500 0 43,500 43,500 0 0.0029010 ALMA/GRAT-ISAB 10 LINCOLN 43,500 0 43,500 43,500 0 0.00
Total of all Units 31,506,650 1,359,200 32,865,850 21,503,253 11,362,597 1.7415 VERNON 3,265,053 439,100 3,704,153 2,971,314 732,839 0.2011 NOTTAWA 253,007 12,600 265,607 253,007 12,600 0.01
18020 FARWELL/MMCC/CLARE-GLAD08 GILMORE 27,988,590 907,500 28,896,090 18,278,932 10,617,158 1.53
Total of all Units 59,169,345 8,445,400 67,614,745 44,649,532 22,965,213 3.5818 CLARE 7,616,069 1,306,400 8,922,469 1,177,834 7,744,635 0.4716 WISE 19,101,265 1,208,900 20,310,165 14,768,342 5,541,823 1.08
18010 CLARE/MMCC/CLARE-GLAD15 VERNON 32,452,011 5,930,100 38,382,111 28,703,356 9,678,755 2.03
56

County: 37- ISABELLA
School District Report Page: DB: Isabella County Current A
04/25/201912:11 PM
5/6
School District Assessment Unit Real TAX Per. TAX Total Tax PRE/MBT Non-PRE/MBT % of County
56030 COLEMAN/MIDLAND RESD 06 DENVER 6,466,305 313,300 6,779,605 5,552,718 1,226,887 0.36
Total of all Units 715,775 0 715,775 670,371 45,404 0.0454026 CHIPPEWA HILL/MNTCC/MOISD01 BROOMFIELD 715,775 0 715,775 670,371 45,404 0.04
Total of all Units 230,535,381 13,681,200 244,216,581 167,449,204 76,767,377 12.9422 LAKE ISABELLA-SHERMAN 46,630,440 735,800 47,366,240 32,458,906 14,907,334 2.5121 LAKE ISABELLA-BROOMFIELD 33,242,947 203,800 33,446,747 24,014,671 9,432,076 1.7713 SHERMAN 49,487,819 3,680,100 53,167,919 34,554,357 18,613,562 2.8211 NOTTAWA 10,412,339 596,200 11,008,539 7,350,537 3,658,002 0.5808 GILMORE 19,769,268 591,200 20,360,468 10,958,231 9,402,237 1.0805 DEERFIELD 18,204,830 2,198,900 20,403,730 15,733,520 4,670,210 1.0804 COLDWATER 25,542,546 972,900 26,515,446 19,056,259 7,459,187 1.40
54025 CHIPPEWA HILLS/MOISD 01 BROOMFIELD 27,245,192 4,702,300 31,947,492 23,322,723 8,624,769 1.69
Total of all Units 790,864 0 790,864 758,326 32,538 0.0407 FREMONT 760,660 0 760,660 728,122 32,538 0.04
37061 SHEPHERD/MNTCC/GRAT-ISAB05 DEERFIELD 30,204 0 30,204 30,204 0 0.00
Total of all Units 213,975,941 42,369,582 256,345,523 199,908,512 56,437,011 13.5831 SHEPHERD-COE 28,465,278 1,090,800 29,556,078 19,723,444 9,832,634 1.5710 LINCOLN 49,177,347 1,402,650 50,579,997 45,403,101 5,176,896 2.6807 FREMONT 26,950,289 1,697,200 28,647,489 15,889,575 12,757,914 1.5206 DENVER 866,370 18,100 884,470 183,624 700,846 0.0503 COE 47,778,223 33,606,332 81,384,555 69,814,974 11,569,581 4.31
37060 SHEPHERD/GRAT-ISAB 02 CHIPPEWA 60,738,434 4,554,500 65,292,934 48,893,794 16,399,140 3.46
Total of all Units 287,872 0 287,872 287,872 0 0.0237043 BEAL CITY/MMCC/GRAT-ISAB11 NOTTAWA 287,872 0 287,872 287,872 0 0.02
Total of all Units 90,291,319 3,858,800 94,150,119 78,562,469 15,587,650 4.9915 VERNON 153,060 0 153,060 123,978 29,082 0.0114 UNION 2,150,072 74,400 2,224,472 2,008,432 216,040 0.1211 NOTTAWA 58,694,271 2,529,600 61,223,871 49,639,823 11,584,048 3.2409 ISABELLA 12,853,358 628,200 13,481,558 11,903,850 1,577,708 0.7108 GILMORE 739,370 17,100 756,470 730,226 26,244 0.04
37040 BEAL CITY/GRAT-ISAB 05 DEERFIELD 15,701,188 609,500 16,310,688 14,156,160 2,154,528 0.86
57

County: 37- ISABELLA
School District Report Page: DB: Isabella County Current A
04/25/201912:11 PM
6/6
School District Assessment Unit Real TAX Per. TAX Total Tax PRE/MBT Non-PRE/MBT % of County
Grand total of all Units 1,720,622,892 167,215,404 1,887,838,296 1,146,280,575 741,557,721 100.00
Total of all Units 7,486,085 150,900 7,636,985 6,071,544 1,565,441 0.4010 LINCOLN 88,576 0 88,576 88,576 0 0.00
59150 VESTABURG/MNTCC/MISD 07 FREMONT 7,397,509 150,900 7,548,409 5,982,968 1,565,441 0.40
Total of all Units 69,924,358 2,664,200 72,588,558 58,259,175 14,329,383 3.8512 ROLLAND 37,312,549 1,758,100 39,070,649 32,246,166 6,824,483 2.0707 FREMONT 10,100,634 208,500 10,309,134 8,950,997 1,358,137 0.5505 DEERFIELD 12,711,331 351,200 13,062,531 10,832,094 2,230,437 0.69
59045 MONTABELLA/MNTCC/MISD01 BROOMFIELD 9,799,844 346,400 10,146,244 6,229,918 3,916,326 0.54
Total of all Units 19,282,820 848,100 20,130,920 17,204,663 2,926,257 1.0716 WISE 12,816,515 534,800 13,351,315 11,651,945 1,699,370 0.71
58

School(s): CLARE/MMCC/CLARE-GLAD, FARWELL/MMCC/CLARE-GLADCounty: 37- ISABELLA
School District Report Page: DB: Isabella County Current A
04/25/201901:04 PM
1/2
Assessment Unit School District Real TAX Per. TAX Total Tax PRE/MBT Non-PRE/MBT % of County
Grand total of all Districts 90,675,995 9,804,600 100,480,595 66,152,785 34,327,810 100.00
Total of all Districts 7,616,069 1,306,400 8,922,469 1,177,834 7,744,635 8.8818 CLARE 18010 CLARE/MMCC/CLARE-GLAD 7,616,069 1,306,400 8,922,469 1,177,834 7,744,635 8.88
Total of all Districts 19,101,265 1,208,900 20,310,165 14,768,342 5,541,823 20.2116 WISE 18010 CLARE/MMCC/CLARE-GLAD 19,101,265 1,208,900 20,310,165 14,768,342 5,541,823 20.21
Total of all Districts 35,717,064 6,369,200 42,086,264 31,674,670 10,411,594 41.8818020 FARWELL/MMCC/CLARE-GL 3,265,053 439,100 3,704,153 2,971,314 732,839 3.69
15 VERNON 18010 CLARE/MMCC/CLARE-GLAD 32,452,011 5,930,100 38,382,111 28,703,356 9,678,755 38.20
Total of all Districts 253,007 12,600 265,607 253,007 12,600 0.2611 NOTTAWA 18020 FARWELL/MMCC/CLARE-GL 253,007 12,600 265,607 253,007 12,600 0.26
Total of all Districts 27,988,590 907,500 28,896,090 18,278,932 10,617,158 28.7608 GILMORE 18020 FARWELL/MMCC/CLARE-GL 27,988,590 907,500 28,896,090 18,278,932 10,617,158 28.76
59

School(s): CLARE/MMCC/CLARE-GLAD, FARWELL/MMCC/CLARE-GLADCounty: 37- ISABELLA
School District Report Page: DB: Isabella County Current A
04/25/201901:04 PM
2/2
School District Assessment Unit Real TAX Per. TAX Total Tax PRE/MBT Non-PRE/MBT % of County
Grand total of all Units 90,675,995 9,804,600 100,480,595 66,152,785 34,327,810 100.00
Total of all Units 31,506,650 1,359,200 32,865,850 21,503,253 11,362,597 32.7115 VERNON 3,265,053 439,100 3,704,153 2,971,314 732,839 3.6911 NOTTAWA 253,007 12,600 265,607 253,007 12,600 0.26
18020 FARWELL/MMCC/CLARE-GLAD08 GILMORE 27,988,590 907,500 28,896,090 18,278,932 10,617,158 28.76
Total of all Units 59,169,345 8,445,400 67,614,745 44,649,532 22,965,213 67.2918 CLARE 7,616,069 1,306,400 8,922,469 1,177,834 7,744,635 8.8816 WISE 19,101,265 1,208,900 20,310,165 14,768,342 5,541,823 20.21
18010 CLARE/MMCC/CLARE-GLAD15 VERNON 32,452,011 5,930,100 38,382,111 28,703,356 9,678,755 38.20
60

School(s): ALMA/GRAT-ISAB, ST LOUIS/GRAT-ISAB, MT PLEASANT/GRAT-ISAB, MT PLEASANT/MNTCC/GRAT-IS, MT PLEASANT/MMCC/GCounty: 37- ISABELLA
School District Report Page: DB: Isabella County 2019
05/09/201912:57 PM
1/4
Assessment Unit School District Real TAX Per. TAX Total Tax PRE/MBT Non-PRE/MBT % of County
Total of all Districts 61,208,353 1,862,350 63,070,703 56,211,140 6,859,563 4.3737060 SHEPHERD/GRAT-ISAB 49,177,347 1,402,650 50,579,997 45,403,101 5,176,896 3.5137010 MT PLEASANT/GRAT-ISAB 11,987,506 459,700 12,447,206 10,764,539 1,682,667 0.86
10 LINCOLN 29010 ALMA/GRAT-ISAB 43,500 0 43,500 43,500 0 0.00
Total of all Districts 54,308,483 10,832,579 65,141,062 49,617,588 15,523,474 4.5237040 BEAL CITY/GRAT-ISAB 12,853,358 628,200 13,481,558 11,903,850 1,577,708 0.93
09 ISABELLA 37010 MT PLEASANT/GRAT-ISAB 41,455,125 10,204,379 51,659,504 37,713,738 13,945,766 3.58
Total of all Districts 739,370 17,100 756,470 730,226 26,244 0.0508 GILMORE 37040 BEAL CITY/GRAT-ISAB 739,370 17,100 756,470 730,226 26,244 0.05
Total of all Districts 33,525,063 1,839,300 35,364,363 22,140,416 13,223,947 2.4537061 SHEPHERD/MNTCC/GRAT-I 760,660 0 760,660 728,122 32,538 0.0537060 SHEPHERD/GRAT-ISAB 26,950,289 1,697,200 28,647,489 15,889,575 12,757,914 1.99
07 FREMONT 37010 MT PLEASANT/GRAT-ISAB 5,814,114 142,100 5,956,214 5,522,719 433,495 0.41
Total of all Districts 26,898,239 1,473,100 28,371,339 22,058,746 6,312,593 1.9737060 SHEPHERD/GRAT-ISAB 866,370 18,100 884,470 183,624 700,846 0.06
06 DENVER 37010 MT PLEASANT/GRAT-ISAB 26,031,869 1,455,000 27,486,869 21,875,122 5,611,747 1.91
Total of all Districts 87,724,832 1,982,500 89,707,332 80,670,924 9,036,408 6.2237061 SHEPHERD/MNTCC/GRAT-I 30,204 0 30,204 30,204 0 0.0037040 BEAL CITY/GRAT-ISAB 15,701,188 609,500 16,310,688 14,156,160 2,154,528 1.1337016 MT PLEASANT/MNTCC/GRA 5,577,256 0 5,577,256 5,106,755 470,501 0.3937013 MT PLEASANT/MNTCC/GRA 10,821,561 1,500 10,823,061 10,089,699 733,362 0.75
05 DEERFIELD 37010 MT PLEASANT/GRAT-ISAB 55,594,623 1,371,500 56,966,123 51,288,106 5,678,017 3.95
Total of all Districts 52,323,978 38,136,732 90,460,710 78,247,789 12,212,921 6.2737060 SHEPHERD/GRAT-ISAB 47,778,223 33,606,332 81,384,555 69,814,974 11,569,581 5.64
03 COE 29100 ST LOUIS/GRAT-ISAB 4,545,755 4,530,400 9,076,155 8,432,815 643,340 0.63
Total of all Districts 90,989,274 12,088,000 103,077,274 72,625,796 30,451,478 7.1537060 SHEPHERD/GRAT-ISAB 60,738,434 4,554,500 65,292,934 48,893,794 16,399,140 4.53
02 CHIPPEWA 37010 MT PLEASANT/GRAT-ISAB 30,250,840 7,533,500 37,784,340 23,732,002 14,052,338 2.62
61

School(s): ALMA/GRAT-ISAB, ST LOUIS/GRAT-ISAB, MT PLEASANT/GRAT-ISAB, MT PLEASANT/MNTCC/GRAT-IS, MT PLEASANT/MMCC/GCounty: 37- ISABELLA
School District Report Page: DB: Isabella County 2019
05/09/201912:57 PM
2/4
Assessment Unit School District Real TAX Per. TAX Total Tax PRE/MBT Non-PRE/MBT % of County
Grand total of all Districts 1,302,002,478 140,066,404 1,442,068,882 830,472,833 611,596,049 100.00
Total of all Districts 8,146,857 6,130,400 14,277,257 9,888,269 4,388,988 0.9991 ROSEBUSH-ISABELLA 37010 MT PLEASANT/GRAT-ISAB 8,146,857 6,130,400 14,277,257 9,888,269 4,388,988 0.99
Total of all Districts 28,465,278 1,090,800 29,556,078 19,723,444 9,832,634 2.0531 SHEPHERD-COE 37060 SHEPHERD/GRAT-ISAB 28,465,278 1,090,800 29,556,078 19,723,444 9,832,634 2.05
Total of all Districts 443,163,872 28,263,843 471,427,715 203,234,076 268,193,639 32.6917 MT. PLEASANT 37010 MT PLEASANT/GRAT-ISAB 443,163,872 28,263,843 471,427,715 203,234,076 268,193,639 32.69
Total of all Districts 2,296,173 60,500 2,356,673 2,108,918 247,755 0.1616 WISE 37010 MT PLEASANT/GRAT-ISAB 2,296,173 60,500 2,356,673 2,108,918 247,755 0.16
Total of all Districts 6,832,212 899,400 7,731,612 6,539,243 1,192,369 0.5437040 BEAL CITY/GRAT-ISAB 153,060 0 153,060 123,978 29,082 0.0137015 MT PLEASANT/MMCC/GRAT 118,378 0 118,378 118,378 0 0.01
15 VERNON 37010 MT PLEASANT/GRAT-ISAB 6,560,774 899,400 7,460,174 6,296,887 1,163,287 0.52
Total of all Districts 345,398,828 32,838,600 378,237,428 155,749,040 222,488,388 26.2337040 BEAL CITY/GRAT-ISAB 2,150,072 74,400 2,224,472 2,008,432 216,040 0.15
14 UNION 37010 MT PLEASANT/GRAT-ISAB 343,248,756 32,764,200 376,012,956 153,740,608 222,272,348 26.07
Total of all Districts 59,981,666 2,551,200 62,532,866 50,927,218 11,605,648 4.3437043 BEAL CITY/MMCC/GRAT-I 287,872 0 287,872 287,872 0 0.0237040 BEAL CITY/GRAT-ISAB 58,694,271 2,529,600 61,223,871 49,639,823 11,584,048 4.25
11 NOTTAWA 37010 MT PLEASANT/GRAT-ISAB 999,523 21,600 1,021,123 999,523 21,600 0.07
62

School(s): ALMA/GRAT-ISAB, ST LOUIS/GRAT-ISAB, MT PLEASANT/GRAT-ISAB, MT PLEASANT/MNTCC/GRAT-IS, MT PLEASANT/MMCC/GCounty: 37- ISABELLA
School District Report Page: DB: Isabella County 2019
05/09/201912:57 PM
3/4
School District Assessment Unit Real TAX Per. TAX Total Tax PRE/MBT Non-PRE/MBT % of County
Total of all Units 90,291,319 3,858,800 94,150,119 78,562,469 15,587,650 6.5315 VERNON 153,060 0 153,060 123,978 29,082 0.0114 UNION 2,150,072 74,400 2,224,472 2,008,432 216,040 0.1511 NOTTAWA 58,694,271 2,529,600 61,223,871 49,639,823 11,584,048 4.2509 ISABELLA 12,853,358 628,200 13,481,558 11,903,850 1,577,708 0.9308 GILMORE 739,370 17,100 756,470 730,226 26,244 0.05
37040 BEAL CITY/GRAT-ISAB 05 DEERFIELD 15,701,188 609,500 16,310,688 14,156,160 2,154,528 1.13
Total of all Units 5,577,256 0 5,577,256 5,106,755 470,501 0.3937016 MT PLEASANT/MNTCC/GRAT-IS05 DEERFIELD 5,577,256 0 5,577,256 5,106,755 470,501 0.39
Total of all Units 118,378 0 118,378 118,378 0 0.0137015 MT PLEASANT/MMCC/GRAT-ISA15 VERNON 118,378 0 118,378 118,378 0 0.01
Total of all Units 10,821,561 1,500 10,823,061 10,089,699 733,362 0.7537013 MT PLEASANT/MNTCC/GRAT-IS05 DEERFIELD 10,821,561 1,500 10,823,061 10,089,699 733,362 0.75
Total of all Units 975,550,032 89,306,122 1,064,856,154 527,164,507 537,691,647 73.8491 ROSEBUSH-ISABELLA 8,146,857 6,130,400 14,277,257 9,888,269 4,388,988 0.9917 MT. PLEASANT 443,163,872 28,263,843 471,427,715 203,234,076 268,193,639 32.6916 WISE 2,296,173 60,500 2,356,673 2,108,918 247,755 0.1615 VERNON 6,560,774 899,400 7,460,174 6,296,887 1,163,287 0.5214 UNION 343,248,756 32,764,200 376,012,956 153,740,608 222,272,348 26.0711 NOTTAWA 999,523 21,600 1,021,123 999,523 21,600 0.0710 LINCOLN 11,987,506 459,700 12,447,206 10,764,539 1,682,667 0.8609 ISABELLA 41,455,125 10,204,379 51,659,504 37,713,738 13,945,766 3.5807 FREMONT 5,814,114 142,100 5,956,214 5,522,719 433,495 0.4106 DENVER 26,031,869 1,455,000 27,486,869 21,875,122 5,611,747 1.9105 DEERFIELD 55,594,623 1,371,500 56,966,123 51,288,106 5,678,017 3.95
37010 MT PLEASANT/GRAT-ISAB02 CHIPPEWA 30,250,840 7,533,500 37,784,340 23,732,002 14,052,338 2.62
Total of all Units 4,545,755 4,530,400 9,076,155 8,432,815 643,340 0.6329100 ST LOUIS/GRAT-ISAB 03 COE 4,545,755 4,530,400 9,076,155 8,432,815 643,340 0.63
Total of all Units 43,500 0 43,500 43,500 0 0.0029010 ALMA/GRAT-ISAB 10 LINCOLN 43,500 0 43,500 43,500 0 0.00
63

School(s): ALMA/GRAT-ISAB, ST LOUIS/GRAT-ISAB, MT PLEASANT/GRAT-ISAB, MT PLEASANT/MNTCC/GRAT-IS, MT PLEASANT/MMCC/GCounty: 37- ISABELLA
School District Report Page: DB: Isabella County 2019
05/09/201912:57 PM
4/4
School District Assessment Unit Real TAX Per. TAX Total Tax PRE/MBT Non-PRE/MBT % of County
Grand total of all Units 1,302,002,478 140,066,404 1,442,068,882 830,472,833 611,596,049 100.00
Total of all Units 790,864 0 790,864 758,326 32,538 0.0507 FREMONT 760,660 0 760,660 728,122 32,538 0.05
37061 SHEPHERD/MNTCC/GRAT-ISAB05 DEERFIELD 30,204 0 30,204 30,204 0 0.00
Total of all Units 213,975,941 42,369,582 256,345,523 199,908,512 56,437,011 17.7831 SHEPHERD-COE 28,465,278 1,090,800 29,556,078 19,723,444 9,832,634 2.0510 LINCOLN 49,177,347 1,402,650 50,579,997 45,403,101 5,176,896 3.5107 FREMONT 26,950,289 1,697,200 28,647,489 15,889,575 12,757,914 1.9906 DENVER 866,370 18,100 884,470 183,624 700,846 0.0603 COE 47,778,223 33,606,332 81,384,555 69,814,974 11,569,581 5.64
37060 SHEPHERD/GRAT-ISAB 02 CHIPPEWA 60,738,434 4,554,500 65,292,934 48,893,794 16,399,140 4.53
Total of all Units 287,872 0 287,872 287,872 0 0.0237043 BEAL CITY/MMCC/GRAT-ISAB11 NOTTAWA 287,872 0 287,872 287,872 0 0.02
64
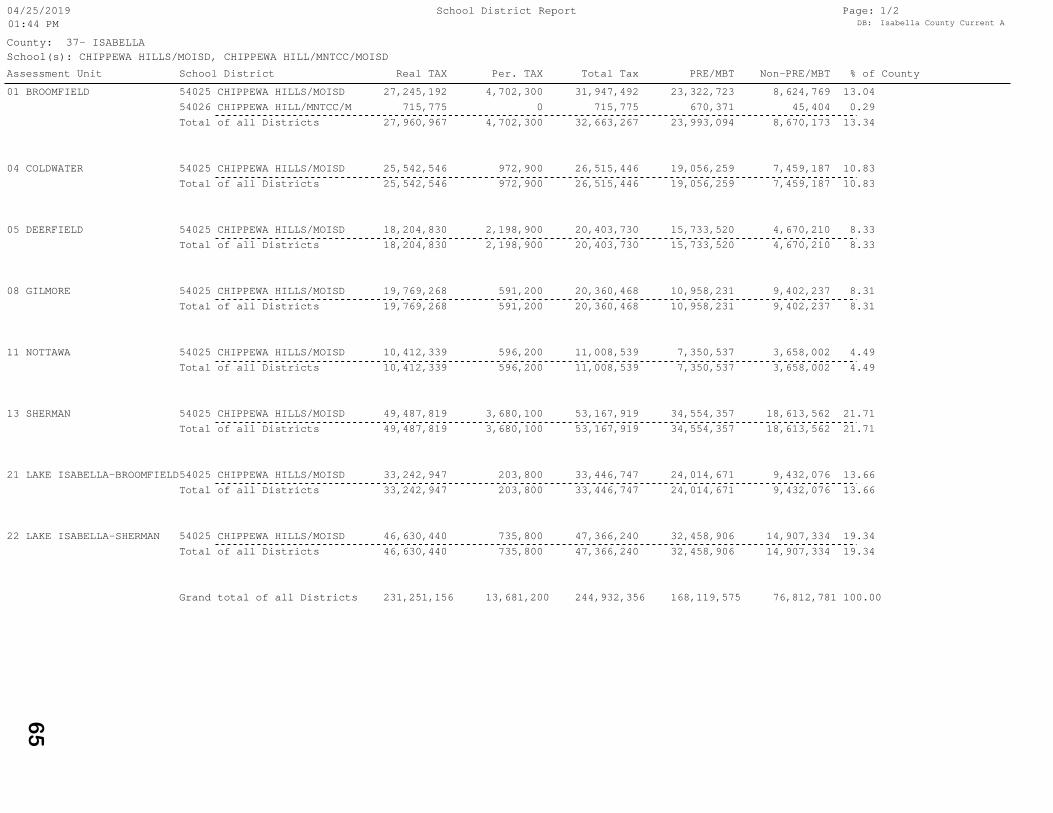
School(s): CHIPPEWA HILLS/MOISD, CHIPPEWA HILL/MNTCC/MOISDCounty: 37- ISABELLA
School District Report Page: DB: Isabella County Current A
04/25/201901:44 PM
1/2
Assessment Unit School District Real TAX Per. TAX Total Tax PRE/MBT Non-PRE/MBT % of County
Grand total of all Districts 231,251,156 13,681,200 244,932,356 168,119,575 76,812,781 100.00
Total of all Districts 46,630,440 735,800 47,366,240 32,458,906 14,907,334 19.3422 LAKE ISABELLA-SHERMAN 54025 CHIPPEWA HILLS/MOISD 46,630,440 735,800 47,366,240 32,458,906 14,907,334 19.34
Total of all Districts 33,242,947 203,800 33,446,747 24,014,671 9,432,076 13.6621 LAKE ISABELLA-BROOMFIELD54025 CHIPPEWA HILLS/MOISD 33,242,947 203,800 33,446,747 24,014,671 9,432,076 13.66
Total of all Districts 49,487,819 3,680,100 53,167,919 34,554,357 18,613,562 21.7113 SHERMAN 54025 CHIPPEWA HILLS/MOISD 49,487,819 3,680,100 53,167,919 34,554,357 18,613,562 21.71
Total of all Districts 10,412,339 596,200 11,008,539 7,350,537 3,658,002 4.4911 NOTTAWA 54025 CHIPPEWA HILLS/MOISD 10,412,339 596,200 11,008,539 7,350,537 3,658,002 4.49
Total of all Districts 19,769,268 591,200 20,360,468 10,958,231 9,402,237 8.3108 GILMORE 54025 CHIPPEWA HILLS/MOISD 19,769,268 591,200 20,360,468 10,958,231 9,402,237 8.31
Total of all Districts 18,204,830 2,198,900 20,403,730 15,733,520 4,670,210 8.3305 DEERFIELD 54025 CHIPPEWA HILLS/MOISD 18,204,830 2,198,900 20,403,730 15,733,520 4,670,210 8.33
Total of all Districts 25,542,546 972,900 26,515,446 19,056,259 7,459,187 10.8304 COLDWATER 54025 CHIPPEWA HILLS/MOISD 25,542,546 972,900 26,515,446 19,056,259 7,459,187 10.83
Total of all Districts 27,960,967 4,702,300 32,663,267 23,993,094 8,670,173 13.3454026 CHIPPEWA HILL/MNTCC/M 715,775 0 715,775 670,371 45,404 0.29
01 BROOMFIELD 54025 CHIPPEWA HILLS/MOISD 27,245,192 4,702,300 31,947,492 23,322,723 8,624,769 13.04
65

School(s): CHIPPEWA HILLS/MOISD, CHIPPEWA HILL/MNTCC/MOISDCounty: 37- ISABELLA
School District Report Page: DB: Isabella County Current A
04/25/201901:44 PM
2/2
School District Assessment Unit Real TAX Per. TAX Total Tax PRE/MBT Non-PRE/MBT % of County
Grand total of all Units 231,251,156 13,681,200 244,932,356 168,119,575 76,812,781 100.00
Total of all Units 715,775 0 715,775 670,371 45,404 0.2954026 CHIPPEWA HILL/MNTCC/MOISD01 BROOMFIELD 715,775 0 715,775 670,371 45,404 0.29
Total of all Units 230,535,381 13,681,200 244,216,581 167,449,204 76,767,377 99.7122 LAKE ISABELLA-SHERMAN 46,630,440 735,800 47,366,240 32,458,906 14,907,334 19.3421 LAKE ISABELLA-BROOMFIELD 33,242,947 203,800 33,446,747 24,014,671 9,432,076 13.6613 SHERMAN 49,487,819 3,680,100 53,167,919 34,554,357 18,613,562 21.7111 NOTTAWA 10,412,339 596,200 11,008,539 7,350,537 3,658,002 4.4908 GILMORE 19,769,268 591,200 20,360,468 10,958,231 9,402,237 8.3105 DEERFIELD 18,204,830 2,198,900 20,403,730 15,733,520 4,670,210 8.3304 COLDWATER 25,542,546 972,900 26,515,446 19,056,259 7,459,187 10.83
54025 CHIPPEWA HILLS/MOISD 01 BROOMFIELD 27,245,192 4,702,300 31,947,492 23,322,723 8,624,769 13.04
66

School(s): COLEMAN/MIDLAND RESDCounty: 37- ISABELLA
School District Report Page: DB: Isabella County Current A
04/25/201901:49 PM
1/2
Assessment Unit School District Real TAX Per. TAX Total Tax PRE/MBT Non-PRE/MBT % of County
Grand total of all Districts 19,282,820 848,100 20,130,920 17,204,663 2,926,257 100.00
Total of all Districts 12,816,515 534,800 13,351,315 11,651,945 1,699,370 66.3216 WISE 56030 COLEMAN/MIDLAND RESD 12,816,515 534,800 13,351,315 11,651,945 1,699,370 66.32
Total of all Districts 6,466,305 313,300 6,779,605 5,552,718 1,226,887 33.6806 DENVER 56030 COLEMAN/MIDLAND RESD 6,466,305 313,300 6,779,605 5,552,718 1,226,887 33.68
67

School(s): COLEMAN/MIDLAND RESDCounty: 37- ISABELLA
School District Report Page: DB: Isabella County Current A
04/25/201901:49 PM
2/2
School District Assessment Unit Real TAX Per. TAX Total Tax PRE/MBT Non-PRE/MBT % of County
Grand total of all Units 19,282,820 848,100 20,130,920 17,204,663 2,926,257 100.00
Total of all Units 19,282,820 848,100 20,130,920 17,204,663 2,926,257 100.0016 WISE 12,816,515 534,800 13,351,315 11,651,945 1,699,370 66.32
56030 COLEMAN/MIDLAND RESD 06 DENVER 6,466,305 313,300 6,779,605 5,552,718 1,226,887 33.68
68

School(s): MONTABELLA/MNTCC/MISD, VESTABURG/MNTCC/MISDCounty: 37- ISABELLA
School District Report Page: DB: Isabella County Current A
04/25/201901:54 PM
1/2
Assessment Unit School District Real TAX Per. TAX Total Tax PRE/MBT Non-PRE/MBT % of County
Grand total of all Districts 77,410,443 2,815,100 80,225,543 64,330,719 15,894,824 100.00
Total of all Districts 37,312,549 1,758,100 39,070,649 32,246,166 6,824,483 48.7012 ROLLAND 59045 MONTABELLA/MNTCC/MISD 37,312,549 1,758,100 39,070,649 32,246,166 6,824,483 48.70
Total of all Districts 88,576 0 88,576 88,576 0 0.1110 LINCOLN 59150 VESTABURG/MNTCC/MISD 88,576 0 88,576 88,576 0 0.11
Total of all Districts 17,498,143 359,400 17,857,543 14,933,965 2,923,578 22.2659150 VESTABURG/MNTCC/MISD 7,397,509 150,900 7,548,409 5,982,968 1,565,441 9.41
07 FREMONT 59045 MONTABELLA/MNTCC/MISD 10,100,634 208,500 10,309,134 8,950,997 1,358,137 12.85
Total of all Districts 12,711,331 351,200 13,062,531 10,832,094 2,230,437 16.2805 DEERFIELD 59045 MONTABELLA/MNTCC/MISD 12,711,331 351,200 13,062,531 10,832,094 2,230,437 16.28
Total of all Districts 9,799,844 346,400 10,146,244 6,229,918 3,916,326 12.6501 BROOMFIELD 59045 MONTABELLA/MNTCC/MISD 9,799,844 346,400 10,146,244 6,229,918 3,916,326 12.65
69
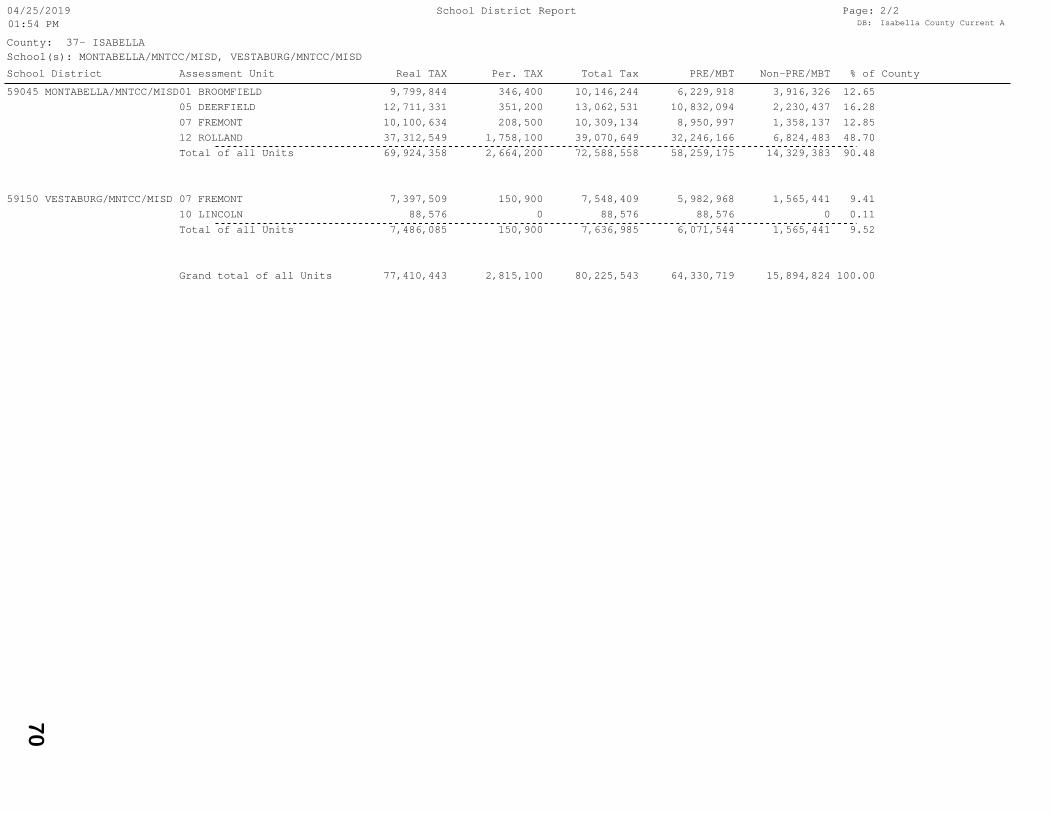
School(s): MONTABELLA/MNTCC/MISD, VESTABURG/MNTCC/MISDCounty: 37- ISABELLA
School District Report Page: DB: Isabella County Current A
04/25/201901:54 PM
2/2
School District Assessment Unit Real TAX Per. TAX Total Tax PRE/MBT Non-PRE/MBT % of County
Grand total of all Units 77,410,443 2,815,100 80,225,543 64,330,719 15,894,824 100.00
Total of all Units 7,486,085 150,900 7,636,985 6,071,544 1,565,441 9.5210 LINCOLN 88,576 0 88,576 88,576 0 0.11
59150 VESTABURG/MNTCC/MISD 07 FREMONT 7,397,509 150,900 7,548,409 5,982,968 1,565,441 9.41
Total of all Units 69,924,358 2,664,200 72,588,558 58,259,175 14,329,383 90.4812 ROLLAND 37,312,549 1,758,100 39,070,649 32,246,166 6,824,483 48.7007 FREMONT 10,100,634 208,500 10,309,134 8,950,997 1,358,137 12.8505 DEERFIELD 12,711,331 351,200 13,062,531 10,832,094 2,230,437 16.28
59045 MONTABELLA/MNTCC/MISD01 BROOMFIELD 9,799,844 346,400 10,146,244 6,229,918 3,916,326 12.65
70

School(s): CLARE/MMCC/CLARE-GLAD, FARWELL/MMCC/CLARE-GLAD, MT PLEASANT/MMCC/GRAT-ISA, BEAL CITY/MMCC/GRAT-ISABCounty: 37- ISABELLA
School District Report Page: DB: Isabella County Current A
04/25/201901:47 PM
1/2
Assessment Unit School District Real TAX Per. TAX Total Tax PRE/MBT Non-PRE/MBT % of County
Grand total of all Districts 91,082,245 9,804,600 100,886,845 66,559,035 34,327,810 100.00
Total of all Districts 7,616,069 1,306,400 8,922,469 1,177,834 7,744,635 8.8418 CLARE 18010 CLARE/MMCC/CLARE-GLAD 7,616,069 1,306,400 8,922,469 1,177,834 7,744,635 8.84
Total of all Districts 19,101,265 1,208,900 20,310,165 14,768,342 5,541,823 20.1316 WISE 18010 CLARE/MMCC/CLARE-GLAD 19,101,265 1,208,900 20,310,165 14,768,342 5,541,823 20.13
Total of all Districts 35,835,442 6,369,200 42,204,642 31,793,048 10,411,594 41.8337015 MT PLEASANT/MMCC/GRAT 118,378 0 118,378 118,378 0 0.1218020 FARWELL/MMCC/CLARE-GL 3,265,053 439,100 3,704,153 2,971,314 732,839 3.67
15 VERNON 18010 CLARE/MMCC/CLARE-GLAD 32,452,011 5,930,100 38,382,111 28,703,356 9,678,755 38.04
Total of all Districts 540,879 12,600 553,479 540,879 12,600 0.5537043 BEAL CITY/MMCC/GRAT-I 287,872 0 287,872 287,872 0 0.29
11 NOTTAWA 18020 FARWELL/MMCC/CLARE-GL 253,007 12,600 265,607 253,007 12,600 0.26
Total of all Districts 27,988,590 907,500 28,896,090 18,278,932 10,617,158 28.6408 GILMORE 18020 FARWELL/MMCC/CLARE-GL 27,988,590 907,500 28,896,090 18,278,932 10,617,158 28.64
71

School(s): CLARE/MMCC/CLARE-GLAD, FARWELL/MMCC/CLARE-GLAD, MT PLEASANT/MMCC/GRAT-ISA, BEAL CITY/MMCC/GRAT-ISABCounty: 37- ISABELLA
School District Report Page: DB: Isabella County Current A
04/25/201901:47 PM
2/2
School District Assessment Unit Real TAX Per. TAX Total Tax PRE/MBT Non-PRE/MBT % of County
Grand total of all Units 91,082,245 9,804,600 100,886,845 66,559,035 34,327,810 100.00
Total of all Units 287,872 0 287,872 287,872 0 0.2937043 BEAL CITY/MMCC/GRAT-ISAB11 NOTTAWA 287,872 0 287,872 287,872 0 0.29
Total of all Units 118,378 0 118,378 118,378 0 0.1237015 MT PLEASANT/MMCC/GRAT-ISA15 VERNON 118,378 0 118,378 118,378 0 0.12
Total of all Units 31,506,650 1,359,200 32,865,850 21,503,253 11,362,597 32.5815 VERNON 3,265,053 439,100 3,704,153 2,971,314 732,839 3.6711 NOTTAWA 253,007 12,600 265,607 253,007 12,600 0.26
18020 FARWELL/MMCC/CLARE-GLAD08 GILMORE 27,988,590 907,500 28,896,090 18,278,932 10,617,158 28.64
Total of all Units 59,169,345 8,445,400 67,614,745 44,649,532 22,965,213 67.0218 CLARE 7,616,069 1,306,400 8,922,469 1,177,834 7,744,635 8.8416 WISE 19,101,265 1,208,900 20,310,165 14,768,342 5,541,823 20.13
18010 CLARE/MMCC/CLARE-GLAD15 VERNON 32,452,011 5,930,100 38,382,111 28,703,356 9,678,755 38.04
72

School(s): MT PLEASANT/MNTCC/GRAT-IS, MT PLEASANT/MNTCC/GRAT-IS, SHEPHERD/MNTCC/GRAT-ISAB, CHIPPEWA HILL/MNTCC/MOISCounty: 37- ISABELLA
School District Report Page: DB: Isabella County Current A
04/25/201901:52 PM
1/2
Assessment Unit School District Real TAX Per. TAX Total Tax PRE/MBT Non-PRE/MBT % of County
Grand total of all Districts 95,315,899 2,816,600 98,132,499 80,955,870 17,176,629 100.00
Total of all Districts 37,312,549 1,758,100 39,070,649 32,246,166 6,824,483 39.8112 ROLLAND 59045 MONTABELLA/MNTCC/MISD 37,312,549 1,758,100 39,070,649 32,246,166 6,824,483 39.81
Total of all Districts 88,576 0 88,576 88,576 0 0.0910 LINCOLN 59150 VESTABURG/MNTCC/MISD 88,576 0 88,576 88,576 0 0.09
Total of all Districts 18,258,803 359,400 18,618,203 15,662,087 2,956,116 18.9759150 VESTABURG/MNTCC/MISD 7,397,509 150,900 7,548,409 5,982,968 1,565,441 7.6959045 MONTABELLA/MNTCC/MISD 10,100,634 208,500 10,309,134 8,950,997 1,358,137 10.51
07 FREMONT 37061 SHEPHERD/MNTCC/GRAT-I 760,660 0 760,660 728,122 32,538 0.78
Total of all Districts 29,140,352 352,700 29,493,052 26,058,752 3,434,300 30.0559045 MONTABELLA/MNTCC/MISD 12,711,331 351,200 13,062,531 10,832,094 2,230,437 13.3137061 SHEPHERD/MNTCC/GRAT-I 30,204 0 30,204 30,204 0 0.0337016 MT PLEASANT/MNTCC/GRA 5,577,256 0 5,577,256 5,106,755 470,501 5.68
05 DEERFIELD 37013 MT PLEASANT/MNTCC/GRA 10,821,561 1,500 10,823,061 10,089,699 733,362 11.03
Total of all Districts 10,515,619 346,400 10,862,019 6,900,289 3,961,730 11.0759045 MONTABELLA/MNTCC/MISD 9,799,844 346,400 10,146,244 6,229,918 3,916,326 10.34
01 BROOMFIELD 54026 CHIPPEWA HILL/MNTCC/M 715,775 0 715,775 670,371 45,404 0.73
73

School(s): MT PLEASANT/MNTCC/GRAT-IS, MT PLEASANT/MNTCC/GRAT-IS, SHEPHERD/MNTCC/GRAT-ISAB, CHIPPEWA HILL/MNTCC/MOISCounty: 37- ISABELLA
School District Report Page: DB: Isabella County Current A
04/25/201901:52 PM
2/2
School District Assessment Unit Real TAX Per. TAX Total Tax PRE/MBT Non-PRE/MBT % of County
Grand total of all Units 95,315,899 2,816,600 98,132,499 80,955,870 17,176,629 100.00
Total of all Units 7,486,085 150,900 7,636,985 6,071,544 1,565,441 7.7810 LINCOLN 88,576 0 88,576 88,576 0 0.09
59150 VESTABURG/MNTCC/MISD 07 FREMONT 7,397,509 150,900 7,548,409 5,982,968 1,565,441 7.69
Total of all Units 69,924,358 2,664,200 72,588,558 58,259,175 14,329,383 73.9712 ROLLAND 37,312,549 1,758,100 39,070,649 32,246,166 6,824,483 39.8107 FREMONT 10,100,634 208,500 10,309,134 8,950,997 1,358,137 10.5105 DEERFIELD 12,711,331 351,200 13,062,531 10,832,094 2,230,437 13.31
59045 MONTABELLA/MNTCC/MISD01 BROOMFIELD 9,799,844 346,400 10,146,244 6,229,918 3,916,326 10.34
Total of all Units 715,775 0 715,775 670,371 45,404 0.7354026 CHIPPEWA HILL/MNTCC/MOISD01 BROOMFIELD 715,775 0 715,775 670,371 45,404 0.73
Total of all Units 790,864 0 790,864 758,326 32,538 0.8107 FREMONT 760,660 0 760,660 728,122 32,538 0.78
37061 SHEPHERD/MNTCC/GRAT-ISAB05 DEERFIELD 30,204 0 30,204 30,204 0 0.03
Total of all Units 5,577,256 0 5,577,256 5,106,755 470,501 5.6837016 MT PLEASANT/MNTCC/GRAT-IS05 DEERFIELD 5,577,256 0 5,577,256 5,106,755 470,501 5.68
Total of all Units 10,821,561 1,500 10,823,061 10,089,699 733,362 11.0337013 MT PLEASANT/MNTCC/GRAT-IS05 DEERFIELD 10,821,561 1,500 10,823,061 10,089,699 733,362 11.03
74
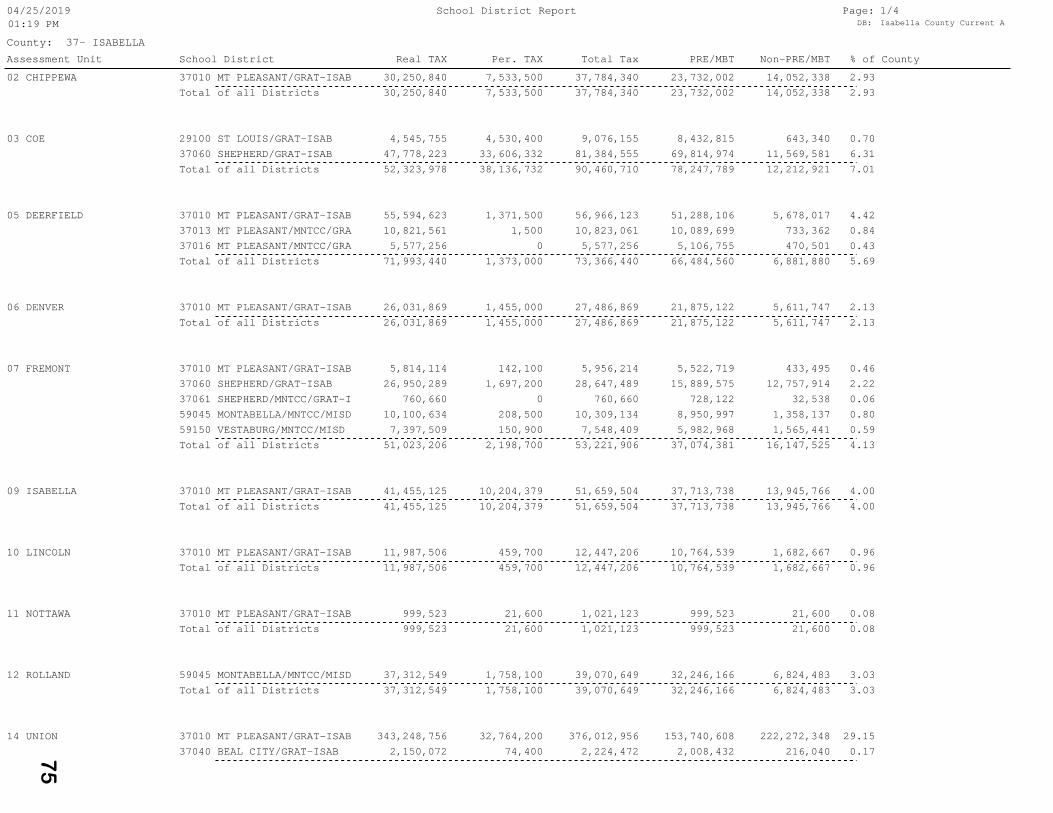
County: 37- ISABELLA
School District Report Page: DB: Isabella County Current A
04/25/201901:19 PM
1/4
Assessment Unit School District Real TAX Per. TAX Total Tax PRE/MBT Non-PRE/MBT % of County
37040 BEAL CITY/GRAT-ISAB 2,150,072 74,400 2,224,472 2,008,432 216,040 0.1714 UNION 37010 MT PLEASANT/GRAT-ISAB 343,248,756 32,764,200 376,012,956 153,740,608 222,272,348 29.15
Total of all Districts 37,312,549 1,758,100 39,070,649 32,246,166 6,824,483 3.0312 ROLLAND 59045 MONTABELLA/MNTCC/MISD 37,312,549 1,758,100 39,070,649 32,246,166 6,824,483 3.03
Total of all Districts 999,523 21,600 1,021,123 999,523 21,600 0.0811 NOTTAWA 37010 MT PLEASANT/GRAT-ISAB 999,523 21,600 1,021,123 999,523 21,600 0.08
Total of all Districts 11,987,506 459,700 12,447,206 10,764,539 1,682,667 0.9610 LINCOLN 37010 MT PLEASANT/GRAT-ISAB 11,987,506 459,700 12,447,206 10,764,539 1,682,667 0.96
Total of all Districts 41,455,125 10,204,379 51,659,504 37,713,738 13,945,766 4.0009 ISABELLA 37010 MT PLEASANT/GRAT-ISAB 41,455,125 10,204,379 51,659,504 37,713,738 13,945,766 4.00
Total of all Districts 51,023,206 2,198,700 53,221,906 37,074,381 16,147,525 4.1359150 VESTABURG/MNTCC/MISD 7,397,509 150,900 7,548,409 5,982,968 1,565,441 0.5959045 MONTABELLA/MNTCC/MISD 10,100,634 208,500 10,309,134 8,950,997 1,358,137 0.8037061 SHEPHERD/MNTCC/GRAT-I 760,660 0 760,660 728,122 32,538 0.0637060 SHEPHERD/GRAT-ISAB 26,950,289 1,697,200 28,647,489 15,889,575 12,757,914 2.22
07 FREMONT 37010 MT PLEASANT/GRAT-ISAB 5,814,114 142,100 5,956,214 5,522,719 433,495 0.46
Total of all Districts 26,031,869 1,455,000 27,486,869 21,875,122 5,611,747 2.1306 DENVER 37010 MT PLEASANT/GRAT-ISAB 26,031,869 1,455,000 27,486,869 21,875,122 5,611,747 2.13
Total of all Districts 71,993,440 1,373,000 73,366,440 66,484,560 6,881,880 5.6937016 MT PLEASANT/MNTCC/GRA 5,577,256 0 5,577,256 5,106,755 470,501 0.4337013 MT PLEASANT/MNTCC/GRA 10,821,561 1,500 10,823,061 10,089,699 733,362 0.84
05 DEERFIELD 37010 MT PLEASANT/GRAT-ISAB 55,594,623 1,371,500 56,966,123 51,288,106 5,678,017 4.42
Total of all Districts 52,323,978 38,136,732 90,460,710 78,247,789 12,212,921 7.0137060 SHEPHERD/GRAT-ISAB 47,778,223 33,606,332 81,384,555 69,814,974 11,569,581 6.31
03 COE 29100 ST LOUIS/GRAT-ISAB 4,545,755 4,530,400 9,076,155 8,432,815 643,340 0.70
Total of all Districts 30,250,840 7,533,500 37,784,340 23,732,002 14,052,338 2.9302 CHIPPEWA 37010 MT PLEASANT/GRAT-ISAB 30,250,840 7,533,500 37,784,340 23,732,002 14,052,338 2.93
75

County: 37- ISABELLA
School District Report Page: DB: Isabella County Current A
04/25/201901:19 PM
2/4
Assessment Unit School District Real TAX Per. TAX Total Tax PRE/MBT Non-PRE/MBT % of County
Grand total of all Districts 1,157,528,196 132,424,254 1,289,952,450 706,256,832 583,695,618 100.00
Total of all Districts 8,146,857 6,130,400 14,277,257 9,888,269 4,388,988 1.1191 ROSEBUSH-ISABELLA 37010 MT PLEASANT/GRAT-ISAB 8,146,857 6,130,400 14,277,257 9,888,269 4,388,988 1.11
Total of all Districts 28,465,278 1,090,800 29,556,078 19,723,444 9,832,634 2.2931 SHEPHERD-COE 37060 SHEPHERD/GRAT-ISAB 28,465,278 1,090,800 29,556,078 19,723,444 9,832,634 2.29
Total of all Districts 443,163,872 28,263,843 471,427,715 203,234,076 268,193,639 36.5517 MT. PLEASANT 37010 MT PLEASANT/GRAT-ISAB 443,163,872 28,263,843 471,427,715 203,234,076 268,193,639 36.55
Total of all Districts 2,296,173 60,500 2,356,673 2,108,918 247,755 0.1816 WISE 37010 MT PLEASANT/GRAT-ISAB 2,296,173 60,500 2,356,673 2,108,918 247,755 0.18
Total of all Districts 6,679,152 899,400 7,578,552 6,415,265 1,163,287 0.5937015 MT PLEASANT/MMCC/GRAT 118,378 0 118,378 118,378 0 0.01
15 VERNON 37010 MT PLEASANT/GRAT-ISAB 6,560,774 899,400 7,460,174 6,296,887 1,163,287 0.58
Total of all Districts 345,398,828 32,838,600 378,237,428 155,749,040 222,488,388 29.32
76

County: 37- ISABELLA
School District Report Page: DB: Isabella County Current A
04/25/201901:19 PM
3/4
School District Assessment Unit Real TAX Per. TAX Total Tax PRE/MBT Non-PRE/MBT % of County
Total of all Units 760,660 0 760,660 728,122 32,538 0.0637061 SHEPHERD/MNTCC/GRAT-ISAB07 FREMONT 760,660 0 760,660 728,122 32,538 0.06
Total of all Units 103,193,790 36,394,332 139,588,122 105,427,993 34,160,129 10.8231 SHEPHERD-COE 28,465,278 1,090,800 29,556,078 19,723,444 9,832,634 2.2907 FREMONT 26,950,289 1,697,200 28,647,489 15,889,575 12,757,914 2.22
37060 SHEPHERD/GRAT-ISAB 03 COE 47,778,223 33,606,332 81,384,555 69,814,974 11,569,581 6.31
Total of all Units 2,150,072 74,400 2,224,472 2,008,432 216,040 0.1737040 BEAL CITY/GRAT-ISAB 14 UNION 2,150,072 74,400 2,224,472 2,008,432 216,040 0.17
Total of all Units 5,577,256 0 5,577,256 5,106,755 470,501 0.4337016 MT PLEASANT/MNTCC/GRAT-IS05 DEERFIELD 5,577,256 0 5,577,256 5,106,755 470,501 0.43
Total of all Units 118,378 0 118,378 118,378 0 0.0137015 MT PLEASANT/MMCC/GRAT-ISA15 VERNON 118,378 0 118,378 118,378 0 0.01
Total of all Units 10,821,561 1,500 10,823,061 10,089,699 733,362 0.8437013 MT PLEASANT/MNTCC/GRAT-IS05 DEERFIELD 10,821,561 1,500 10,823,061 10,089,699 733,362 0.84
Total of all Units 975,550,032 89,306,122 1,064,856,154 527,164,507 537,691,647 82.5591 ROSEBUSH-ISABELLA 8,146,857 6,130,400 14,277,257 9,888,269 4,388,988 1.1117 MT. PLEASANT 443,163,872 28,263,843 471,427,715 203,234,076 268,193,639 36.5516 WISE 2,296,173 60,500 2,356,673 2,108,918 247,755 0.1815 VERNON 6,560,774 899,400 7,460,174 6,296,887 1,163,287 0.5814 UNION 343,248,756 32,764,200 376,012,956 153,740,608 222,272,348 29.1511 NOTTAWA 999,523 21,600 1,021,123 999,523 21,600 0.0810 LINCOLN 11,987,506 459,700 12,447,206 10,764,539 1,682,667 0.9609 ISABELLA 41,455,125 10,204,379 51,659,504 37,713,738 13,945,766 4.0007 FREMONT 5,814,114 142,100 5,956,214 5,522,719 433,495 0.4606 DENVER 26,031,869 1,455,000 27,486,869 21,875,122 5,611,747 2.1305 DEERFIELD 55,594,623 1,371,500 56,966,123 51,288,106 5,678,017 4.42
37010 MT PLEASANT/GRAT-ISAB02 CHIPPEWA 30,250,840 7,533,500 37,784,340 23,732,002 14,052,338 2.93
Total of all Units 4,545,755 4,530,400 9,076,155 8,432,815 643,340 0.7029100 ST LOUIS/GRAT-ISAB 03 COE 4,545,755 4,530,400 9,076,155 8,432,815 643,340 0.70
77
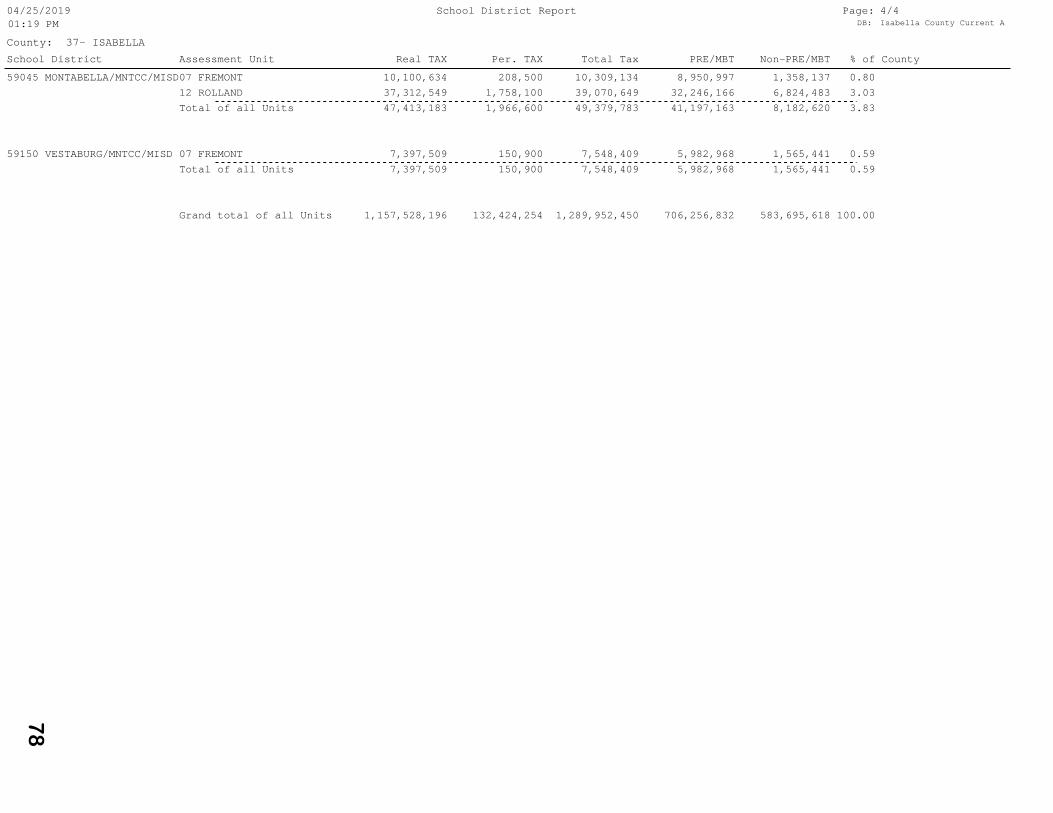
County: 37- ISABELLA
School District Report Page: DB: Isabella County Current A
04/25/201901:19 PM
4/4
School District Assessment Unit Real TAX Per. TAX Total Tax PRE/MBT Non-PRE/MBT % of County
Grand total of all Units 1,157,528,196 132,424,254 1,289,952,450 706,256,832 583,695,618 100.00
Total of all Units 7,397,509 150,900 7,548,409 5,982,968 1,565,441 0.5959150 VESTABURG/MNTCC/MISD 07 FREMONT 7,397,509 150,900 7,548,409 5,982,968 1,565,441 0.59
Total of all Units 47,413,183 1,966,600 49,379,783 41,197,163 8,182,620 3.8312 ROLLAND 37,312,549 1,758,100 39,070,649 32,246,166 6,824,483 3.03
59045 MONTABELLA/MNTCC/MISD07 FREMONT 10,100,634 208,500 10,309,134 8,950,997 1,358,137 0.80
78
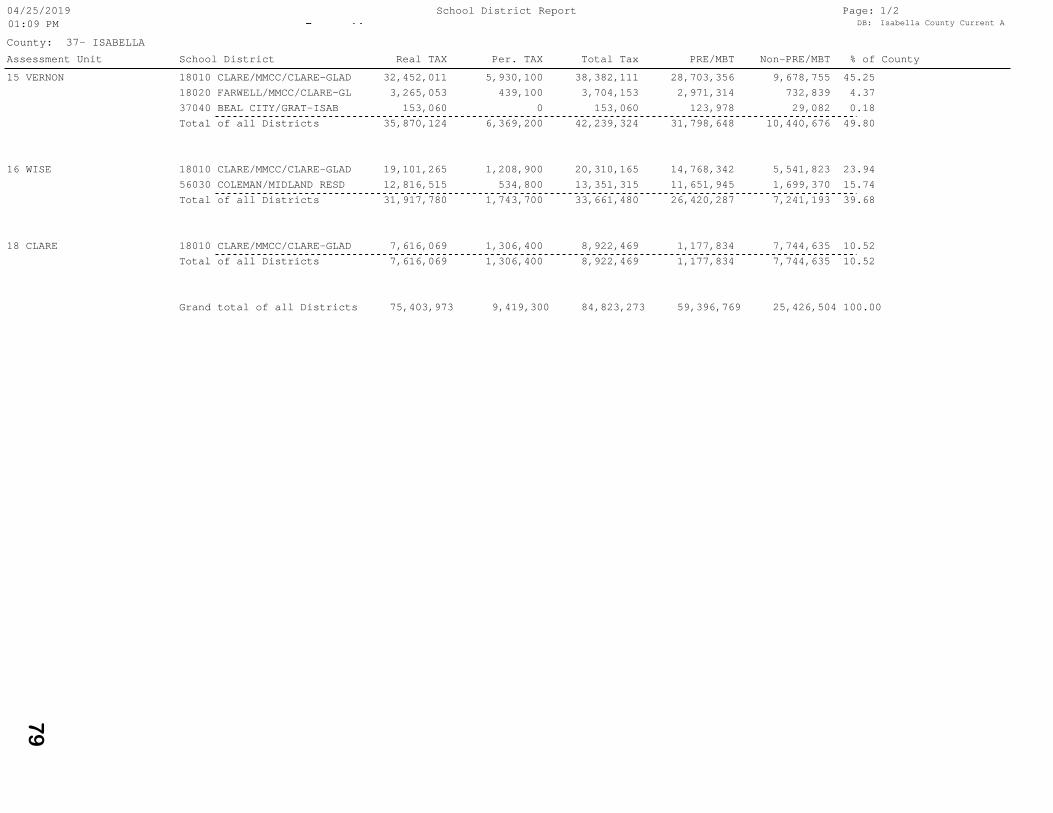
County: 37- ISABELLA
School District Report Page: DB: Isabella County Current A
04/25/201901:09 PM
1/2
Assessment Unit School District Real TAX Per. TAX Total Tax PRE/MBT Non-PRE/MBT % of County
Grand total of all Districts 75,403,973 9,419,300 84,823,273 59,396,769 25,426,504 100.00
Total of all Districts 7,616,069 1,306,400 8,922,469 1,177,834 7,744,635 10.5218 CLARE 18010 CLARE/MMCC/CLARE-GLAD 7,616,069 1,306,400 8,922,469 1,177,834 7,744,635 10.52
Total of all Districts 31,917,780 1,743,700 33,661,480 26,420,287 7,241,193 39.6856030 COLEMAN/MIDLAND RESD 12,816,515 534,800 13,351,315 11,651,945 1,699,370 15.74
16 WISE 18010 CLARE/MMCC/CLARE-GLAD 19,101,265 1,208,900 20,310,165 14,768,342 5,541,823 23.94
Total of all Districts 35,870,124 6,369,200 42,239,324 31,798,648 10,440,676 49.8037040 BEAL CITY/GRAT-ISAB 153,060 0 153,060 123,978 29,082 0.1818020 FARWELL/MMCC/CLARE-GL 3,265,053 439,100 3,704,153 2,971,314 732,839 4.37
15 VERNON 18010 CLARE/MMCC/CLARE-GLAD 32,452,011 5,930,100 38,382,111 28,703,356 9,678,755 45.25
79
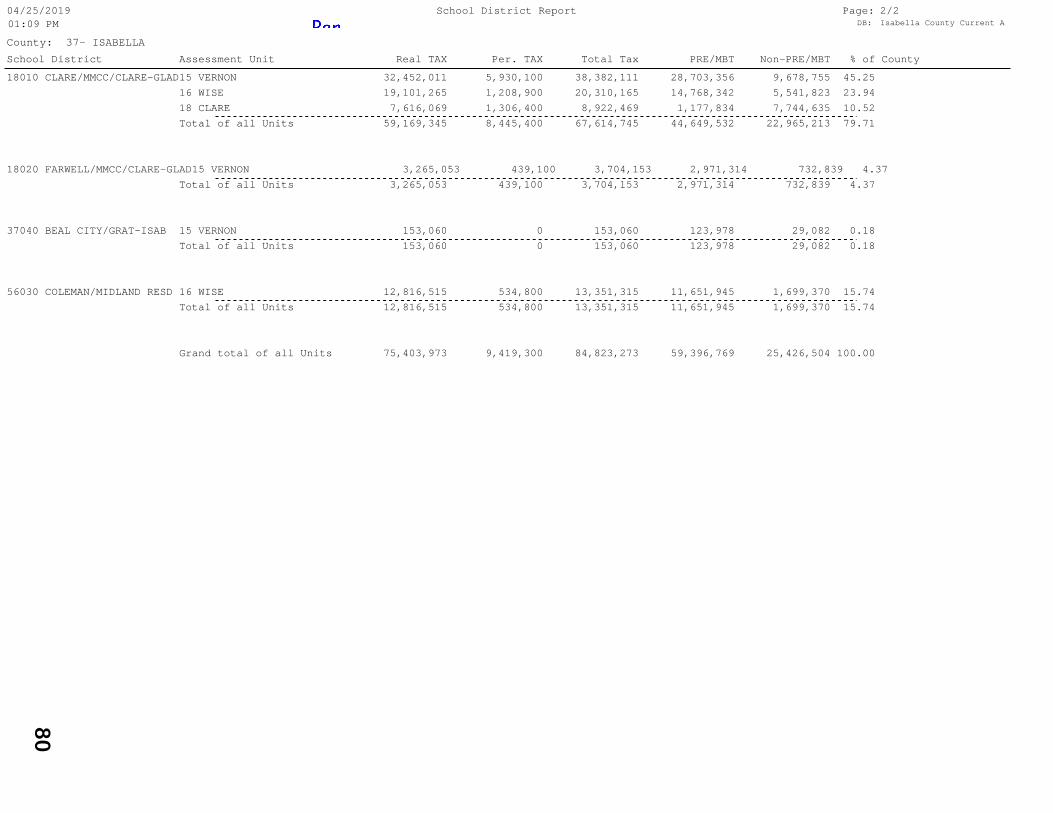
County: 37- ISABELLA
School District Report Page: DB: Isabella County Current A
04/25/201901:09 PM
2/2
School District Assessment Unit Real TAX Per. TAX Total Tax PRE/MBT Non-PRE/MBT % of County
Grand total of all Units 75,403,973 9,419,300 84,823,273 59,396,769 25,426,504 100.00
Total of all Units 12,816,515 534,800 13,351,315 11,651,945 1,699,370 15.7456030 COLEMAN/MIDLAND RESD 16 WISE 12,816,515 534,800 13,351,315 11,651,945 1,699,370 15.74
Total of all Units 153,060 0 153,060 123,978 29,082 0.1837040 BEAL CITY/GRAT-ISAB 15 VERNON 153,060 0 153,060 123,978 29,082 0.18
Total of all Units 3,265,053 439,100 3,704,153 2,971,314 732,839 4.3718020 FARWELL/MMCC/CLARE-GLAD15 VERNON 3,265,053 439,100 3,704,153 2,971,314 732,839 4.37
Total of all Units 59,169,345 8,445,400 67,614,745 44,649,532 22,965,213 79.7118 CLARE 7,616,069 1,306,400 8,922,469 1,177,834 7,744,635 10.5216 WISE 19,101,265 1,208,900 20,310,165 14,768,342 5,541,823 23.94
18010 CLARE/MMCC/CLARE-GLAD15 VERNON 32,452,011 5,930,100 38,382,111 28,703,356 9,678,755 45.25
80
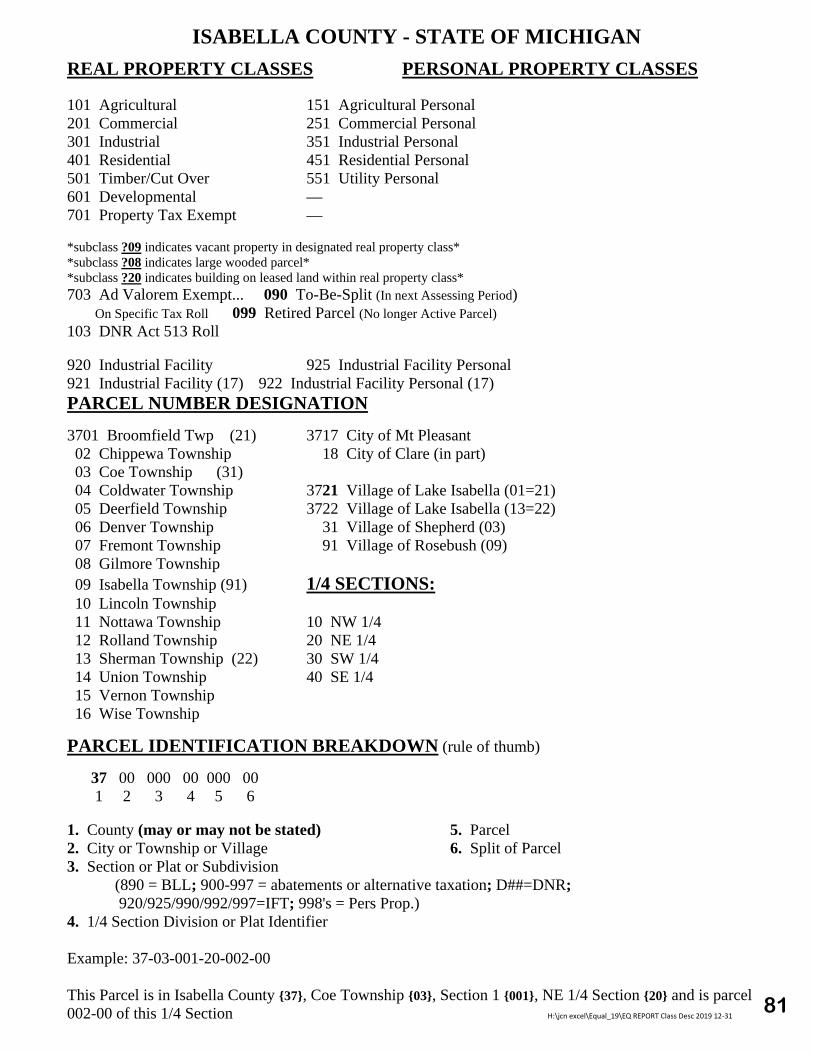
ISABELLA COUNTY - STATE OF MICHIGANREAL PROPERTY CLASSES PERSONAL PROPERTY CLASSES
101 Agricultural 151 Agricultural Personal 201 Commercial 251 Commercial Personal 301 Industrial 351 Industrial Personal 401 Residential 451 Residential Personal 501 Timber/Cut Over 551 Utility Personal 601 Developmental — 701 Property Tax Exempt —
*subclass ?09 indicates vacant property in designated real property class**subclass ?08 indicates large wooded parcel**subclass ?20 indicates building on leased land within real property class*703 Ad Valorem Exempt... 090 To-Be-Split (In next Assessing Period) On Specific Tax Roll 099 Retired Parcel (No longer Active Parcel) 103 DNR Act 513 Roll
920 Industrial Facility 925 Industrial Facility Personal 921 Industrial Facility (17) 922 Industrial Facility Personal (17) PARCEL NUMBER DESIGNATION
3701 Broomfield Twp (21) 3717 City of Mt Pleasant 02 Chippewa Township 18 City of Clare (in part) 03 Coe Township (31) 04 Coldwater Township 3721 Village of Lake Isabella (01=21) 05 Deerfield Township 3722 Village of Lake Isabella (13=22) 06 Denver Township 31 Village of Shepherd (03) 07 Fremont Township 91 Village of Rosebush (09) 08 Gilmore Township 09 Isabella Township (91) 1/4 SECTIONS: 10 Lincoln Township 11 Nottawa Township 10 NW 1/4 12 Rolland Township 20 NE 1/4 13 Sherman Township (22) 30 SW 1/4 14 Union Township 40 SE 1/4 15 Vernon Township 16 Wise Township
PARCEL IDENTIFICATION BREAKDOWN (rule of thumb)
37 00 000 00 000 00 1 2 3 4 5 6
1. County (may or may not be stated) 5. Parcel2. City or Township or Village 6. Split of Parcel3. Section or Plat or Subdivision
(890 = BLL; 900-997 = abatements or alternative taxation; D##=DNR; 920/925/990/992/997=IFT; 998's = Pers Prop.)
4. 1/4 Section Division or Plat Identifier
Example: 37-03-001-20-002-00
This Parcel is in Isabella County {37}, Coe Township {03}, Section 1 {001}, NE 1/4 Section {20} and is parcel 002-00 of this 1/4 Section H:\jcn excel\Equal_19\EQ REPORT Class Desc 2019 12‐31
81

Based on Certification Level Guidelines approved by the State Tax Commission at their meeting on Assessors responsibile for multiple rolls must take into account the sum of all units in determining the certification level
For cities that reside in more than one county, the SEV totals listed will be for the entire city.
August 21, 2018
82

ISABELLA COUNTY SUPERVISORS 2018
06/29/2018
04 COLDWATER 08 GILMORE 15 VERNON 16 WISET16N R6W T16N R5W T16N R4W T16N R3W
James Dague - Twp Supv Steve Lasher - Twp Supv Jeffrey R. Bean - Twp Supv Robert Moore - Twp Supv T11562 W. Battle Rd 9030 Stevenson Lake Ct 6675 Whiteville Rd 9407 N East Isabella Countyline Rd 16
Lake, MI 48632 Lake, MI 48632 Rosebush, MI 48878 Coleman, MI 48618 NPh: 989-382-7018 Ph: 989-588-4062 Ph: 989-433-2028 Ph: 989-465-9116
Fax: Fax: Fax: Fax:E-mail: E-mail: [email protected] E-mail: E-mail:
www.Gilmoretwp.com www.vernontownship.org www.wisetownship.org
as of 06-22-2018
13 SHERMAN 21 11 NOTTAWA 09 ISABELLA 91 06 DENVERT15N R6W T15N R5W T15N R4W T15N R3W
Bob Thompson - Twp Supv Kory Mindel - Twp Supv Rick Ervin - Twp Supv John Pedjac - Twp Supv T10348 W Airline Rd 4176 N. Winn Rd 3200 N. Isabella Rd 6681 E. Weidman Rd 15
Weidman, MI 48893 Weidman, MI 48893 Rosebush, MI 48878 Mount Pleasant, MI 48858 NPh: 989-644-3907 Ph: 989-644-8480 Ph: 989-621-9924 Ph: 989-442-5157
Fax: Fax: Fax: Fax:E-mail: E-mail: E-mail: E-mail:
www.shermantwp.com
01 BROOMFIELD 21 05 DEERFIELD 14 UNION 02 CHIPPEWAT14N R6W T14N R5W T14N R4W T14N R3W
Christy Mathewson - Twp Supv Timothy Murphy - Twp Supv Ben Gunning - Twp Supv Robert P. Smith - Twp Supv T2889 S Rolland Rd 3032 S. Winn Rd 2010 S. Lincoln Rd 11084 E Pickard Rd 14Remus, MI 49340 Mount Pleasant, MI 48858 Mount Pleasant, MI 48858 Mount Pleasant, MI 48858 NPh: 989-561-5391 Ph: 989-779-7557 Ph: 989-772-4600 X226 Ph: 989-773-1975
Fax: Fax: Fax: 989-773-1988 Fax:E-mail: E-mail: E-mail: E-mail:
www.deerfieldtownship.net www.uniontownshipmi.com www.chippewatownship.com
twp hall twp hall twp hall twp hall
12 ROLLAND 07 FREMONT 10 LINCOLN 03 COE 31T13N R6W T13N R5W T13N R4W T13N R3W
Daniel Shaw - Twp Supv Gerad Himebaugh-Twp Supv Thomas Ramon-Twp Supv Mary Kay Maas - Twp Supv T140 W Main St, PO Box 53 6279 S Curtis Rd 11291 S. Crawford Rd 8134 S. Federal Rd 13
Blanchard MI 49310 Mount Pleasant MI 48858 Shepherd, MI 48883 Shepherd, MI 48883 NPh: 989-561-2224 Ph: 989-866-8174 Ph: 989-828-6519 Ph: 989-828-5322
Fax: Fax: Fax: Fax:E-mail: E-mail: E-mail: E-mail:
www.coetownship.com
John Schimmelmann-Twp Clerk: 989-866-2512
R6W R5W R4W R3W
17 CITY MT PLEASANT 18 CITY OF CLARE Isabella County Website: 37 EQUALIZATION DEPTT14N R4W T16N R4W www.isabellacounty.org STAFF
City of Mount Pleasant City of Clare Scott Cunningham - Director 01-01-2018
320 W. Broadway St 202 W. Fifth St Village of Lake Isabella: Peter Preston, Equalization Manager -
Mount Pleasant, MI 48858 Clare, MI 48617 Ph: 989-644-8654 989-317-4075
Ph: 989-779-5355 Ph: 989-386-7541 X103 www.lakeisabellami.orgFax: 989-773-4691 Fax: 989-386-4508 Village of Shepherd: Judy Niznak - 989-317-4223
E-mail: E-mail: Ph: 989-828-5278 Paula DesRochers - 989-317-4074
www.mt-pleasant.org www.cityofclare.org www.shepherdmi.comVillage of Rosebush: Front Desk Phone: 989-317-4074
Ph: 989-433-0106 Clerk Fax: 989-779-9102
H:\Jcn Excel\Equal_19\EQ SUPR-ASSR-MBOR#-TREAS 2019-03-04.xlsx
83

ISABELLA COUNTY ASSESSORS 2019
02/26/2019
04 COLDWATER 08 GILMORE 15 VERNON 16 WISET16N R6W T16N R5W T16N R4W T16N R3W
Denise Hall - Assr Chuck Zemla - Assr Michael Beach - AssrEquity Assessments Inc. CSZ Services LLC Beach & Beach Assessing Serv. Bradley Beach - Assr T
5887 Schafin Dr. 112 W. Walker St. PO Box 376 PO Box 225 16Weidman, MI 48893 PO Box 98 Mecosta, MI 49332 Weidman, MI 48893 N
Ph: 989-644-3413 St. Johns, MI 48879 Ph: 866-921-9293 Ph: 989-309-0105 Fax: 989-644-3414 Ph: 989-292-4422 Fax: Fax:E-mail:[email protected] E-mail:[email protected] E-mail: E-mail:
www.vernontownship.org as of 09-2011 as of 08-2012 as of 04-2018
13 SHERMAN 21 11 NOTTAWA 09 ISABELLA 91 06 DENVERT15N R6W T15N R5W T15N R4W T15N R3W
Denise Hall - Assr Denise Hall - Assr Denise Hall - AssrEquity Assessments Inc. Equity Assessments Inc. Bill Strouse-Assr Equity Assessments Inc. T
5887 Schafin Dr. 5887 Schafin Dr. 8164 E. Washington Rd 5887 Schafin Dr. 15Weidman, MI 48893 Weidman, MI 48893 Clare, MI 48617 Weidman, MI 48893 N
Ph: 989-644-3413 Ph: 989-644-3413 Ph: 989-386-3795 Ph: 989-644-3413 Fax: 989-644-3414 Fax: 989-644-3414 Fax: 989-386-3709 Fax: 989-644-3414E-mail:[email protected] E-mail:[email protected] E-mail: E-mail:[email protected]
www.shermantwp.com as of 06-2013 as of 2009 as of 2010
01 BROOMFIELD 21 05 DEERFIELD 14 UNION 02 CHIPPEWAT14N R6W T14N R5W T14N R4W T14N R3W
Denise Hall - Assr Denise Hall - AssrEquity Assessments Inc. Equity Assessments Inc. Patricia M. DePriest-Assr Bradley Beach - Assr T
5887 Schafin Dr. 5887 Schafin Dr. 2010 S. Lincoln Rd PO Box 225 14Weidman, MI 48893 Weidman, MI 48893 Mount Pleasant, MI 48858 Weidman, MI 48893 N
Ph: 989-644-3413 Ph: 989-644-3413 Ph: 989-772-4600 X230 Ph: 989-309-0105 Fax: 989-644-3414 Fax: 989-644-3414 Fax: 989-773-1988 Fax:E-mail: [email protected] E-mail:[email protected] E-mail: E-mail:
www.deerfieldtownship.net www.uniontownshipmi.com www.chippewatownship.com
as of 9- 2018 as of 09-2012 as of 07-2018
12 ROLLAND 07 FREMONT 10 LINCOLN 03 COE 31T13N R6W T13N R5W T13N R4W T13N R3W
Denise Hall - AssrEquity Assessments Inc. Bradley Beach-Assr Thomas L. Ramon-Assr Tina Braman- Assr T
5887 Schafin Dr. PO Box 225 11291 S. Crawford Rd 11475 E Cranberry Lake Rd 13Weidman, MI 48893 Weidman, MI 48893 Shepherd, MI 48883 Gladwin, MI 48624 N
Ph: 989-644-3413 Ph: 989-309-0105 Ph: 989-828-6519 Ph: 313-303-3687 Fax: 989-644-3414 Fax: Fax: Fax:E-mail:[email protected] E-mail: E-mail: E-mail: [email protected]
www.coetownship.com
as of 05-2013 as of 08-2010 as of 09-2016
R6W R5W R4W R3W
17 CITY MT PLEASANT 18 CITY OF CLARE Isabella County Website: 37 EQUALIZATION DEPTT14N R4W T16N R4W www.isabellacounty.org STAFF
Christopher Coucke - Assr Edie Hunter-Assr Scott Cunningham - Director 01-01-2018
320 W. Broadway St 202 W. Fifth St Village of Lake Isabella: Peter Preston, Equalization Manager -
Mount Pleasant, MI 48858 Clare, MI 48617 Ph: 989-644-8654 989-317-4075
Ph: 989-779-5355 Ph: 989-386-7541 X103 www.lakeisabellami.orgFax: 989-773-4691 Fax: 989-386-4508 Village of Shepherd: Judy Niznak - 989-317-4223
E-mail: E-mail: Ph: 989-828-5278 Paula DesRochers - 989-317-4074www.mt-pleasant.org www.cityofclare.org www.shepherdmi.com
Village of Rosebush: Front Desk Phone: 989-317-4074
as of 06-2017 Ph: 989-433-0106 Clerk Fax: 989-779-9102
H:\Jcn Excel\Equal_19\EQ SUPR-ASSR-MBOR#-TREAS 2019-03-04.xlsx
84