isagro as of march 31 , · pdf filewhile it shall depend largely by the normalization in the...
TRANSCRIPT

ISAGRO AS OF MARCH 31ST, 2016
Conference Call
Milan, May 17th, 2016

2
2BACK-UP
1FACTS & FIGURES
RESULTS AS OF MARCH 31st, 2016
MAIN EVENTS
ISAGRO IN THE STOCK MARKET
ISAGRO AS OF MARCH 31st, 2016Agenda

FIRST QUARTER HISTORICALLY NOT REPRESENTATIVE OF THE 12 MONTHS
3
Isagro’s sales: largely to third-party National Distributors
(direct distribution only in Colombia, India, Spain and, limited
to Biosolutions, in the USA)
First quarter sales to third-party National Distributors: mainly
related to stock (re)building
For Isagro, the First Quarter of each financial year
it is not historically representative
of the level of sales of the 12 months
Isagro as of March 31st, 2016
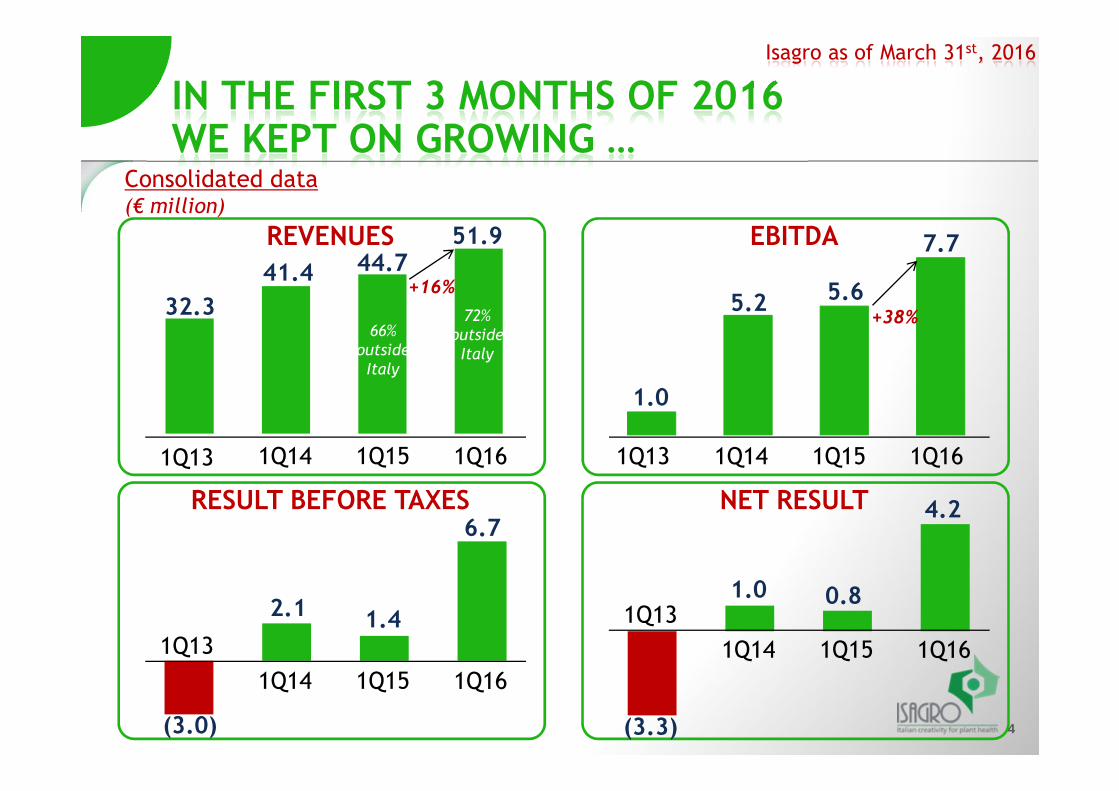
IN THE FIRST 3 MONTHS OF 2016WE KEPT ON GROWING …
4
REVENUES EBITDA
RESULT BEFORE TAXES NET RESULT
1Q13 1Q14 1Q15
32.3
41.4 44.7+16%
72%
outside
Italy
66%
outside
Italy
1Q16
51.9
1Q13 1Q14 1Q15 1Q16
1.0
5.2 5.6
7.7
+38%
1Q13
1Q14 1Q15 1Q16
(3.0)
2.1 1.4
6.7
(3.3)
1.0 0.8
4.2
1Q13
1Q14 1Q15 1Q16
Isagro as of March 31st, 2016
Consolidated data (€ million)

… IN A STILL DIFFICULT MARKET SCENARIO BUT BENEFITING FROM A DIFFERENT TIMING OF REPURCHASES …
5
In 1Q 2016, adverse conditions for the Crop Protection Market
to recover still present
low prices of agricultural commodities
in Brazil, also economic/financial crisis
unfavorable climatic conditions in the main markets
High level of inventory within distribution channels
1Q 2016 sales of main global players (Basf, Bayer, Dow, DuPont,
Monsanto, Syngenta) lower than 2015 in local currencies

6
Net Fin. Debt
Dec. 31, 2015
(47.2)(41.0)
61.7
3.6
Net Fin. Debt
March 31, 2016
5.3 (4.9)2.2
Total NWC decrease 2.6
>20 €m
financed
by
Equity
Memo:
Net current assets
Memo:
D/E
0.40
Memo:
D/E
0.47
Cash
generation
excluding
ΔNWC
Versus
a generation
of 2.6 €M
in 1Q 2015
… WITH NET FINANCIAL DEBT DECREASING VERSUS DECEMBER 31ST, 2015
For consumption
of «extra-stock»
levels
of 2015
Following
increase
of sales
Decreased
inventory
net of
payables
Increased receivables
Variations
of other
current
assets/
liabilities
(MEMO: UN-UTILIZED ISAGRO SPA’S BANKING LINES
AS AT MARCH 31, 2016 >60 €M )
For cash-in
of R,I&D credit
and
accruals
for bonuses
Isagro as of March 31st, 2016
Consolidated data (€ million)

7
BASED ON 2015 RESULTS, IN MAY 2016 ISAGRO RETURNS TO PAY DIVIDENDS
Resolution of the Assembly of last April 28th
(ex-dividend date May 16th, 2016 and payment date May 18th)
€ 0.025€ 0.030
20%
premium
2.38% yield(on May 13th, 2016 price)
3.46% yield(on May 13th, 2016 price)
Isagro as of March 31st, 2016
FOR EACH
ORDINARY SHAREFOR EACH
GROWTH SHARE(“Azione Sviluppo”)

PERSPECTIVES: IN 2016 WE AIM AT CONSOLIDATING 2015 RESULTS …
8
The financials for the whole 2016, the latter to be considered as a
year of consolidation of 2015 results, are only partially linked to
the good performance of 1Q, the latter being a period not
historically representative of the 12-month results,
while it shall depend largely by the normalization in the rest of
the year of the climatic / external scenario conditions in the
important Italian, Brazilian and United States markets, along with
the definition of new Licensing agreements
Isagro as of March 31st, 2016

9
… WITH THE MID-TERM TARGET OF 200 MILLION EURO REVENUES
Based on our Strategic Guidelines:
Isagro as of March 31st, 2016
DISCOVERY OF NEW MOLECULES ALONE1
VALUE EXTRACTION FROM OUR I.P. AND RETAINED RIGHTS ALSO
THROUGH LICENSING3
5
6
OPPORTUNISTIC DEVELOPMENT OF OFF-PATENTED PRODUCTS
4 GROWTH IN THE BIOSOLUTIONS BUSINESS, ALSO THROUGH ACQUISITIONS
EXPANSION OF OUR GLOBAL COMMERCIAL ORGANIZATION
DEVELOPMENT OF NEW MOLECULES MOSTLY THROUGH ATTRIBUTION
OF RIGHTS TO A “MAIN DEVELOPER” WHILE RETAINING RIGHTS FOR
ISAGRO ON SELECTED SEGMENTS/MARKETS
2
10
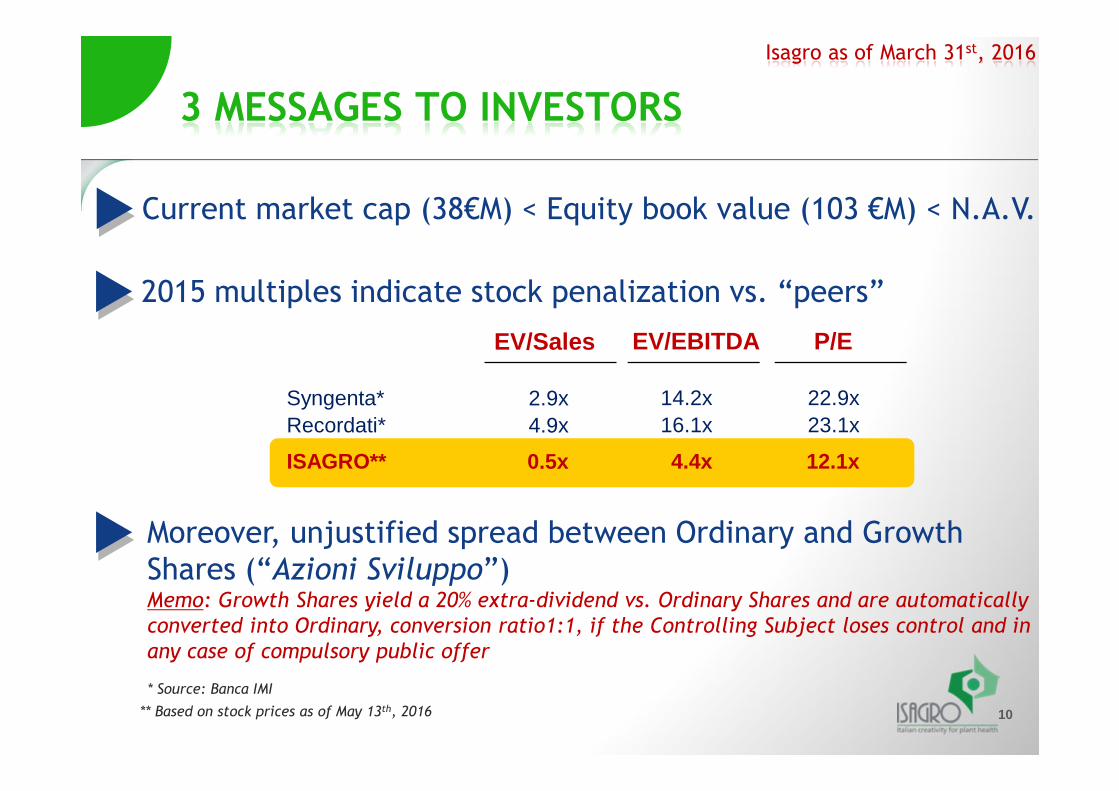
3 MESSAGES TO INVESTORS
Current market cap (38€M) < Equity book value (103 €M) < N.A.V.
2015 multiples indicate stock penalization vs. “peers”
Moreover, unjustified spread between Ordinary and Growth
Shares (“Azioni Sviluppo”)Memo: Growth Shares yield a 20% extra-dividend vs. Ordinary Shares and are automatically
converted into Ordinary, conversion ratio1:1, if the Controlling Subject loses control and in
any case of compulsory public offer
EV/Sales
Syngenta* 2.9x
EV/EBITDA
14.2x
P/E
22.9xRecordati* 4.9x 16.1x 23.1x
ISAGRO** 0.5x 4.4x 12.1x
** Based on stock prices as of May 13th, 2016
Isagro as of March 31st, 2016
* Source: Banca IMI

11
2BACK-UP
1
ISAGRO AS OF MARCH 31st, 2016Agenda
FACTS & FIGURES
RESULTS AS OF MARCH 31st, 2016
MAIN EVENTS
ISAGRO IN THE STOCK MARKET

Italy33%
Rest of Europe
35%Americas
11%
Asia18%
RoW3%
Italy27%
Rest of Europe
40%Americas
11%
Asia19%
RoW3%
12
CONSOLIDATED REVENUES
Proprietaryagropharma
Third parties’ agropharma
Services
Total Revenues = 52 €M
REVENUES BREAKDOWN BY PRODUCT CATEGORY
REVENUES BREAKDOWN
BY REGION
2
5 452
5 38
Agropharma: 50
Agropharma: 43
1Q
2016
1Q
2015
(AGROPHARMA ONLY)
(+16%)
Total Revenues = 45 €M
(+16%)
43
50
-4%
+34%
+20%
+16%
-12%
€ million
Isagro as of March 31st, 2016
13
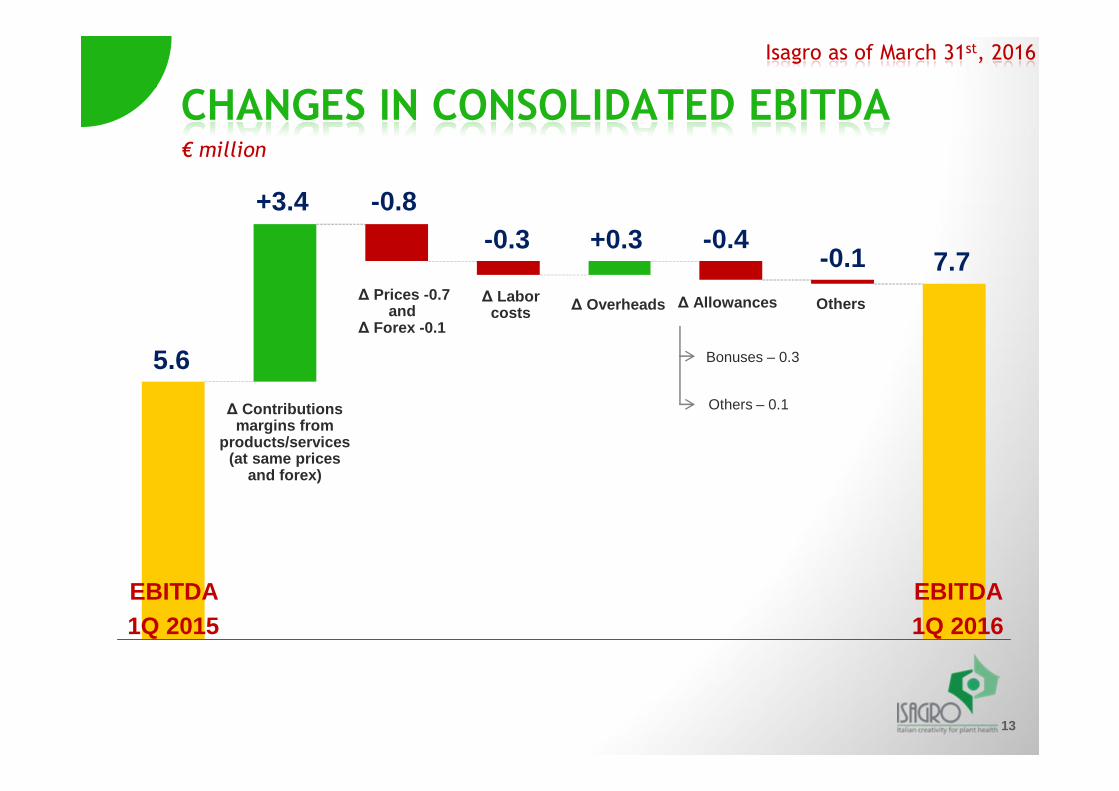
CHANGES IN CONSOLIDATED EBITDA€ million
EBITDA 1Q 2016
EBITDA 1Q 2015
+3.4
5.6
-0.8-0.3 +0.3 -0.4
-0.1 7.7
Δ Contributions margins from
products/services(at same prices
and forex)
Δ Prices -0.7and
Δ Forex -0.1
Δ Labor costs Δ Overheads Δ Allowances Others
Bonuses – 0.3
Others – 0.1
Isagro as of March 31st, 2016

14
CONSOLIDATED P&L
1Q 2016
1Q 2015 Variances
REVENUES
EBIT
Gain/(loss) from hedging on copper and EUR/USD
Financial items
Depreciation & amortization
RESULT BEFORE TAXES
44.7
3.5
(1.8)
(0.3)
(2.1)
1.4
51.9
5.5
1.1
0.0
(2.2)
6.7
+7.2
+2.0
-0.1
+5.3
+16%
+56%
n/s
Current and deferred taxes (0.6)(2.5) -1.9
EBITDA 5.67.7 +2.1 +38%% ON REVENUES 12.6%14.9%
+0.3
+2.9
€ million
NET RESULT 0.84.2 +3.4 n/s
Isagro as of March 31st, 2016
15
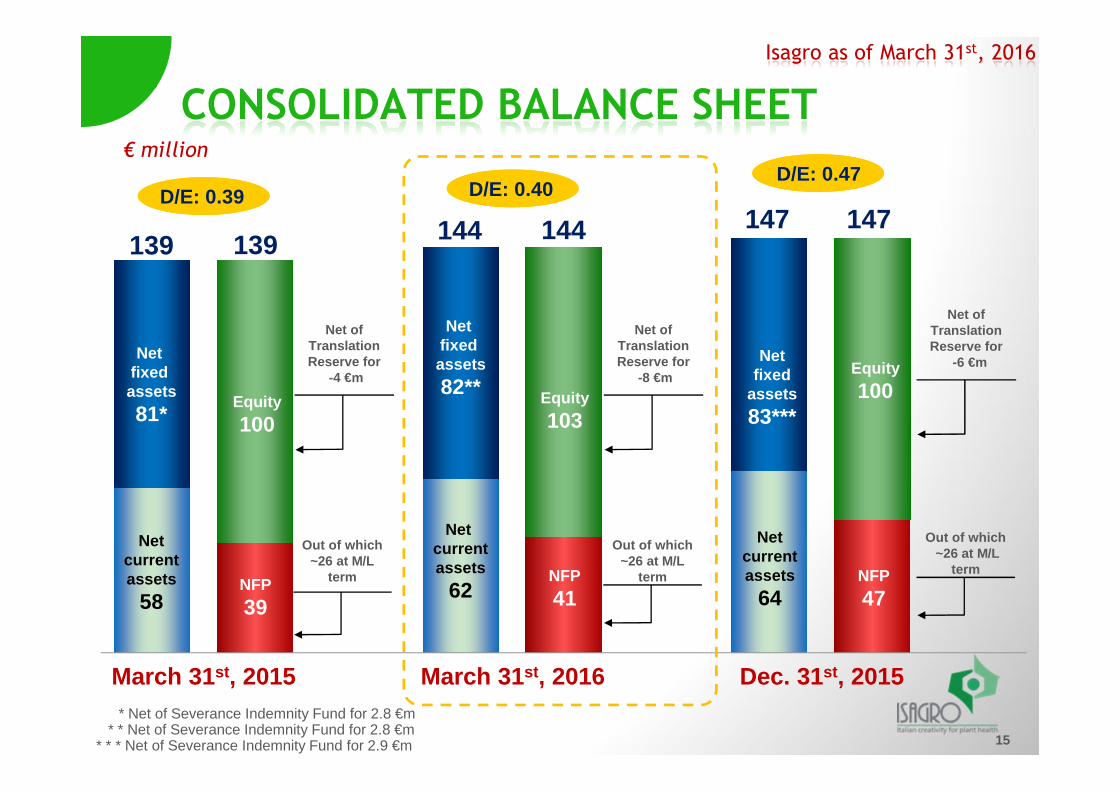
CONSOLIDATED BALANCE SHEET
D/E: 0.47
March 31 st, 2015
139147 147
€ million
March 31 st, 2016
139
* Net of Severance Indemnity Fund for 2.8 €m* * Net of Severance Indemnity Fund for 2.8 €m
Net of TranslationReserve for
-6 €m
Net of TranslationReserve for
-8 €m
Net of TranslationReserve for
-4 €m
Net fixed assets
81*
Netcurrentassets
58
Net fixed assets
82**
Net currentassets
62
Netfixed
assets
83***
Netcurrentassets
64
Equity
100
NFP
39
Out of which~26 at M/L
term
Out of which~26 at M/L
term
Out of which~26 at M/L
term
Equity
103
NFP
41
Equity
100
NFP
47
Dec. 31st, 2015
144 144
* * * Net of Severance Indemnity Fund for 2.9 €m
D/E: 0.40
Isagro as of March 31st, 2016
D/E: 0.39

16
P&L OF OPERATING COMPANIES
IsagroAsia
(at 100%)
10.9
2.2
1.5
9.7
IsagroUSA
(at 100%)
2.5
(0.5)
(0.7)
1.0
REVENUES
EBITDA
NET RESULT
Memo: 1Q 2015
Isagro S.p.A.
(holding Co.)
38.7
5.4
3.0
33.7
1.7 (0.5)Memo: 1Q 2015 3.6
0.8
IsagroEspaña
(at 100%)
4.3
0.7
0.5
4.0
0.6
0.4 (0.2)Memo: 1Q 2015 (0.3)
51.9
7.7
4.2
44.7
5.6
0.8
IsagroColombia(at 100%)
1.0
0.1
0.1
1.0
0.2
0.1
€ million
Isagro as of March 31st, 2016
ISAGROGROUP
(consolidated)
17
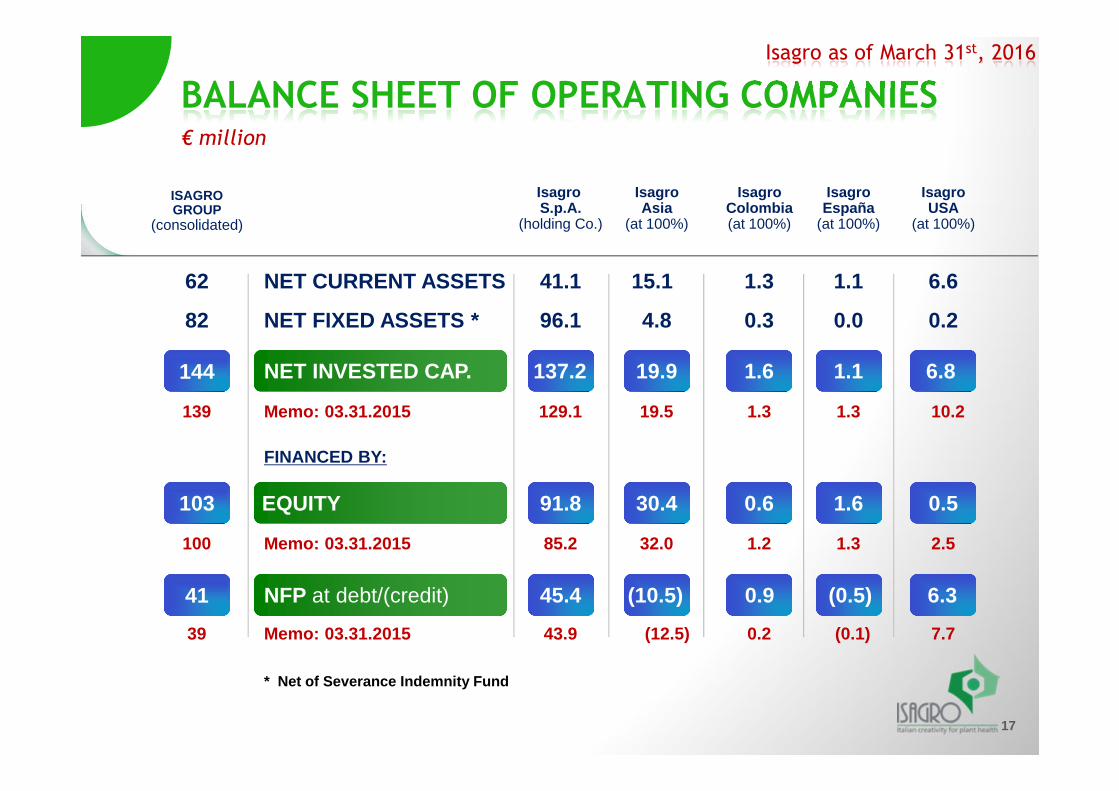
BALANCE SHEET OF OPERATING COMPANIES
NET INVESTED CAP. 19.9 1.11.6137.2
NET CURRENT ASSETS 15.1 1.11.341.1
144
62
IsagroAsia
(at 100%)
IsagroEspaña
(at 100%)
IsagroColombia(at 100%)
Isagro S.p.A.
(holding Co.)
NFP at debt/(credit) (10.5)
(12.5)
(0.5)
(0.1)
0.9
0.2
45.4
43.9Memo: 03.31.2015
41
39
FINANCED BY:
EQUITY 30.4
32.0
1.6
1.3
0.6
1.2
91.8
85.2Memo: 03.31.2015
103
100
NET FIXED ASSETS * 4.8 0.00.396.182
19.5 1.31.3129.1Memo: 03.31.2015139
6.8
6.6
IsagroUSA
(at 100%)
6.3
7.7
0.5
2.5
0.2
10.2
€ million
Isagro as of March 31st, 2016
ISAGROGROUP
(consolidated)
* Net of Severance Indemnity Fund

18
2BACK-UP
1FACTS & FIGURES
MAIN EVENTS
ISAGRO IN THE STOCK MARKET
RESULTS AS OF MARCH 31st, 2016
ISAGRO AS OF MARCH 31st, 2016Agenda

19
MAIN EVENTS
No significant event occurred
Main events of 1Q 2016
Approval of 2015 Financial Statements by the Assembly, with
dividend payment resolution (0.025 Euro and 0.030 Euro for
respectively each Ordinary Share and each Growth Share)
Subsequent events
Appointment of new Independent Director
Appointment of new Board of Statutory Auditors
Isagro as of March 31st, 2016

20
2BACK-UP
1FACTS & FIGURES
MAIN EVENTS
ISAGRO IN THE STOCK MARKET
RESULTS AS OF MARCH 31st, 2016
ISAGRO AS OF MARCH 31st, 2016Agenda

Min. spread14%
21
UNJUSTIFIED SPREAD BETWEENORDINARY AND GROWTH SHARES
1.05
0.87
Max. spread35%
1.79
1.28Spread
as of 05/13/1618%
Ordinary Shares
Growth Shares*
In the last 12-month period: ~8.4 million Ordinary Shares and ~5.0 million Growth Shares traded(versus floating ~11.4 million Ordinary Shares and ~13.7 million Growth Shares)€
*Growth Shares are a new category of special shares, issuable by companies having a Controlling Subject, which against the absence of voting right:• grant an extra-dividend vs. Ordinary Shares (20% in the case of Isagro);• are automatically converted into Ordinary shares , conversion ratio 1:1 , if the controlling Subject loses
control and/or in any case of Compulsory Public Offer
Points
STAR index
Isagro as of March 31st, 2016
0
5000
10000
15000
20000
25000
30000
0,60
0,70
0,80
0,90
1,00
1,10
1,20
1,30
1,40
1,50
1,60
1,70
1,80
1,90
2,00

22
MARKET CAPITALIZATION LOWER THAN BOOK VALUE
MARKET CAP.
ORDINARY SHARES 1.05
Market Capitalization (Euro/million)
Price as of May 13th, 2016(Euro per share)
EQUITY BOOK VALUE 102,7*
GROWTH SHARES 0.87
*
38.1
25.8
12.3
Market capitalization < Book Value
Book value of net fixed assets significantly lower than realizable market value
Isagro as of March 31st, 2016
email: [email protected]
www.isagro.com
Ruggero Gambini
Chief Financial Officer
& IR Managertel. (+39) 02.40901.280
Erjola Alushaj
Financial Planner
& assistant to IRtel. (+39) 02.40901.340
For information:
23

«Disclaimer»
Estimates, considerations, statements and opinion, except for what referring toactual figures, are to be considered as data, estimates, considerations, statements and
opinion regarding future, and have been elaborated and stated on the basis ofavailable information and/or on the basis of those information considered the most
reliable and/or the most reasonable.
Such data, estimates, considerations, statements and opinion could prove to beincomplete and/or wrong and they incorporate elements of risk of uncertainty,
beyond the company control. For such reasons, actual results may prove to differversus data, estimates, considerations, statements and opinion contained in such
presentation.
Any reference to Isagro products is to be considered exclusively as general informationabout the group activity and is not to be intended, under any circumstances, as
invitation to employ or propose the employment of such products.Such data, estimates, considerations, statements and opinion are not to be considered
as a proposal of investment, under any circumstances, in Isagro’s shares.
24