isaster s impact: understanding and attributing...
TRANSCRIPT

- 237 -
DISASTER’S IMPACT: UNDERSTANDING AND ATTRIBUTING TRENDS AND
PROJECTIONS OF DAMAGE AND LOSSES. THE ECLAC PERSPECTIVE
Ricardo Zapata-Marti Focal Point for Disaster Evaluation
UNITED NATIONS – Economic Commission for Latin America and the Caribbean (ECLAC)
A re there lessons to be learned from the recent disasters at the global scale? Are the numbers of disasters increasing and is their impact more severe? Is there a difference to be established among hazard exposure and the resilience, fragility and brittleness of human-made vulnerabilities? How do countries and societies manage risk, transfer it or disperse it. ECLAC has observed an increase in disasters’ costs in recent
decades. Not only has the replacement value gone upwards, given the global increase in a number of inputs’ prices and materials.
1. Factors account for the increased costs of disasters in recent decades according to the research to ECLAC’s experience
On the basis or recent years’ analysis of disasters in Latin America and the Caribbean, particularly the 2004 and 2005 hurricane seasons (in the Caribbean and in Mexico and Central America) and ECLAC’s involvement in supporting the World Bank’s damage and needs assessment in the Indian Ocean countries after the tsunami, some trends are discernible in this increase that bear stressing:
a) Demographic growth and the increased localization of human settlements near coastlines and river basins.
b) Faster growth in the number of disasters associated with hydrometeorological phenomena rather than derived from volcanic or seismic activity (the 2004 Indian Ocean tsunami being a very severe and very long return period phenomenon).
c) Increased sophistication and cost of infrastructure in vulnerable areas without appropriate risk reduction measures (for example increased agricultural production in floodplains and slopes without appropriate risk reduction techniques).
d) Increase environmental degradation leading to increased exposure with insufficient defense mechanisms and natural environmental barriers to mitigate the impact of natural phenomena (hydro or geomorphologic).
e) Climate variability cycles, larger variations of climate variables (rainfall, seasonal extremes, etc.), and climate change measured in such variables as seawater temperature, rainfall, drought and air temperature means as well as wind speed of extreme events are associated with impacts on non-adapted infrastructures.
f) Development of new sectoral activities –such as tourism—that are located in highly exposed areas (particularly in beaches and coastlines of islands and territories prone to recurrent phenomena such as cyclones, hurricanes and tropical storms).
g) Increased value added of economic activities that do not incorporate risk reduction financing as part of their financial, social and environmental viability and sustainability analysis.
h) Differentiated social and economic impact in terms of asset losses, income and livelihoods in rural and urban areas, primary (agriculture, commodities, extraction industries such as mining, etc.), secondary (industrial production, industrial processing, manufacture, etc.) and tertiary (services, such as transport, communications and telecom., tourism, financial sector, commerce and trade, e-commerce and information technology), as well as income strata, age groups and gender.
i) In spite of higher insured claims, in developing countries insured damage and losses are still a small percentage of total impact.

- 238 -
j) Globalization of information and improved assessment techniques also explain a more visible quantified impact and the inclusion of such previously non considered costs such as environmental, gender and cultural damage and losses.
There is a growing literature that covers research on possible scenarios of climate change in the next 10 to 50 years, which would have severe consequences on human life and human activity.1 ECLAC has a cumulative experience in disaster’s impact assessment that started in Central America in the mid nineteen seventies. Given the nature of the developing countries of Central America and the Caribbean: the hazards faced, the high levels of vulnerability, the extreme exposure associated with both their geographic location and patterns of production and levels of development, major catastrophes overwhelm their capacity to respond. The fact that disasters surpass their response mechanisms is particularly acute not only in the emergency and immediate response phase but mostly in their resilience and need for external resources to undertake their reconstruction processes. This latter consideration led to the affected countries’ governments to request ECLAC –as an intergovernmental technical cooperation part of the United Nations—to assist them in assessing the damages, losses and needs generated by disasters in order to validate or support their request for international assistance. Since the first assessment in 1973 to the latter ones in 2005, ECLAC has developed a methodology to assess in a systematic way damages (as impacts on assets and capital) and losses (as impacts on flows in terms of income, expenditures and value added that reflects on economic variables) that has increasingly being recognised, now being a part of the PROVENTION and World Bank’s toolkit.
In response to several countries and institutions both in the Latin American, Caribbean and Southeast Asian regions, ECLAC carried out in 2004 and 2005 such assessments. In 2004, in association with other national, regional and international institutions, comprehensive assessments in six countries (Bahamas, Cayman Islands, Dominican Republic, Grenada and Jamaica). In 2005 participated –at the request of the World Bank—in the assessment of the Indian Ocean Tsunami, and with regional and international institutions in Central America and the Caribbean floods in Guyana and the impacts of hurricanes Emily, Stan and Wilma over a number of countries –namely Guatemala, El Salvador and Mexico. Additionally the ECLAC’s assessment methodology is becoming a tool to assess the impact of climate change and potential adaptation measures and policies. 2
The partial figure of damage and losses –in terms of assets lost, destroyed or harmed and of economic flows interrupted, increased or altered due to the damage—reaches an amount of more than US$ 6,000 million dollars. If the reported damage in Cuba (US$ 1,500 million) and in the state of Florida due to the four hurricanes is combined, the figure climbs to US$ 37,600 million.
In summary, the cases analyzed by ECLAC this year show that 76% of the total impact was constituted by actual physical damage to assets (houses, businesses, roads and bridges, utilities, schools, hospitals and clinics, etc.), which imply losses in terms of flows of more that US$ 1,454 million.
1 The author is one of numerous researchers involved in the fourth IPCC assessment. For a possible scenario of climate change see http://www.ems.org/climate/pentagon_climate_change.html. 2 These studies may be downloaded at: http://www.eclac.cl/mexico, under recent documents. They are the following:
Bahamas, “Hurricanes Frances and Jeanne in 2004: Their Impact in The Commonwealth of the Bahamas” (LC/MEX/L.642/Rev.2, LC/CAR/L.23/Rev.2), 8 December 2004
Cayman Islands, “The Impact of Hurricane Ivan in the Cayman Islands” (LC/MEX/L.645/Rev.1, LC/CAR/L.25/Rev.1) 8 December 2004 Dominican Republic, “Los efectos socioeconómicos del huracán Jeanne en la República Dominicana” (LC/MEX/L.638), 3 November 2004 Grenada : “Macro-Socio-Economic Assessment of the Damages Caused by Hurricane Ivan” (as part of a OECS led mission), September 7th, 2004
Haiti : « Le cyclone Jeanne en Haïti: dégâts et effets sur les Départements du Nord-Ouest et de l’Artibonite : approfondissement de la vulnérabilité » (LC/MEX/L648, LC/CAR/L27), March 2005
Jamaica: “Assessment of the socioeconomic and environmental impact of Hurricane Ivan on Jamaica” (LC/MEX/L.636, LC/CAR/L.22), 20 October 2004
- 239 -
By sector, most of the damage affected the social sectors (47.5%) and productive activities (both goods and services, 35.2%, namely tourism). Damage and losses to infrastructure and utilities such as electricity, water and sanitation, and transport represent 15.6%, and the direct environmental impact, since most of natural resources are expected to recuperate, is 1.3%. This, nevertheless, does not imply that environmental action in terms of clean up, restoration and preservation of habitats and better environmental management is of lesser importance. In reality the amount of accountable damage pointedly signals that environmental assets and their services do not receive adequate valuation. The impact in terms of GDP is quite severe in most cases: 212% in Grenada and 138% in the Cayman Islands.
If the impact suffered by other territories and countries not appraised such as the Netherlands Antilles, parts of Mexico or the State of Florida, is added, damage would certainly exceed the total figure indicated of US$ 37,600 million, once the impact in the overall economic performance of these economies is taken into account. As pointed out and is well known, in the more developed territories and countries insurance coverage and national response capabilities will compensate for the losses in the short to medium term but will, nevertheless, mark this season as one where the issue of sustainability of the present patterns of physical and spatial settlements will have to be reassessed in order to prepare these territories to move from prevention of unexpected events to adaptation to ever increasing damage if no appropriate measures are taken.
However, from a social point of view the most severe socioeconomic and human toll, was concentrated in the least developed, smaller countries affected, whose capability to rebuild and return to the path of growth and development is limited given the lack of appropriate insurance coverage, institutional response and preventive policies. This is particularly the case of Haiti and Grenada, but other economies with fragile environment and indebted or weakly performing economies were burdened by the severity of the events. In Grenada the total impact was estimated to be almost US$ 889 million, which is equivalent to more than twice (2.12 times) the current value of last year’s GDP.
An additional relevant conclusion is that even though most damage occurs in the private sector, it falls on Governments to take care of and assist those segments of the population with lower income, which are highly dependent on basic agricultural or fishing activities that are affected. Productive activities rank high in the amount of damage and losses and in some cases the ensuing losses (economic flows affected) will persist for a long period of time, in some instance years. Infrastructure vulnerability is enhanced by poor environmental management and environmental degradation, leading to high productive risks and huge human suffering.
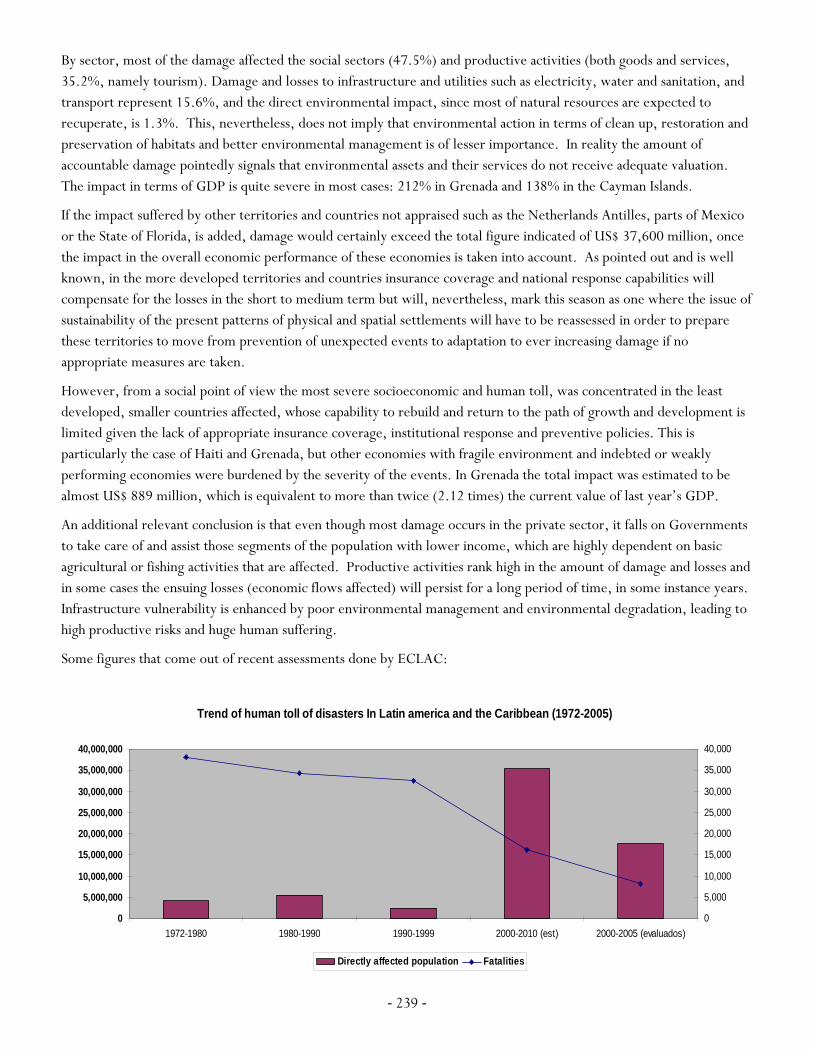
Some figures that come out of recent assessments done by ECLAC:
Trend of human toll of disasters In Latin america and the Caribbean (1972-2005)
0
5,000,000
10,000,000
15,000,000
20,000,000
25,000,000
30,000,000
35,000,000
40,000,000
1972-1980 1980-1990 1990-1999 2000-2010 (est) 2000-2005 (evaluados)0
5,000
10,000
15,000
20,000
25,000
30,000
35,000
40,000
Directly affected population Fatalities

- 240 -
HISTORIC EVOLUTION OF DISASTER DAMAGE IN LATIN AMERICA AND THE CARIBBEAN (1972-2004)(millions of current USD)
2,639.04
11,550.29
21,974.94
17,261.00
0.00
5,000.00
10,000.00
15,000.00
20,000.00
25,000.00
1972-1980 1980-1990 1990-1999 2000-2005
Latin America and the Caribbean: Trend in major disasters impact, constant 2004 value
(millions of dollars, events assessed by ECLAC)
78,085
101,251
31,367
50,050
0
20,000
40,000
60,000
80,000
100,000
120,000
1972-1980 1980-1990 1990-1999 2000-2010 (estimated)

- 241 -
The Caribbean 2004 hurricane season exemplifies different experiences in terms of damage, losses and response that are relevant to the sustainability and capacity to mitigate and adapt to extreme events, even more so than the tsunami.
IMPACT OF DISASTERS IN LATIN AMERICA AND THE CARIBBEAN – 1972-2005 (based on ECLAC assessments) PERIOD AFFECTED POPULATION TOTAL IMPACT (CONSTANT 2004 VALUE) Deaths D i r e c t l y
a f f e c t e d population
TOTAL DAMAGE (to assets)
LOSS ES (in flows)
External impact
1972-2005 115,176 35,463,890 232,259.40 150,335.00 80,424.30 77,221.00 YEARLY AVERAGE (on the basis of ECLAC assessed disasters in Latin America and the Caribbean)
3,490 1,074,663 7,038.20 4,555.60 2,437.10 2,340.00
Economic impact of 2004 Hurricane Season (based on assessments made by ECLAC)
Economic Impact,
Island / State
US$ million
Natural Event
Total of ECLAC assessed damage and losses
6,059 Ivan, Frances and Jeanne a/
Bahamas 551 Hurricanes Frances and Jeanne Cayman Islands 3,432 Hurricane Ivan Dominican Republic 296 Tropical Storm Jeanne Grenada 889 Hurricane Ivan Haiti 296 Hurricane JeannE Jamaica 595 Hurricane Ivan Florida 30,000 Jeanne, Charley and Frances Cuba 1,500 Hurricanes Ivan and Charley Total (including Cuba and Florida) 37,559
Source: ECLAC
2004 Atlantic Hurricanes: Relative and absolute impact 2004 Atlantic Hurricanes: Relative and absolute impact of damage and losses by affected country / stateof damage and losses by affected country / state
551 3,432 296 889 595296
183.00%
1.70%
8.00%
10.50%
212.00%
7.30%
0
500
1,000
1,500
2,000
2,500
3,000
3,500
4,000
HurricanesFrances
and Jeanne
HurricaneIvan
TropicalStorm
Jeanne
HurricaneIvan
HurricaneJeanne
HurricaneIvan
Bahamas CaymanIslands
DominicanRepublic
Grenada Haiti Jamaica
US $
mill
ions
1.00%
10.00%
100.00%
1000.00%
Economic Impact, US$ million Impact as % of GDP

- 242 -
The 2004 and 2005 hurricane season further show that built vulnerability is not necessarily development related but more closely associated with inappropriate risk appropriation and valuation and with costlier infrastructure, more value added related infrastructure and negative externalities being not assumed by the industrial and commercial sectors. Additionally it shows that the government’s assessment of risk and their preparedness to face its consequences and reduce risk is also not necessarily related to levels of industrialization.
Just as accountability in public spending is linked to transparency, risk transfer must be linked to risk appropriation. It is still dramatically true that risk transfer tends to be made on false premises: instead of having a larger number of financial instruments of risk transfer, society tends to transfer its losses and disaster related damage to the state.
Some comments are also possible in the context of the type of disasters that are being faced and the type of damage they cause.
Geomorphologic events (seismic, volcanic, etc.) or non climate related have larger damage than losses –affect more severely infrastructure but cause relatively less losses than climatic ones. Nevertheless the number and impact of meteorological or climate related ones –including drought—seems to be growing, according to recently assessed disasters. The table summarizes the composition of disasters assessed by ECLAC over the years.
2005 Atlantic Hurricane season Deaths Directly affected
population
Total impact (millions of
USD)
Damage (to assets)
Losses (in flows)
Date Location Type of event Population Total impact (millions of USD) January Guyana Flood due to intense
rainfall in Decem-ber/January period in coastal floodplains in
Georgetown and Albion
34.0 274,774.0 465.1 418.3 46.8
October Guatemala Torrential rains, tropical storm Stan
1,583.0 474,821.0 988.3 421.1 567.2
October El Salvador Torrential rains, tropical storm Stan, and Ilamate-pec (Santa Ana) volcano
eruption
69.0 72,141.0 355.7 196.2 159.5
July-September United States b/
Dennis, Katrina, Rita 1,698.0 900,000.0 200,000.0 65,000.0 135,000.0
July-September Mexico b/ Emily, Stan, Wilma, etc. 98.0 2,942,119.0 4,642.0 2,098.0 2,543.0
Emily 4.0 63,300.0 413.2 322.8 90.4 August Cuba b/ Dennis 16.0 2,500,000.0 1,400.0 950.0 450.0
Other events a/ 1,134.0 3,474,389.0 150.0 100.0 50.0
TOTAL Assessed by ECLAC 1,690.0 885,036.0 2,222.0 1,358.0 864.0 TOTAL (not including United States) 2,938.0 9,801,544.
0 8,414.3 4,506.4 3,906.9
TOTAL (IN CLUDING UNITED STATES) 4,636.0 10,701,544.0 208,414.3 69,506.4 138,906.9

- 243 -
Trends of disaster’s recurrence and impact and their implication for the economic dynamism of a country and its development path are illustrated in recent cases such as El Salvador and others. The following graphs correlate disasters relative damage and its implication for development over time.
DIFFERENT IMPACTS OF DIFFERENT EVENTS (as observed in ECLAC assessments, 1972-2005) AFFECTED POPULATION
TOTAL IMPACT (constant 2004 prices)
DAMAGE LOSSES
Deaths Directly affected population
TOTAL
(to assets) (in flows)
External sector impact
METEOROLOGICAL (CLIMATIC) EVENTS
50,424 24,945,145 118,926 73,382 43,304 35,600
GEOMORPHOLOGICAL (SISMIC, VOLCANIC) EVENTS
64,752 10,518,745 113,334 76,953 37,120 41,621
Droughts 35 2,200,000 10,599 5,888 4,712 3,141 TOTAL ASSESSED EVENTS 115,176 35,463,890 232,259.40 150,335.00 80,424.30 77,221.00 Meteorological as % of total 44% 70% 51% 49% 54% 46% Droughts as % of total 0.07% 8.82% 8.91% 8.02% 10.88% 8.82% Damage composition
Total 64.70% 34.60% 33.20% Meteorological or climatic 61.70% 36.40% 29.90% Non-climatic 67.90% 32.80% 36.70% Droughts 55.50% 44.50% 29.60%
CUMULATIVE IMPACT of successive disasters on CUMULATIVE IMPACT of successive disasters on gross capital formationgross capital formation
**** **
**TIMETIME
GROSS
CAPI
TAL
FORM
ATI
ON
GROSS
CAPI
TAL
FORM
ATI
ON
ACTUAL CAPITAL FORMATIONACTUAL CAPITAL FORMATIONPOTENTIAL GROWTH PATHPOTENTIAL GROWTH PATH** DISASTERDISASTER

- 244 -
The effect, of a cumulative nature, that disasters have distorts, transforms and changes the development pattern of a society. If natural, human, physical and political factors are considered, their evolution will be affected by disasters in such a way that is not appropriate to consider such events as merely external shocks: they become –due to their recurrence and lingering effects—an intrinsic element of the process that has to be tackled. That is to say that in
Disasters Impact on El Salvador´s GDP
0.0
0.5
1.0
1.5
2.0
2.5
3.0
3.5
4.0
4.5
5.0
1996 1997 1998 1999 2000 2001 2002 2003 2004 2005
Growth without disastersGrowth with Mitch, earthquakes, drought and hurricane Stan
MITCH
EARTHQUAKE
DROUGHT
STANSTAN
Impact of disasters on GDP: State of Impact of disasters on GDP: State of Gujarat, IndiaGujarat, India
-5
0
5
10
15
20
25
1993-94 1994-95 1995-96 1996-97 1997-98 1998-99 1999-00 2000-01 2001-02 2002-03
SGDP with disasters Potential growth without disastrsLogarítmica (Potential growth without disastrs) Logarítmica (SGDP with disasters)
Gujarat (INDIA): Total Damage from disasters and Calamity fund budgeted resources (Crores of Rupees)
0.00
500.00
1000.00
1500.00
2000.00
2500.00
3000.00
3500.00
90-91 91-92 92-93 1993-94
1994-95
1995-96
97-98 1998 1999 99-2000
2000-01
2001-02
2002-03
2004 2005
Total Damage (Crores)Calamity Relief Fund (from Finance Commision, Delhi)Amount spent on calamity relief and rehabilitation buy State Govt.

- 245 -
modeling a disaster´s impact, as could be done by the use of econometric models be they general or of partial equilibrium, the disaster becomes over time an endogenous variable.
Post-disaster needs must be seen in a wider context: extreme events may be drivers for change. In brief the experience of re-insurers is a good example of financial adaptation to change. It seems a lot more difficult to promote the social adaptation to changing vulnerabilities and exposure. In that sense both the Asian tsunami and the “Katrina effect” seem relevant: extreme events for which society had not adapted. In the first instance due.
Risk transfer becomes a crucial element in disaster reduction. Traditionally it has been made in what may be categorized as a spurious way, by not internalizing risk as part of the viability (economic, financial, social, environmental) and having private investment externalize risk to society at large, placing demands on government. Similarly, countries, particularly developing countries with high vulnerability and insufficient resources to sustain their development process,
HUMANHUMAN
--HealthHealth
--EducationEducation
NATURALNATURAL
--Clean waterClean water
--Clean airClean air
--Biodiversity and Biodiversity and ecosystem ecosystem (microclimate)(microclimate)
FINANCIALFINANCIAL
--Access to creditAccess to credit
--Land tenure and ownershipLand tenure and ownership
PHYSICALPHYSICAL
--Type and quality of Type and quality of settlement and settlement and housinghousing
SOCIALSOCIAL
--Social networks (security and Social networks (security and solidarity)solidarity)
--Family ties and extended familyFamily ties and extended family
--Violence and securityViolence and security
1
10
100HUMAN
SOCIAL
NATURALFINANCIAL
PHYSICAL
Past Current Mid-term Long term

- 246 -
transfer risk to the international community. Thus the balance of resources from the international community and governments concentrates heavily in response and reconstruction investment, rather than on risk reduction, prevention, mitigation and adaptation. On the other hand, the “virtuous” alternatives to risk transfer imply recognizing risk and accepting responsibility in facing it, at both the individual and institutional levels. Thus disaster reduction requires, first, appropriation and responsibility which come from appropriate regulatory and institutional frameworks and, second, economic and financial instruments that provide leverage to attain the risk reduction goals. Such instruments are relevant as part of macroeconomic policies of compensation and development. In a concrete sense, appropriate investment in risk management and transfer will generate pre-disaster leverage and reduce damage (in a manner similar to anti-cyclical policies such as price compensation funds for commodities). But that is only part of the risk management equation. The other is more at the microlevel, focusing on having investors internalize risk (invest in its reduction on the basis of the profitability of not losing such investment in the face of disasters) instead of externalizing it to the rest of society. Also at the micro level, governments – as part of appropriate social policy – should generate resources and community based resilience. It seems fair to say that state-assisted responsibility and solidarity are needed instead of irresponsible charitable and paternalistic responses. The use of community-based institutions and instruments such as microcredit associations, self-help groups, community women groups has been successful in some instances, namely in some countries in Asia and is worth pursuing.
2. Some implications of these understandings, for both research and policy
Recent ECLACs experience points out to information requirements and technical and analytical gaps that require further research and attention. On the basis of this observation, some of the most pressing research priorities are listed.
b) Risk appropriation and risk transfer,
c) The state’s responsibility vs. the individual and social responsibility to reduce risk.
d) Better assessment of risk as the complex result of hazards, recurrence, vulnerability and exposure.
e) The correlation of built risk with demographic, economic and social variables.
f) Moral hazard assumed by states and inappropriate protection.
g) Development goals, such as poverty reduction or the United Nations Millenium
h) Development Goals or the World Bank’s Poverty Reduction initatives and the negative impact that disasters have on them. While it is still true that the composition of damage shows that in developing countries human costs are higher than economic ones, it is also true that development related investment is lost at higher rates and in relative terms economic losses are also higher in those countries. That is to say that even though in absolute terms economic losses are larger in industrialized countries, once they are measured relatively to GDP or the overall economic assets of countries, it is the developing ones that suffer most while they are also the leas covered by insurance, contingency funds or other such risk bearing and risk transfer instruments.
Recent literature and studies produced by ECLAC
The list includes not only recently completed studies but new or forthcoming work.
− ECLAC updated (2003/4 Handbook, http://www.eclac.cl/mexico)
− Valuation of cultural assets (K. Vespars, ECLAC, draft, 2005)
− The 2004 hurricanes in the Caribbean and the Tsunami in the Indian Ocean. Lessons and policy challenges for development and disaster reduction (Ricardo Zapata Martí, LC/MEX/L.672, August 2005, Estudios y perspectivas series No. 35
− Economic impact of the 26 December 2004 Indian Ocean disaster (Asian Disaster Preparedness Center (ADPC),

- 247 -
prepared by Roberto Jovel, 2005, non-published)
− Efectos en Guatemala de las lluvias torrenciales y la tormenta tropical Stan, octubre del 2005 y Perfiles de proyecto, LC/MEX/R.895, Noviembre de 2005
− Efectos en El Salvador de las lluvias torrenciales, tormenta tropical Stan y erupción del volcán Ilamatepec (Santa Ana) octubre del 2005 y Perfiles de proyecto. LC/MEX/R.892, November 2005
− Características e impacto socioeconómico del huracán "Emily" en Quintana Roo, Yucatán, Tamaulipas y Nuevo León en Julio de 2005, LC/MEX/L.693, December 2005
− See also 2004 Assessments in the Caribbean (Grenada, Bahamas, Cayman, Dominican Republic, Gonaives/Haiti, Jamaica and in Guyana (both 2005 and 2006) (http://www.eclac.cl/mexico)
− Drought in Belize in 2004-2005an assessment of its economic impact, A report prepared by International Consultant Roberto Jovel, for use in a training seminar on the assessment of disaster impact, held in Belmopan, January 2006.
− Natural Disaster Assessments case studies in Southeast Asia, presented to the REGIONAL WORKSHOP ON METHODOLOGIES TO ASSESS SOCIO-ECONOMIC IMPACTS OF NATURAL DISASTERS, 19 - 21 October 2005
− United Nations Conference Centre, Bangkok, undertaken under an ESCAP/BCPR/ECLAC project.
− Methodological proposal of country studies for IDB project on indicators of disaster management and ris indicators, and First reports on national case studies on disaster’s impact and risk management infrastructure for Mexico, Chile, Colombia, Nicaragua and Jamaica (http://www3.cepal.org.mx/iadb-eclac-project)

- 248 -
Annex. A brief description of the Socio-Economic and Environmental Assessment Methodology
What is the methodology?
The socioeconomic and environmental impact evaluation methodology has been developed in Latin America by ECLAC3 since the mid 1970s (the first requirement made by a government to have an assessment was the case of the 1972 earthquake in Managua, Nicaragua.
The main concepts used in a systemic sectoral approach are of a stock flow analysis. This entails first assessing the damage (partial or total) in assets, i.e. quantifying firstly the physical damage as miles or km. of road, miles or meters of bridges, number, type and size of buildings (i.e. houses, schools, hospitals, factories, warehouses, churches, museums, etc.); machinery,
stocks of production, land for agricultural use, forest and natural reserves, beaches and ecological systems such as coral reefs; number of classrooms, hospital beds, etc. The valuation of these may be calculated in terms of present actuarial or book value (for insurance purposes, for example); at replacement value (current market value of construction of similar structures), real estate value, proxy prices in the case of environmental assets in terms of services rendered by asset damaged or lost. Valuation may also be attempted in terms of reconstruction that introduces hazard mitigation, vulnerability reduction or risk management measures.
Once damage and its value are established, the economic consequences of that damage are assessed in terms of flows affected, sector by sector. These refer to the current value of production lost, reduced or deferred; additional production, distribution and marketing of production, trade in goods and services, increased government expenditures, and public service utilities (either provided privately or by the state); and reduced income both at the personal and entrepreneurial level as well as in terms of public finances. Reduced income to the state will be associated with reduced economic activities, special tax holidays given due to the disaster which can be of a general nature (reduction or elimination of import duties for example) or location specific to favour the disaster area. Other potential flow impacts could occur in the external sector, such a reduced exports or increased imports, and on the financial side, transfers received (be it private as remittances from nationals abroad or public as charitable contributions), new donations and grants as well as reconstruction credits. On the plus side also should be considered insurance and reinsurance payments from overseas. The sum of damage and losses, sector by sector, constitute the total impact of a disaster.
ECLAC/CEPAL R. Zapata 8
• Social Sectors– Housing– Health– Education, culture,
sports• Infrastructure
– Transport and communications
– Energy– Water and sewerage
• Productive sectors – Goods: agriculture, industry– Services: commerce, tourism,
etc.
• Global impact– On the environment– Gender perspective– Employment and social
conditions– Macroeconomic
assessment
SECTOR BY SECTOR VALUATION METHODOLOGY
3 See http://www.eclac./mexico, under “desastres”. Handbook for the evaluation of the socioeconomic and environmental impact of disasters (LC/MEX/G.5, July 2003) available at the following web pages: http://www.eclac.cl/mexico, (“desastres”), http://www.worldbank.org/hazards/knowledge/other_res.htm, and http://www.proventionconsortium.org/toolkit.htm.
Damage (direct impact) refers to the impact on assets, stock, and property, valued at agreed replacement (as opposed to reconstruction) unit prices. The assessment should consider the level of damage, i.e., whether an asset can be rehabilitated/repaired, or has completely destroyed. Losses (indirect impact) refer to flows that will be affected, such as reduced income, increased expenditure, etc. over the time period until the assets are recovered. These will be quantified at present value of such flows.
ECLAC/CEPAL R. Zapata 6
Main ConceptsMain ConceptsDamage (Stocks)Damage (Stocks)•• Impact on assetsImpact on assets
–– InfrastructureInfrastructure–– CapitalCapital–– StocksStocks
•• Occur immediately Occur immediately during or after the during or after the phenomenon that phenomenon that caused the disastercaused the disaster
Losses (Flows)Losses (Flows)•• Effects on flowsEffects on flows
–– ProductionProduction–– Reduced income and Reduced income and
increased expensesincreased expenses•• Are perceived after the Are perceived after the
phenomenon, for a timephenomenon, for a time--period that can last from period that can last from weeks to months, till weeks to months, till recuperation occursrecuperation occurs

- 249 -
These impacts, assessed sector by sector, as flows variations resulting from the disaster, are then used–in their value added component—to estimate the macroeconomic impact of the disaster. The purpose of such an exercise is to establish the gap –or delta— that the economy as a whole and its components will experience. In fact three alternate situations are analyzed: the pre-disaster situation and trend (baseline situation), the non-disaster expected performance, and the post-disaster impact. This impact, in its entirety, without any potential reconstruction or response, constitutes the base scenario. To consider the reconstruction needs (as distinct and different from damage and losses) several possible scenarios may be considered on the basis of the system’s absorptive capacity, that is, the resources available for reconstruction (from insurance and reinsurance, contingency or emergency funds, or credit available). Alternatively the base scenario serves to establish the financial gap to be filled, considering the reconstruction strategy (and its cost) that is put forward by the relevant stakeholders.
What is the use or purpose of the evaluation?
The general purpose of the evaluations is to provide a preliminary assessment of the damage and losses after a disaster in order to identify immediate recovery and longer-term reconstruction needs, and to determine the economic and financial implications of the event. The assessment’s conceptual basis is a stock/flow analysis that evaluates effects (i) on physical assets that will have to be repaired, restored, replaced or discounted in the future and (ii) on flows that that will not be produced until certain assets are repaired or rebuilt.
The end product will be a consolidated summary of damage and losses that provide the extent and breadth of a disaster’s impact, in quantitative, sector by sector, geographically specific terms that are stratified by affected groups, stemming from information compiled immediately after the event. It should not be considered a definitive assessment, but rather a preliminary understanding, compiled in a timely manner, to inform urgent recovery efforts. This quantification offers two further results: a determination of the relative size of impacts on relevant economic variables (by use of macroeconomic analysis and scenario modelling under different assumptions for the reconstruction potential and needs); and an analysis of the resource gap that these reconstruction scenarios pose to the government and to the affected population.
Use of Assessment Report
The evaluation’s most important function is to provide decision-makers and stakeholders with a quantitative basis to request recovery funding assistance, and to design a reconstruction strategy. The quantification, given its sector by sector nature, allows for concrete, specific proposals for action in sector or geographic terms. It is a tool for determining priorities (importance vs. urgency) and sequencing (timeline for reconstruction process), i.e. to restore livelihood through income and employment while physical reconstruction of housing, production, and infrastructure proceed.
How to proceed: when and how the methodology is applied
Past experience indicates several needs. First, a team must be established to collect, organize, and analyze the necessary sector by sector information, from profiling existing baseline to superimposing damage and losses with a unified and comparable approach. The team should be multidisciplinary and inter-institutional, with clearly designated focal points to compile and present the data in a comparable manner –so that they can be summarized and factored into a macroeconomic scenario exercise. Each focal point should have common terms of reference. The global analysts (e.g.

- 250 -
macroeconomists, environmental economists, gender experts) will proceed to use the emerging data of damage and losses to: contrast the disaster scenarios to the non-disaster trend; make environmentally related damage and losses visible; and differentiate men and women’s impact and roles in the post-disaster process.
Second, a deadline must be established to submit the final report deadlines for submission of sector data (quantification in standardized format with agreed common criteria) and accompanying descriptive text must be set depending on the final deadline. The description will include not only narratives of the event’s impact on the sector but also the criteria and assumptions made to establish damage and loss figures.
Third, a deadline must be set for completion of a global analysis, and this deadline must be discussed and made compatible with a strategic reconstruction proposal. Caveats as to accuracy of available data, methodological considerations and assumptions made must be specifically addressed. The timing for the assessment should be such that, without losing its timeliness, it does not interfere with the ongoing emergency, particularly the search and rescue, although thinking of the future in terms of the needs for the reconstruction process is an immediate task to be pursued since some actions are required to be undertaken promptly, especially those related to providing housing solutions, health and education services, and recovery strategy. Additionally, discussion of the future serves as a therapeutic measure to overcome trauma. The main concern is that it does not interfere with immediate life-saving activities and emergency relief operations.
Each sector team should consult and exchange information with each other to avoid duplication, share data of common interest or of interest in more than one sector, and identify information gaps or lack of information. The sector specialist will not only gather information on baselines and the disaster’s impact on them (i.e. damage and losses), but on reconstruction needs in the form of sectoral strategic responses. These can be used as input to develop an overall reconstruction strategy and possibly project proposals.
The strategic proposal will include a framework for action, based on pre-existing policies or development strategies, focusing on adaptation of the latter to the needs for the reconstruction, prioritize and sequence the process, define resource gaps to be filled from government, private and external sources, and profile execution processes in which affected populations and other stakeholders can play key roles in reconstruction.