iscal consolidation in europe a … cocops deliverable 7.2 introduction this trend report is a...
TRANSCRIPT

Coordinating for Cohesion in the Public Sector of the Future – www.cocops.eu
FISCAL CONSOLIDATION IN EUROPE: A COMPARATIVE ANALYSIS
COCOPS Trend Report
Walter Kickert
Tiina Randma-Liiv
Riin Savi

1 COCOPS Deliverable 7.2
© COCOPS 2013
About COCOPS
The COCOPS project (Coordinating for Cohesion in the Public Sector of the Future, see
www.cocops.eu) seeks to comparatively and quantitatively assess the impact of New Public
Management-style reforms in European countries, drawing on a team of European public
administration scholars from 11 universities in 10 countries. It will analyse the impact of
reforms in public management and public services that address citizens’ service needs and
social cohesion in Europe. It is funded under the European Union’s 7th
Framework Program as
a Small or Medium-Scale Focused Research Project (2011-2014).
About the authors
Walter Kickert is a Professor of Public Management at the Department of Public
Administration at Erasmus University Rotterdam.
Tiina Randma-Liiv is a Professor and Chair of Public Policy and Management at the Ragnar
Nurkse School of Innovation and Governance at Tallinn University of Technology.
Riin Savi is a Junior Research Fellow at the Ragnar Nurkse School of Innovation and
Governance at Tallinn University of Technology.
The research leading to these results has received funding from the European Union’s Seventh
Framework Program under grant agreement No. 266887 (Project COCOPS), Socio-economic
Sciences & Humanities.
2 COCOPS Deliverable 7.2
Contents
INTRODUCTION ...................................................................................................................... 3
PART ONE. ANALYTICAL FRAMEWORK .......................................................................... 6
1. Fiscal crisis and consolidation ................................................................................................ 6
1.1. Fiscal consolidation: Contents of measures .................................................................. 7
1.2. Fiscal consolidation. Decision-making ....................................................................... 10
2. Explanatory factors ............................................................................................................... 12
3. Effects on public administration and management ............................................................... 13
4. Methodology ......................................................................................................................... 16
PART TWO. APPLICATION OF THE ANALYTICAL FRAMEWORK TO COUNTRY
STUDIES .................................................................................................................................. 20
5. Fiscal consolidation. Contents of measures .......................................................................... 20
5.1. Consolidation measures ..................................................................................................... 20
5.2. Cutbacks in public administration ..................................................................................... 23
6. Cutback decision-making...................................................................................................... 31
6.1. Characteristics of decision-making ............................................................................. 31
6.2. Targeted versus across-the-board cuts ............................................................................... 35
6.3. Stages of cutback decision-making............................................................................. 36
7. Explanatory Factors .............................................................................................................. 40
7.1 Financial-economic factors .......................................................................................... 40
7.2. Political-administrative factors ................................................................................... 44
7.3. External influences ..................................................................................................... 48
8. Effects of fiscal consolidation on public administration ....................................................... 49
8.1. Administrative reforms ............................................................................................... 49
8.2. Changes in public management .................................................................................. 54
CONCLUSIONS....................................................................................................................... 60
References .......................................................................................................................... 67
Appendix 1. Research plan for the COCOPS Work Package 7 ................................................ 71
Appendix 2. Economic indicators 2007-2012………………...0……………………………..79

3 COCOPS Deliverable 7.2
INTRODUCTION
This trend report is a delivery of Work Package no. 7, The Global Financial Crisis in the
Public Sector as an Emerging Coordination Challenge of the EU Seventh Framework project
Coordinating for Cohesion in the Public Sector of the Future (COCOPS). The main purpose
of the trend report is to provide an international comparative analysis of how a variety of
European countries have dealt with the financial-economic crisis during 2008-2012.
The main question addressed in this study is how governments have responded to the global
crisis which started in 2008. The global financial, economic and fiscal crisis is undoubtedly
the most important and urgent problem that Western countries face today, and it will continue
to be a challenging issue for several years to come. Our main research interest is therefore to
investigate 1) how different countries have responded to the crisis, and 2) to find out what
impact the global crisis has on public administration. This means that the current study treats
the fiscal crisis as an independent variable explaining the possible changes in systems of
public administration. The focus is not on explaining the crisis per se but on providing insights
about the effects that the crisis has brought along.
The previous worldwide economic and fiscal crises in the 1970s led to major public
management reforms in many Western states. To put it very simply, the oil crisis of the 1970s
unleashed an economic crisis that led to economic recovery measures of governments. The
latter triggered large public budget deficits to which the governments subsequently responded
with drastic budget cutbacks, which also included efficiency measures in the form of public
management reforms (see numerous studies on “the politics of retrenchment”, “managing the
fiscal crisis” and “cutback management”, e.g. Austin 1984; Dunsire and Hood 1989; Levine
1978, 1980; Levine, Rubin and Wolohojian 1981). Deliverable 7.1. of the WP7 (Raudla, Savi
and Randma-Liiv 2013) provides an overview of the cutback management literature of the
1970s and 1980s.
The current crisis and the subsequent government responses have by now been extensively
studied by international organisations and scholars from an economic perspective (e.g. EC
2009; OECD 2011; WB 2008; WHO 2009). There is an increasing literature in economics and
political economy examining the causes and consequences of the different phases of the crisis
(see, inter alia, Dabrowski 2009; Staehr 2010; Marer 2010; van den Noord 2011; Myant and
Drahokoupil 2012; Connolly 2012). Adding to this, administrative sciences are well-
positioned to contribute to research on the crisis by bringing in the dimensions of cutback
decision-making, the administration of cutback measures and ultimately the impact of the
crisis on public administration itself.
The existing scholarly research has provided multiple insights about the implications and
impact of the 2008 financial crisis on public administration. The crisis has been treated as both
a dependent and an independent variable in theoretical and empirical works addressing
different policy areas and aspects of public administration. For instance, several authors point
out that the crisis has substantially redrawn the boundaries between public and private sectors
(Thynne 2011) by empowering the former (Moulton and Wise 2010; see also opposing
theorising by Pandey 2010). Also, the coordination mechanisms of the key regulatory
institutions have been studied; a number of studies conclude that the 2008 financial crisis
resulted from coordination failures (Dabrowski 2009; Gieve and Provost 2012). A study on
the role of the institutional factors in fiscal adjustment in Estonia has shown that external
fiscal rules and centralised budgetary institutions might be conducive for undertaking
4 COCOPS Deliverable 7.2
budgetary consolidation measures (Raudla 2011). Lodge and Hood (2012) have theorised
about the shifting competencies required from public servants and governments due to crisis.
Policy responses to the global financial and economic crisis have been elaborated by Raudla
and Kattel (2013), Kickert (2012a) and Jõgiste, Peda and Grossi (2012). Peters, Pierre and
Randma-Liiv (2011) as well as Peters (2011) have looked at the governments’ responses to
crisis from the perspective of public administration and offer hypotheses about the effects of
the crisis on centralisation, politicisation and coordination. Also the issue of citizens’
(declined) trust, (heightened) expectations and general attitudes towards government and the
role of public leadership have been addressed (Posner and Blöndal 2012; Raudla and Kattel
2013; Massey 2011; Van de Walle and Jilke 2012).
The existing academic studies show that up to now the government responses to the crisis
have been diverse; there have been “as many responses as countries” (Peters 2011, 76), and in
many cases the responses have been diverging (see Bideleux 2011; Kickert 2012b, 2012c,
2012d, 2013a, 2013b; Lodge and Hood 2012; Peters 2011; Peters, Pierre and Randma-Liiv
2011; Pollitt 2010; Verik and Islam 2010). Although the number of publications in the fields
of public administration and political science addressing the recent crisis has been vastly
growing during the past couple of years, there is still a lack of comparative studies based on
common methodology. The WP7 of the COCOPS project attempts to fill up this gap in
research. More specifically, it aims at explaining similarities and differences between country
responses to the recent crisis and assessing the longer-term outcomes of the crisis on public
administration and management, based on the study of 14 European countries. The countries
included in the comparative study include both the COCOPS partner countries – Belgium,
Estonia, France, Germany, Hungary, Italy, Norway, the Netherlands, Spain and the UK; and
affiliated countries – Iceland, Ireland, Lithuania and Slovenia.
This report analyses the fiscal consolidation measures and the cutback decisions that have
been taken in the European countries – therefore, it is firstly informative. The second objective
is also to compare the countries and try to explain the similarities and differences in the fiscal
consolidation measures taken in different countries. To this end, we do not only consider the
contents of the government measures, but also the political decision-making processes that led
up to these measures. In addition to financial and economic explanatory factors we also use
political-administrative factors and external influences that have affected the consolidation
process. The third objective is to analyse what were the effects of the fiscal consolidation and
cutback decisions on public administration itself and whether administrative and public
management practices have been affected by the fiscal crisis and cutbacks. The following
research questions are being addressed:
1) How did the European governments respond to the fiscal crisis, what fiscal
consolidation and cutback measures were undertaken, and how did the decision-
making take place? What are the main similarities and differences between the
countries?
2) How can the similarities and differences in consolidation measures and decision-
making processes be explained, both from a financial-economic and a political-
administrative perspective?
(3) How have the fiscal crisis and consolidation affected reforms in public
administration and changes in public management?

5 COCOPS Deliverable 7.2
The report is structured as follows: in the first part of this paper, the analytical framework that
is used to answer these three research questions is introduced. In the second part, the analytical
framework is applied to the country studies. The report ends with an analysis of the main
trends in public administration emerging from the responses to the crisis. This will thereby
build a bridge to WP8 for the discussion of the future of the public sector.

6 COCOPS Deliverable 7.2
PART ONE. ANALYTICAL FRAMEWORK
The analytical framework consists of four parts. Firstly, an overview is provided of how the
fiscal consolidation measures are analysed, both the contents of the measures and the decision-
making processes leading to the specific measures. Secondly, the explanatory factors will be
elaborated for the analysis of the cutback management by distinguishing between financial-
economic and political-administrative factors as well as external influences. Thirdly, it is
shown how the effects of the cutbacks on public administration are analysed. The fourth
section will address the methodology and the empirical sources used for the country studies.
The analytical framework is outlined in Figure 1 below. Its constituent parts will be described
in the following sections.
Figure 1. Outline of the analytical framework
1. Fiscal crisis and consolidation
Up to now notions such as global financial crisis, fiscal crisis, economic crisis, banking crisis,
sovereign debt crisis and lately also social crisis have been used hand in hand, at times even
interchangeably. To solve the definitional issues, the current report is based on the approach of
Kickert (2012a), looking at the global crisis as separate (sequent) phases.
The banking crisis is referred to as the initial phase of the crisis where banks and other
key financial institutions faced difficulties and governments undertook different
support and rescue measures to save the financial institutions.
The economic crisis emerged after the financial crisis started to affect the real economy
and led to drastic falls in GDP and employment, forcing the governments to undertake
economic recovery measures (e.g. in the form of economic stimulus packages).
The fiscal crisis arose when the budget deficits the governments had (and gross state
debts they had accumulated) came to be seen as excessive; in response to that,
governments started consolidating the budgets and undertaking cutback management
(Kickert 2012a; Posner and Blöndal 2012).
Fiscal consolidation
Contents of measures
Decision-making
Explanations
Financial-economic
Political-administrative
Effects
Public administration
Public management
Fiscal crisis
Deficit/Debt

7 COCOPS Deliverable 7.2
Since 2010, the fourth phase of the crisis has erupted – the European sovereign debt crisis,
also called the Eurozone crisis. In countries with excessive national debt levels and budget
deficits coupled with lenders’ increasing interest rates on state bonds, it became impossible to
further finance their deficits and debt. This was (and is) particularly the case when economic
growth was low and debt was mainly in the hands of foreign creditors, as seen in Greece and
Portugal. As a consequence, Greece, Ireland and Portugal had to be bailed out in 2010,
Spanish banks received a bail-out in 2012 and Cyprus was bailed out by the European
Commission, the International Monetary Fund and the European Central Bank in 2013.
The focus of this study is on the phase of fiscal crisis; the other stages are used for contextual
information where necessary. We investigate the national governments’ measures to handle
their domestic fiscal crisis and do not focus on the European level of decision-making to
jointly manage the Eurozone crisis. The Eurozone crisis, the bail-outs and other support
measures taken co-operatively by the EU member countries undoubtedly had a major impact
on the economic and fiscal crisis in the Eurozone countries and their consequent domestic
fiscal consolidation measures. Moreover, the Maastricht treaty of the EU about maximum
budget deficit and state debt had a major impact on the domestic fiscal decisions of national
governments. In this study, however, we will only consider this in the framework of external
factors influencing the national fiscal consolidation process.
The report is based on the economic logic of the fiscal crisis and consolidation, namely that
the deterioration of economy and public finances led to an increase of budget deficit and state
debt, forcing governments to take fiscal consolidation measures, with the aim to decrease
deficit and debt-growth. For illustrating the depth of fiscal crisis and consolidation, the trend
report gives an overview of the main socio-economic and budgetary data in each country
(based on Table 1 in the WP7 work plan presented in Appendix 1). In order to allow for the
comparability of statistical data, advantage is taken of the existing Eurostat data (GDP, budget
deficit, public debt, etc.).
1.1. Fiscal consolidation: Contents of measures
In the literature on cutback management, a number of categorisations of the cutback
approaches have been put forth (for an overview, see Raudla, Savi and Randma-Liiv 2013). In
the country studies, the usual economic classification of consolidation measures (see e.g.
OECD 2011, 2012) into expenditure and revenue measures has been followed (see Table 2 in
Appendix 1). Whereas expenditure measures include, for example, cuts in personnel and non-
personnel costs, programme cuts and postponement or cancellation of investments, revenue
measures most often entail tax increases. This economic classification of consolidation
measures is provided in Table 1.

8 COCOPS Deliverable 7.2
Table 1. Classification of consolidation measures (based on OECD 2011, 2012)
Expenditure measures Revenue measures Other measures
1.1 Operational expenditures
Hiring or pay freeze;
Wage reduction;
Staff reductions;
Reorganisations;
Efficiency cuts.
Consumption tax: e.g. VAT,
excise taxes on alcohol,
tobacco, energy;
Income tax;
Corporation tax (bank
bonuses);
Non-fiscal revenues.
Addressing tax evasion
and social security fraud;
Financial sector;
Energy sector
(sustainable economy).
1.2 Programme expenditures in
policy sectors
Social security;
Health;
Education;
Housing;
Welfare;
Other sectors.
1.3 Capital expenditures
Cuts in capital spending.
This report will focus upon expenditure and revenue measures. Expenditure cuts are further
divided according to the following taxonomy: 1) measures for cutting operational measures
(running costs); 2) programme measures (transfers and grants) and 3) capital expenditures
(investments). Table 2 below summarises the main cutback instruments.
Table 2. Main cutback instruments (Raudla, Savi and Randma-Liiv 2013)
Category Instrument
Operational expenditures
Personnel costs
Non-personnel costs
Reduced overtime or working time
Slowing-down of promotion
Early retirement
Wage freeze
Reduction in the rate of salary increase
Filling positions with less credentialed, lower-paid staff
Reducing pay grades of vacated job lots
Salary cuts
Reshuffling of staff
Furlough
Hiring freeze
Layoff
Spending limits and bans on utilities, supplies, equipment,
travel, communications, etc.
Programme expenditures
Cut service provision
Shorten the reception time, limit service hours
Reduce the frequency of service provision, reduce the
number of service outlets
Reduce the quality requirements for service provision
Programme termination
Engage voluntary, part-time and third-party counterparts in
9 COCOPS Deliverable 7.2
service provision
Reduce transfers
Shift part of the entitlement costs to the private sector or
citizens
Investments/capital expenditures
Capital spending freeze for new/nonessential capital projects
Transfer of cost to private capital
Postponing procurement
Deferral of maintenance
Book-keeping expenditure cuts on capital account
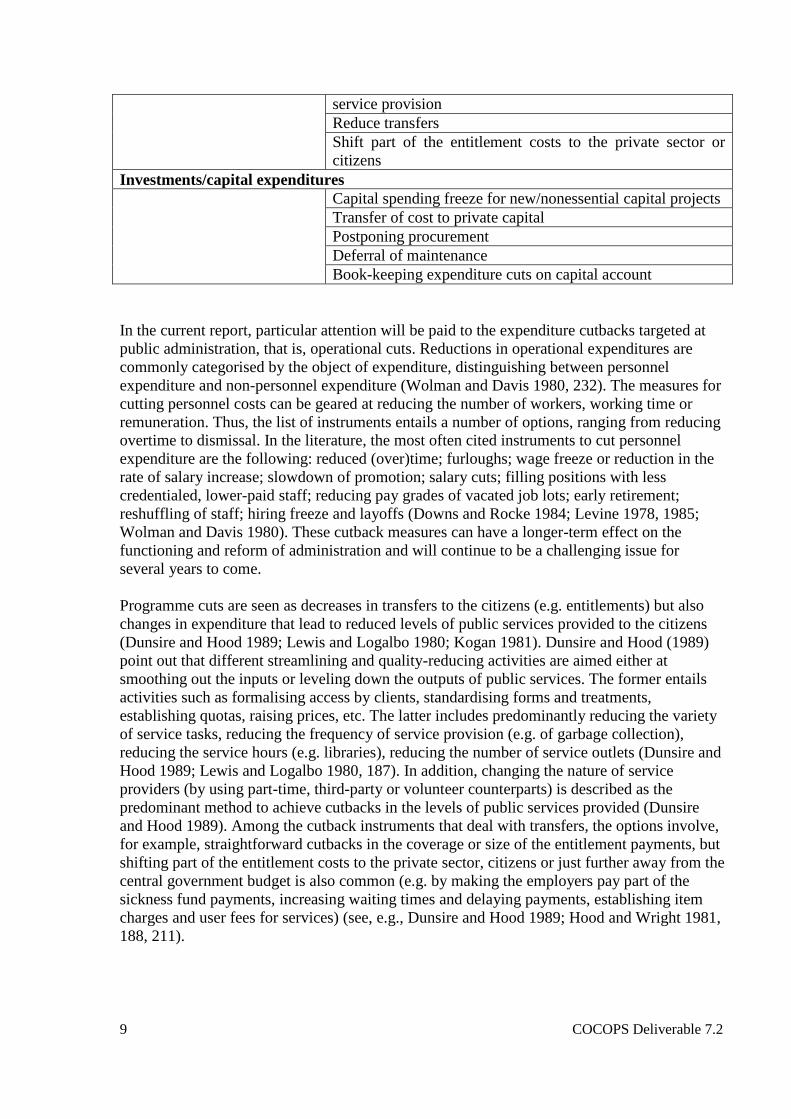
In the current report, particular attention will be paid to the expenditure cutbacks targeted at
public administration, that is, operational cuts. Reductions in operational expenditures are
commonly categorised by the object of expenditure, distinguishing between personnel
expenditure and non-personnel expenditure (Wolman and Davis 1980, 232). The measures for
cutting personnel costs can be geared at reducing the number of workers, working time or
remuneration. Thus, the list of instruments entails a number of options, ranging from reducing
overtime to dismissal. In the literature, the most often cited instruments to cut personnel
expenditure are the following: reduced (over)time; furloughs; wage freeze or reduction in the
rate of salary increase; slowdown of promotion; salary cuts; filling positions with less
credentialed, lower-paid staff; reducing pay grades of vacated job lots; early retirement;
reshuffling of staff; hiring freeze and layoffs (Downs and Rocke 1984; Levine 1978, 1985;
Wolman and Davis 1980). These cutback measures can have a longer-term effect on the
functioning and reform of administration and will continue to be a challenging issue for
several years to come.
Programme cuts are seen as decreases in transfers to the citizens (e.g. entitlements) but also
changes in expenditure that lead to reduced levels of public services provided to the citizens
(Dunsire and Hood 1989; Lewis and Logalbo 1980; Kogan 1981). Dunsire and Hood (1989)
point out that different streamlining and quality-reducing activities are aimed either at
smoothing out the inputs or leveling down the outputs of public services. The former entails
activities such as formalising access by clients, standardising forms and treatments,
establishing quotas, raising prices, etc. The latter includes predominantly reducing the variety
of service tasks, reducing the frequency of service provision (e.g. of garbage collection),
reducing the service hours (e.g. libraries), reducing the number of service outlets (Dunsire and
Hood 1989; Lewis and Logalbo 1980, 187). In addition, changing the nature of service
providers (by using part-time, third-party or volunteer counterparts) is described as the
predominant method to achieve cutbacks in the levels of public services provided (Dunsire
and Hood 1989). Among the cutback instruments that deal with transfers, the options involve,
for example, straightforward cutbacks in the coverage or size of the entitlement payments, but
shifting part of the entitlement costs to the private sector, citizens or just further away from the
central government budget is also common (e.g. by making the employers pay part of the
sickness fund payments, increasing waiting times and delaying payments, establishing item
charges and user fees for services) (see, e.g., Dunsire and Hood 1989; Hood and Wright 1981,
188, 211).
10 COCOPS Deliverable 7.2
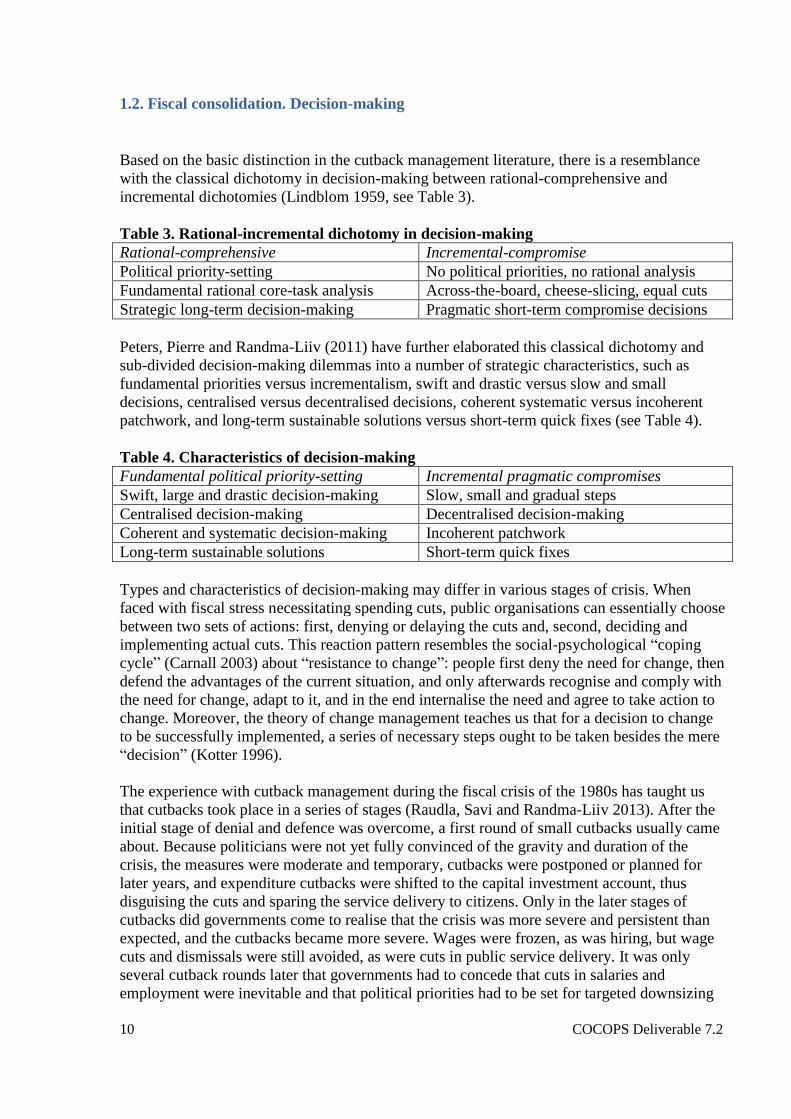
1.2. Fiscal consolidation. Decision-making
Based on the basic distinction in the cutback management literature, there is a resemblance
with the classical dichotomy in decision-making between rational-comprehensive and
incremental dichotomies (Lindblom 1959, see Table 3).
Table 3. Rational-incremental dichotomy in decision-making
Rational-comprehensive Incremental-compromise
Political priority-setting No political priorities, no rational analysis
Fundamental rational core-task analysis Across-the-board, cheese-slicing, equal cuts
Strategic long-term decision-making Pragmatic short-term compromise decisions
Peters, Pierre and Randma-Liiv (2011) have further elaborated this classical dichotomy and
sub-divided decision-making dilemmas into a number of strategic characteristics, such as
fundamental priorities versus incrementalism, swift and drastic versus slow and small
decisions, centralised versus decentralised decisions, coherent systematic versus incoherent
patchwork, and long-term sustainable solutions versus short-term quick fixes (see Table 4).
Table 4. Characteristics of decision-making
Fundamental political priority-setting Incremental pragmatic compromises
Swift, large and drastic decision-making Slow, small and gradual steps
Centralised decision-making Decentralised decision-making
Coherent and systematic decision-making Incoherent patchwork
Long-term sustainable solutions Short-term quick fixes
Types and characteristics of decision-making may differ in various stages of crisis. When
faced with fiscal stress necessitating spending cuts, public organisations can essentially choose
between two sets of actions: first, denying or delaying the cuts and, second, deciding and
implementing actual cuts. This reaction pattern resembles the social-psychological “coping
cycle” (Carnall 2003) about “resistance to change”: people first deny the need for change, then
defend the advantages of the current situation, and only afterwards recognise and comply with
the need for change, adapt to it, and in the end internalise the need and agree to take action to
change. Moreover, the theory of change management teaches us that for a decision to change
to be successfully implemented, a series of necessary steps ought to be taken besides the mere
“decision” (Kotter 1996).
The experience with cutback management during the fiscal crisis of the 1980s has taught us
that cutbacks took place in a series of stages (Raudla, Savi and Randma-Liiv 2013). After the
initial stage of denial and defence was overcome, a first round of small cutbacks usually came
about. Because politicians were not yet fully convinced of the gravity and duration of the
crisis, the measures were moderate and temporary, cutbacks were postponed or planned for
later years, and expenditure cutbacks were shifted to the capital investment account, thus
disguising the cuts and sparing the service delivery to citizens. Only in the later stages of
cutbacks did governments come to realise that the crisis was more severe and persistent than
expected, and the cutbacks became more severe. Wages were frozen, as was hiring, but wage
cuts and dismissals were still avoided, as were cuts in public service delivery. It was only
several cutback rounds later that governments had to concede that cuts in salaries and
employment were inevitable and that political priorities had to be set for targeted downsizing
11 COCOPS Deliverable 7.2
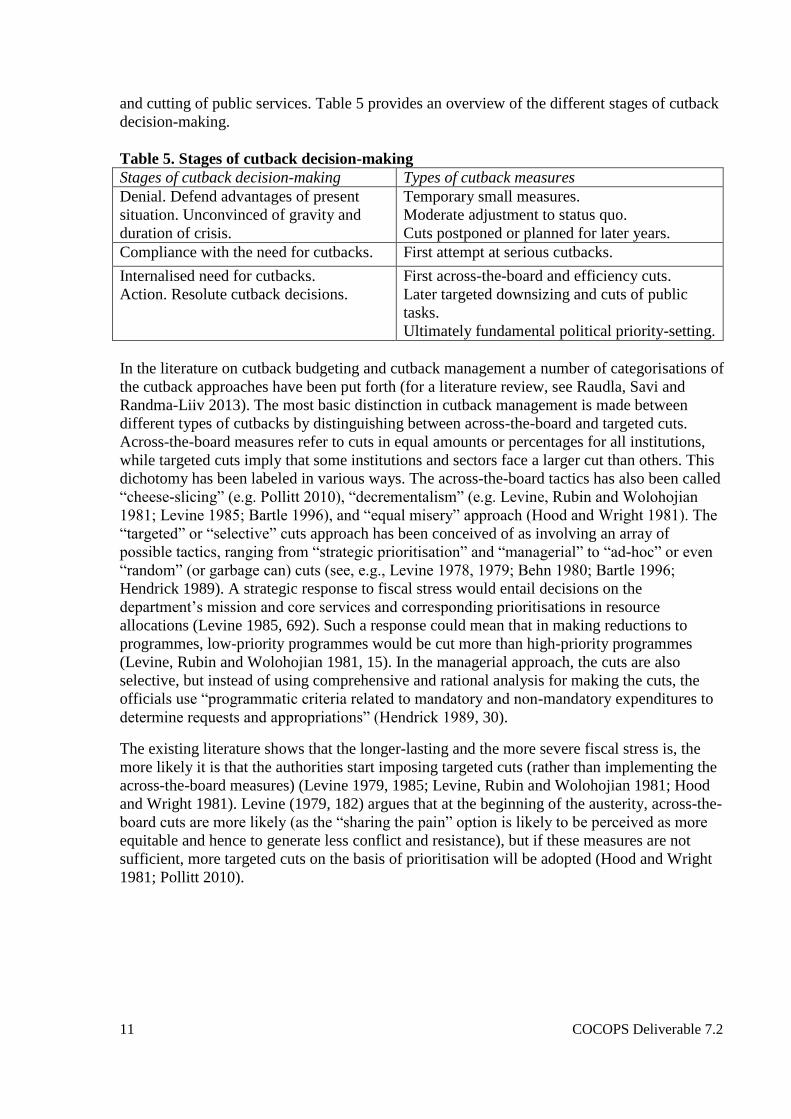
and cutting of public services. Table 5 provides an overview of the different stages of cutback
decision-making.
Table 5. Stages of cutback decision-making
Stages of cutback decision-making Types of cutback measures
Denial. Defend advantages of present
situation. Unconvinced of gravity and
duration of crisis.
Temporary small measures.
Moderate adjustment to status quo.
Cuts postponed or planned for later years.
Compliance with the need for cutbacks. First attempt at serious cutbacks.
Internalised need for cutbacks.
Action. Resolute cutback decisions.
First across-the-board and efficiency cuts.
Later targeted downsizing and cuts of public
tasks.
Ultimately fundamental political priority-setting.
In the literature on cutback budgeting and cutback management a number of categorisations of
the cutback approaches have been put forth (for a literature review, see Raudla, Savi and
Randma-Liiv 2013). The most basic distinction in cutback management is made between
different types of cutbacks by distinguishing between across-the-board and targeted cuts.
Across-the-board measures refer to cuts in equal amounts or percentages for all institutions,
while targeted cuts imply that some institutions and sectors face a larger cut than others. This
dichotomy has been labeled in various ways. The across-the-board tactics has also been called
“cheese-slicing” (e.g. Pollitt 2010), “decrementalism” (e.g. Levine, Rubin and Wolohojian
1981; Levine 1985; Bartle 1996), and “equal misery” approach (Hood and Wright 1981). The
“targeted” or “selective” cuts approach has been conceived of as involving an array of
possible tactics, ranging from “strategic prioritisation” and “managerial” to “ad-hoc” or even
“random” (or garbage can) cuts (see, e.g., Levine 1978, 1979; Behn 1980; Bartle 1996;
Hendrick 1989). A strategic response to fiscal stress would entail decisions on the
department’s mission and core services and corresponding prioritisations in resource
allocations (Levine 1985, 692). Such a response could mean that in making reductions to
programmes, low-priority programmes would be cut more than high-priority programmes
(Levine, Rubin and Wolohojian 1981, 15). In the managerial approach, the cuts are also
selective, but instead of using comprehensive and rational analysis for making the cuts, the
officials use “programmatic criteria related to mandatory and non-mandatory expenditures to
determine requests and appropriations” (Hendrick 1989, 30).
The existing literature shows that the longer-lasting and the more severe fiscal stress is, the
more likely it is that the authorities start imposing targeted cuts (rather than implementing the
across-the-board measures) (Levine 1979, 1985; Levine, Rubin and Wolohojian 1981; Hood
and Wright 1981). Levine (1979, 182) argues that at the beginning of the austerity, across-the-
board cuts are more likely (as the “sharing the pain” option is likely to be perceived as more
equitable and hence to generate less conflict and resistance), but if these measures are not
sufficient, more targeted cuts on the basis of prioritisation will be adopted (Hood and Wright
1981; Pollitt 2010).

12 COCOPS Deliverable 7.2
2. Explanatory factors
This report distinguishes between three types of explanatory factors in analysing consolidation
measures and decision-making during the fiscal crisis: financial-economic factors, political-
administrative factors and external influence.
The crisis and the governmental consolidation measures have so far mainly been analysed by
economists, which is not surprising since the fiscal consolidation measures had important
financial and fiscal implications. Worth mentioning is the excellent international comparative
study of the OECD on “restoring public finances” (OECD 2011), in which the early
consolidation measures of the OECD member countries were addressed.
Our report not only describes the scope and contents of the consolidation measures that
several European governments have undertaken but also intends to explain the similarities and
differences in consolidation management and decision-making. Economic factors (e.g. GDP
growth, gross debt, government deficit – see Table 1 in Appendix 1) are important but not
sufficient in explaining cross-country variation. This report also uses political-administrative
factors and external influence as explanatory factors.
The well recognised characteristics of politico-administrative systems will be considered for
explanatory factors including general state structure (e.g. unitary state, federal state,
parliamentary vs. presidential system, degree of centralisation); type of political system
(majoritarian or consensus); type of government in power (single-party or multi-party
coalition; minority or majority government); ideology of the governing parties; electoral cycle;
and the role of various actors in political decision-making.
Political-administrative factors gain even more importance since the analysis does not only
address the contents of cutback measures, but also decision-making processes leading to these
measures. For example, according to Pollitt (2010, 21-2), cuts based on political priorities or
effectiveness evaluations (e.g. programme cuts) tend to be political decisions, whereas across-
the-board cuts rather reflect administrative decisions. Also the shifts in governance and public
administration are looked at through the decision-making effects at the central governmental
as proposed by Peters and his co-authors (2011).
Finally, the way governments decided to manage the fiscal crisis did not only depend on the
domestic financial-economic and political-administrative situation, but to a large extent also
on the worldwide financial-economic circumstances. The worldwide banking crisis in 2008
triggered a collapse of the inter-banking loan system and break-down of the international
financial system, soon leading to a severe economic crisis in virtually all European countries.
Furthermore, the Eurozone crisis of Southern European sovereign state bonds led to major EU
bail-out measures, which further increased state debts and deficits in EU member countries
requiring further rounds of domestic cutback measures. In the Eurozone, the necessity for
fiscal consolidation in all countries also derived from the Stability and Growth Pack
requirements including ceilings of three per cent for budget deficit and sixty per cent for state
debt. Several countries like Greece, Ireland, Italy and Latvia, in return for the financial
assistance provided by IMF, EU and the ECB, had to comply with strict conditions for fiscal
consolidation and cutbacks sometimes accompanied by requirements for major administrative
and policy reforms. Therefore, it could be claimed that in such cases, fiscal consolidation was
externally influenced or even imposed.

13 COCOPS Deliverable 7.2
Table 6 below summarises three types of explanatory factors.
Table 6. Explanatory factors
Financial-economic Political-administrative External influences
Socio-economic and
financial indicators prior
and during the crisis:
GDP per capita;
GDP growth;
Gross debt;
Government deficit/surplus;
Unemployment rate.
State system: unitary or federal;
Political system: majoritarian
or consensus;
Ideology of governing parties;
Electoral cycle;
Political-administrative
relationships.
Worldwide economic
developments;
Euro-crisis;
EU regulations (ceilings on
budget deficit and debt,
conditions for joining the
Euro-zone);
IMF, EU and ECB
conditions for support.
3. Effects on public administration and management
The report aims to identify both systemic reforms trends in public administration and changes
in patterns of public management occurring during the retrenchment and immediate years
following the cutbacks.
The current global crisis bears resemblance to the previous worldwide economic and fiscal
crisis of the 1980s. Roughly speaking, the oil crisis of the 1970s unleashed an international
economic crisis, which at the end of the 1970s and the beginning of the 1980s resulted in such
state debts and deficits that Western welfare states were forced to take drastic cutback
decisions. Substantive cutbacks in social security, health, education and other sectors became
inevitable. Moreover, the crisis led to a major reform trend in Western administrations, called
New Public Management (NPM). Governments were forced to increase their cost-
effectiveness and cost-efficiency leading to the widespread introduction of models and
techniques from the private business sector. Cutback management in the 1970s and 1980s
clearly emphasised the rhetoric which was later translated into the main slogans of NPM, such
as “cost-consciousness”, striving for “efficiency”, “result-orientedness”, calls for “flexibility”
in personnel regulations and financial management, “performance measurement” as a basis for
decision-making. As found in the WP1 of the COCOPS project on the basis of 520 academic
articles and government reports from 27 European countries (gathered since the 1980s until
2011), the NPM-related reforms have resulted in mixed consequences – often NPM reforms
have led to improvements, but they have also led to no real change or even, in a significant
number of cases, to deteriorations (Pollitt and Dan 2011).
The current crisis started with a collapse of the international financial markets, followed by a
worldwide economic crisis, and subsequently resulted in a major fiscal crisis forcing Western
governments once again to take major cutback and cost-efficiency measures. The question
arises whether the current crisis once again leads to a major administrative reform trend? Has
the contemporary crisis caused only temporary short-term changes, or can we expect more
fundamental (systemic) administrative reforms and shifts in public management?
The popular saying calls for not wasting a good crisis and using it for carrying out long-
awaited changes and even structural reforms. However, Schick (1988, 532) notes that because
14 COCOPS Deliverable 7.2
of the time pressure involved in curbing budget deficits, policy-makers’ attention has been
diverted from comprehensive and time-consuming preparation and implementation of
structural reforms. Cepiku and Savignon (2012) also argue that because of the time pressures
that usually accompany cutback management, the focus of the governments is likely to be on
short-term measures rather than on structural reforms, although it is in fact structural reforms
that could help the governments to achieve longer-term fiscal sustainability. Thus, there is a
certain contradiction between the “windows of opportunity” for reform that crises can present,
and the ability and the willingness of the politicians to seize that opportunity. However,
although designing and carrying out substantial changes during the cutbacks can prove very
difficult, the cutback environment is likely to contribute to “setting the scene” for the changes
and reforms in the future when the immediate crisis with cutbacks is over, and there is more
time, funds, focused attention and motivation of politicians, public managers and civil servants
to prepare and implement changes.
Whether the crisis triggers larger public administration reforms or not, it is likely to cause
changes in public management practices because of the need to adapt to changes both in the
internal and the external environment. How scarce resources are perceived and reacted to by
the management is shaped by both the “objective” characteristics of the cutbacks and various
contextual conditions both inside and outside the organisations (Jick and Murray 1982, 159).
For instance, the objective characteristics of cutbacks entail the severity of the cuts, the time
pressure involved and whether the cuts could be anticipated or not (Jick and Murray 1982,
160). Contextual factors, such as the individual characteristics of key decision-makers and
differences in organisation design are also likely to play a role.
This report looks more specifically at potential changes in the following areas of public
management.
Firstly, has the crisis brought about a shift towards more centralised or decentralised
modes of decision-making? Centralisation has been considered inherent in any sort of
crisis management and decision-making (Boin et al. 2008). It is widely accepted that
financial decline triggers movement towards mechanistic structures and hierarchy-
based procedures in organisations, first and foremost, because budgeting, naturally
assumed to be in the domain of the chief executive, comes into the spotlight (Bozeman
2010; Peters 2011, 77; Stern and Sundelius 1997). As several authors (Behn 1980;
Heffron 1989; Levine 1985) have argued, centralisation of decision-making during
retrenchment is necessary because the organisational subunits would be very unlikely
to volunteer the making of cuts. Moving towards centralisation can be achieved either
through standardisation of procedures, empowering the central budgetary departments,
setting limits and ceilings to organisational spending, borrowing and activities, or by
general priority-setting of the government (Peters 2011; Pollitt 2010).
Secondly, has the crisis increased the autonomy of civil servants or have there been
attempts to politicise the decision-making? Has the power of politicians increased in
the decision-making process? Several authors (Kickert 2012a; Peters 2011; Peters,
Pierre and Randma-Liiv 2011) point out that a typical feature related to governments
managing the fiscal crisis is the centralisation of the decision-making process around
the political elite and distancing “the career civil service” from the key actors. Even
technocratic and operational decisions commonly in the responsibility of officials
might move into the political arena during cutback management (Peters 2011); public
service can be cast aside because it is treated as part of the problem resistant to
changes, but not part of the solution (Peters and Pierre 2004). On the other hand, it has

15 COCOPS Deliverable 7.2
been argued that relying strongly on the administrative apparatus or other sources of
expert advice can serve the aim to obscure or shift blame (Boin et al. 2008; Peters,
Pierre and Randma-Liiv 2011). Posner and Blöndal (2012, 29) call the delegation of
hard choices to agencies the “time-honoured strategy” of scattering political
responsibility.
Thirdly, has the crisis influenced the use of performance indicators? Numerous authors
have indicated that performance management assumed a role in cutback management
in the 1980s (Cayer 1986; Holzer 1986; Ingraham and Barrilleaux 1983; Levine 1984).
Moreover, they saw the improvement of performance management as one of the main
organisational solutions to downsizing, which is why much writing on cutbacks in the
1980s ended with recommendations on how to develop further performance-
management tools and processes. The role of performance management has been
strongly emphasised in the implementation of cutbacks on the organisational level. For
example, performance evaluation has been claimed as an integral part of layoffs (Cayer
1986), and the importance of performance management in carrying out cutbacks has
been argued to safeguard the best performers (Levine 1984).
The report also looks at the potential changes in organisational functions as a consequence of
retrenchment. Has the crisis led to downsizing of back-office functions? Or has it caused the
reduction of frontline presence? Finally, attention is paid to the fees of public services. Has the
crisis led to increasing the fees and user charges for public services?
The aforementioned ingredients altogether constitute the following analytical framework
presented in Figure 2.

16 COCOPS Deliverable 7.2
Figure 2. Analytical Framework
4. Methodology
The study employs both exploratory and explanatory approaches to comparatively investigate
the reactions of national governments to the fiscal crisis. The analytical framework is based on
the previous studies on the crisis (Kickert 2012a) and, in particular, on the first deliverable of
the WP7 – a review on the cutback management literature and its findings of cutback
strategies in the public sector in the 1970s and 1980s (Raudla, Savi and Randma-Liiv 2013).
In addition, the report builds on the main results of the other work packages of the COCOPS
project – the relevant results of the WP1, WP2 and WP3 are being considered. The country
studies are based on a common research plan provided in Appendix 1. In order to allow for the
comparability of statistical data, advantage is taken of the existing Eurostat databases and the
OECD (2011 and 2012) international studies on states restoring public finances, especially of
the various financial-economic indicators that have been composed for the OECD countries
(GDP, budget deficit, public debt, etc.), and the main cutback measures applied.
Financial-economic
Socio-economic and
financial indicators
prior and during the
crisis: GDP growth,
gross debt,
government deficit.
Expenditure measures
Operational cuts;
Program cuts;
Capital investments’ cuts.
Revenue measures
Tax increases.
Political-
administrative
State system;
Political system;
Ideology;
Electoral cycle;
Government system;
Politics-
administration.
Stages of decisions
Denial and postponement;
Small cuts;
Serious cuts;
Priority-setting.
Characteristics of decisions Fundamental vs.
incremental;
Swift vs. slow;
Centralised vs. decentralised.
Types of decisions
Targeted cuts;
Across-the-board cuts.
Consolidation Measures
Cutback Decision-Making
External influences
Worldwide economy;
EU deficit and debt
regulations;
IMF, ECB, EU
conditionality.
Administrative
reforms
Changes in public
management
Explanatory Factors
Effects on Administration
AdministrationAdministrati
on

17 COCOPS Deliverable 7.2
The countries included in the study are the following: Belgium, Estonia, France, Germany,
Hungary, Iceland, Ireland, Italy, Lithuania, the Netherlands, Norway, Slovenia, Spain and the
UK. These countries vary as to their financial-economic characteristics, as some countries had
moderate budget deficits but high debt, some others had high deficits and moderate debts, and
still others both high deficits and debts. The political-administrative characteristics also vary
between the countries, including both majoritarian and consensus democracies, single-party
governments and multi-party coalitions, and so forth.
The report draws on the main outcomes from the research compiled by the COCOPS partners
and affiliated researchers by integrating information and findings from three different sources.
1) 10 short country reports providing analytical descriptions of the national governments’
main responses to the crisis in a particular country following a common framework. These
country reports were based on the country data collection by the partners, analysis of WP3
survey findings and in-depth interviews with national decision-makers. Table 7 below
provides an overview of country reports.
Table 7. Country reports
Country Title Authors
Belgium The global financial crisis in the public
sector as an emerging coordination
challenge: Short country report for
Belgium
Trui Steen, Steve Troupin, Jesse
Stroobants (Katholieke Universiteit
Leuven)
Estonia Country note: Estonia Riin Savi (Tallinn University of
Technology)
France Country note: France Vanessa Albert (National Centre for
Scientific Research, Sciences Po),
Philippe Bezes (Center for Studies and
Research on Administrative and
Political Sciences, National Centre for
Scientific Research), Patrick Le Lidec
(National Centre for Scientific
Research, Sciences Po)
Germany Country report: Germany Jobst Fiedler, Gerhard
Hammerschmidt, Max Osterheld
(Hertie School Governance)
Hungary Country data sheet: Hungary György Hajnal (Corvinius University)
Italy Country report: Italy
Edoardo Ongaro (Northumbria
University), Fabrizio Di Mascio,
Davide Galli, Alessandro Natalini,
Francesco Stolfi (Bocconi University)
The
Netherlands
Fiscal consolidation in the Netherlands Walter Kickert (Erasmus University
Rotterdam)
Norway Impact of the global financial crisis that
started in 2008 on Norway: No fiscal
crises and cut-back management
Per Lægreid (University of Bergen)
Spain The global financial crisis in the public
sector as an emerging coordination
challenge: Spain
Judith Clifton and Jose M. Alonso
(University of Cantabria)

18 COCOPS Deliverable 7.2
The United
Kingdom
The global financial crisis in the public
sector as an emerging coordination
challenge. Short country report: the UK
Oliver James and Ayako Nakamura
(University of Exeter)
2) 11 academic country case studies focusing on the analysis of consolidation measures and
the impact of the crisis on public administration. These case studies integrated the information
and analysis prepared for the short country reports, provided more in-depth analysis of the
national responses to the crisis and linked the empirical analysis to the theoretical literature.
Table 8 offers an overview of country case studies.
Table 8. Case studies
Country Title Authors
Belgium The impact of the fiscal crisis on Belgian
federal government: changes in the
budget decision-making process and
intra-governmental relations
Trui Steen, Steve Troupin, Jesse
Stroobants (Katholieke Universiteit
Leuven)
Estonia Public policy making in time of crisis:
cutback management in Estonia
Riin Savi and Tiina Randma-Liiv
(Tallinn University of Technology)
France The French politics of retrenchment à la
carte (2007-2012): ideational frames,
interest groups and political cycles
Philippe Bezes (Center for Studies
and Research on Administrative and
Political Sciences, National Centre
for Scientific Research) and Patrick
Le Lidec (National Centre for
Scientific Research, Sciences Po)
Germany Public sector cutback management in
Germany: a substantial gap between a
new tight fiscal governance framework
and a weak capacity for administrative
reform
Max Osterheld, Jobst Fiedler, Anja
Görnitz and Gerhard Hammerschmid
(Hertie School of Governance)
Hungary Fiscal consolidation in Hungary György Hajnal (Corvinius
University)
Iceland Iceland after the revolution: The impact
of crisis on governance
Gunnar Helgi Kristinsson
(University of Iceland)
Ireland State retrenchment and fiscal
consolidation in Ireland
Muiris MacCarthaigh and Niamh
Hardiman (Queen’s University
Belfast and University College
Dublin)
Italy The impact of the crisis on administrative
reform in a “context of motion”: Italy
2007-2012
Edoardo Ongaro (Northumbria
University), Fabrizio Di Mascio,
Davide Galli, Alessandro Natalini,
Francesco Stolfi (Bocconi
University)
Lithuania Fiscal consolidation in Lithuania in the
period 2008-2012: from grand ambitions
to hectic fire-fighting
Vitalis Nakrošis, Ramūnas
Vilpišauskas and Vytautas Kuokštis
(Vilnius University)
The
Netherlands
Fiscal consolidation in the Netherlands Walter Kickert (Erasmus University
Rotterdam)
Slovenia Fiscal Balance and Public Sector
Downsizing in Slovenia
Primož Pevcin (University of
Ljubljana)
19 COCOPS Deliverable 7.2
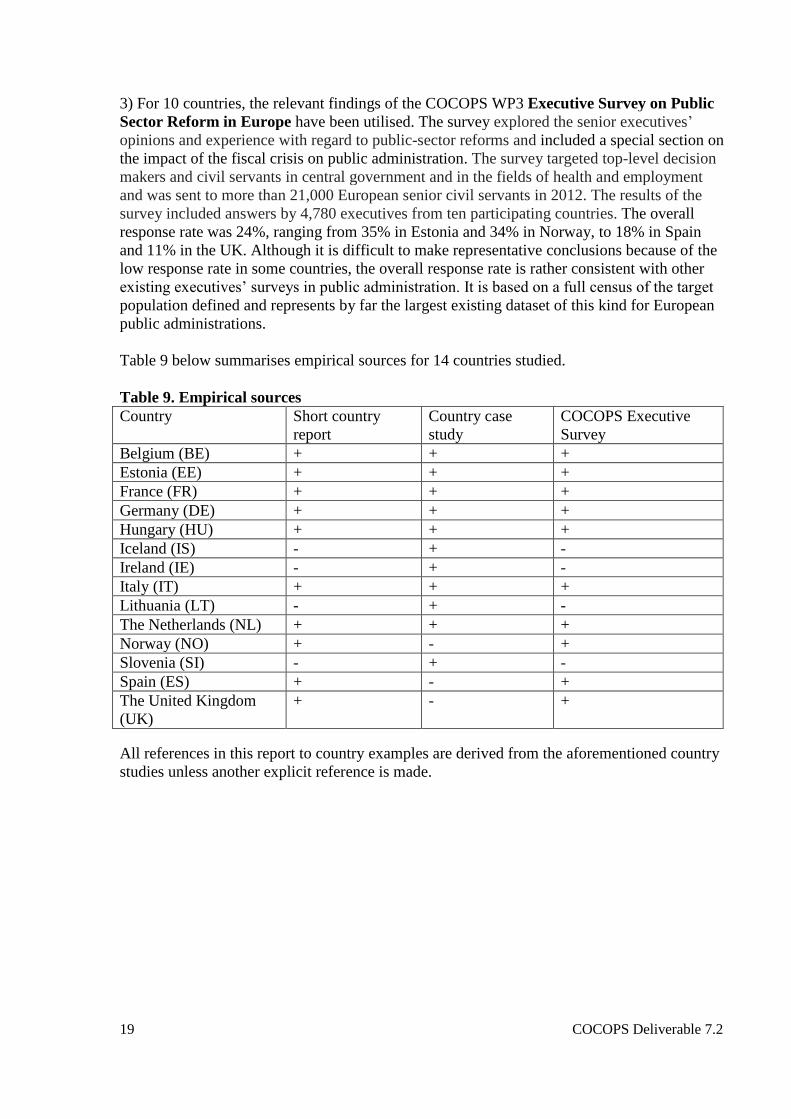
3) For 10 countries, the relevant findings of the COCOPS WP3 Executive Survey on Public
Sector Reform in Europe have been utilised. The survey explored the senior executives’
opinions and experience with regard to public-sector reforms and included a special section on
the impact of the fiscal crisis on public administration. The survey targeted top-level decision
makers and civil servants in central government and in the fields of health and employment
and was sent to more than 21,000 European senior civil servants in 2012. The results of the
survey included answers by 4,780 executives from ten participating countries. The overall
response rate was 24%, ranging from 35% in Estonia and 34% in Norway, to 18% in Spain
and 11% in the UK. Although it is difficult to make representative conclusions because of the
low response rate in some countries, the overall response rate is rather consistent with other
existing executives’ surveys in public administration. It is based on a full census of the target
population defined and represents by far the largest existing dataset of this kind for European
public administrations.
Table 9 below summarises empirical sources for 14 countries studied.
Table 9. Empirical sources
Country Short country
report
Country case
study
COCOPS Executive
Survey
Belgium (BE) + + +
Estonia (EE) + + +
France (FR) + + +
Germany (DE) + + +
Hungary (HU) + + +
Iceland (IS) - + -
Ireland (IE) - + -
Italy (IT) + + +
Lithuania (LT) - + -
The Netherlands (NL) + + +
Norway (NO) + - +
Slovenia (SI) - + -
Spain (ES) + - +
The United Kingdom
(UK)
+ - +
All references in this report to country examples are derived from the aforementioned country
studies unless another explicit reference is made.
20 COCOPS Deliverable 7.2
PART TWO. APPLICATION OF THE ANALYTICAL FRAMEWORK TO
COUNTRY STUDIES
5. Fiscal consolidation. Contents of measures
This chapter first provides a general overview of the consolidation measures undertaken by
different European governments. Secondly, the expenditure cutbacks targeted at public
administration are focused upon, because these could have a longer-term effect on the
functioning and reform of public administration and management. Thirdly, the main results of
the COCOPS survey concerning the public-sector executives’ perceptions on the main cutback
strategies and measures are presented.
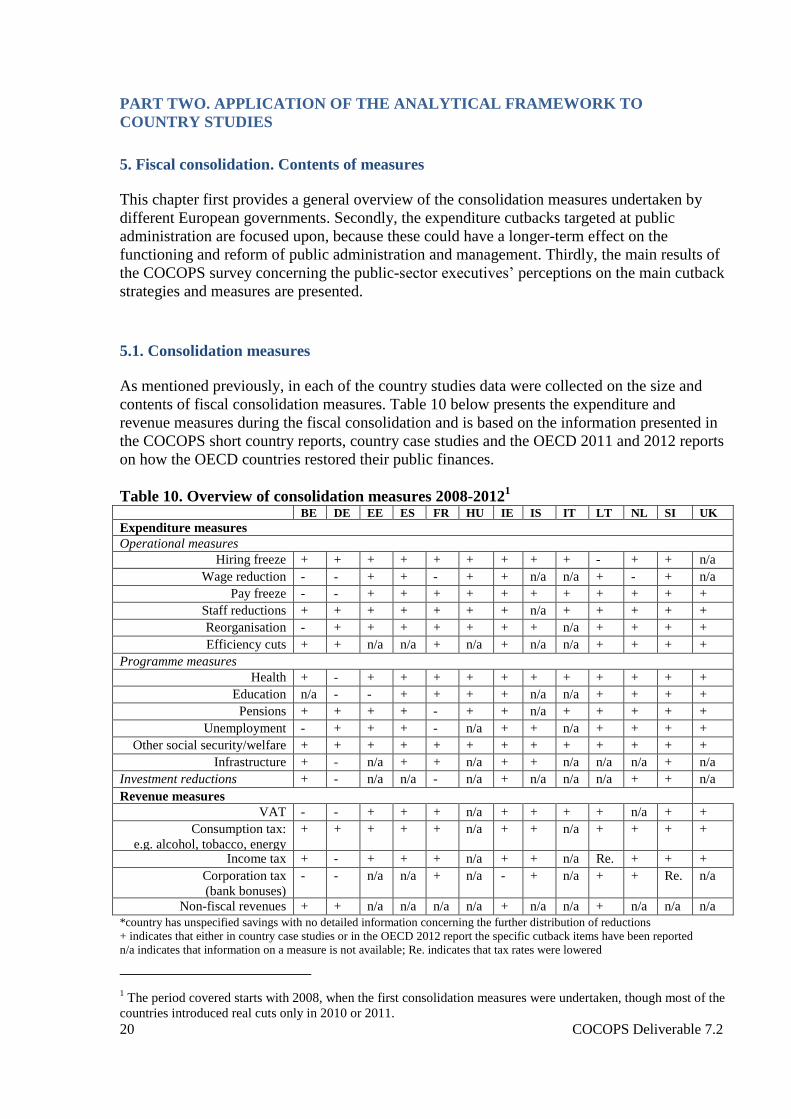
5.1. Consolidation measures
As mentioned previously, in each of the country studies data were collected on the size and
contents of fiscal consolidation measures. Table 10 below presents the expenditure and
revenue measures during the fiscal consolidation and is based on the information presented in
the COCOPS short country reports, country case studies and the OECD 2011 and 2012 reports
on how the OECD countries restored their public finances.
Table 10. Overview of consolidation measures 2008-20121
BE
DE EE
ES
FR
HU
IE
IS
IT
LT
NL
SI
UK
Expenditure measures
Operational measures
Hiring freeze + + + + + + + + + - + + n/a
Wage reduction - - + + - + + n/a n/a + - + n/a
Pay freeze - - + + + + + + + + + + +
Staff reductions + + + + + + + n/a + + + + +
Reorganisation - + + + + + + + n/a + + + +
Efficiency cuts + + n/a n/a + n/a + n/a n/a + + + +
Programme measures
Health + - + + + + + + + + + + +
Education n/a - - + + + + n/a n/a + + + +
Pensions + + + + - + + n/a + + + + +
Unemployment - + + + - n/a + + n/a + + + +
Other social security/welfare + + + + + + + + + + + + +
Infrastructure + - n/a + + n/a + + n/a n/a n/a + n/a
Investment reductions + - n/a n/a - n/a + n/a n/a n/a + + n/a
Revenue measures
VAT - - + + + n/a + + + + n/a + +
Consumption tax:
e.g. alcohol, tobacco, energy
+ + + + + n/a + + n/a + + + +
Income tax + - + + + n/a + + n/a Re. + + +
Corporation tax
(bank bonuses)
- - n/a n/a + n/a - + n/a + + Re. n/a
Non-fiscal revenues + + n/a n/a n/a n/a + n/a n/a + n/a n/a n/a
*country has unspecified savings with no detailed information concerning the further distribution of reductions
+ indicates that either in country case studies or in the OECD 2012 report the specific cutback items have been reported
n/a indicates that information on a measure is not available; Re. indicates that tax rates were lowered
1 The period covered starts with 2008, when the first consolidation measures were undertaken, though most of the
countries introduced real cuts only in 2010 or 2011.
21 COCOPS Deliverable 7.2
Expenditure measures
Operational measures
When looking at the expenditure reductions of governments’ running costs, it can be seen that
hiring and pay freeze have been very prominent measures applied to combat the fiscal crisis
in numerous countries. In some countries the period of pay or hiring freeze has been explicitly
fixed (e.g. in the UK a two-year pay freeze was foreseen in 2011), in others their duration has
been treated more flexibly.
Wage reduction was a cutback measure that followed the more modest and less contested pay
freeze in those countries where the budgetary problem and pressure were considerably higher.
However, some governments, such as those of Estonia and Lithuania, volunteered unpopular
decisions of wage cuts immediately after the outset of crisis. Meanwhile, other countries
which had received financial assistance from the IMF and the EU, such as Hungary, Ireland
and Italy, were requested to carry out these politically more sensitive forms of cutbacks.
Germany, on the other hand, has a special legal civil service system which prohibits wage
reductions and even pay freeze.
Reduction of staff has been applied as a cutback measure in at least half of the countries
studied. Interestingly, however, very different tactics have been applied to achieve this goal.
At the one end of the extreme, in Estonia and in Lithuania layoffs have been applied at the
beginning of the retrenchment (in Lithuania the executive and its institutions experienced a
decrease of 11% in the filled positions). In France, the non-replacement of one out of two
retiring civil servants has been put in place (OECD 2012), while in Spain a 10% replacement
rate for all staff in the public sector was implemented 2011-13.
Several governments have also opted for reorganisations to reduce the expenditure side of the
budget. Lithuania stands out in this realm as all ministries and many agencies were
restructured when the government initiated broad organisational reforms affecting all types of
public sector institutions. In the UK, a Public Bodies Reform plan was initiated in 2010 with
the aim to reorganise about 500 Arm’s Length Bodies either by abolishing, merging or
substantially reforming the agencies. In Spain, the restructuring of government included the
abolition of duplicated bodies at the regional and central levels.
Efficiency savings seem to have been the least popular measure, as only three countries have
announced straightforward cuts based on increasing the efficiency. Here the UK serves as a
pioneer by having introduced the Operational Efficiency Program for all departments targeted
at saving in back-office operation, equipment, IT reforms and collaborative procurement as
well as increased cost saving in the public sector estates. Seeking efficiency gains has been on
the agenda in Lithuania, as well, where the efficiency assessment of staff functions was
carried out at the central governmental level and also centralisation of procurement functions
and standardised state property management were applied.
Programme measures
In terms of the share of cutbacks, the largest expenditure reductions involve programme
measures. During the retrenchment period the most frequently targeted areas for savings have
been health care, pensions, welfare and infrastructure (OECD 2012). In the following we
focus on the cutback trends in the social security sector and, in particular, the politically

22 COCOPS Deliverable 7.2
sensitive areas of pension systems, unemployment systems, social security benefits and the
health sector.
Pension-related cutbacks have been applied in numerous countries, but the character of the
cutbacks varied to a great extent. Suspending, freezing and decreasing the rise in pension
payments or restructuring of the pension schemes (e.g. increasing the employee contribution
rates) have been applied in several cases (Estonia, Slovenia, Spain, the UK). To cut back the
government expenditure in the long run, the (early) retirement age has been increased in
several countries during the crisis (Belgium, Estonia, the Netherlands, the UK). In addition,
savings have been sought by leveling down the differences between public- and private-sector
pension regimes by raising civil servants’ pension contribution to the private-sector level
(Belgium and France). In Hungary and Italy, the crisis impelled a structural revision of the
pension system with the aim to produce significant cuts to the government expenditure in the
long-term perspective (OECD 2012).
The crisis brought along severe cuts in other social security benefits (besides pensions) in
most of the countries. In general the overall public social expenditure was reduced by cutting
unemployment and welfare benefits, increasing social security contributions etc. For example
in Ireland the unemployment and welfare benefits were cut by ca. 10% in 2009-10, and in
Hungary, Ireland and Slovenia parental benefits were curbed.
Nearly half of the studied countries investigated reported cuts in the health sector during the
crisis. The cuts vary to a great extent in terms of both size and content of the cutbacks between
the countries. In Ireland the total volume of cuts in health services outweighs all other
spending cuts, also in Belgium and Spain it makes up a remarkable share of the expenditure
savings (OECD 2012).
In some countries rather exceptional cuts in specific policy fields can be observed. In
Lithuania the national defense sector was the main loser in austerity measures (the expenditure
dropped by 27% during 2007-2011). In Ireland the largest proportion of cuts affected cultural
and arts policies, which were cut by 65%. In Spain cutback measures strongly affected both
college and non-university education, materialising in more teaching hours and more students
per teacher as well as a reduction or cancellation of free school transport and school lunches.
In Slovenia and UK the grants for pupils and students were reduced.
Capital investments
In numerous countries either real cuts (Ireland, Spain) or cuts planned in the future (Slovenia
and Spain) targeted the public infrastructure investment projects. In Ireland nearly 40% of the
adjustments to the state budget were achieved by the cancellation of planned capital and
infrastructure projects. In Iceland the reduction of the road maintenance costs contributed
strongly to fiscal balance (OECD 2012). On the contrary, in countries receiving EU structural
support (Estonia and Lithuania) the lion share of the (EU co-financed) infrastructure projects
were not cut.
23 COCOPS Deliverable 7.2
Revenue measures
Numerous revenue measures were applied in most of the countries. As a rule, governments
relied more on increasing the rates of existing taxes rather than introducing new ones with the
exception of France, where 23 new taxes were established during 2007-2012.
The most frequently announced tax measure was the raising of consumption taxes – on
alcohol, fuel and tobacco (except in France, Germany, Hungary, the Netherlands and
Norway). In many countries, the excise taxes were increased repeatedly – in Slovenia excise
taxes on fuels were increased for six times in a row during 2010. Also the rate of standard
value added tax (VAT) was increased in numerous countries (most commonly by 1 to 3
percentage points), in Estonia and Lithuania several VAT exemptions were abolished. In
France so-called “Social VAT” related cuts meant the reduction of pension for retired people
aiming at general cutbacks in tax shelters. By contrast, in Slovenia, the VAT rate was reduced,
and in Belgium the VAT rate in the catering sector was lowered. Some countries also reported
new consumption taxes such as levies on telecom services and lotteries (Estonia, Hungary)
and motor-vehicle tax (Slovenia). In addition, new taxes were often introduced in the area of
sustainable energy and ecology – such as new environmental and carbon taxes (Iceland), taxes
on nuclear energy production (Germany) and eco-taxes on airline tickets (Germany, the
Netherlands).
Also income tax measures have been used by a number of countries. Though in general the
share of income tax measures in the total revenue increase is much smaller than the share of
consumption taxes (OECD 2012, 58), in Ireland the increased income tax could be considered
a most important measure on the revenue side as it widened the base which had narrowed
down during the pre-crisis period (OECD 2012). In Spain the changes introduced to income
taxation were rather encompassing – the government first increased the tax burden on the
highest incomes and later on almost all tax rates. Similarly, higher tax rates for the top
incomes were introduced by the Labour government in the UK and the Socialist president in
France. Exceptionally, in Lithuania the personal income taxes were lowered from 24% to
21%.
5.2. Cutbacks in public administration
As shown in the previous chapter, in most countries (except Norway) the public expenditure
cutbacks have to a large degree been targeted at governments’ operational costs, i.e. the costs
of public administration itself. Here, more detailed information on the real or planned cutbacks
concerning the salaries of public sector employees and the size of public sector employment is
presented, based on country case descriptions.
Estonia. All three supplementary cutback-budgets that the government adopted during 2008-
2009, contained extensive cuts in the operational expenditures of the central government,
predominantly achieved by curtailing personnel expenditures. Concurrently dismissals, salary
cuts, decreased work-time and lay-offs were applied during the cutback period. In 2008 the
central government abolished about 3000 positions and laid off about 1000 civil servants. For
example, the State Chancellery and Ministry of Finance laid off 16% and 11% of their
respective workforce (Peters et al. 2011, 22). During the retrenchment period the civil service
salaries were sliced back in several stages; in total the salaries were cut by 10 to 20 per cent.
Besides the pay cuts civil servants faced a cut in their benefits when additional pay funds,
training funds and one-time support schemes (e.g. compensation for health-related activities,
financial support for festive occasions) were abolished.

24 COCOPS Deliverable 7.2
Germany. Due to the specific legal status of public sector employees (Beamten), staff lay-offs
were not possible. Likewise pay cuts of civil servants were legally prohibited except in the
case of special allowances (e.g. holiday, Christmas) and bonuses, or in the case of externally
contracted staff. Due to the legal basis for periodic seniority-based pay rises, salary freeze was
not a viable option, either. The common approach to realising savings was to freeze hiring and
replacement.
Hungary. For electoral reasons in 2002 public sector wages were increased by 50 per cent and
a 13th
month salary was added. In response to the fiscal crisis in 2009 the government took the
measure to freeze public sector wages (at the previously increased level) and eliminate the 13th
month allowance.
Ireland. In Ireland, following the onset of the crisis in late 2008, public sector pay increases
scheduled for payment in 2009 were not paid, a “pension levy” was introduced for all existing
public servants and in 2010, public sector pay was cut again on a tiered basis. Adjustments to
future but not current pension provisions were introduced. As a result of these measures, the
gross rates of public service pay were reduced by about 14% cumulatively over 2009 and 2010
(cf. EU-IMF progress report of March 2012). In December 2010, the government concluded
an agreement with the labour unions, which guaranteed that public sector employees would
not suffer any further direct cuts to their pay. An immediate implication of the agreement was
that expenditure savings in the public sector would be enforced through control over the
numbers employed rather than through pay rates. The government was committed to securing
shrinkage in numbers through further voluntary retirement schemes, in addition to early-
retirement and career-break incentives introduced earlier in the crisis. Changes to the terms of
pension entitlements encouraged some 9000 public servants to depart by the end of February
2012, with the government indicating that it would recruit about 3000 replacement personnel
to the service. An overall reduction of about 25,000 people (albeit on pre-crisis 2008 figures)
by 2014 had been agreed with the EU-ECB-IMF in November 2010 as part of Ireland’s bail-
out deal.
Italy. The austerity plans launched in 2010 consisted of a freeze of temporary contracts, a
vacancy replacement rate of 20 per cent for 2010-2013, a freeze of public sector wages for
2010-2013 and a cut in salaries that exceeded 90,000 euro. The budget for temporary contracts
was halved. The reduction in the number and costs of public employees goes further back.
First attempts in the late 1990s to reduce the permanent workforce were undone by an increase
of temporary positions, leading to a marginal decrease of public employment. The brief period
of the centre-left Prodi-government (2006-2008) also led to only a slight reduction. In 2008
the centre-right Berlusconi-government launched another reform, downsizing the workforce
mainly by tightening the replacement rates (at 10 per cent in 2009 and 20 per cent in 2010-
2013), and by halving the budget for fixed-term contracts. Managerial positions were to be
reduced by 20 and 15 per cent. A marked reduction of public employment was the result,
which continued during the Monti-government period (2011-2012). Dismissals were
announced but not implemented.
Lithuania. In view of the forthcoming 2008 elections expansions in public sector costs had
taken place, such as an increase in public sector wages and the introduction of automatic
indexation. The successive cutback rounds in 2008-2011 led to a reduction of staff
expenditures (the so-called remuneration fund) from 13 to 11 per cent of the total government
expenditures. The remuneration fund diminished by an overall 17 per cent in 2008-2010,
varying between different ministries. Civil service salaries were cut in a progressive way,

25 COCOPS Deliverable 7.2
resulting in top officials experiencing the deepest cut. In the period 2008-2010 the layoffs at
the state and municipal levels amounted to an average of about 10 per cent, varying between
branches and levels of government.
The Netherlands. In October 2010 the new cabinet announced a cutback package of up to 18
billion in 2015. The largest cuts (about 1.5 billion) were to be realised in national
administration. Salaries of civil servants were frozen, as was hiring of new personnel. A
reduction in the number of civil servants was proposed, although lay-offs were not planned.
Some ministries were merged, and departmental reshuffles took place. Cutbacks of 1.1 billion
were imposed on the provincial and municipal funds. Provinces were to restrict themselves to
their core tasks. Mergers of Provinces in the “Randstad” (the Amsterdam-Utrecht-Rotterdam-
The Hague area) were proposed. In total the cutbacks in public administration amounted to 6.1
billion in 2015 (on a total of 18 billion). In April 2012 an agreement was reached on another
14 billion cutbacks, including an additional freeze of civil servant salaries and another round
of cutbacks for provinces and municipalities. In October 2012 the new coalition cabinet
endorsed the 14 billion cutbacks. The coalition agreement contained far-reaching
announcements about territorial reform. The existing thirteen provinces were to merge into
five regions, one specific inter-provincial merger was proclaimed, and other mergers were
invited. Municipalities were to increase their size to 100.000 inhabitants. Central
administration was cut by an additional 1.1 billion, to be realised by managerial efficiency
measures in ministries and agencies.
Slovenia. During 2008-2011 the cutback measures of the Slovenian government were aimed at
reducing the operational costs of government, either by reducing the salaries and other work-
related benefits of public servants and governmental officials or by reducing the material costs
of government and the public sector as a whole. More specific measures to decrease the labour
costs of government included the withholding of the wage increases due to the new law on
salaries of public servants (adopted in 2008), the reduction of the number of total employees
in state administration by 2% with consolidation of selected activities and organisational units
within the sector, the reduction of basic salaries of governmental officials by 4% till the end of
March 2010 and the reduction of governance related fees and other payments etc. In January
2010, the rationalisation of the public sector was combined with the reform of the pension and
health-care system that should ensure fiscal sustainability in the long run. Besides, the wage
freezes for governmental officials were prolonged till 2010. The plans of a newly elected
government in 2012 foresaw for the salaries of public servants to be reduced by 8% (combined
with the eliminations of all discrepancies still not being made valid from the 2008 system); the
work-related benefits and awards are reduced; the wage increase due to the additional work is
limited to 20%; job promotion is enabled only after June 2013, and related wage increases
only follow in 2014; additional employment is allowed only upon a special permit.
Spain. Public sector wages were cut by 5 per cent in 2010 and frozen in 2011. Hiring was
frozen, and the vacancy replacement rate was set at 10 per cent for all public sector jobs,
which were to be cut by 7 per cent in 2013. New temporary jobs were forbidden. The austere
fiscal crisis measures led to a massive loss of public support, which forced Prime Minister
Zapatero (Socialist Party) to call new elections in 2011 resulting in the People’s Party’s
success. However, the new Rajoy government could not but embrace the harsh fiscal
measures. In 2012 neither fixed nor temporary staff was to be hired. Weekly working hours of
civil servants were brought up from 35 to 37.5 hours. For arm’s length bodies like agencies,
the vacancy replacement rate was also set at 5 per cent (Di Mascio, Natalini and Stolfi 2013).
The streamlining of the public sector by restructuring central administration, merging and

26 COCOPS Deliverable 7.2
closing agencies, and by reaching agreements with the autonomous communities and
municipalities to stabilise public expenditures, which was started by the Zapatero government,
was continued by the Rajoy government, which imposed fiscal retrenchment plans upon the
autonomous communities (Di Mascio, Natalini and Stolfi 2013).
The United Kingdom. In 2010 the new Cameron-Clegg government announced a drastic
spending-cuts programme amounting to savings of £83 billion in all policy areas by 2014-15.
Public spending was to be reduced by 25 per cent and some 490,000 public sector jobs cut.
The 2010 budget announced large-scale job cuts (downsized to 330,000) in the public sector,
as well as a two-year freeze on public sector pay rises and public sector pension reforms. Plans
were made for a 33-per-cent cut in administrative costs of government departments. The
government announced a “Public Bodies Reform” to reduce the number of arm’s-length
bodies. In 16 departments 904 public bodies were reviewed, of which a total of 496 was
suggested to be dissolved, merged with others or reformed.
Table 11 below provides an overview of cutbacks in administration. Different periods refer to
different government periods (elections and coalition changes without elections).
Table 11. Cutbacks in administration Belgium Estonia France Germany
(-2011) (2011-) (2007-09) (2009-11) (2011-) (2007-12) (-2009) (2009-)
Hiring freeze Yes Yes Yes Yes Yes Yes No Yes
Pay freeze No No Yes Yes Yes Yes No No
Public sector
wage cuts
No No Yes Yes No No No No
Public sector
job cuts
Yes Yes Yes Yes No No Yes Yes
Reorganisation No No No No No Yes No Yes
Hungary Iceland Ireland Italy Lithuania
(2008-10) (2010-) (-2008) (2008-11) (2011-12) (2008-12)
Hiring freeze Yes Yes Yes Yes Yes Yes Yes No
Pay freeze Yes Yes No Yes
Public sector
wage cuts
Yes Yes Yes Yes No No No Yes
Public sector
job cuts
No No Yes Yes No No Yes Yes
Reorganisation Yes Yes Yes Yes No No Yes Yes
Netherlands Slovenia Spain UK
(2010-12) (2012-) (2008-11) (2012-13) (2004-11) (2011-13) (-2010) (2010-)
Hiring freeze Yes Yes Yes Yes Yes Yes No Yes
Pay freeze Yes Yes Yes Yes Yes Yes No Yes
Public sector
wage cuts
No No No Yes Yes Yes No Yes
Public sector
job cuts
Yes Yes No Yes Yes Yes No Yes
Reorganisation Yes Yes No Yes Yes Yes No Yes

27 COCOPS Deliverable 7.2
5.3. Public sector executives’ perceptions of cutback measures
In the COCOPS survey, the perceptions of public sector executives were asked with regard to
cutback measures applied during the crisis.2 More specifically the occurrence of hiring freeze,
staff layoffs, pay freeze, pay cuts, postponing or cancelling new programmes and cuts to
existing programmes were addressed. Each executive indicated if the specific cutback
instrument had been used in his/her organisation.
When looking at the general cutback strategies, what strikes the eye immediately is that in
Norway 54% of the respondents claim that no cutback measures were applied, thus confirming
the rather indirect influence of the crisis in Norwegian public administration.
According to the responses of the public executives, hiring freeze was a prominent measure
when mitigating the crisis. In Spain 89%, in Hungary 87%, in the UK 84%, in France 83%, in
Italy 72%, in the Netherlands 66% and in Estonia 64% of the respondents claim that hiring
freeze was applied rather extensively. In Norway 71% of the respondents estimated that hiring
freeze was rather not applied, in Germany the results are mixed as a similar share of answers
fall in contradictory categories (42% vs. 48% either confirming or refuting the claim).
Figure 3. Perceived cutback measures: hiring freeze
2 When interpreting the survey results given on 1-7-point digit scales where 1 means “not at all” and 7 stands for
“to a great extent”, answers 1-3 were summarised as “rather not” and 5-7 were summarised as “rather yes”.
Similarly, meanings given on 1-7-point digit scales where 1 is “do not agree at all” and 7 is “strongly agree”,
answers 1-3 were summarised as “rather do not agree” and 5-7 were summarised as “rather do agree”.
0% 10% 20% 30% 40% 50% 60% 70% 80% 90% 100%
Norway
Germany
Estonia
Netherlands
Italy
France
United Kingdom
Hungary
Spain
Not at all To a large extent

28 COCOPS Deliverable 7.2
According to the perceptions of top-level public sector executives, staff layoffs were rarely
applied in response to crisis – in Italy 95%, in Germany 94% and in France 92% of the
respondents claimed it was a measure rather not applied at all. Also in Norway, Spain and the
Netherlands more than half of the respondents (73%; 66% and 58% respectively) claim staff
layoffs were not used. At the same time the perceptions of top officials from Hungary and
Estonia point in an opposite direction – namely 74% and 65% of the top executives state that
staff layoffs in the public sector were used to a great extent to alleviate the financial crisis. The
results from the UK speak of mixed results as a rather equal share of the respondents either
support or speak against layoffs in the British public sector.
Figure 4. Perceived cutback measures: staff layoffs
The share of respondents confirming that pay freeze was applied extensively was
overwhelming in the UK (95%), Spain (93%) and Estonia (88%). Also more than half of the
officials from Italy (61%), France (51%) and the Netherlands (51%) claimed pay freeze was
put in place. In Norway and Germany 93% and 74% of the officials respectively asserted pay
freeze was not common. In Hungary slightly more than half (59%) of the respondents
confirmed that pay freeze was not applied.
Figure 5. Perceived cutback measures: pay freeze
0% 10% 20% 30% 40% 50% 60% 70% 80% 90% 100%
Hungary
Estonia
United Kingdom
Netherlands
Spain
Norway
France
Germany
Italy
Not at all To a great extent
0% 10% 20% 30% 40% 50% 60% 70% 80% 90% 100%
Norway
Germany
Hungary
Netherlands
France
Italy
Estonia
Spain
United Kingdom
Not at all To a large extent

29 COCOPS Deliverable 7.2
Most of the respondents from Norway (98%), France (91%), Germany (83%) and the
Netherlands (81%) claimed that pay cuts were not applied when fighting the crisis. This was
confirmed to a lesser extent, i.e. by 69% of the public officials, in the UK and in Italy.
Strikingly different results are reported by the top officials from Spain and Estonia, where
respectively 93% and 64% of the respondents claim that pay cuts very applied to a great
extent. In the case of Hungary the results are rather mixed – only a relatively larger share of
the respondents estimate that pay cuts were not applied (48%) than those claiming the
opposite (37%).
Figure 6. Perceived cutback measures: pay cuts
According to the survey of public executives, postponing or cancelling new programmes to
alleviate the crisis seems to have been a relevant measure in most of the countries studied.
This is especially true in Spain, where 83% of the respondents claimed postponing or
cancelling or abandoning new programmes was used to a large extent. More than half of the
respondents estimated postponement of new programmes as relevant when coping with the
crisis in the Netherlands (66%), the UK (64%), France (59%), Hungary (58%), Estonia (54%)
and Italy (51%). In Norway 65% of the top officials claimed that new programmes were rather
not postponed or cancelled. The answers from Germany mirror mixed results, as 47% state
that new programmes were postponed or withdrawn and 39% state that programmes were
rather not postponed.
Figure 7. Perceived cutback measures: postponing/cancelling new programmes
0% 10% 20% 30% 40% 50% 60% 70% 80% 90% 100%
Spain
Estonia
Hungary
Italy
United Kingdom
Netherlands
Germany
France
Norway
Not at all To a large extent
0% 10% 20% 30% 40% 50% 60% 70% 80% 90% 100%
Norway
Germany
Italy
Estonia
Hungary
France
United Kingdom
Netherlands
Spain
Not at all To a large extent

30 COCOPS Deliverable 7.2
With regards to cutting expenditure on existing policy programmes Norway seems to stand
out as an exception where according to the majority of the respondents programmes were not
cut (66%). On the contrary, in Spain (84%), the UK (74%), the Netherlands (68%) and France
(61%) the majority of respondents claimed that cuts to existing programmes were rather
common. A slightly bigger share of the public officials claimed cuts to programmes as a
measure used often (as opposed to not often) in Hungary (44%), Germany (45%) and Italy
(49%). In the case of Estonia the results are mixed – equally 37% of the respondents claim
that programme cuts were common/uncommon.
Figure 8. Perceived cutback measures: cuts in existing policy programmes
There are some similarities but also certain differences between the outcomes of the COCOPS
survey and the country studies reported earlier. For example, it can be seen that the positive
budgetary and fiscal situation in Norway, which made it rather unnecessary to reduce the
public sector wage bill, is reflected by the Norwegian respondents who rated highest in
denying pay cuts, pay freeze and hiring freeze. Rather surprisingly, Norway did not rate the
highest in denying staff layoffs. In Germany, the special legal regime for civil servants
(Beamten) prohibits layoffs and wage cuts and even pay freeze, therefore freezing hiring (and
replacement) is the only way to realise savings in Germany, which makes the high rate in
denying hiring freeze in the survey rather surprising.
The survey confirms the general picture of the country studies that hiring and pay freeze were
widely applied but that real pay cuts and staff layoffs were rather an exception. Also, the
survey confirms that a great majority of European governments had to both cancel new
programmes and cut expenditure on existing policy programmes.
0% 10% 20% 30% 40% 50% 60% 70% 80% 90% 100%
Norway
Germany
Estonia
Hungary
Netherlands
Italy
France
United Kingdom
Spain
Not at all To a large extent

31 COCOPS Deliverable 7.2
6. Cutback decision-making
6.1. Characteristics of decision-making
This section offers an overview of the decision-making processes leading up to the fiscal
consolidation measures. Strategic characteristic of the decision-making are addressed below,
including the extent to which governments were able to reach more fundamental political
priorities in their cutback management, whether governments were able to swiftly and
centrally reach drastic decisions and whether the decisions were coherent and systematic and
aimed at long-term solutions (Peters, Pierre and Randma-Liiv 2011; see also Table 4 above).
Although this report focuses on the decision-making about fiscal consolidation, brief
contextual information will be given about preceding crisis management practices. As
mentioned before, the fiscal crisis was preceded by the banking crisis of 2008 and the
economic crisis of 2009, in which different types of decision-making practices occurred (see
more about decision-making in different phases of crisis in Kickert 2012a).
During the 2008 banking crisis, the severity, magnitude and urgency of the crisis forced
governments into very rapid and highly centralised crisis management. Only a few actors –
usually the Prime Minister, Finance Minister and President of the National Bank, assisted by a
handful of top-officials – had to take decisions under enormous time pressure. In virtually all
countries affected by the banking crisis, the decision-making was very quick and highly
centralised.
During the 2009 economic crisis, several European governments devised economic recovery
plans. However, this time the crisis was not as urgent, and decision-making followed the usual
political and parliamentary path, often including extensive consultations with employers’ and
employees’ organisations. Moreover, the crisis in some countries was not considered severe
enough to justify large extra expenditures. Decision-making during the economic crisis was
neither fundamental, nor swift, nor centralised, nor systematic, nor long-term in most
European countries.
The Eurozone crisis that erupted in 2010 provides a totally different type of decision-making
pattern, this time not restricted to domestic government decisions but a highly complex and
multi-layered co-operative decision-making by all Eurozone states together.
In 2010 most governments arrived at the stage where budget deficits – often far exceeding the
EU ceiling of three per cent of GDP – required fiscal consolidation measures. In the
beginning, many political and social actors were far from being convinced of the need for
expenditure cutbacks and, for example, debated the strictness of the European deficit limit,
thus slowing down the decision-making process. However, as seen below, as the need for
more radical cutbacks grew, governments tended to centralise their decision-making
processes.
The following examples from the country studies illustrate the various characteristics of the
cutback decision-making process during the fiscal crisis and consolidation phase.

32 COCOPS Deliverable 7.2
In Belgium the federal government decision-making on fiscal consolidation was constrained.
The federal government has the authority in taxation and social security, but the regional and
community governments have the authority in most of the expenditure categories. The party
composition of the federal government differed from the Flemish and Walloon government
coalitions, making mutual cooperation difficult. The relatively prosperous Flemish
government might have the opportunity to carry out expenditure cuts but knew that a budget
surplus would automatically compensate for the deficit of the economically poor Wallonia and
therefore lacked the incentive to do so. Federal fiscal consolidation therefore mainly focused
on revenue measures. In 2011 fiscal consolidation measures were taken after extreme pressure
of the European Union and the falling credit ratings of Standard & Poors. The Belgian 2010-
2011 coalition formation was more concerned with Flemish-Walloon political language-group
conflicts and the reform of the Finance Act than with the specific priority-setting for
consolidation.
As the Estonian government opted for radical cutbacks at the beginning of the crisis, the
decision-making was swift and drastic from the outset of the crisis. The fiscal crisis led to an
increased role of the Ministry of Finance in setting the targets for the cuts in programme
expenditures that were imposed on the line-ministries. Within ministries the budget units also
gained an increased influence over the policy units. Furthermore, the Ministry of Finance
appointed representatives into some of the boards of state foundations and enterprises. Central
hierarchical control was enhanced. On the other hand, the operational expenditure cuts mainly
were across-the-board measures, leaving line ministries free in deciding on their own
cutbacks.
In France the new 2007 right-wing government and President Sarkozy were well aware of
budgetary difficulties. Sarkozy had been Minister of Economics and Finances earlier and had
initiated reforms in public finances. President Sarkozy strengthened his leadership and
centralised his control of the government by frequently chairing inter-ministerial council
meetings and by tightening the control over ministries through a small number of close top
officials from the financial spheres. For a considerable period of time the government
hesitated between cutback and economic stimulus measures. The policy was framed in the
neologism “ri-lance”, a combination of the two words “rigueur” (rigour) and “relance”
(stimulus). The result was a combination of (1) an economic recovery plan for 2009-2010 with
extra spending of 26 billion, associated with several cutback measures that were not directly
linked to the crisis, and (2) the launching of a number of cutback measures beginning in 2010.
In Germany, due to the crisis the budget procedure has been centralised and budget discipline
strengthened. When German government in 2009 devised its two consecutive economic
recovery plans, at the same time a constitutional debt brake (“Schuldenbremse”) was adopted.
Part of the “federalism reforms” initiated in 2006 by the Christian-Socialist two-third majority
coalition enabling a number of constitutional amendments, the “Schuldenbremse” enacted
structurally balanced budgets for both the federal and regional “Länder” governments from
2016 and 2020 on, respectively. Secondly, the government proposed a “top-down budget
procedure” at the federal-government level in 2010 by granting the Finance Minister more
central power to curb excessive spending of ministries. As of 2011 the Finance Minister
determined multi-year budget ceilings for each ministry, within which limits the ministries
received a higher degree of autonomy to achieve their budgetary targets. Thirdly, a “Stability
Council” was installed, consisting of the Minister of Finance, the Minister of Economy and
the Finance Ministers of the “Länder”. The Council regularly monitors the budgets of the
federal and “Länder” governments based on a set of indicators.

33 COCOPS Deliverable 7.2
In Iceland, the consolidation measures led to immediate reforms aiming at a stronger, more
centralised state with improved coordination capacities. The Coalition Statement of the first-
ever left-wing government in Iceland foresaw the strengthening of the centre of government
by granting more power to the Prime Minister’s Office. The roles of a Prime Minister and
Cabinet committees were further elaborated in order to increase their responsibility in policy
coordination. The responsibilities of ministers for taking initiative and steering their respective
policy fields were better established. The need for closer control of the government by the
Icelandic Parliament “Althingi” was recognised by re-organising parliamentary committees
and enhancing their power of scrutiny. Finally, greater restrictions on the financial autonomy
of local governments were considered necessary, although a new Local Government Act also
included trends towards decentralisation by introducing new ways of citizen participation at
the local level. The left-wing government also aimed at increasing consultations with the
labour-market partners and entered a “stability contract” with unions.
In Ireland, a form of corporatist bargaining between major interest groups and government
was a prominent feature during the 1987-2010 period, but this has disappeared in the context
of the crisis and more centralised control of economic policy. The crisis led to two important
institutional changes at the centre of the government. First, a new ministry, the Department of
Public Expenditure and Reform, was created. This new department broke the duopoly in the
Irish government in which decision-making power was shared, and contested, between the
Finance and Prime Minister’s Departments. Assuming functions from these two departments,
the new department combined revenue-expenditure functions with public service
management, reform and industrial-relations issues. The manifestation of the political
commitment to reform in the new ministry was driven not only by the need for fiscal
discipline as demanded under the EU-ECB-IMF conditionality, but also by the desire for more
centralised control of the public sector and more standardised governance and accountability
arrangements across the public service. Second, an Economic Management Council was
established as a form of Cabinet “super-committee” containing a small group of senior
Ministers (including the Prime Minister or “Taoiseach”) and advisers to manage the Troika
loan programme and related reforms. These developments refer to the tendency to centralise
decision-making in a crisis and to facilitate fast and swift responses of the government.
In Italy the government responded to the fiscal crisis by setting up a systematic approach for
controlling and revising public finances, patterned on the British “spending review” approach.
The Monti government launched the spending review at the end of 2011 to tighten the control
of public debt and adopt a more targeted approach to cutbacks. Earlier attempts to overcome
the predominant cheese-slicing approach by the Prodi and Berlusconi governments had failed.
In 2011 the crisis became so acute that the Berlusconi government started a spending review
experiment, which was interrupted by the resignation of Berlusconi. In order to support its
planned reform of social security and health care, the new Monti government launched a new
spending review with a special support structure, which resulted in a report on Public
Expenditures indicating the size and distribution of cuts as well as the most “attackable” issues
in April 2012. However, it did not manage to break through the predominance of across-the-
board tools, due to the weakness of the political system.
In Lithuania, major consolidation measures were announced literally overnight. For example,
the Lithuanian tax reform at the end of 2008 was dubbed “the night reform”. More than 100
tax rules were decided upon and came into effect in some instances only one week after their
adoption. Austerity decisions were both large and swift. The hasty nature of decision-making
did not allow for an adequate “ex ante” assessment or proper consultation with social actors.

34 COCOPS Deliverable 7.2
Lithuania’s response to the fiscal crisis tended to centralise the decision-making process by the
reduction in the number of appropriation managers and through the reorganisation of
government agencies into the agencies under the ministries in order to increase the authority
of ministers to politically control government expenditure and agency performance.
Consequently, not only centralisation increased but also the importance of politicians in the
decision-making process. The government-wide spending cuts were initially cascaded to the
programme level on the top-down basis with little differentiation applied across the
organisations and programmes, following the across-the-board pattern. Since the end of 2009,
the government granted more decision-making autonomy over the cuts to political and
administrative executives by employing a more managerial approach.
In the Netherlands the Central Planning Bureau performs a strong and central role in the
budget procedure. The multi-year economic forecasts of the Bureau are undisputedly accepted
by the government and by virtually all political parties as the starting point for the annual
budget preparation. In times of general election the role of the Bureau becomes even stronger.
Besides preparing the macro-economic figures that form the input for the (budgetary
deliberations during the) coalition formation, it economically checks the election programmes
of all political parties and economically checks the outcomes of the coalition agreement.
In the United Kingdom, the majoritarian political system enabled the new 2010 government to
take swift, central and drastic decisions. The 2010 general elections did not yield a single
winning party, and a coalition was formed between the ideologically opposed Conservatives
and Liberal-Democrats. Although the coalition required extensive consultation between the
two parties, both parties broadly agreed on the need to cut the budget deficit, and the
Cameron-Clegg coalition cabinet very quickly agreed upon a drastic retrenchment package,
rapidly worked it out in an “emergency budget” and within months finalised its details in the
annual budget. The UK has a tradition of strong central leadership of the Cabinet Office and
strong control exercised by the Treasury. In the British government the core executive has a
high capacity to control spending, although the implementation of spending cuts may not be
straightforward.
The following table summarises characteristics of the decision-making process country by
country. In the case of all indicators, the prevailing characteristic is indicated.
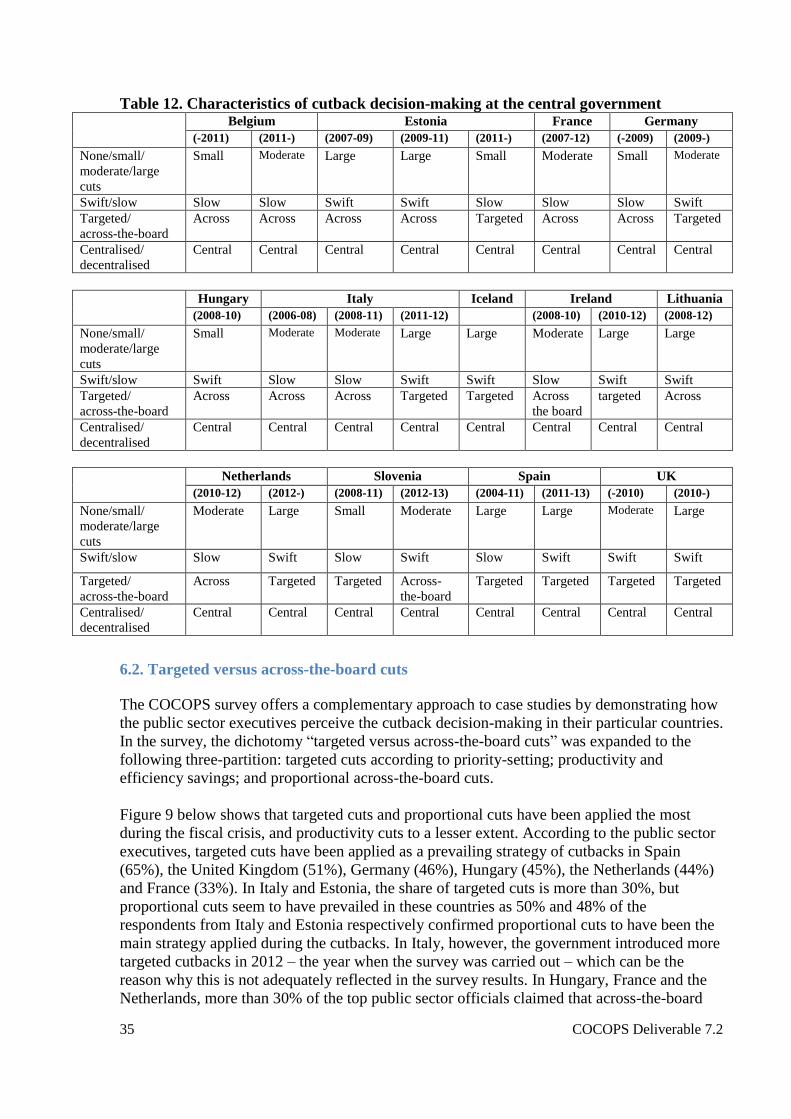
35 COCOPS Deliverable 7.2
Table 12. Characteristics of cutback decision-making at the central government
Belgium Estonia France Germany
(-2011) (2011-) (2007-09) (2009-11) (2011-) (2007-12) (-2009) (2009-)
None/small/
moderate/large
cuts
Small Moderate Large Large Small Moderate Small Moderate
Swift/slow Slow Slow Swift Swift Slow Slow Slow Swift
Targeted/
across-the-board
Across Across Across Across Targeted Across Across Targeted
Centralised/
decentralised
Central Central Central Central Central Central Central Central
Hungary Italy Iceland Ireland Lithuania
(2008-10) (2006-08) (2008-11) (2011-12) (2008-10) (2010-12) (2008-12)
None/small/
moderate/large
cuts
Small Moderate Moderate Large Large Moderate Large Large
Swift/slow Swift Slow Slow Swift Swift Slow Swift Swift
Targeted/
across-the-board
Across Across Across Targeted Targeted Across
the board
targeted Across
Centralised/
decentralised
Central Central Central Central Central Central Central Central
Netherlands Slovenia Spain UK
(2010-12) (2012-) (2008-11) (2012-13) (2004-11) (2011-13) (-2010) (2010-)
None/small/
moderate/large
cuts
Moderate Large Small Moderate Large Large Moderate Large
Swift/slow Slow Swift Slow Swift Slow Swift Swift Swift
Targeted/
across-the-board
Across Targeted Targeted Across-
the-board
Targeted Targeted Targeted Targeted
Centralised/
decentralised
Central Central Central Central Central Central Central Central
6.2. Targeted versus across-the-board cuts
The COCOPS survey offers a complementary approach to case studies by demonstrating how
the public sector executives perceive the cutback decision-making in their particular countries.
In the survey, the dichotomy “targeted versus across-the-board cuts” was expanded to the
following three-partition: targeted cuts according to priority-setting; productivity and
efficiency savings; and proportional across-the-board cuts.
Figure 9 below shows that targeted cuts and proportional cuts have been applied the most
during the fiscal crisis, and productivity cuts to a lesser extent. According to the public sector
executives, targeted cuts have been applied as a prevailing strategy of cutbacks in Spain
(65%), the United Kingdom (51%), Germany (46%), Hungary (45%), the Netherlands (44%)
and France (33%). In Italy and Estonia, the share of targeted cuts is more than 30%, but
proportional cuts seem to have prevailed in these countries as 50% and 48% of the
respondents from Italy and Estonia respectively confirmed proportional cuts to have been the
main strategy applied during the cutbacks. In Italy, however, the government introduced more
targeted cutbacks in 2012 – the year when the survey was carried out – which can be the
reason why this is not adequately reflected in the survey results. In Hungary, France and the
Netherlands, more than 30% of the top public sector officials claimed that across-the-board

36 COCOPS Deliverable 7.2
cuts were executed during the retrenchment period. Cuts based on productivity appear to have
been the least popular. According to the public sector executives in France, the United
Kingdom and Germany, the share of productivity cuts was 30%, 27% and 25% respectively.
The trio is followed by the Netherlands (19%), Estonia (13%) and Norway (12%), where the
proportion of targeted cutbacks ranged between 10% and 20%. In Italy, Spain and Hungary,
the share of cuts based on productivity was estimated to be less than 10%.
Figure 9. Perceived types of decision-making by European public sector executives
Norway has hardly experienced an economic and fiscal crisis, so it is not surprising that the
survey yielded the highest outcome of “no cutbacks” regarding this question. The drastic and
fundamental cutbacks taking place in Spain and the UK are confirmed by the relatively high
outcome of “targeted cuts” in the survey. At the same time, large cuts in Estonia and Lithuania
were carried out by using across-the-board cuts as prevailing cutback strategies. In other
countries like France, Germany, the Netherlands and Italy the relatively high perception of
“targeted cuts” in the survey somewhat differs from the information provided by country
studies. The survey results also show that often it is not possible to draw a clear-cut line
between targeted and across-the-board cuts. Most often, governments tend to use a
combination of the two leading to a wide variety in the perceptions of public sector
executives.
6.3. Stages of cutback decision-making
Decision-making on fiscal consolidation and cutback measures is usually not a one-off event,
but it consists of a series of decision-making stages. It seems likely that the decision-making
over the fiscal cutbacks of the 2010s follows a similar trajectory as in the 1980s in most of the
European countries (see Table 5 above). The first cutback decisions in most countries took
place in 2009-2010, and subsequent rounds of further cutbacks followed as the financial-
economic crisis persisted. In the beginning, the decisions tended to be moderate and
temporary, as the actors were unwilling to believe that the crisis and the need to undertake cuts
were real. In the majority of European countries, the first cutback plans met with protest and
resistance from the political left, trade unions and other interest groups affected.
0%
10%
20%
30%
40%
50%
60%
70%
80%
90%
100%
None
Productivity cuts
Proportional cuts
Targeted cuts

37 COCOPS Deliverable 7.2
Consequently, in the great majority of European countries, cuts were postponed or planned for
later years, as the crisis was believed to be over soon (called the “tooth fairy syndrome” by
Levine 1979). Later the decisions became less hesitant but still addressed rather small
adjustments. Consequently, initial rounds of small and incremental cutbacks had been
undertaken in most European countries by 2013 (with Norway being a clear exception here).
Governments gradually became aware that the crisis was more severe and persistent.
Moreover, one could also argue that the initial (modest) cutbacks were among factors
contributing to aggravating the crisis. Other stages of more serious cutbacks have followed,
especially in the countries hit the hardest by the crisis. This shows that it took several
decision-making rounds before the gravity and duration of the crisis was fully comprehended
and decisions came to be serious and resolute. In some countries, attempts to set political
priorities and to arrive at more targeted cutback-decisions have been made.
The following country examples illustrate various stages of cutback decision-making in
selected European countries.
Estonia. Estonia was among the first European countries hit by the crisis. Despite the denial in
the beginning, the severity of the crisis was quickly realised leading to fast operational cuts.
The coalition government took its fiscal consolidation measures in three successive
supplementary budgets. In the June 2008 austerity package, nearly half of the expenditure cuts
were about operational costs, mainly by curtailing personnel expenditures through dismissals,
salary cuts, work-time reduction and lay-offs. In January 2009, the operational expenditures
were once again curtailed, amounting to a total of 22 per cent within one year. This second
cutback package contained fewer dismissals but a further reduction of civil service salaries.
The second and third cutback packages of June 2009 also introduced cuts in programme
expenditures (social security, pension, health, etc.).
Iceland. The severe banking crisis in Iceland in October 2008 did not leave room for crisis
denial, postponement of consolidation measures or temporary solutions. According to the
Emergency Act following the banking crisis immediately, the Financial Supervisory Authority
was granted extraordinary powers to address the fall of the three banks representing 85% of
the banking system of the country. The cutback decision-making was swift and drastic, partly
imposed by the IMF. Interestingly, the Icelandic government did not opt for across-the-board
cuts, but immediately chose fundamental priority-setting. Such a targeted approach, in turn,
required the strengthening of the leadership role of the Prime Minister’s office.
Ireland. Between summer 2008 and spring 2012, Ireland had eight episodes of fiscal
adjustment. There is no evidence of remarkable crisis denial, postponement of cuts or major
temporary measures applied. The severity of the crisis was quickly recognised by the
government and cemented by the Troika loan programme leading to a combination of
spending cuts and increased taxation. The first round of consolidation measures relied upon
efficiency cuts, moving gradually to across-the-board measures in operational expenditures
(e.g. recruitment embargo across all sectors, cuts to public sector pay as a “pension levy”, pay
freeze), and from there to targeted capital cuts particularly affecting the health services,
environment and transportation sectors, as well as targeted cuts in a range of cultural and arts
activities.
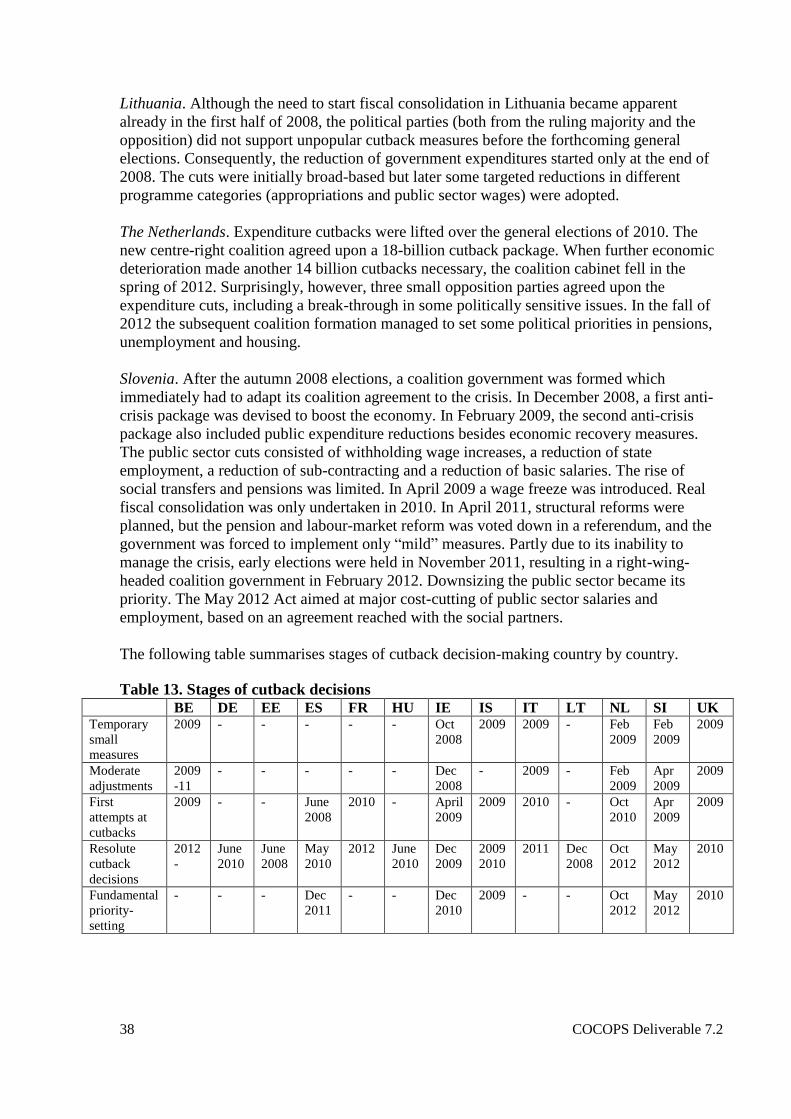
38 COCOPS Deliverable 7.2
Lithuania. Although the need to start fiscal consolidation in Lithuania became apparent
already in the first half of 2008, the political parties (both from the ruling majority and the
opposition) did not support unpopular cutback measures before the forthcoming general
elections. Consequently, the reduction of government expenditures started only at the end of
2008. The cuts were initially broad-based but later some targeted reductions in different
programme categories (appropriations and public sector wages) were adopted.
The Netherlands. Expenditure cutbacks were lifted over the general elections of 2010. The
new centre-right coalition agreed upon a 18-billion cutback package. When further economic
deterioration made another 14 billion cutbacks necessary, the coalition cabinet fell in the
spring of 2012. Surprisingly, however, three small opposition parties agreed upon the
expenditure cuts, including a break-through in some politically sensitive issues. In the fall of
2012 the subsequent coalition formation managed to set some political priorities in pensions,
unemployment and housing.
Slovenia. After the autumn 2008 elections, a coalition government was formed which
immediately had to adapt its coalition agreement to the crisis. In December 2008, a first anti-
crisis package was devised to boost the economy. In February 2009, the second anti-crisis
package also included public expenditure reductions besides economic recovery measures.
The public sector cuts consisted of withholding wage increases, a reduction of state
employment, a reduction of sub-contracting and a reduction of basic salaries. The rise of
social transfers and pensions was limited. In April 2009 a wage freeze was introduced. Real
fiscal consolidation was only undertaken in 2010. In April 2011, structural reforms were
planned, but the pension and labour-market reform was voted down in a referendum, and the
government was forced to implement only “mild” measures. Partly due to its inability to
manage the crisis, early elections were held in November 2011, resulting in a right-wing-
headed coalition government in February 2012. Downsizing the public sector became its
priority. The May 2012 Act aimed at major cost-cutting of public sector salaries and
employment, based on an agreement reached with the social partners.
The following table summarises stages of cutback decision-making country by country.
Table 13. Stages of cutback decisions
BE DE EE ES FR HU IE IS IT LT NL SI UK Temporary
small
measures
2009 - - - - - Oct
2008
2009 2009 - Feb
2009
Feb
2009
2009
Moderate
adjustments
2009
-11
-
- - - - Dec
2008
- 2009 - Feb
2009
Apr
2009
2009
First
attempts at
cutbacks
2009 - - June
2008
2010 - April
2009
2009 2010 - Oct
2010
Apr
2009
2009
Resolute
cutback
decisions
2012
-
June
2010
June
2008
May
2010
2012 June
2010
Dec
2009
2009
2010
2011 Dec
2008
Oct
2012
May
2012
2010
Fundamental
priority-
setting
- - - Dec
2011
- - Dec
2010
2009 - - Oct
2012
May
2012
2010

39 COCOPS Deliverable 7.2
European countries have passed through such decision-making stages at a varying pace. As a
rule of thumb, countries hit the hardest by the crisis have reached the later stages of decision-
making faster. The majority of European countries have followed a gradual development from
crisis denial to temporary to moderate measures leading finally to more radical cutbacks (if
necessary). With the exception of Germany, virtually no country could escape the measure to
freeze hiring and pay, and to set caps on replacements. The latter resembles the responses to
the fiscal crisis of the 1980s when this was typically the first modest step in curbing
administrative expenditures. It was only in the later stages of further mounting budgetary
deficits that governments were forced to introduce the politically much more contested
measures of actually reducing wages and employment. Cutbacks were made in several rounds
with the measures increasing in severity.
There are also a few exceptions to this general pattern that could offer two alternative
trajectories to the mainstream approach. First, the Estonian and Lithuanian governments
decisively skipped modest measures and opted quickly after the outset of the crisis towards
resolute cutbacks. Second, those European countries that had to request financial assistance
from IMF, EU and ECB, like Iceland, Ireland, Italy and Spain, received the bail-outs on the
condition that the public sector wage bill had to be reduced, leading to far more than only
hiring and pay freeze, that is to substantial cuts in public sector salaries and employment. The
conditionality of the Troika has forced governments swiftly towards radical cutback measures
without giving the governments leeway in delaying cuts and/or slowly introducing more
modest cutback measures.

40 COCOPS Deliverable 7.2
7. Explanatory Factors
7.1 Financial-economic factors
In this section some macro-economic indicators for all the selected countries are provided to
characterise the depth of the crisis. This forms an important contextual background as the
“financial size” of the economic and fiscal crisis is likely to affect the “financial size” of the
consolidation measures. From an economic perspective, these data do not only indicate the
degree of the financial, economic and fiscal crisis but are also important indicators of a
country’s performance in managing the fiscal crisis. Although the influence of a domestic
government’s fiscal consolidation policy on its GDP, GDP growth rate and unemployment can
be questioned, gross debt and especially budget deficit can be considered to reflect the extent
of the government’s fiscal consolidation efforts.
Figure 10 offers an overview of the GDP growth rate in European countries. Among the
countries included in this report, the GDP started to decline in 2006, when Estonia and
Hungary faced a three-percentage-point drop after an unprecedented boom following the
accession to the EU. The fast economic growth in Central and Eastern Europe was fuelled by
cheap credits available through foreign-owned banks, which increased domestic demand and
which were channelled into real estate, financial services and private consumption. This was
accompanied by overheating of the economy, a soaring current account deficit, high inflation,
a housing boom, and accelerating wage growth but slow gains in productivity (Kattel and
Raudla 2013). In several Central and Eastern European countries, the domestic bubbles burst
already in early 2008, which was further exacerbated by negative developments in the external
economic environment after the Lehman Brothers’ bankruptcy.
After the 2008 banking crisis, which accelerated the economic decline, the low point was
reached in 2009, when all the studied countries faced negative growth – more than 14% in
Estonia and Lithuania, more than 5% in Germany, Hungary, Iceland, Ireland, Italy and
Slovenia, and less than 5% in Belgium, France, the Netherlands, Norway, Spain and the UK.
By 2010 most countries had recovered, with only Iceland, Ireland and Spain having a negative
growth rate. In most of the countries, the GDP increased up to 2011 and then dropped again,
in others the decrease started already in 2010.

41 COCOPS Deliverable 7.2
Figure 10. GDP growth 2006-2012 (Eurostat)
In all European countries the budget deficit underwent a sharp deterioration in 2008-2009 after
the costly rescue measures during the banking crisis and recovered afterwards (see Figure 11).
During the peak years of the crisis, general government surplus was present only in Norway,
while the deterioration was by far the sharpest in Iceland due to the large share of banking in
the economy and respective rescue measures applied after the major banking crisis.
Figure 11. General government surplus/deficit (per cent of GDP) (Eurostat)
-16
-14
-12
-10
-8
-6
-4
-2
0
2
4
6
8
10
2006 2007 2008 2009 2010 2011 2012
Estonia
Lithuania
Slovenia
Ireland
Iceland
Spain
Hungary
Germany
Netherlands
Belgium
United Kingdom
France
Norway
Italy
-32
-28
-24
-20
-16
-12
-8
-4
0
4
8
12
16
20
2006 2007 2008 2009 2010 2011 2012
Norway
Iceland
Ireland
Estonia
Spain
Netherlands
Belgium
Lithuania
Slovenia
Germany
France
United Kingdom
Italy
Hungary
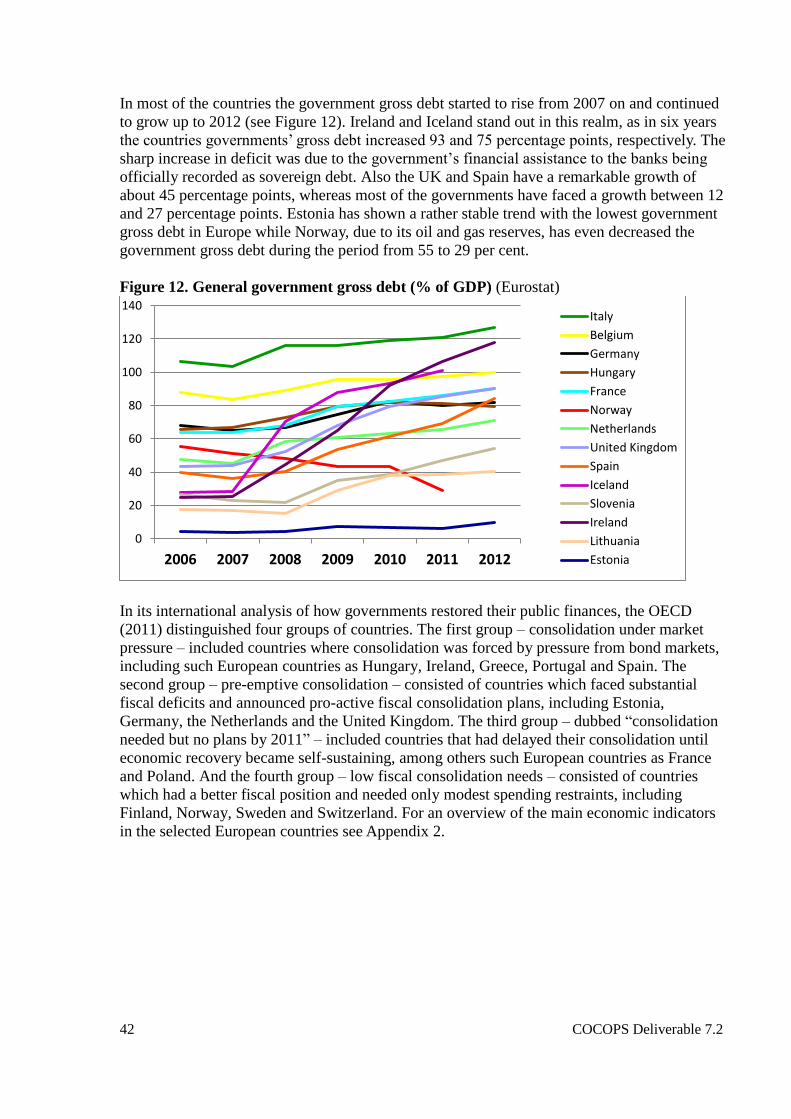
42 COCOPS Deliverable 7.2
In most of the countries the government gross debt started to rise from 2007 on and continued
to grow up to 2012 (see Figure 12). Ireland and Iceland stand out in this realm, as in six years
the countries governments’ gross debt increased 93 and 75 percentage points, respectively. The
sharp increase in deficit was due to the government’s financial assistance to the banks being
officially recorded as sovereign debt. Also the UK and Spain have a remarkable growth of
about 45 percentage points, whereas most of the governments have faced a growth between 12
and 27 percentage points. Estonia has shown a rather stable trend with the lowest government
gross debt in Europe while Norway, due to its oil and gas reserves, has even decreased the
government gross debt during the period from 55 to 29 per cent.
Figure 12. General government gross debt (% of GDP) (Eurostat)
In its international analysis of how governments restored their public finances, the OECD
(2011) distinguished four groups of countries. The first group – consolidation under market
pressure – included countries where consolidation was forced by pressure from bond markets,
including such European countries as Hungary, Ireland, Greece, Portugal and Spain. The
second group – pre-emptive consolidation – consisted of countries which faced substantial
fiscal deficits and announced pro-active fiscal consolidation plans, including Estonia,
Germany, the Netherlands and the United Kingdom. The third group – dubbed “consolidation
needed but no plans by 2011” – included countries that had delayed their consolidation until
economic recovery became self-sustaining, among others such European countries as France
and Poland. And the fourth group – low fiscal consolidation needs – consisted of countries
which had a better fiscal position and needed only modest spending restraints, including
Finland, Norway, Sweden and Switzerland. For an overview of the main economic indicators
in the selected European countries see Appendix 2.
0
20
40
60
80
100
120
140
2006 2007 2008 2009 2010 2011 2012
Italy
Belgium
Germany
Hungary
France
Norway
Netherlands
United Kingdom
Spain
Iceland
Slovenia
Ireland
Lithuania
Estonia
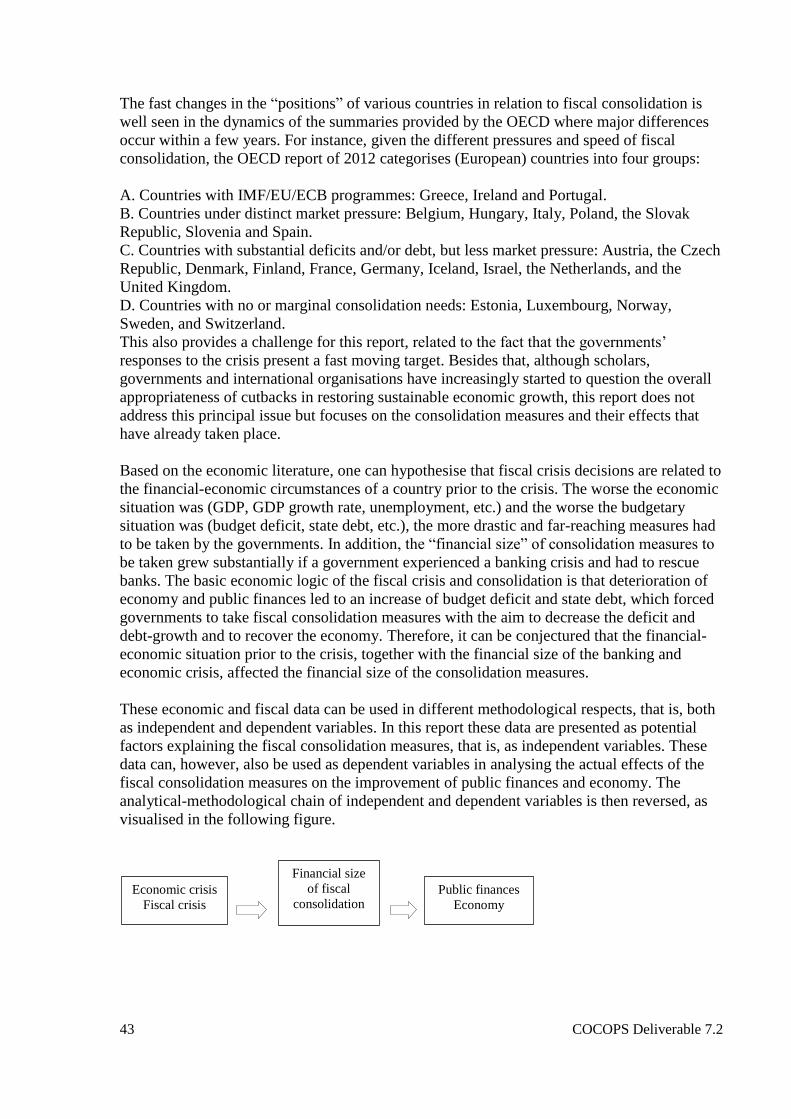
43 COCOPS Deliverable 7.2
The fast changes in the “positions” of various countries in relation to fiscal consolidation is
well seen in the dynamics of the summaries provided by the OECD where major differences
occur within a few years. For instance, given the different pressures and speed of fiscal
consolidation, the OECD report of 2012 categorises (European) countries into four groups:
A. Countries with IMF/EU/ECB programmes: Greece, Ireland and Portugal.
B. Countries under distinct market pressure: Belgium, Hungary, Italy, Poland, the Slovak
Republic, Slovenia and Spain.
C. Countries with substantial deficits and/or debt, but less market pressure: Austria, the Czech
Republic, Denmark, Finland, France, Germany, Iceland, Israel, the Netherlands, and the
United Kingdom.
D. Countries with no or marginal consolidation needs: Estonia, Luxembourg, Norway,
Sweden, and Switzerland.
This also provides a challenge for this report, related to the fact that the governments’
responses to the crisis present a fast moving target. Besides that, although scholars,
governments and international organisations have increasingly started to question the overall
appropriateness of cutbacks in restoring sustainable economic growth, this report does not
address this principal issue but focuses on the consolidation measures and their effects that
have already taken place.
Based on the economic literature, one can hypothesise that fiscal crisis decisions are related to
the financial-economic circumstances of a country prior to the crisis. The worse the economic
situation was (GDP, GDP growth rate, unemployment, etc.) and the worse the budgetary
situation was (budget deficit, state debt, etc.), the more drastic and far-reaching measures had
to be taken by the governments. In addition, the “financial size” of consolidation measures to
be taken grew substantially if a government experienced a banking crisis and had to rescue
banks. The basic economic logic of the fiscal crisis and consolidation is that deterioration of
economy and public finances led to an increase of budget deficit and state debt, which forced
governments to take fiscal consolidation measures with the aim to decrease the deficit and
debt-growth and to recover the economy. Therefore, it can be conjectured that the financial-
economic situation prior to the crisis, together with the financial size of the banking and
economic crisis, affected the financial size of the consolidation measures.
These economic and fiscal data can be used in different methodological respects, that is, both
as independent and dependent variables. In this report these data are presented as potential
factors explaining the fiscal consolidation measures, that is, as independent variables. These
data can, however, also be used as dependent variables in analysing the actual effects of the
fiscal consolidation measures on the improvement of public finances and economy. The
analytical-methodological chain of independent and dependent variables is then reversed, as
visualised in the following figure.
Economic crisis
Fiscal crisis
Financial size
of fiscal
consolidation
Public finances
Economy

44 COCOPS Deliverable 7.2
7.2. Political-administrative factors
Whether the political system is a majoritarian or consensus democracy (single-party cabinet or
coalition government) normally affects the possibility for swift and drastic decision-making.
Furthermore, the relative power of the key decision-makers (like the prime minister) affects
the speed and scope of crisis actions. In addition, the relationship between politicians and
bureaucrats (Peters and Pierre 2004) affects the decision-making environment. Besides these
characteristics of political systems, the speed and size of the crisis measures are related to the
actual ideological composition of a country’s government. Conservative (Liberal) parties tend
to advocate quicker and more drastic balancing of the books than Social Democrats or
progressive Liberals. Lastly, the size and speed of crisis actions are related to the decision-
making processes in government, politics and administration. Managing an urgent and severe
crisis (Boin et al. 2008) can be a different process from politicised multi-party decision-
making about the budget (Kickert 2012a).
State system
States can have a unitary, decentralised or federal structure. Various degrees of
decentralisation exist (Italy, Spain) and various degrees of federalism (Belgium, Germany)
according to a number of factors like the following: number of autonomous regions (Spain),
authorities and responsibilities of regions (legal and budgetary), fundamental conflicts and
political polarisation (Flanders-Wallonia. Madrid-Catalonia/Basque), degree of instability.
Unitary states are supposedly more capable to pursue comprehensive and coherent (cutback)
policies than decentralised or federal states.
Political system
In majoritarian political systems one single party wins a parliamentary majority at the general
elections and forms a single-party government. This is supposedly more stable than multi-
party coalition governments. In multi-party consensual political systems no single party
obtains a parliamentary majority. Parliamentary decisions are reached by compromises
between a number of parties. According to Lijphart’s (1974) theory of consensus democracy,
in such a system political stability is maintained because the leaders of the different political
parties reach pragmatic compromises and control their rank and file. The usual pattern is
lengthy multi-party deliberation, consultation and compromising. The stability and complexity
of consensual politics depend on various factors like the following: the number of parties, the
number and degree of ideological differences, political polarisation (Flemish versus Walloons
in Belgium, in the 2000s a surge of right-populist anti-Muslim parties), a degree of instability
(frequent government turnovers and elections). It is expected that majoritarian systems are
able to reach decisions upon fiscal consolidation more easily and quickly.
Government
A basic distinction is made between the majoritarian system with a single-party government
(UK until 2010, France, Spain), and the consensual system with a multi-party coalition
cabinet. A further sub-distinction within single-party governments is that between a cabinet
system (UK, Spain) and a presidential system (France). A single-party government allegedly
is more capable to take swift and drastic decisions than a multi-party coalition government. A
further sub-distinction within multi-party coalition governments can be made between a grand
parliamentary majority (Germany 2006-2010, Hungary since 2010), a simple (minimal-

45 COCOPS Deliverable 7.2
winning) majority and a parliamentary minority coalition (Estonia 2009-, Netherlands 2010-
2012, Lithuania 2011-2012). It can be assumed that minority governments face major
problems in making decisions upon and implementing unpopular consolidation measures.
The following table summarises the characteristics of the state and government systems in the
countries studied.
Table 14. State and government characteristics. Characteristics of government
Belgium Estonia France Germany
(-2011) (2011-) (2007-09) (2009-11) (2011-) (2007-12) (-2009) (2009-)
Unitary-
decentral.-
federal
Federal Federal Unitary Unitary Unitary Decentral. Federal Federal
Single-
party/coalition
Coalitio
n
Coalition Coalition Coalition Coalition Single Coalition Coalition
Left/centre/
right-wing
cabinet
Left-
centre-
right
Left-
centre-
right
Right-
centre-left
Right-
centre-left
Right-
centre-
left
Right Centre-
left
Centre-
right
Grand/normal/
minority
Grand Grand Normal-
minority
Minority Normal Normal Grand Normal
Stable/unstable
coalition
Unstable Stable Unstable Stable Stable Stable Stable Stable
Hungary Italy Ireland Iceland Lithuania
(2008-10) (2006-08) (2008-11) (2011-12) (2008-11) (2011-13) (2008-12)
Unitary/decent
ral./federal
Unitary Decentral. Decentral. Decentral. Unitary Unitary Unitary Unitary
Single-
party/coalition
Coalition Coalition Coalition Coalition Coalition Coalition Coalition Coalition
Left/centre/
right-wing
cabinet
Centre-
left
Centre-left Centre-
right
Non-
political
Centre -
right
Centre-
left
Left Centre-
right
Grand/normal/
minority
Normal Normal Normal Grand Normal Normal Normal
(minority
from
2011)
Normal-
minority
Stable/unstabl
e coalition
Unstable Unstable Unstable Unstable Unstable Stable Unstable Unstable
Netherlands Slovenia Spain UK
(2010-12) (2012-) (2008-11) (2012-13) (2004-11) (2011-) (-2010) (2010-)
Unitary/decent
ral./federal
Unitary Unitary Unitary Unitary Decentral. Decentral. Unitary Unitary
Single-
party/coalition
Coalition Coalition Coalition Coalition Single Single Single Coalition
Left/centre/
right-wing
cabinet
Centre-right Right-
left
Left Right Left Right Left Right-
centre
Grand/normal/
minority
Minority Normal Normal Normal Normal Grand Normal Normal
Stable/unstabl
e coalition
Unstable Stable Unstable Unstable Stable Stable Stable Stable

46 COCOPS Deliverable 7.2
These characteristics of state, political system and government are primarily used as
explanatory factors for analysing the political cutback decision-making. The usual assumption
in international comparative political science research – that unitary states are more capable to
take swift, drastic and uniform decisions than federal states – is confirmed in the cases of
Belgium and Spain, but rejected in the case of Germany. The Belgian case seems to provide
an example of the high complexity of a federal state hindering resolute political decision-
making. The reason why the Spanish Zapatero government did not succeed in taking drastic
cutback decisions, however, seems to be related to issues other than its state structure.
The usual political science assumption that single-party governments are more capable to take
swift and drastic decisions is not confirmed by our data on cutback decision-making. On the
contrary, during the single-party Labour government under Prime Minister Brown, the
government of the UK did explicitly refrain from taking harsh cutback decisions. It was the
2010 Conservative-Liberal-Democrat Cameron-Clegg coalition cabinet that took drastic and
swift cutback decisions. Under President Sarkozy, France did not take drastic cutback
decisions. And the single-party government under Prime Minister Zapatero in Spain did
prepare drastic cutbacks under the pressure of the EU and IMF, but the massive protests and
demonstrations forced it to call new elections, which it lost. At the same time, coalition
governments in both Estonia and Lithuania were capable of carrying out swift and radical
cutback measures.
Cutback decisions were usually reached in the preparation of the annual budget or
supplementary budgets, which follow particular formal procedures. Several governments
attempting to prepare decisions on new cutbacks lost support of some coalition partner(s) and
either became minority cabinets (Estonia, Lithuania) or fell (Italy, the Netherlands). In Spain
the preparation of a new cutback package led to such massive popular protests that the
Zapatero government called new elections, which it lost.
The traditional assumption in political science that minority coalition governments are less
capable to take swift and drastic decisions than simple or grand coalitions, is partly confirmed
and partly rejected. The Estonian coalition government fell in 2009 because of the
disagreements on cutbacks, but the new right-wing minority coalition was able to decide
swiftly on major consolidation measures. By contrast, the centre-right minority coalition fell
in the Netherlands because it did not succeed to prepare drastic cutbacks and had to call new
elections. However, in Denmark, with its long tradition of minority coalitions, a similar
centre-right minority cabinet, supported by a similar right-populist party as in the Netherlands,
did take drastic cutback decisions, and moreover did so right before approaching general
elections. And the grand Christian-Social-Democrat coalition in Germany postponed the
unpopular decision-making about fiscal consolidation and cutbacks till after the general
elections.
Electoral cycle
In most European countries (with the clear exception of Estonia and Lithuania) governments
did not have the political courage to take and implement harsh unpopular cutback measures in
sight of forthcoming general elections. The difficult decisions were deferred to the next office-
holders. In many countries this meant that the first round of fiscal consolidation decisions
coincided with the formation of a new coalition cabinet, which in multi-party consensual
politics normally is a hectic process of lengthy and delicate deliberations and consultations
with many different actors, intricate compromise and consensus searching, which hardly
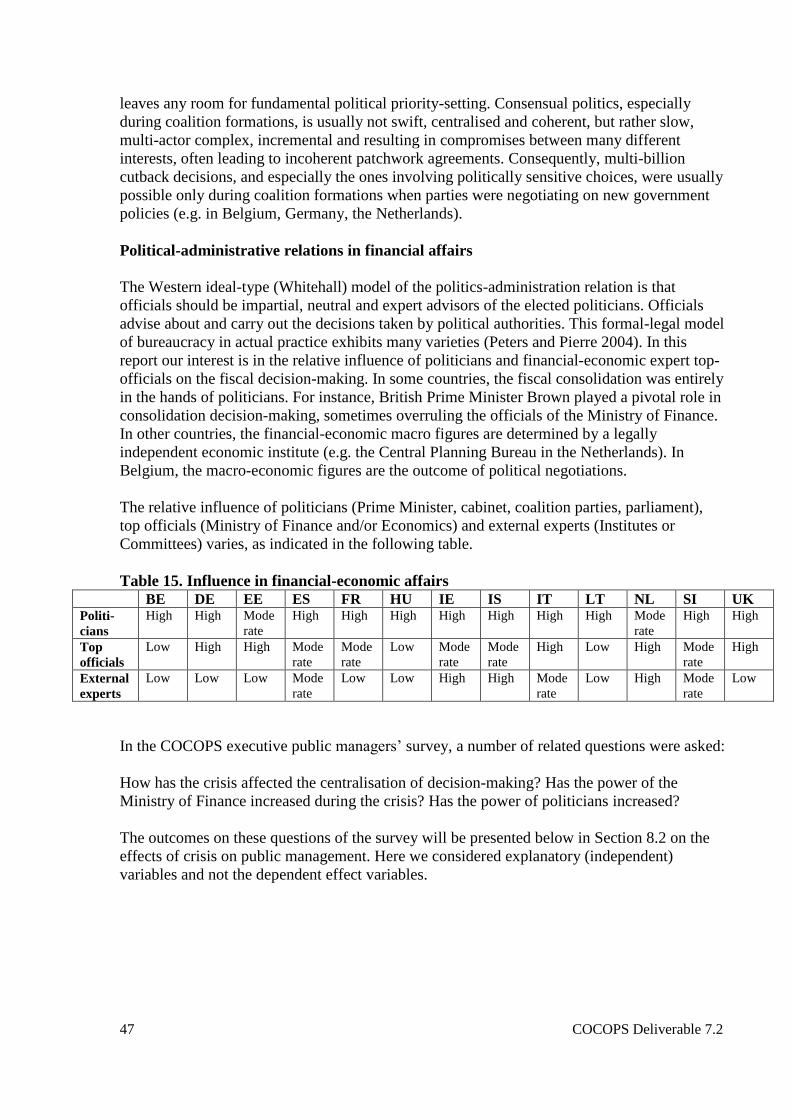
47 COCOPS Deliverable 7.2
leaves any room for fundamental political priority-setting. Consensual politics, especially
during coalition formations, is usually not swift, centralised and coherent, but rather slow,
multi-actor complex, incremental and resulting in compromises between many different
interests, often leading to incoherent patchwork agreements. Consequently, multi-billion
cutback decisions, and especially the ones involving politically sensitive choices, were usually
possible only during coalition formations when parties were negotiating on new government
policies (e.g. in Belgium, Germany, the Netherlands).
Political-administrative relations in financial affairs
The Western ideal-type (Whitehall) model of the politics-administration relation is that
officials should be impartial, neutral and expert advisors of the elected politicians. Officials
advise about and carry out the decisions taken by political authorities. This formal-legal model
of bureaucracy in actual practice exhibits many varieties (Peters and Pierre 2004). In this
report our interest is in the relative influence of politicians and financial-economic expert top-
officials on the fiscal decision-making. In some countries, the fiscal consolidation was entirely
in the hands of politicians. For instance, British Prime Minister Brown played a pivotal role in
consolidation decision-making, sometimes overruling the officials of the Ministry of Finance.
In other countries, the financial-economic macro figures are determined by a legally
independent economic institute (e.g. the Central Planning Bureau in the Netherlands). In
Belgium, the macro-economic figures are the outcome of political negotiations.
The relative influence of politicians (Prime Minister, cabinet, coalition parties, parliament),
top officials (Ministry of Finance and/or Economics) and external experts (Institutes or
Committees) varies, as indicated in the following table.
Table 15. Influence in financial-economic affairs
BE DE EE ES FR HU IE IS IT LT NL SI UK Politi-
cians
High High Mode
rate
High High High High High High High Mode
rate
High High
Top
officials
Low High High Mode
rate
Mode
rate
Low Mode
rate
Mode
rate
High Low High Mode
rate
High
External
experts
Low Low Low
Mode
rate
Low Low High High Mode
rate
Low High Mode
rate
Low
In the COCOPS executive public managers’ survey, a number of related questions were asked:
How has the crisis affected the centralisation of decision-making? Has the power of the
Ministry of Finance increased during the crisis? Has the power of politicians increased?
The outcomes on these questions of the survey will be presented below in Section 8.2 on the
effects of crisis on public management. Here we considered explanatory (independent)
variables and not the dependent effect variables.

48 COCOPS Deliverable 7.2
7.3. External influences
Developments in the worldwide economy clearly affected the state of economy and public
finances. The increase of industrial exports to East Asia, especially China, highly contributed
to the swift economic recovery of Germany (export industry) and therefore, indirectly, to the
economic recovery of surrounding countries with strong economic relations with Germany
such as Belgium and the Netherlands.
The EU Treaty of Maastricht placed ceilings on budget deficit (3% of GDP) and state debt
(60% of GDP). In many European countries, the EU pressure to keep within the deficit limit
was influential, thus forcing government to cut back. In Italy and Spain, the European
financial assistance made it imperative. Estonia provides an interesting example of a country
where the fiscal tightening was an impendent decision, first and foremost explained by the
Estonian government’s predominant political priority to join the Eurozone. This goal tied the
government with the above-mentioned criteria of the Maastricht Treaty. This way the adoption
of the euro in 2011 turned into a major focal point orchestrating in the government’s action
during the crisis management and leading to substantial fiscal retrenchment.
Countries like Iceland, Ireland, Greece and Portugal which received financial assistance (bail-
outs) from the Troika of the IMF, the ECB and the EU had to comply with strict and specified
fiscal conditions and cutbacks. In these countries, the fiscal consolidation was externally
imposed. It is important to note that the Troika holds an “orthodox” view in addressing the
crisis (Dellepiane 2012). This involves a general understanding that fiscal consolidation
should start early and be imposed quickly in a front-loaded strategy to restore market
confidence in governments’ ability to manage their public finances: a government must
implement a “cold shower”, or fiscal shock treatment (Pisani-Ferry 2007). With such an
ideology in the background, it is not surprising that countries following the requirements of
the Troika’s loan programmes were forced quickly to the real cutbacks, including fundamental
priority-setting and targeted cuts, without letting them go through long phases of crisis denial
and postponement of cuts.
The table below summarises external influences to European governments in managing the
crisis.
Table 16. External influences
BE DE EE ES FR HU IE IS IT LT NL SI UK Impact of
worldwide
economy on
swift recovery
Yes Yes Yes Yes No No Yes Yes No Yes Yes No No
EU budget
deficit influence
None/small/
large/imperative
Large Small Large Impe-
rative Small Large Large -
Impe-
rative Large Large Large Large
IMF, ECB
and EU
conditionality No No No Yes No Yes Yes Yes Yes Yes No Yes No

49 COCOPS Deliverable 7.2
8. Effects of fiscal consolidation on public administration
In this section we will first look at the impact of the crisis on administrative reform. Has the
fiscal consolidation led to particular administrative reform initiatives? Have certain
management instruments been emphasised or rolled back during the crisis? Or has the fiscal
crisis merely led to the enhancement of already existing administrative reforms? In answering
these questions, the outcomes of the country studies will be used. Secondly, the report takes a
look at the effects of the crisis on public management. Has the fiscal crisis led to the changes
in public management patterns? These questions will be analysed by means of the COCOPS
executive questionnaire.
8.1. Administrative reforms
In this section the impact of fiscal consolidation on public administration will be addressed.
The previous financial-economic crisis in the 1980s resulted in a major reform movement in
Western administrations, called NPM. The question is whether the current financial-economic
crisis will again lead to a specific administrative and managerial reform trend. Has the current
crisis caused only temporary short-term changes, or can we expect more fundamental
(systemic) shifts in public administration? It is too early to already draw major conclusions in
2013, as the fiscal consolidation decision-making has started in 2010 in many European
countries, and the stage of resolute cutback management was reached only in 2012 in several
countries. Consequently, long-term impacts are still far away, however, short-term impacts of
the cutbacks are beginning to appear, and it is possible to trace preliminary tendencies
regarding the impact of the crisis on public administration.
In analysing various country practices, a distinction will be made between countries with a
clear impact of the crisis on public administration, those with such a link but leading to
unsuccessful reforms, and countries with a less direct relation between the crisis and
administrative reforms.
Clear impact of crisis on public administration
Iceland. The economic collapse following the October 2008 banking crash led to massive
popular protest in 2009 against the Conservative-Social-Democrat government, bringing down
the coalition and leading to new elections, which resulted in the first ever Socialist
government in Icelandic history, with the most overarching reform programme ever. The so-
called “pots-and-pans revolution” via the April 2009 elections resulted in the first ever left-
wing majority coalition, with a clear mandate for creating a Nordic welfare society in Iceland,
where collective interests take precedence over particular interest (no single banker, politician
or official had accepted accountability for the banking crash). The public sector was
considered highly patronage- and clientelism-based and long dominated by the conservative
Independence Party and the rural Progressive Party, which had been busy dividing the gains of
the booming banking business, without any experience of international banking. The October
2008 crash of banks, with total assets about ten times the size of GDP, led to an economic
crisis, rising unemployment, inflation, and hence the urgent need for foreign loans from the
IMF. The IMF agreement to restore fiscal balance imposed severe restrictions on the Icelandic
government’s reform plans. The 2010 report of the Special Inquiry Commission into the bank
crash also had an important impact on the administrative reforms. The report concluded that
political leadership, effective coordination and professionalism were lacking in administration.

50 COCOPS Deliverable 7.2
As a result, the coordination within and between ministries was strengthened, the Prime
Minister’s role increased and political appointments of top-officials limited. The fragmented
nature of Icelandic government, where informal personal and political ties used to be the
method of coordination, was to be ended. De-politicisation of administration was an important
objective of the reforms. The impact of the crisis was to increase centralisation and strengthen
administrative procedures and professionalism.
Ireland is one of the EU states most deeply affected by the financial and economic crisis, and
especially by the fiscal crisis in the Eurozone. The collapse in revenues and debt increase that
followed the banking crisis resulted in a bail-out by the IMF-EU-ECB Troika in late 2010,
while Irish public finances still remain precarious in 2013. The crisis in Ireland forced a
number of sweeping and unprecedented state retrenchment and reform measures. A new
government was elected in 2011 on a mandate promising fundamental political and
administrative reforms. A coalition of centre-right (“Fine Gael”) and centre-left (Labour)
holding a large parliamentary majority created a new Department of Public Expenditure and
Reform, combining the decision-making power of both the Finance and Prime Minister’s
departments, as well as a cabinet super-committee (“Economic Management Council”) to
manage the Troika loan programme. The reform mandate of the new government led to a
renewed “rationalisation” of state agencies, that is, closures and mergers, the absorption of
agencies by parent departments, sharing of back-office functions, new performance
frameworks, financial management systems, shared service centres, annual reviews and
improvement of agency-department agreements. Furthermore, the new government proposed
to reshape the public service “bargain”, that is, to re-frame political-administrative
accountability relationships. However, an attempt in 2013 to renegotiate a social agreement
with the trade unions as to include pay cuts, increased working hours, reductions in overtime
and premium pay, and reform of employment grades in the public sector, was initially rejected
in a trade unions’ ballot. A subsequent deal was later agreed on by the majority of unions
following concessions.
Hungary. After the landslide victory of centre-right “FIDESZ” in the 2010 elections, the new
Orban government, backed by a two-third parliamentary majority, did engage in far-reaching
administrative reforms primarily aimed at strengthening the political control of administration.
Eight integrated “super-ministries” were created, and the Prime Minister’s office was
restructured into a Ministry of Public Administration and Justice with a broad portfolio. A new
Local Government Act aimed to severely reduce the tasks and responsibilities of local
governments. The aim of the Orban government to enforce the political control over
administration also led to stricter hierarchical and political control of the recruitment of top
officials. The Ministry of Public Administration and Justice (an expansion of the former Prime
Minister’s office) received the right to veto any appointment of public managers, and the new
civil service regulation explicitly established “political loyalty” as an employment criterion,
thus introducing elements of a “spoils system” in the Hungarian administration. The aim to
enforce political control expanded beyond the scope of administration and also involved
constitutional weakening of the Constitutional Court, the Budgetary Council, some
Ombudsmen and a new media supervisory authority. The two-third majority also enabled the
government to reform the election system in favour of the parties in power.

51 COCOPS Deliverable 7.2
Clear impact of the fiscal crisis on administration but reforms unsuccessful
Italy. After decades of inertia, an administrative reform became possible at the beginning of
the 1990s because of the currency crisis and the collapse of the old party system.
Consequently, a radical and comprehensive programme of NPM reforms was introduced
throughout the entire bureaucracy. Unfortunately these grand aims were faced with serious
implementation problems as successive governments were politically unwilling to drive
through these reforms, and the formal-legalistic tradition of administration remained in
contrast to the economic-managerial nature of the reforms.
After the 2008 financial crisis, a new administrative reform programme was devised by the
Minister of Public Administration and Innovation to revitalise the implementation of
performance management, a key component of previous NPM reforms. However, the severe
austerity measures taken since 2010 to freeze hiring and pay and cut higher salaries deprived
the performance management reform of the incentives to realise it. The fall of the Berlusconi
government and its replacement by the technocratic Monti government did not lead to new
administrative reforms. Under EU pressure all efforts were focused on public expenditure
reduction and cutback management. The EU distrusted the effectiveness of successful reforms
in Italian administration.
Another noteworthy reform of Italian public administration is the reform of provincial
government. Riding on the popular dissatisfaction with the costs of fragmented provinces,
successive governments addressed the efficiency and coordination problems. The economic
and fiscal crisis further enhanced the need for efficiency gains. The centre-left Prodi
government (2006-2008) lacked the cohesion to arrive at a reallocation of the workforce
across different levels of government. The centre-right Berlusconi government (2008-2011)
was a coalition of the People of Freedom party advocating the abolition of provinces and the
Northern League advocating the devolution of tasks to provinces, especially the Northern ones
run by them. When the fiscal crisis reached its height in 2011, the abolition of (small)
provinces became part of the austerity agenda of the government. The new Monti government
in 2011 tried to bypass the complex constitutional route of reform to decentralise provincial
powers to regions and municipalities.
Relations between fiscal crisis and administrative reform less clear: reforms already on-
going
France. Structural reforms of the French administration were not the result of the 2008
financial crisis, but had been designed already in 2007. Shortly after the 2007 election of
President Sarkozy, who had been Minister of Economics and Finance before and was sensitive
to budgetary problems of deficit and debt, a General Public Policy Review (“Révision
Générale des Politiques Publiques” (RGPP)) was launched to “rethink the state” in the context
of the fiscal problems. The aim was to reduce the size of government and to increase
managerial effectiveness and efficiency of the bureaucracy. The RGPP reviews were an
exercise in cutback management, in line with the 2001 budgetary procedure reform (“Loi
organique relative aux lois de finance” (LOFL)) that had introduced NPM-type instruments
like performance management, and following the wide-spread introduction of semi-
autonomous executive agencies (“opérateurs de l’Etat”, “établissements publics” etc.) during
the 1990s and early 2000s. A drastic reorganisation was carried out: the number of ministries
was reduced, large meta-ministries were created, and intra-ministerial mergers took place. The

52 COCOPS Deliverable 7.2
territorial state administration was also reformed by merging twenty-three regional
directorates into eight, corresponding to the new meta-ministries, and by merging the dozen
directorates at the “department” level. Although not directly related to the 2008 crisis, these
reforms were clearly related to fiscal problems and aimed at cutbacks.
The 2008 crisis did lead to an extended use of managerial instruments. In 2010 the “strategic
steering” of semi-autonomous agencies was introduced by means of performance contracts,
clear objectives, measurable indicators and annual reports, and by rationalising the relation
between parent ministries and agencies (“tutelage”). The “strategic steering” reform included
cutbacks in operating and personnel costs of agencies. In addition to that, the use of public-
private-partnerships also sharply increased after the 2008 crisis.
Belgium. One of the major recent administrative reforms was the 2001 “Copernicus” reform of
the organisation structure and personnel policy of federal administration. The aim was to
move from a Weberian bureaucracy to a customer-oriented administration and increase the
managerial capacity of civil servants. Besides this federal reform, in 2000 a structural and
cultural reform was launched in the Flemish administration to improve its policy-making
capacity, amongst other things by making a distinction between policy-making departments
and executive agencies. These two major public management reforms in Belgian
administration occurred during a period of no fiscal crisis, suggesting that such reforms are
more perceived as a luxury for good times than as a need in bad ones. It is also important to
note that Belgium underwent a much more fundamental state reform in the transformation of
the unitary state into a federal state with three regions and three communities. This
fundamental state reform has been carrying on for decades, recently in the fifth stage reform in
2003 and the sixth stage in 2011. The latter involved an amendment of the Public Finance Act
for regions and communities, which was one of the reasons why the coalition formation took
so long.
Netherlands. The major recent civil service reforms have been unrelated to the fiscal crisis.
The 2003 reform programme had no budgetary cutback targets. The 2007 reform programme
explicitly focused on cutbacks both in the budget of and the personnel in central
administration but was launched before the crisis. Technical-operational improvements in
management and administration, such as housing, salary administration, personnel services
and shared service centres were aimed at increasing cost-efficiency and related to budgetary
retrenchments, but managerial modernisation had already been taking place for a long time in
Dutch administration. The fiscal crisis was not its cause but did enhance its necessity and
therefore fuelled its further implementation. In 2010 this technical-operational and managerial
type of reform was continued in the subsequent “compact government” programme, which
was related to the cutback package announced by the new government at the time. In 2012 the
new cabinet announced the continuation and completion of this latter reform programme. As
in Dutch politics, reforms in administration were rather small, gradual and incremental rather
than swift, drastic and fundamental. Public management reform was less politically sensitive
and visible, which probably contributed to its successful implementation. In addition, both the
2010 and the 2012 government launched far-reaching plans for territorial reform. The existing
thirteen provinces were to merge into five regions, and municipalities were to increase their
size to 100,000 inhabitants.
Slovenia. Before the crisis, a real inclination towards achieving greater efficiency and costs
savings in the public sector did not exist. Economic, and particularly fiscal, pressures changed
this perception, yet only minor changes had happened by 2013. In early 2012, public sector

53 COCOPS Deliverable 7.2
downsizing became the real issue for the first time since the country was established, as the
public sector debt had doubled during those three years. Consequently, the new government
started planning and implementing fiscal austerity measures combined with the structural
reforms in certain policy fields (e.g. welfare) but not systematically addressing public
administration itself. The “rationalisation” of public administration did not include systemic
administrative reform plans but was limited to simple cutback measures such as wage freeze,
reductions in the costs of business trips of public servants, reductions in civil servants’
holidays and so on. Despite the lack of a general administrative reform agenda, the new
government (2012) substantially changed the mechanisms of the decision-making process by
substantially reducing the number of ministers to 12 and by giving the central role in fiscal
consolidation from the Minister for Development and European Affairs (without portfolio) to
the Ministry of Finance. In addition, by adopting the austerity and interventionist measures,
government also limited the autonomy of public organisations, in particular the ones
belonging to the state administration, as special permits became necessary to hire the
personnel, and mandatory retirements were introduced. This indicates that more centralised
modes of functioning of public organisations were established, and government effectively
introduced more control on those organisations, in particular relating to their costs. Although
the government introduced programme and performance budgeting for the first time within the
period of 2008-2011, this did not happen due to the crisis, but because government prepared
the plans to introduce that instrument even earlier.
Lithuania. Lithuania carried out major organisational reforms (including the abolishment of
county administrations) and some efficiency measures. Although the Parliament revised the
existing civil service legislation in a few areas (e.g. concerning the performance appraisal of
civil servants or the status of the Civil Service Department) in 2010-2012, the most important
decisions of remuneration, motivation and result-oriented system in the civil service were not
made. Major structural reforms did not occur in Lithuania in the period 2008-2012 (except
reforming high education and restructuring the energy sector). However, Lithuania’s response
to the global crisis contributed to the centralisation of authority and decision-making within
individual policy areas. The reduction in the number of appropriation managers, the
reorganisation of government agencies into the agencies under the ministries or the
assignment of government agencies to ministerial policy areas increased the authority of
ministers to politically control government expenditure and agency performance.
Estonia. Estonian public administration reforms have been carried by cost-efficiency motives
since the early 2000s, and cost-efficiency continued to be one of the aims of reform even
during the years of economic boom. This has to do with anti-state attitudes among the citizens,
fuelled by consecutive right-wing governments. In this regard, the goal of “more cost-
efficiency” during the years of the fiscal crisis was nothing new in the government rhetoric.
However, the general retrenchment environment helped the government to carry out reforms
that had been turned down earlier. Most importantly, the Parliament passed a new Public
Service Act in 2012 that had been rejected already twice before, in 2002 and 2009. According
to the new Act (implemented in 2013), a quarter of civil servants (e.g. staff in the IT,
personnel, accounting and public relations departments) lost their civil service status and
became employed according to the private sector Employment Act. Seniority pay and public
service pensions were abandoned, and the existing (limited) job security was equalled with
that in the private sector. Although this reform had been prepared before the crisis hit, it is
possible to argue that the crisis situation paved the way for its approval within the coalition
and in the Parliament. Similarly, crisis only indirectly affected the other ongoing
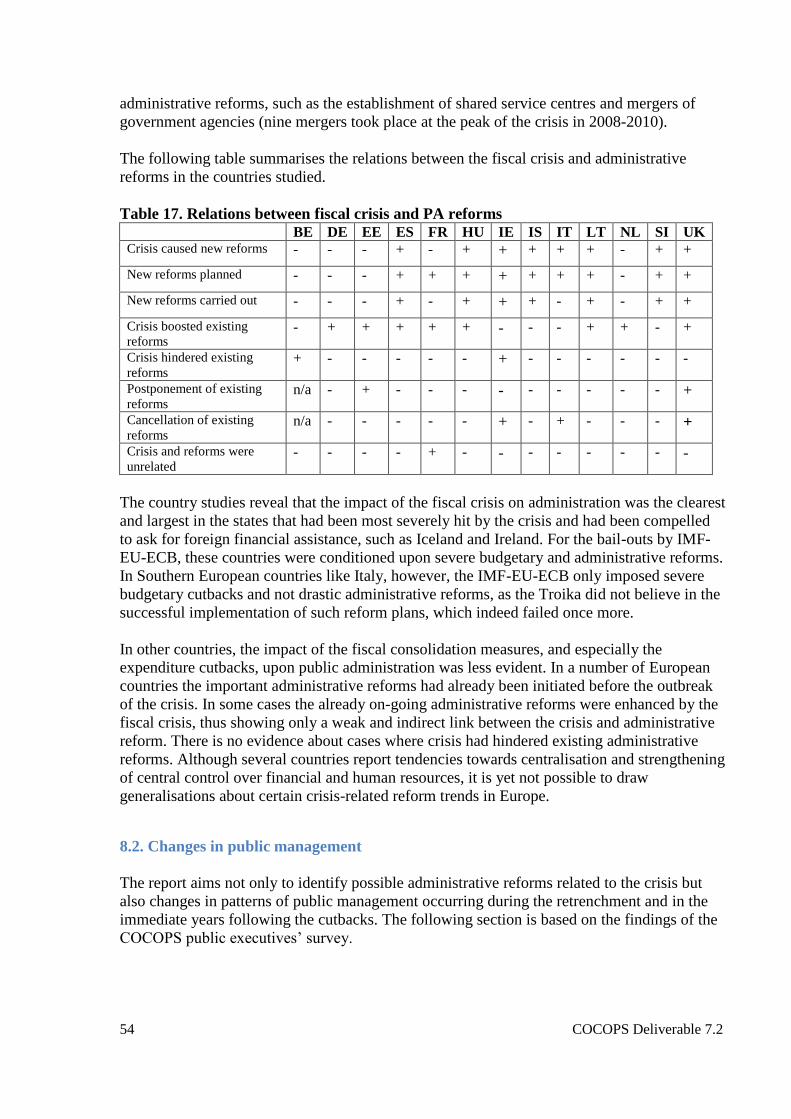
54 COCOPS Deliverable 7.2
administrative reforms, such as the establishment of shared service centres and mergers of
government agencies (nine mergers took place at the peak of the crisis in 2008-2010).
The following table summarises the relations between the fiscal crisis and administrative
reforms in the countries studied.
Table 17. Relations between fiscal crisis and PA reforms
BE DE EE ES FR HU IE IS IT LT NL SI UK Crisis caused new reforms - - - + - + + + + + - + +
New reforms planned - - - + + + + + + + - + +
New reforms carried out - - - + - + + + - + - + +
Crisis boosted existing
reforms - + + + + + - - - + + - +
Crisis hindered existing
reforms + - - - - - + - - - - - -
Postponement of existing
reforms n/a - + - - - - - - - - - +
Cancellation of existing
reforms n/a - - - - - + - + - - - +
Crisis and reforms were
unrelated - - - - + - - - - - - - -
The country studies reveal that the impact of the fiscal crisis on administration was the clearest
and largest in the states that had been most severely hit by the crisis and had been compelled
to ask for foreign financial assistance, such as Iceland and Ireland. For the bail-outs by IMF-
EU-ECB, these countries were conditioned upon severe budgetary and administrative reforms.
In Southern European countries like Italy, however, the IMF-EU-ECB only imposed severe
budgetary cutbacks and not drastic administrative reforms, as the Troika did not believe in the
successful implementation of such reform plans, which indeed failed once more.
In other countries, the impact of the fiscal consolidation measures, and especially the
expenditure cutbacks, upon public administration was less evident. In a number of European
countries the important administrative reforms had already been initiated before the outbreak
of the crisis. In some cases the already on-going administrative reforms were enhanced by the
fiscal crisis, thus showing only a weak and indirect link between the crisis and administrative
reform. There is no evidence about cases where crisis had hindered existing administrative
reforms. Although several countries report tendencies towards centralisation and strengthening
of central control over financial and human resources, it is yet not possible to draw
generalisations about certain crisis-related reform trends in Europe.
8.2. Changes in public management
The report aims not only to identify possible administrative reforms related to the crisis but
also changes in patterns of public management occurring during the retrenchment and in the
immediate years following the cutbacks. The following section is based on the findings of the
COCOPS public executives’ survey.
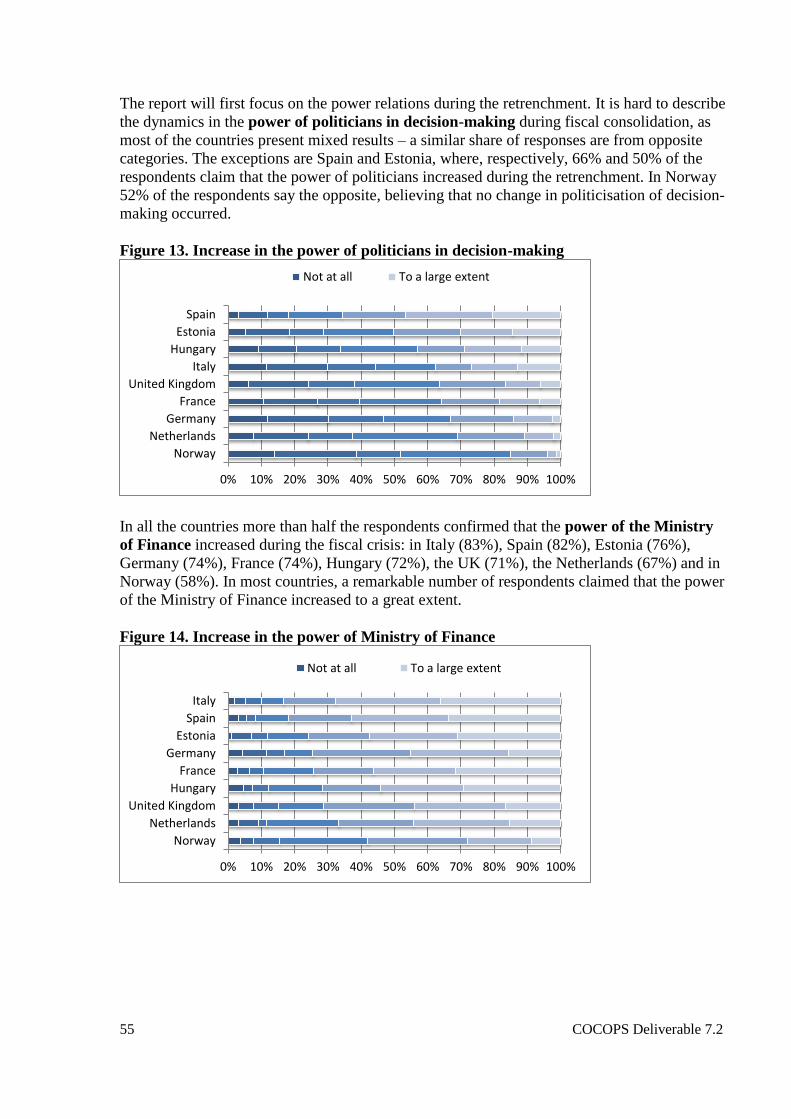
55 COCOPS Deliverable 7.2
The report will first focus on the power relations during the retrenchment. It is hard to describe
the dynamics in the power of politicians in decision-making during fiscal consolidation, as
most of the countries present mixed results – a similar share of responses are from opposite
categories. The exceptions are Spain and Estonia, where, respectively, 66% and 50% of the
respondents claim that the power of politicians increased during the retrenchment. In Norway
52% of the respondents say the opposite, believing that no change in politicisation of decision-
making occurred.
Figure 13. Increase in the power of politicians in decision-making
In all the countries more than half the respondents confirmed that the power of the Ministry
of Finance increased during the fiscal crisis: in Italy (83%), Spain (82%), Estonia (76%),
Germany (74%), France (74%), Hungary (72%), the UK (71%), the Netherlands (67%) and in
Norway (58%). In most countries, a remarkable number of respondents claimed that the power
of the Ministry of Finance increased to a great extent.
Figure 14. Increase in the power of Ministry of Finance
0% 10% 20% 30% 40% 50% 60% 70% 80% 90% 100%
Norway
Netherlands
Germany
France
United Kingdom
Italy
Hungary
Estonia
Spain
Not at all To a large extent
0% 10% 20% 30% 40% 50% 60% 70% 80% 90% 100%
Norway
Netherlands
United Kingdom
Hungary
France
Germany
Estonia
Spain
Italy
Not at all To a large extent

56 COCOPS Deliverable 7.2
The public sector executives were asked about how the crisis impacted the centralisation of
decision-making in their organisation. The answers of the top officials show that during
retrenchment the decision-making in respondents’ organisations was estimated as more
centralised in all countries but Norway. The share of the respondents claiming that the crisis
triggered centralisation is the following by countries: Estonia – 69%, Hungary – 68%, France
– 66%, Spain – 66%, Italy – 65%, UK – 61%, the Netherlands – 53%, Germany – 45%. In
Norway 47% of the respondents claimed that decision-making did not become more
centralised during the crisis.
Figure 15. Centralisation of decision-making in organisation
In terms of the power of budget planning units at the organisational level, more than 50% of
the respondents in most countries confirm that its power increased during the fiscal crisis:
Hungary (60%), Spain (57%), France (55%), Italy (53%), the Netherlands (52%), Germany
(51%) and the UK (50%). Only in Estonia and Norway did a bigger share of respondents
claim that the power of financial units did not increase (54% and 46% respectively) in their
organisations.
Figure 16. Increase in the power of budget planning units
0% 10% 20% 30% 40% 50% 60% 70% 80% 90% 100%
Norway
Germany
Netherlands
United Kingdom
Italy
Spain
France
Hungary
Estonia
Not at all To a large extent
0% 10% 20% 30% 40% 50% 60% 70% 80% 90% 100%
Norway
Estonia
United Kingdom
Germany
Netherlands
Italy
France
Spain
Hungary
Not at all To a large extent

57 COCOPS Deliverable 7.2
When looking at the impact of the crisis on the relevance of performance indicators, the
respondents from four countries agreed with the claim that the importance of performance
indicators increased: this happened in France (68%), the Netherlands (68%), Italy (63%) and
the UK (61%). In Estonia, Norway, Spain and Germany the share of respondents agreeing
with this statement is only slightly larger than of those disagreeing (difference ranging from 4
to 9%), hence no clear pattern could be detected. Only in Hungary, a bigger share of the
respondents (37%) disagree that performance information was used more, but also in this case
a rather similar share of the executives (33%) claim the opposite.
Figure 17. Increase in the use of performance information
One of the aims of the survey was also to find out if the crisis affected any organisational
functions. More than half the respondents from five countries claimed that during the cutbacks
the back-office functions were downsized to a great extent: the UK (76%), France (69%),
Estonia (69%), the Netherlands (59%) and Hungary (55%). On the other hand, in Norway
83% of the respondents and more than half the respondents in Germany (52%) confirmed the
opposite. In Spain and Italy the responses are hard to sum up. In the case of Italy, slightly
more of the respondents confirmed that the back-office functions had rather not been reduced
(43%), while 37% claimed the opposite. In Spain the share of respondents claiming either
positively or negatively with regard to such changes is roughly the same (44% and 41%
respectively).
Figure 18. Downsizing back-office functions
0% 10% 20% 30% 40% 50% 60% 70% 80% 90% 100%
Hungary
Estonia
Norway
Spain
Germany
United Kingdom
Italy
Netherlands
France
Not at all To a large extent
0% 10% 20% 30% 40% 50% 60% 70% 80% 90% 100%
Norway
Germany
Italy
Spain
Hungary
Netherlands
France
Estonia
United Kingdom
Not at all To a large extent

58 COCOPS Deliverable 7.2
Reducing frontline presence during the fiscal crisis seems not to have been a measure
applied very often. Most of the respondents in many countries indicate that it was not applied
at all: Norway (80%), Germany (72%), Spain (59%), Italy (53%) and Estonia (52%). In the
UK, Hungary and the Netherlands the share of the respondents claiming it was rather not used
is only slightly bigger than that of those claiming frontline presence was reduced to cope with
the crisis (49% vs. 37%; 42% vs. 36% and 44% vs. 37% respectively). In France the results
are mixed – equally 41% of the respondents estimate that the frontline presence was
reduced/not reduced.
Figure 19. Reduction of frontline presence
Finally, although the fiscal stress may trigger the governments to increase service fees,
according to the respondents of the survey, increasing the fees and charges of public
services was not a popular measure applied. In all countries but Spain more than half the
respondents estimated that increases in fees or charges were not common during fiscal
consolidation: Norway (90%), Estonia (84%), France (72%), Germany (71%), Italy (63%),
UK (62%), Hungary (61%), the Netherlands (54%). Only in Spain did less than a half of the
respondents (44%) claim it was a measure rather not applied, but also in this case this share is
larger than that of those confirming the fees and user charges were increased to a great extent
(40%).
Figure 20. Increasing the fees and user charges for public services
0% 10% 20% 30% 40% 50% 60% 70% 80% 90% 100%
France
Hungary
Netherlands
United Kingdom
Estonia
Italy
Spain
Germany
Norway
Not at all To a large extent
0% 10% 20% 30% 40% 50% 60% 70% 80% 90% 100%
Spain
Netherlands
Hungary
United Kingdom
Italy
Germany
France
Estonia
Norway
Not at all To a large extent
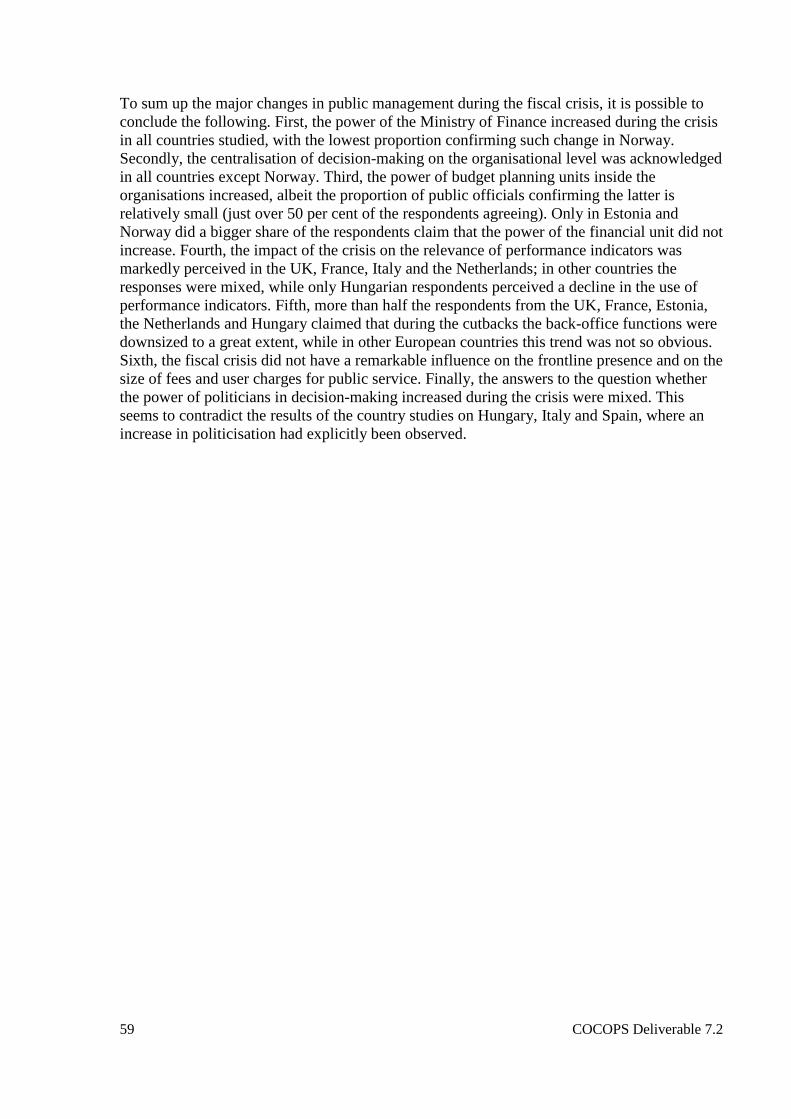
59 COCOPS Deliverable 7.2
To sum up the major changes in public management during the fiscal crisis, it is possible to
conclude the following. First, the power of the Ministry of Finance increased during the crisis
in all countries studied, with the lowest proportion confirming such change in Norway.
Secondly, the centralisation of decision-making on the organisational level was acknowledged
in all countries except Norway. Third, the power of budget planning units inside the
organisations increased, albeit the proportion of public officials confirming the latter is
relatively small (just over 50 per cent of the respondents agreeing). Only in Estonia and
Norway did a bigger share of the respondents claim that the power of the financial unit did not
increase. Fourth, the impact of the crisis on the relevance of performance indicators was
markedly perceived in the UK, France, Italy and the Netherlands; in other countries the
responses were mixed, while only Hungarian respondents perceived a decline in the use of
performance indicators. Fifth, more than half the respondents from the UK, France, Estonia,
the Netherlands and Hungary claimed that during the cutbacks the back-office functions were
downsized to a great extent, while in other European countries this trend was not so obvious.
Sixth, the fiscal crisis did not have a remarkable influence on the frontline presence and on the
size of fees and user charges for public service. Finally, the answers to the question whether
the power of politicians in decision-making increased during the crisis were mixed. This
seems to contradict the results of the country studies on Hungary, Italy and Spain, where an
increase in politicisation had explicitly been observed.
60 COCOPS Deliverable 7.2
CONCLUSIONS
A comparative analysis has been carried out on how European governments have responded to
the financial and economic crisis which erupted in 2008. This report studied the fiscal
consolidation measures and cutback decisions in several European countries. This report
aimed to explain how a selection of larger and smaller, Western, Southern and Central
European countries actually did consolidate their public finances.
Fiscal consolidation measures
Fiscal consolidation measures can be grouped into expenditure and revenue measures, and the
expenditures can be subdivided into operational costs, programme costs, and capital
investments. As we were interested in the effects of fiscal consolidation on administration
itself, the report focused on the reduction of operational costs, that is, hiring and pay freeze,
wage reduction, staff reduction, efficiency cuts and reorganisations. Based on the national
country studies, the report showed that in most countries (except Norway) the public
expenditure cutbacks have to a large degree been targeted at governments’ operational costs,
i.e. the costs of public administration itself.
The cutback measures on operational costs followed several stages. In most European
countries cutbacks came in rounds of increasing severity, it was only in the later stages of then
crisis that governments introduced the politically sensitive measures of actually reducing
wages and employment. However, those European countries which were so severely hit by the
crisis that they had to request financial assistance from IMF, EU and ECB, like Iceland and
Ireland, received the bail-outs on the condition that the public sector wage bill was reduced,
implicating immediate cuts in public sector salaries and employment. Also some Central and
Eastern European governments which were severely hit by the crisis, like Estonia and
Lithuania, opted for applying radical cutbacks immediately after the outset of crisis without
going through the seemingly mainstream European trajectory of gradual development from
smaller to larger cuts.
The information obtained from country reports was supplemented by the outcomes of the
COCOPS survey that reflected the perceptions of public executives on the cutback measures
during the crisis. Most findings from the questionnaire confirmed the data presented in the
country case studies. For instance, the Norwegian respondents rated highest in denying pay
cuts, pay freeze and hiring freeze. Also the specific outcomes for Germany are explainable, as
the special legal regime for civil servants prohibits layoffs and wage cuts and even pay freeze.
Freezing hiring (and cutting replacement) is the only way to realise savings in Germany. At
the same time the high rate in denying hiring freeze in Germany in the survey is rather
surprising.
Cutback decision-making
In analysing the characteristics of decision-making processes leading up to the fiscal
consolidation measures, the report at hand investigated the extent to which national
governments were able to reach fundamental political priorities in their cutback management
or rather relied on incremental pragmatic compromises, whether governments were able to
swiftly reach drastic decisions or rather applied slow, small and gradual steps, and whether the
decisions were centralised or decentralised.

61 COCOPS Deliverable 7.2
Also information on decision-making was supplemented by the COCOPS survey on how the
public sector executives perceived the cutback decision-making in their particular countries.
Norway, having escaped a severe economic and fiscal crisis, not surprisingly yielded the
highest outcome of “no cutbacks” for the country. The drastic and fundamental cutbacks in the
UK were confirmed by the relatively high outcome of “targeted cuts” in the survey. By
contrast, in other countries like France, Germany, the Netherlands and Italy, the relatively high
outcome of “targeted cuts” in the survey seemed to differ from the information provided in the
country studies.
Subsequently the report addressed the stages of cutback decision-making. The study indicated
that applying cutback measures was not a one-off event, but it consisted of a series of stages in
the majority of European countries. At first denying or delaying the cutbacks prevailed, and
only temporary and small measures were undertaken materialising in moderate adjustments. In
the later stage, the gradual recognition of the severity of the fiscal crisis and compliance with
the necessity of cutbacks could be traced, leading to first attempts at serious cutbacks.
Thereafter rather resolute cutback decisions were taken – first across-the-board efficiency
cuts, secondly targeted downsizing and cuts, and ultimately the final stage of fundamental
political priority-setting. As an exception to this general trajectory, some countries hit hardest
by the crisis, such as those in Central and Eastern Europe as well as in Southern Europe,
reached the stages of serious and resolute cutbacks faster. In the bail-out countries, the
conditionality of the Troika forced governments to apply immediate cutbacks, including
fundamental priority-setting and targeted cuts.
The report indicates that fiscal crisis decisions were primarily related to the financial-
economic circumstances of a country. The worse the economic situation and the worse the
budgetary situation, the more drastic and far-reaching measures had to be taken by the
governments. Besides economic indicators, the study also considered the political-
administrative explanatory factors. It has been demonstrated that the type of state system
(unitary, decentralised, federal), political system (majoritarian or consensus democracy) and
government system (single-party cabinet or coalition government) affects the possibility for
swift and drastic decision-making. However, the country studies partly contradicted the
theoretical predictions. Single-party governments in France, Spain and the UK were not
clearly better able to take swift and drastic cutback decisions than coalition governments.
There are also cases where minority governments were able to apply radical cutback
measures. Finally, external influences, most importantly the Troika conditionality, have
substantially affected both the contents of consolidation measures and decision-making
processes in the bail-out countries.
Effects of crisis on public administration and management
The country studies showed that the impact of the fiscal crisis on administration was most
straightforward and encompassing in the countries most severely hit by the crisis. Public
administration has been most affected in countries that had been obliged to ask for foreign
financial assistance, as demonstrated by the cases of Iceland and Ireland. The bail-outs were
conditioned upon specific and severe budgetary and administrative reforms. In Southern
European countries like Italy, however, the IMF-EU-ECB Troika imposed strict budgetary
reforms only, as they did not believe in the success of such ever-failing administrative reform
plans. In Hungary the newly elected government launched drastic administrative reforms in
2010, but these seemed rather aimed at strengthening the political control over administration
than at fiscal consolidation.

62 COCOPS Deliverable 7.2
In other countries the impact of the fiscal consolidation measures upon public administration
was less evident. In a number of countries the important administrative reforms had already
taken place before the outbreak of the crisis (Belgium, France, UK). In some other countries
the already on-going administrative reforms were enhanced by the fiscal crisis (Netherlands).
In Estonia, several reforms were implemented during the crisis, but the crisis served as a
window of opportunity to put in place changes planned already earlier.
The effect of the fiscal crisis on the patterns of public management was also studied in the
COCOPS public executives’ questionnaire. Centralisation of decision-making in the
organisations of the public sector officials was perceived by the executives in all countries,
except Norway. In all countries the power of the Ministry of Finance increased during the
crisis, again with the lowest proportion in Norway. The power of budget planning units in the
organisations also increased. The answers to the question whether the power of politicians in
decision-making had increased during the crisis were mixed. This seems to contradict the
results of the country studies on Hungary, Italy and Spain, where an increase in politicisation
was observed.
Clusters of countries
Notwithstanding the many differences among the European countries, preliminary clusters of
countries as to their responses to the fiscal crisis and consolidation can be discerned. It is
possible to distinguish countries according to the size and extent of the fiscal crisis. The one
extreme of such a continuum includes countries which were not or only slightly hit by the
financial and economic crisis and experienced hardly any need for consolidation measures and
major cutbacks. The other extreme of the continuum involves countries that were so severely
hit by the financial crisis that they had to be bailed out and outside financial assistance was
conditioned on severe austerity and reform programmes. Most of the European countries fall
in the middle of these two extremes (OECD 2012). According to the government responses to
the fiscal crisis, the study at hand allows it to distinguish between five clusters of countries.
1) Firstly, thanks to its North Sea gas and oil revenues Norway was hardly affected by the
worldwide crisis. Norway did not really face a fiscal crisis of excessive budget deficits. Apart
from the relatively modest measures to stabilise the financial sector, there was no necessity for
fiscal consolidation and significant expenditure cutbacks. The crisis had no impact on the
functioning of Norwegian administration.
2) Secondly, several European countries were hit so hard by the crisis that they were forced to
seek for the external assistance which was in most cases provided by the Troika of IMF-EU-
ECB. From our selection of countries, this concerned Iceland, Ireland, Italy and Spain. The
crisis in these countries was severe, and fiscal consolidation was imperative. The Icelandic and
Irish governments were unable to domestically solve the crisis and had to be bailed out by the
external partners which, in turn, led to externally forced financial and administrative reforms.
The most substantial external influence over domestic reforms was detected in Ireland and
Iceland, where the Troika conditionality was extended over the cutbacks and also affected
public administration reforms.
Southern European states were also deeply affected by the Eurozone crisis erupting in 2010.
Although Italy and Spain were not bailed out like Greece and Portugal, they did receive
financial assistance from the EU and ECB leading to conditions of hard retrenchment and

63 COCOPS Deliverable 7.2
reform measures. Although Italy was hardly affected by the banking crisis and only mildly by
the economic crisis, the Eurozone crisis deeply affected its public finances – fiscal
consolidation was seriously addressed, but administrative reform was less successful. Spain
was also severely hit by the banking and economic crisis. In return for the financial assistance
of the ECB, the Spanish government was forced to rapidly introduce hard retrenchments and
cutbacks. The sudden and drastic measures taken without much consultation and consensus
contributed to the growing social unrest.
A similar feature in these countries is a relatively swift and centralised decision-making
process triggered by the Troika conditionality, which led to radical cutback measures (e.g.
layoffs, pay cuts) and substantive programme cuts – in several cases also involving cuts in
public services. The bail-out countries did not have the time to gradually move from crisis
denial via small and moderate to radical cuts but were forced to apply severe austerity
measures much more quickly than most of the other European countries. Moreover, the
conditionality also involved influence over policy reforms, thus also affecting programme
cutbacks and public administration reforms.
3) Thirdly, one can distinguish a cluster of continental European countries where the relatively
modest size of the economic crisis led to relatively moderate economic recovery packages,
and which show similar decision-making patterns and a similar approach to consolidation
measures. This group of countries first includes those neighbouring and economically
connected to Germany: Belgium and the Netherlands. They highly benefitted from the swift
economic recovery of the German economy due to the rising industrial export to South East
Asia. These governments were first reluctant to applying consolidation measures – in all of
these countries the retrenchment and cutback decisions were postponed till after the 2010
general elections and hence coincided with the multi-party deliberations and negotiations
about a new coalition cabinet. In Germany that coalition formation was relatively swift, in the
Netherlands it took three to four months, but in the highly complex Belgian consensus politics
it took 18 months to form a new coalition cabinet. Similarly, the Slovenian government denied
the severity of the crisis for a while, after which it first applied small consolidation measures
and moved gradually to more substantial cutbacks as the crisis grew deeper. Although France
had a single-party cabinet and president, and the energetic Sarkozy as a former Finance
Minister and known advocate of austerity and reform put fiscal consolidation high on the
agenda, in actual practice the cutback decision-making was only half-hearted.
As for consolidation measures, governments of this cluster opted for “milder” cutback
instruments such as hiring freeze or pay freeze in contrast to the harsh cuts applied by most
governments in the second and forth groups (e.g. layoffs, pay cuts). Germany was able to rely
only on the hiring freeze due to its civil service regulation. In this group of countries, the fiscal
crisis did not have a direct link to administrative reforms. For example, the fiscal crisis did not
affect state and administrative reforms in Belgium. In the Netherlands the already existing
managerial reform programme in central administration was not caused by the crisis, but the
financial squeeze did enhance its necessity.
4) The fourth cluster of countries involves the Baltic states of Estonia and Lithuania. Despite
significant drops in their GDPs, the Baltic countries implemented substantial fiscal
consolidations during the early stage of the crisis. These small countries were among the first
ones hardly hit by the crisis. Instead of denying and postponing cuts, which was clearly
characteristic to the countries belonging to the third group, the Baltic governments applied
radical cutbacks as early as 2008 and consequently carried out several rounds of substantive
64 COCOPS Deliverable 7.2
cuts. While in the earlier phases of the crisis, more across-the-board cuts were applied, as the
time progressed, the cuts became more targeted. Cutbacks included not only hiring and pay
freeze but quickly reached cuts in public sector personnel and pay. Such an approach towards
the cuts was facilitated firstly by the relatively underdeveloped civil society unable to mobilise
major protests; secondly by very weak unions with trade-union density the lowest in Europe;
and thirdly by the missing tenure in the civil service regulation, which allowed pay and
personnel cuts. Public administration reforms were not substantially affected by the crisis.
5) Finally, the United Kingdom seems to represent a unique case. A majoritarian single-party
cabinet refuted the alleged assumptions of swift and drastic decision-making The Labour
government under Prime Minister Brown explicitly refused to take cutback decisions in view
of the upcoming elections. It was the Cameron-Clegg two-party coalition cabinet that took
unprecedented and unequalled massive cutback decisions. Yet, notwithstanding the massive
fiscal consolidation measures, the economy and public finances are still in bad shape.
Avenues for further research
This report provided an overview of the findings of government responses to the fiscal crisis.
This report is thus firstly informative and aims to contribute to a better knowledge and
understanding of what happened during the fiscal crisis in Europe. Therefore, the main focus
of this report has been on describing government responses first of all. Although we started
with laying out a framework of explanatory factors and carried out preliminary exercise in
trying to explain consolidation measures and decision-making processes from both economic
and political-administrative points of view, this needs to be further developed in the future.
However interesting an international comparative explanation of the similarities and
differences in national fiscal consolidation decisions may be from a scientific point of view,
practitioners, politicians and policy-makers always ask the inevitable question: which country
did better? This report has not addressed this methodologically tricky question but it provides
some background for further research on possible evaluations of government responses to the
crisis.
Firstly, in this report we used the fiscal consolidation measures as the dependent variable
which was related to the independent explanatory variables (economics, politics, external). It
would be intriguing to turn this methodological scheme around from explanation into
evaluation. The fiscal consolidation measures become the independent variable, explaining the
fiscal and economic effects, which can be evaluated as successful or not. The data on budget
surplus/deficit, gross debt and GDP growth could then be used as dependent variables in
analysing the actual effects of the fiscal consolidation measures on the improvement of public
finances and economy.
A number of methodological questions arise in such a quantitative statistical analysis. It has to
be specified what variables are used as the independent (explanatory) ones. From an economic
viewpoint, the financial size of the fiscal consolidation measures seem most appropriate to
consider, which can further be distinguished into expenditure and revenue measures and
specified as to policy sectors. From a political viewpoint, other variables might be included,
such as the political sensitivity of various policy sector measures. For example, cutbacks in
social security issues like pension age and unemployment benefits, usually were highly
contested socially, publicly and politically. Next the dependent effect variables have to be
specified. For public finances and economy, the GDP, GDP-growth rate, employment,

65 COCOPS Deliverable 7.2
inflation, the budget surplus/deficit and gross debt seem potential indicators. Still the question
remains what exactly will be specified as successful. The trickiest methodological question is
related to the supposed “causal” relationships between the variables. The domestic public
finances and economy are dependent on many more variables than the fiscal consolidation
measures of the national government alone. For example, the recovery of both public finances
and economy in Germany was less the effect of fiscal consolidation than of worldwide
economy. And the British economy and public finances remained in bad shape although the
2010 fiscal consolidation measures were huge and severe.
This brings us to the main methodological question, that is the normative one of evaluation.
What are the criteria for success or failure of the fiscal consolidation measures? It seems
reasonable to measure the success of fiscal consolidation in terms of decrease of public deficit
and debt. However, the ultimate criteria for success are the recovery of economy and
especially employment. As illustrated before, the recovery of a domestic economy is
dependent on many more factors than only the domestic government’s fiscal consolidation
measures.
Secondly, in order to avoid the methodological pitfalls of questionable “causal” relations
between fiscal consolidation and economic success, an attempt could be made in measuring
the effects of the cutbacks in terms of decision-making. Did the decision-making result in
swift, large and drastic measures, or were they only small, slow and gradual deviations of the
“status quo ante”. Were the cutbacks targeted and selective, or just across-the-board and
cheese-slicing? Were the cutback decisions based on fundamental political priority-setting
leading to coherent, systematic and sustainable solutions, or were they rather the outcome of
incremental, pragmatic political compromising leading to incoherent patchworks of short-term
quick fixes? Throughout this report these characteristics of decision-making have been
applied.
Such an evaluation of the government’s decision-making in the various countries would
probably yield a negative conclusion. Fundamental political priority-setting has been the
exception rather than the rule. Examples of politically sensitive decisions to make targeted
cuts could be found in certain areas of social security, such as the pension system and
unemployment benefits. These examples of break-through of political stalemate, which by
implication are fundamental political decisions, were mostly implemented by cautious
compromise measures, involving a multi-year gradual path of small annual adjustments of the
existing pension-age or unemployment-benefit period. Should a fundamental political decision
which is incrementally implemented be evaluated as a success or failure?
Moreover the seemingly unsuccessful, incremental and compromising decision-making in the
consensual democracies with their multi-party coalition governments do reveal some
characteristics that could be called a success. The Belgian example showed that although
apparently the country had neither a government nor a parliamentary approved budget during
an eighteen-months coalition-formation period, the care-taker government successfully
managed to take major cutback measures. Notwithstanding the complex political system,
which normally makes political decision-making virtually impossible, and the abnormal
situation of eighteen months of political deliberations and negotiations about a new coalition,
Belgium did take fiscal consolidation measures to reduce its budget deficit, which in view of
the circumstances might well be assessed as an incredible success.
66 COCOPS Deliverable 7.2
On the other hand, the decision-making in majoritarian democracies with single-party
governments, did not lead to successful outcomes more clearly. In France the energetic and
decisive president Sarkozy and his single-party government did not succeed to take swift and
drastic cutback decisions. For a considerable period of time the government hesitated between
cutback and economic stimulus measures. The policy was framed in the neologism “ri-lance”,
a combination between the two words “rigueur” (rigour) and “relance” (stimulus).
Fundamental priority-setting did not take place. In Spain the single-party Zapatero
government did not succeeded in taking drastic cutback decisions, either.
Basic dilemma
Sooner or later across-the-board and incremental cutback decisions will become insufficient to
turn the fiscal tide. Sooner or later the muddling-through of successive rounds of small, slow
and gradual cuts, which apparently is what several European governments are best at doing,
will have to make way for fundamental political priority-setting, which is necessary to arrive
at far-reaching and drastic spending cuts to really solve the mounting fiscal crisis. The basic
dilemma is between the seeming incapability of governments to take swift and drastic
measures and the ultimate inevitability of such decisions. Apparently it is not enough for
economists to derive from their theories and models what measures ought to be taken. It is
also about political decision-making capabilities of governments. And that is what this report
was about.

67 COCOPS Deliverable 7.2
References
Austin, M. 1984. “Managing Cutbacks in the 1980s.” Social Work 29(5), 428-434.
Bartle, J.R. 1996. “Coping with Cutbacks: City Responses to Aid Cuts in New York State.” State and
Local Government Review 28(1), 38-48.
Behn, R.D. 1980. “Leadership in an Era of Retrenchment.” Public Administration Review 40(6), 603-
626.
Bideleux, R. 2011. “Contrasting Responses to the International Economic Crisis of 2008-2010 in the
11 CIS Countries and in the 10 Post-Communist EU Member Countries.” Journal of
Communist Studies and Transition Politics 27(3-4), 338-363.
Boin, A., P. Hart, E. Stern and B. Sundelius. 2008. The Politics of Crisis Management: Public
Leadership under Pressure. Cambridge: Cambridge University Press.
Bozeman, B. 2010. “Hard Lessons from Hard Times: Reconsidering and Reorienting the ‘Managing
Decline’ Literature.” Public Administration Review 70(4), 557-563.
Carnall, C.A. 2003. Managing Change in Organizations. London: Prentice Hall.
Cayer, N.J. 1986. “Management Implications of Reduction in Force.” Public Administration Quarterly
10(1), 36-49.
Cepiku, D. and A.B. Savignon. 2012. “Governing Cutback Management: Is there a Global Strategy for
Public Administrations?” International Journal of Public Sector Management25(6/7), 428-
436.
Connolly, R. 2012. “The Determinans of the Economic Crisis in Post-Socialist Europe.” Europe-Asia
Studies 64(1), 35-67.
Dabrowski, M. 2009. “The Global Financial Crisis: Lessons for European Integration.” CASE Network
Studies & Analyses 384.
Dellepiane, S. 2012. “The Political Power of Economic Ideas: The Case of Expansionary Fiscal
Contraction.” ECPR Joint Sessions. Antwerp.
Di Mascio, F., A. Natalini and F. Stolfi. 2013 “The Ghost of Crises Past. Analyzing Reform Sequences
to Understand Italy’s Response to the Global Crisis”. Forthcoming in Public Administration.
Downs, G.W. and D.M. Rocke. 1984. “Theories of Budgetary Decision-making and Revenue
Decline.” Policy Sciences 16(4), 329-347.
Dunsire, A. and C. Hood. 1989. Cutback Management in Public Bureaucracies: Popular Theories and
Observed Outcomes in Whitehall. Cambridge (etc.): Cambridge University Press.
European Commission. 2009. Economic Crisis in Europe: Causes, Consequences and Responses.
Brussels: Directorate General for Economic and Financial Affairs.
Gieve, J. and C. Provost. 2012. “Ideas and Coordination in Policymaking: The Financial Crisis of
2007-2009.” Governance: An International Journal of Policy, Administration, and Institutions
25(1), 61-77.
Hallerberg, M., R.R. Strauch and J. von Hagen. 2009. Fiscal Governance in Europe. Cambridge:
Cambridge University Press.
Heffron, F.A. 1989. Organization Theory and Public Organizations: The Political Connection.
Englewood Cliffs, NJ: Prentice Hall.
Hendrick, R. 1989. “Top-Down Budgeting, Fiscal Stress and Budgeting Theory.” The American
Review of Public Administration 19(1), 29-48.

68 COCOPS Deliverable 7.2
Holzer, M. 1986. “Workforce Reduction and Productivity.” Public Administration Quarterly (Spring),
86-98.
Hood, C. and M. Wright. 1981. “From Decrementalism to Quantum Cuts?” In C. Hood and M. Wright
(eds). Big Governments in Hard Times. Oxford: Martin Robertson, 199-227.
Ingraham, P.W. and C. Barrilleaux. 1983. “Motivating Government Managers for Retrenchment: Some
Possible Lessons from the Senior Executive Service.” Public Administration Review 43(5),
393-402.
Jick, T.D. and V.V. Murray. 1982. “The Management of Hard Times: Budget Cutbacks in Public
Sector Organizations.” Organization Studies 3(2), 141-169.
Jõgiste, K., P. Peda and G. Grossi. 2012. “Budgeting During Austerity: The Case of Estonian Central
Government.” Forthcoming in Public Administration and Development. Online version
accessible at: DOI: 10.1002/pad.1611.
Kickert, W. 2013a. “How the Danish Government Responded to the Financial Crisis.” Public Money
and Management 33(1), 55-62.
Kickert, W. 2013b. “How the German Government Responded to the Fiscal Crisis.” Public Money and
Management 33(4).
Kickert, W. 2012a. “State Responses to the Fiscal Crisis in Britain, Germany and the Netherlands.”
Public Management Review 14(3), 299-309.
Kickert, W. 2012b. “How the UK Government Responded to the Fiscal Crisis: An Outsider’s View.”
Public Money and Management 32(3), 196-176.
Kickert, W. 2012c. “State Responses to the Fiscal Crisis: Belgium.” Public Money and Management
32(4), 303-310.
Kickert, W. 2012d. “How the Dutch Government Responded to Financial, Economic and Fiscal
Crisis.” Public Money and Management 32(6), 439-444.
Kogan, M. 1981. “Education in ‘Hard Times’.” In C. Hood and M. Wright (eds). Big Governments in
Hard Times. Oxford: Martin Robertson, 152-173.
Kotter, J. 1996. Leading Change. MA: Harvard Business School Press.
Levine, C.H. 1985. “Police Management in the 1980s: From Decrementalism to Strategic Thinking.”
Public Administration Review 45, 691-699.
Levine, C.H. 1984. “Retrenchment, Human Resource Erosion, and the Role of the Personnel
Manager.” Public Personnel Management 13(3), 249-264.
Levine, C.H. (ed.). 1980. Managing Fiscal Stress. Chatham, NJ: Chatham House.
Levine, C.H. 1979. “More on Cutback Management: Hard Questions for Hard Times.” Public
Administration Review 39(2), 179-183. Reprinted (1980) in C.H. Levine (ed.). Managing
Fiscal Stress: The Crisis in the public sector. Chatham, NJ: Chatham House Publishers, 305-
312.
Levine, C.H. 1978. “Organizational Decline and Cutback Management.” Public Administration Review
38(4), 316-325.
Levine, C.H., I.S. Rubin and G. Wolohojian. 1981. The Politics of Retrenchment: How Local
Governments Manage Fiscal Stress. Beverly Hills, CA: Sage Publications.
Lewis, C. and A. Logalbo. 1980 “Cutback Principles and Practices: A Checklist for Managers.” Public
Administration Review 40(2), 184-188.
Lijphart, A. 1974. “International Relations Theory: Great Debates and Lesser Debates.” International
Social Science Journal 26(1), 11-21.

69 COCOPS Deliverable 7.2
Lindblom, C.E. 1959. “The Science of ‘Muddling Through’.” Public Administration Review 19(2), 79-
88.
Lodge, M. and C. Hood. 2012. “Into an Age of Multiple Austerities? Public Management and Public
Service Bargains across OECD Countries.” Governance: An International Journal of Policy,
Administration, and Institutions 25(1), 79-101.
Marer, P. 2010. “The Global Economic Crises: Impacts on Eastern Europe.” Acta Oeconomica 60(1),
3-33.
Massey, A. 2011. “Nonsense on Stilts: United Kingdom Perspectives on the Global Financial Crisis
and Governance.” Public Organization Review 11, 61-75.
Moulton, S. and C. Wise. 2010. “Shifting Boundaries between the Public and Private Sectors.” Public
Administration Review 70(3), 349-360.
Myant, M. and J. Drahokoupil. 2012. “International Integration, Varieties of Capitalism and Resilience
to Crisis in Transition Economies.” Europe-Asia Studies 64(1), 1-33.
OECD. 2012. “Restoring Public Finances, 2012 Update.” Special Issue of the OECD Journal on
Budgeting.
OECD. 2011. “Restoring Public Finances.” Special Issue of the OECD Journal on Budgeting.
Pandey, S.K. 2010. “Cutback Management and the Paradox of Publicness.” Public Administration
Review 70(4), 564-571.
Peters, B.G. 2011. “Governance Responses to the Fiscal Crisis: Comparative Perspectives.” Public
Money & Management 31(1), 75-80.
Peters, B.G. and J. Pierre. 2004. Politicization of the Civil Service in Comparative Perspective: The
Quest for Control. London: Routledge.
Peters, B.G., J. Pierre and T. Randma-Liiv. 2011. “Global Financial Crisis, Public Administration and
Governance: Do New Problems Require New Solutions?” Public Organization Review 11, 13-
27.
Pisani-Ferry, J. 2007. “Foreword.” In J. Henriksson (ed). Ten Lessons About Fiscal Consolidation.
Brussels: Bruegel Lecture and Essay Series, 3-4.
Pollitt, C. 2010. “Cuts and Reforms – Public Services as We Move into a New Era.” Society and
Economy 32(1), 17-31.
Pollitt, C. and S. Dan. 2011. The Impacts of New Public Management in Europe: A Meta Analysis.
Research Report of the EU Seventh Framework program project Coordinating for Cohesion in
the Public Sector of the Future. Available at http://www.cocops.eu/wp-
content/uploads/2012/03/WP1_Deliverable1_Meta-analysis_Final.pdf.
Posner, P. and J. Blöndal. 2012. “Democracies and Deficits: Prospects for Fiscal Responsibility in
Democratic Nations.” Governance 25(1), 11-34.
Raudla, R. 2011. “Fiscal Retrenchment in Estonia During the Financial Crisis: The Role of
Institutional Factors.” Public Administration, online version 13 September 2011.
Raudla, R. and R. Kattel. 2013. “The Baltic States and the Crisis of 2008-2010.” Europe-Asia Studies
65(3), 426-449.
Raudla, R., R. Savi and T. Randma-Liiv. 2013. “Literature Review on Cutback Management.”
COCOPS deliverable 7.1, March 2013.
Schick, A. 1988. “Micro-Budgetary Adaptations to Fiscal Stress in Industrialized Democracies.”
Public Administration Review 48(1), 523-533.
70 COCOPS Deliverable 7.2
Staehr, K. 2010. “The Global Financial Crisis and Public Finances in the New EU Countries in Central
and Eastern Europe: Developments and Challenges.” Public Finance and Management 10(4),
671-712.
Stern, E. and B. Sundelius. 1997. “Sweden’s Twin Monetary Crises of 1992: Rigidity and Learning in
Crisis Decision Making.” Journal of Contingencies and Crisis Management 5, 32-48.
Thynne, I. 2011. “Symposium Introduction: The Global Financial Crisis, Governance and Institutional
Dynamics.” Public Organization Review 11, 1-12.
Van de Walle, S. and S.R. Jilke. (2012 [accepted]). “Savings in Public Services after the Crisis: A
Multilevel Analysis of Public Preferences in the EU27.” International Review of
Administrative Sciences.
Van den Noord, P. 2011. “Turning the Page: EU Fiscal Consolidation in the Wake of the Crisis.”
Empirica 38, 19-51.
Verick, S. and I. Islam. 2010. “The Great Recession of 2008-2009: Causes, Consequences and Policy
Responses. Institute for the Study of Labor.” Discussion Paper No. 4934.
Wolman, H. and B. Davis. 1980. Local Government Strategies to Cope with Fiscal Stress. Washington,
DC: Urban Institute.
The World Bank (2008) “Lessons from World Bank Research on Financial Crises.” Policy Research
Working Paper 4779. Available at:
http://econ.worldbank.org/external/default/main?pagePK=64165259&theSitePK=469372&piP
K=64165421&menuPK=64166093&entityID=000158349_20081216093241 (last accessed 16
May 2012).
World Health Organization. 2009. “The Financial Crisis and Global Health.” Report of a High-Level
Consultation, 19 January.
71 COCOPS Deliverable 7.2
Appendix 1. Research plan for the COCOPS Work Package 7
Research questions and methodology
The main academic interest of the study is to investigate 1) how governments, politics and
administrations have responded (and are still responding) to the fiscal crisis and 2) what
impact the crisis has had on public administration and governance. This means that the current
study treats the fiscal crisis as an independent variable providing an explanation to the
possible changes in systems of governance. The focus is not on explaining the crisis per se but
providing insight in the effects that the crisis brought along.
We apply exploratory and explanatory research by further elaborating the main research
questions as follows.
The first set of questions focuses on the descriptive and exploratory components:
- What were the main cost cutting (and/or revenue-enhancing) measures and strategies
applied to mitigate the fiscal crisis?
o Did the governments prefer to cut expenditure or increase revenues, or did they
opt for a combination of revenue and expenditure side measures?
o Did the governments prefer to apply across-the-board cuts or more targeted cuts,
or did they rely on efficiency-increasing measures? If combinations of these
strategies were used, did any of the approaches prevail over others?
o Did the governments prefer temporary measures or permanent measures to
decrease expenditures and/or increase revenues?
- Has the fiscal crisis triggered changes in patterns of public management and
governance?
o Has the crisis brought about a shift towards more centralised or decentralised
modes of governance? What are the most likely further developments in that
regard?
o Have there been changes in modes of coordination?
o Has the crisis increased the autonomy of civil servants, or have there been
attempts to politicise the decision-making?
o Has the crisis brought about a shift in the relationship between the public, private
and third sectors?
o Have there been attempts to strengthen strategic planning, performance
management and performance budgeting?
o Have there been attempts to make more extensive use of contracting-out?
o Has the crisis affected autonomy and control of public-sector organisations?
o Has the crisis weakened or strengthened the use of NPM-style approaches? What
are the most likely further developments: will NPM instruments be neglected or
used more extensively in the upcoming years?
- Has the crisis caused only temporary short-term changes, or can we expect more
fundamental (systemic) shifts in public management?
The second set of questions addressing shifts in governance is more explanatory in character:
- What are the factors that could explain the differences in how the states have responded
to the crisis?

72 COCOPS Deliverable 7.2
- Which politico-administrative factors and financial-economic circumstances are
particularly important in explaining specific responses by the governments? Are there any
other relevant factors?
- What lessons can we learn for governance and public management from the states’
responses to the fiscal crisis?
The study employs both exploratory and explanatory approaches to comparatively investigate
the reactions of national governments to the fiscal crisis, based on single country studies. The
study will focus on the central government and not employment or health sectors which are
addressed in more depth by other WPs of the COCOPS project. The empirical research will
cover the time period from 2008 to 2012.
Based on the results of the preliminary three-country study by Kickert (2012a; 2012b), we
propose using an “input-throughput-output-outcome” model for the country studies (see the
graph below). The “input” component will serve as background information, providing
relevant facts about the socio-economic situation in different countries, and it is expected to
provide a country profile to better grasp (and explain) the further parts of the study. The
“throughput” and “output” components serve as central parts of the study, shedding light on
the states’ responses to the crisis in terms of cutback measures undertaken, the decision-
making context and related outputs in the crisis management. Lastly the “outcomes” section
presents the main findings and provides discussion and analysis about the possible long-term
outcomes of the crisis and subsequent governmental action.
Below we will specify how various parts of this approach will be addressed in a) short country
reports, b) country case studies, and c) trend report.
Short country reports
Short country reports will focus upon, collect data and analyse the first two parts of the model
above: “inputs” and “throughput”. The “input” section should not take more than a quarter of
the country report.
EXPLANATION
INPUTS THROUGHPUT OUTPUTS
OUTCOMES
COUNTRY REPORT COUTRY CASE
STUDY
TREND
REPORT

73 COCOPS Deliverable 7.2
INPUTS
A short country report will provide a brief overview of relevant background information about
the main politico-administrative and socio-economic characteristics of a country.
1. Politico-administrative system. Provide brief background information on the general
politico-administrative system of your country that is relevant to readers not so
familiar with your country (emphasis on the period of 2006-2011):
- General state structure (e.g. unitary state, federal state, parliamentary system,
centralised or decentralised, etc.);
- Type of political system (majoritarian or consensus);
- Type of government (single-party or multi-party coalition; minority or majority
government);
- Ideology of the governing parties;
- The role of various actors (e.g. strong and leading versus weak and coordinating prime
minister; unions) in political decision-making;
- Existing level of politicisation in governmental decision-making;
- Major and relevant public-sector reforms over the last few decades.
2. Socio-economic characteristics. The socio-economic information covers the time
period 2006-2012 based on Eurostat. We include socio-economic data from 2006 and
2007 to detect the outburst of the crisis, whereas the main body of empirical research
will cover the time period from 2008 to 2012. The Tallinn team will fill out the
following Table 1 for each participating country in order to allow for the comparability
of statistical data.
Table 1. Main socio-economic indicators 2006-2012
2006 2007 2008 2009 2010 2011 2012
GDP per capita
GDP growth
Budget deficit
Public debt
Inflation
Unemployment
rate
We propose to take maximum advantage of the existing Eurostat databases and the OECD
(2011) international study on states restoring public finances, especially of the many financial-
economic indicators that were composed for the OECD countries (GDP, budget deficit, public
debt, etc.).
3. Other important background/contextual information. Partners are expected to add
additional background information relevant to their specific national contexts, in
particular features that distinguish a specific country from other European or Western
models. This information may include, for example, pension systems, population
ageing, health care, importance of housing and banking sectors, membership in the
euro-zone or joining the Eurozone, etc.
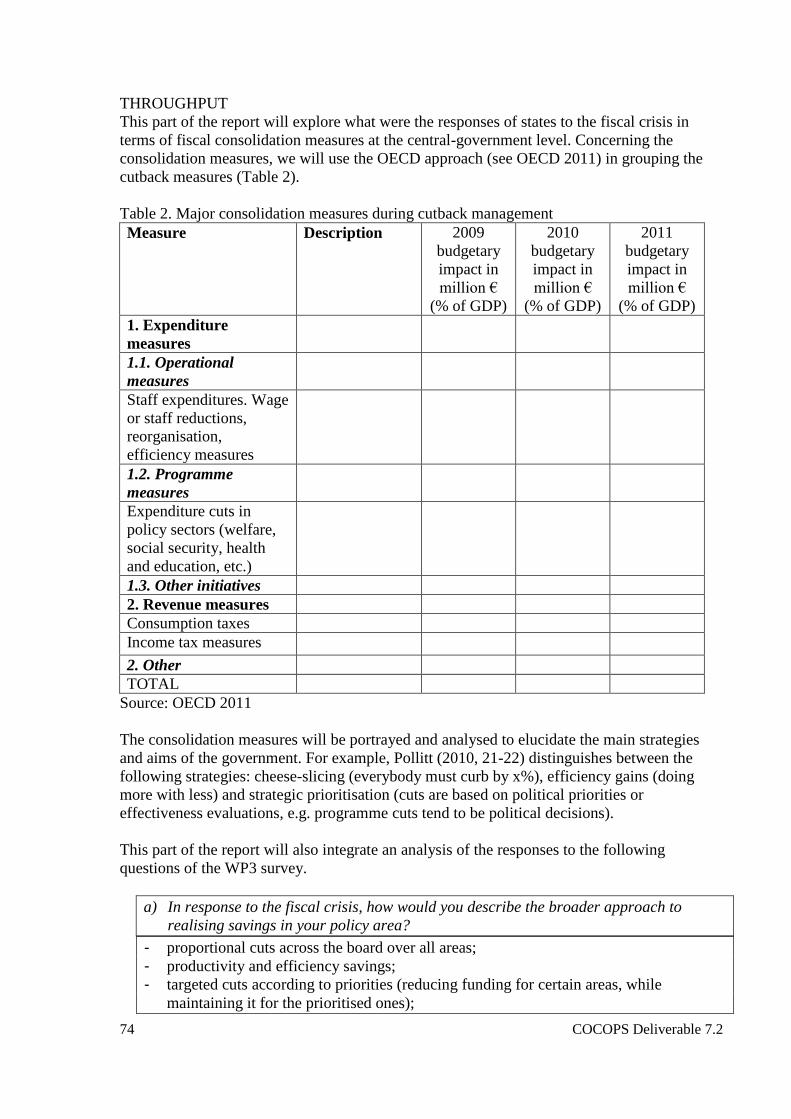
74 COCOPS Deliverable 7.2
THROUGHPUT
This part of the report will explore what were the responses of states to the fiscal crisis in
terms of fiscal consolidation measures at the central-government level. Concerning the
consolidation measures, we will use the OECD approach (see OECD 2011) in grouping the
cutback measures (Table 2).
Table 2. Major consolidation measures during cutback management
Measure
Description 2009
budgetary
impact in
million €
(% of GDP)
2010
budgetary
impact in
million €
(% of GDP)
2011
budgetary
impact in
million €
(% of GDP)
1. Expenditure
measures
1.1. Operational
measures
Staff expenditures. Wage
or staff reductions,
reorganisation,
efficiency measures
1.2. Programme
measures
Expenditure cuts in
policy sectors (welfare,
social security, health
and education, etc.)
1.3. Other initiatives
2. Revenue measures
Consumption taxes
Income tax measures
2. Other
TOTAL
Source: OECD 2011
The consolidation measures will be portrayed and analysed to elucidate the main strategies
and aims of the government. For example, Pollitt (2010, 21-22) distinguishes between the
following strategies: cheese-slicing (everybody must curb by x%), efficiency gains (doing
more with less) and strategic prioritisation (cuts are based on political priorities or
effectiveness evaluations, e.g. programme cuts tend to be political decisions).
This part of the report will also integrate an analysis of the responses to the following
questions of the WP3 survey.
a) In response to the fiscal crisis, how would you describe the broader approach to
realising savings in your policy area?
- proportional cuts across the board over all areas;
- productivity and efficiency savings;
- targeted cuts according to priorities (reducing funding for certain areas, while
maintaining it for the prioritised ones);

75 COCOPS Deliverable 7.2
- none/no approach required.
b) In response to the fiscal crisis, to what extent has your organisation applied the
following cutback measures?
- staff layoffs;
- hiring freezes;
- pay cuts;
- cuts in bonuses;
- pay freezes;
- cuts to existing programmes;
- postponing or cancelling new programmes;
- downsizing back offices;
- reducing front office presence, increased fees and user charges for users.
c) As a result of the fiscal crisis …
- … the power of the Ministry of Finance has increased;
- … decision-making in my organisation has become more centralised;
- … the unit dealing with budget-planning within my organisation has gained power;
- … conflict between departments has increased;
- … the power of politicians (vs. non-elected public officials) in the decision-making
process has increased;
- … the relevance of performance information has increased.
Non-COCOPS partners are invited to address similar issues through the use of other data
sources (e.g. governmental documents, additional interviews).
For analysing the survey results and the information obtained from the OECD report, we
suggest for each country team to conduct 3-5 semi-structured expert interviews with relevant
civil servants engaged in the cutback decision-making to shed light on the rationale of the
cutback measures undertaken. Interviewees may include ministerial department heads,
officials of the Ministry of Finance and experts from different policy domains.
Finally, please include a section on “lessons learned” based on your country report. This could
later be used for the development of a policy brief.
- What have been the lessons learned for public administration and governance
concerning the response to the fiscal crisis in your country?
- What have been the intended and unintended consequences of the response to the crisis
to public administration and governance?
- Could these lessons be useful for other countries?
Case studies
Case studies will integrate the information and analysis prepared for the short country reports.
It is expected that case studies provide more in-depth analysis for the “throughput” part and
link the empirical analysis to the theoretical literature. Case studies will focus upon “outputs”
and also incorporate country-specific explanations to the analysis.
OUTPUTS

76 COCOPS Deliverable 7.2
The aim of the “output” part of the study is to complement the existing research on fiscal
consolidation with a politico-administrative component by concentrating on the analysis of the
governmental decision-making process as well as on the shifts in governance and public
administration that the crisis has brought about. To do so, the decision-making effects at the
central governmental level will be analysed as proposed by Peters, Pierre and Randma-Liiv
(2011):
- Large and fundamental versus small and incremental decisions;
- Swift and episodic versus slow and continuous decisions;
- Centralised versus decentralised decision-making;
- Coherent, coordinated and systematical versus loosely coupled and fragmented
patchwork;
- Long-term structural versus short-term quick fixes.
From the viewpoint of crucial political difficulties with fundamental political priority-setting,
usually resulting in incrementalism and compromising, the first distinction will be the most
interesting. To what extent have governments been capable of political priority-setting in
taking the fiscal consolidation measures? What instruments have been used to promote that
(e.g. Britain’s “star chamber”, Germany’s “Schuldenbremse”, the Netherlands’
“reconsideration working-groups”)?
In addition to the specific characteristics of decision-making during the crisis itself, we are
also interested in whether the crisis has given rise to changes in governance and public
administration? For example:
- Have NPM-type management instruments been emphasised or rolled back during the
crisis?
- How has the crisis affected autonomy and control of public-sector organisations?
- Have there been changes in modes of coordination?
- Has the crisis influenced the use of performance indicators?
- Has the crisis brought about plans to reinvigorate performance management and
performance-budgeting?
- Has the crisis brought about a shift in the relationship between the public, private and
third sectors?
- Has the crisis revived the calls for more extensive use of contracting-out in delivering
public services?
Partners may choose to focus more thoroughly on specific aspects of public administration and
the decision-making process particularly relevant to their national contexts.
In carrying out case studies, please make use of the potential explanatory factors presented
below. If there are other factors that have not been mentioned in the proposal but are viewed
as relevant for explaining the results of the individual cases, then they should be pointed out
and discussed in the case studies.
Case studies will be based on different data sources. Relevant policy documents and reports by
national governments and international organisations (e.g. the EU, IMF, OECD),
governmental and independent audits, press releases of government organisations along with
newspaper and special media articles will provide information for tracking the pace of events
and main actors involved. Questions related to “outputs” should also be incorporated into the
interviews.

77 COCOPS Deliverable 7.2
Please elaborate the “lessons learned” section on the basis of the main findings of the country
case study.
Trend report
The trend report draws on the short country reports and case studies with the aim to explain
similarities and differences between country responses to the fiscal crisis (the “explanation”
part of the aforementioned model) on the one hand, and to assess the longer-term outcomes of
the crisis on public management and governance on the other hand.
EXPLANATION
We cannot investigate all the possible politico-administrative factors that are common in
comparative-politics studies such as “politics” (types of parliaments, electoral systems, party
systems, types of governments, prime ministers, etc.), “society” (civic culture, social
movements, interest groups, church, religion, etc.), “state and government” (constitution,
centralisation, fragmentation, the role of the judiciary etc.), and “administration” (career
systems, recruitment practices, politicisation, the scope of political control, characteristics of
bureaucracy, bureaucratic culture, etc.). Based on the existing literature and the results of the
preliminary study of how the UK, Germany and the Netherlands responded to the fiscal crisis,
we propose to look at the following explanatory factors:
- Type of political system (majoritarian or consensus);
- Type of government (single-party or multi-party coalition; minority government or
majority government);
- The number of veto points in political decision-making (simple polities with few veto
points vs. more complex polities with many veto points in political decision-making);
- The role of the prime minister (strong and leading vs. weak and coordinating);
- The role of the social partners (employers’ unions, trade unions etc.) in political
decision-making;
- The role of the electoral cycle in decision-making over fiscal consolidation;
- The role of the ideology of the governing parties (right-leaning vs. left-leaning parties);
- Existing level of politicisation in governmental decision-making;
- Existing modes of budget procedures and fiscal governance in the country:
centralisation vs. decentralisation of budgetary processes; the delegation mode of fiscal
governance (with a strong minister of finance) vs. the “contracts” mode of fiscal
governance vs. the “fiefdom” mode of fiscal governance (see e.g. Hallerberg, Strauch
and von Hagen 2009);
- The role of fiscal rules;
- The role of external actors like the IMF, the World Bank, the European Commission.
OUTCOMES
Although the recovery phase of the financial crisis already began in 2010, the impact of the
crisis on the patterns of governance is prolonged because of the complicated linkages between
states, markets and civil societies (Pollitt 2010; Thynne 2011). Therefore, the rather short time
frame is not suitable for comprehensive policy analysis to assess the outcomes of the
government responses to the crisis. Still, it is possible to draw some preliminary conclusions
by analysing the main trends.
In the concluding part of the trend report, we will briefly discuss issues related to the
distinction between short- and long-term outcomes. The emphasis is on the discussion whether
the governments prefer temporary measures or more permanent measures to decrease

78 COCOPS Deliverable 7.2
expenditures and/or increase revenues, and also whether the crisis has caused temporary short-
term changes or whether we can expect more fundamental (systemic) shifts in public
management. This will thereby build a bridge to WP8 for the discussion of the future of the
public sector.

79
Appendix 2. Economic indicators 2007-2012
Source: Eurostat
Real GDP growth rate General government deficit/surplus
(% of GDP)
General government gross debt
(% of GDP)
20
07
20
08
20
09
20
10
20
11
20
12
20
07
20
08
20
09
20
10
20
11
20
12
20
07
20
08
20
09
20
10
20
11
20
12
BE 2.9 1.0 -2.8 2.4 1.8 -0.3 -0.1 -1.0 -5.6 -3.8 -3.7 -3.9 84.1 89.3 95.8 96.0 98.0 99.6
DE 3.7 3.3 1.1 -5.1 4.2 0.7 -1.6 0.2 -0.1 -3.2 -4.3 0.2 68.1 65.2 66.7 74.4 83.0 81.9
EE 7.5 -4.2 -14.1 3.3 8.3 3.2 2.4 -2.9 -2.0 0.2 1.0 -0.3 3.7 4.5 7.2 6.7 6.0 10.1
ES 3.5 0.9 -3.7 -0.3 0.4 -1.4 1.9 -4.5 -11.2 -9.3 -8.5 -10.6 36.3 40.2 53.9 61.2 68.5 84.2
FR 2.3 -0.1 -3.1 1.7 1.7 0.0 -2.7 -3.3 -7.5 -7.1 -5.2 -4.8 64.2 68.2 79.2 82.3 85.8 90.2
HU 0.1 0.9 -6.8 1.3 1.6 -1.7 -5.1 -3.7 -4.6 -4.2 4.3 -1.9 67.1 73.0 79.8 81.4 80.6 79.2
IE 5.4 -2.1 -5.5 -0.8 1.4 0.9 0.1 -7.4 -13.9 -30.9 -13.4 -7.6 25.1 44.5 64.9 92.2 106.4 117.6
IS 6.0 1.2 -6.6 -4.0 2.6 1.6 5.4 -13.5 -10.0 -10.1 -4.4 n/a 28.5 70.3 87.9 93.1 98.8 n/a
IT 1.7 -1.2 -5.5 1.8 0.4 -2.4 -1.6 -2.7 -5.4 -4.6 -3.9 -3.0 103.1 105.1 116.0 118.6 120.1 127.0
LT 9.8 2.9 -14.8 1.5 5.9 3.7 -1.0 -3.3 -9.4 -7.2 -5.5 -3.2 16.8 15.5 29.3 37.9 38.5 40.7
NL 3.9 1.8 -3.7 1.6 1.0 -1.0 0.2 0.5 -5.6 -5.1 -4.7 -4.1 47.4 45.3 58.5 60.8 62.9 71.2
NO 2.7 0.0 -1.7 0.7 1.4 3.1 17.5 18.8 10.6 11.2 13.6 n/a 51.5 48.2 43.5 43.7 29.0 n/a
SI 7.0 3.4 -7.8 1.2 0.6 -2.3 0.0 -1.9 -6.0 -5.7 -6.4 -4.0 23.1 22.0 35.0 38.6 46.9 54.1
UK 3.6 -1.0 -4.0 1.8 0.8 0.3 -2.7 -5.0 -11.5 -10.2 -8.3 -6.3 44.4 54.8 69.6 79.6 85.7 90.0