iscussio aes o - ssb.no · aou a asog cos ucio aoac is aie usig a eo-coecio eeseaio o e eeome i cos...
TRANSCRIPT


Discussion Papers No. 187 • Statistics Norway, January 1997
Nils Martin Stolen and Turid Åvitsland
Has Growth in Supply ofEducated Persons Been Importantfor the Composition ofEmployment?
AbstractIn the Norwegian fabricated metal industry there has been a shift ih demand from unskilled to skilledworkers during the period 1972 to 1990, and relative demand for white collar employees has alsoincreased. The paper analyses the factors behind the shift in the composition of these three kinds oflabour. A translog cost function approach is applied, using an error-correction representation of thedevelopment in cost shares. The results indicate substitutability between unskilled and both skilled andwhite collar workers. Increased supplies of skilled workers and engineers seem to have been the mostimportant factors for the change in the composition of employment, indicating lack of persons withthese kinds of education. In addition, unskilled workers have been rationalized away as a result oftechnical progress.
Keywords: Labour market, employment composition, human capital, wage differentials, time seriesanalysis.
JEL classification: J21, J23, J31.
Acknowledgement Thanks to Tor Jacob Klette, Kjersti-Gro Lindquist and Terje Skjerpen for valuablesuggestions and comments. Financial support from the Directorate of Labour is gratefully appreciated.
Address: Nils Martin Stolen, Statistics Norway, Research Department, P. 0. Box 8131 Dep., N-0033Oslo, Norway. E-mail: nmsq , ssb.noTurid Åvitsland, Statistics Norway, Research Department. E-mail: [email protected]

1. IntroductionWhen analysing the labour market and the links to the entire economy it is often too simple to assume
labour to be homogeneous. In models of endogenous economic growth l the increasing amount of
skilled labour is held to be of importance, and the growing rate of unemployment in most Western
countries during the past two decades has contributed to an increased focus on the cyclical variability
of employment, hours and real wages for skilled and unskilled workers2. The analyses by among
others Kydland and Prescott (1988) and Juhn et al. (1991) indicate that demand for low-skilled
workers is most severely hurt in a recession. In US unemployment has been highly concentrated
among less skilled individuals, and this has also been the case in most European countries3 .
Knowledge of factors influencing demand for different kinds of labour is thus important when
analysing the labour market. In their analyses for respectively US and UK, Berman, Bound and
Griliches (1994) and Machin (1994) fmd that the major shifts towards skilled labour are due to
changes within-industry or establishment changes. According to the analysis by Cappelen and Stolen
(1994) the composition of labour differs a lot between Norwegian industries, indicating that a change
in the relative importance of different industries may influence aggregate demand for different
categories of skill levels. As production technology and behaviour also may differ between industries,
we have found it most appropriate in the first hand to focus on one single Norwegian industry, namely
the fabricated metal industry. This industry is one of the most important Norwegian manufacturing
industries and data are also of higher quality than for most other industries4.
In earlier empirical works analysing demand for different categories of labour, a particular interest has
been devoted to the possibilities of substitution. As early as 1969 Griliches showed that the possibility
of substitution between real capital and blue collar workers was larger than between real capital and
white collars. The result, which is also confirmed among others by Berndt and Christensen (1974),
indicates that it is not appropriate to treat labour as a separable group. Demand for different kinds of
labour therefore ought to be analysed simultaneously with other factors of production. In this analysis
the translog cost function introduced by Christensen, Jorgenson and Lau (1973) is chosen as a flexible
functional form, and the theoretical foundation is further discussed in section 2.
See e.g. Romer (1990) and Grossman and Helpman (1991).
2 See e.g. Juhn et al. (1991) and Keane and Prasad (1993).
3 See e.g . Machin (1994) for an analysis of changes in relative demand for skills in the UK labour market, vanOurs and Ridder (1995) for the Netherlands, Shadman-Mehta and Sneessens (1995) for France, Risager (1993)for Denmark and Cappelen and Stolen (1994) for Norway.
4 To get an overall *tam we should of course have analysed demand for different kinds of labour in all of themost important industries regarding employment, but we have not managed to do that yet.
3

120 —
100 —
80 ——Unskilled—Skilled— — — White collar, secondary schoolUniversity, low level— - — - University, high level
40 —
20 —. .................
........ _ .............o I I 1- I 4- -4-f I 4 I I I I I— IIII1972 • 1974 1976 1978 1980 1982 1984 1986 1988 1990
60 —
Due to lack of consistent time series data for wages and employment by skill or education, analyses of
factors determining relative demand for different kinds of labour are almost non-existent in Norway5 .
However, in the last years new time series for wages and man-hours by education and industry
corresponding to the National Accounts (cf. Skotner (1994)) are established for the period 1972 to
19906. For the fabricated metal industry labour is divided into five categories as presented in figure 1.
Figure 1. Manhours by education in the fabricated metal industry. Millions
The figure shows that the relative number of man-hours for unskilled workers has decreased during
the period 1972 to 1990 while the shares of man-hours done by skilled workers and employees with
secondary or higher education have increased.
From figure 2 relative wages, however, seem to have stayed almost constant, indicating that other
factors have been important when explaining the shift in the composition of labour. One possibility is
that non-neutral technological progress has caused unskilled workers to be rationalized away. Another
explanation may be that small relative wage differentials in Norway may have caused lack of skilled
workers, and the increasing number of man-hours done by this group may reflect growth in supply.
The empirical results presented in section 4 support these explanations. Technological progress thus
seems to have been important when explaining the decreasing share of man-hours done by unskilled
workers, while increasing supply has increased actual employment for skilled workers.
5 One exception is Aamdal (1987) who divides labour into blue collar and white collar workers in an analysis offactor demand in the fabricated metal industry.
6 Work is in progress to update these series.
4
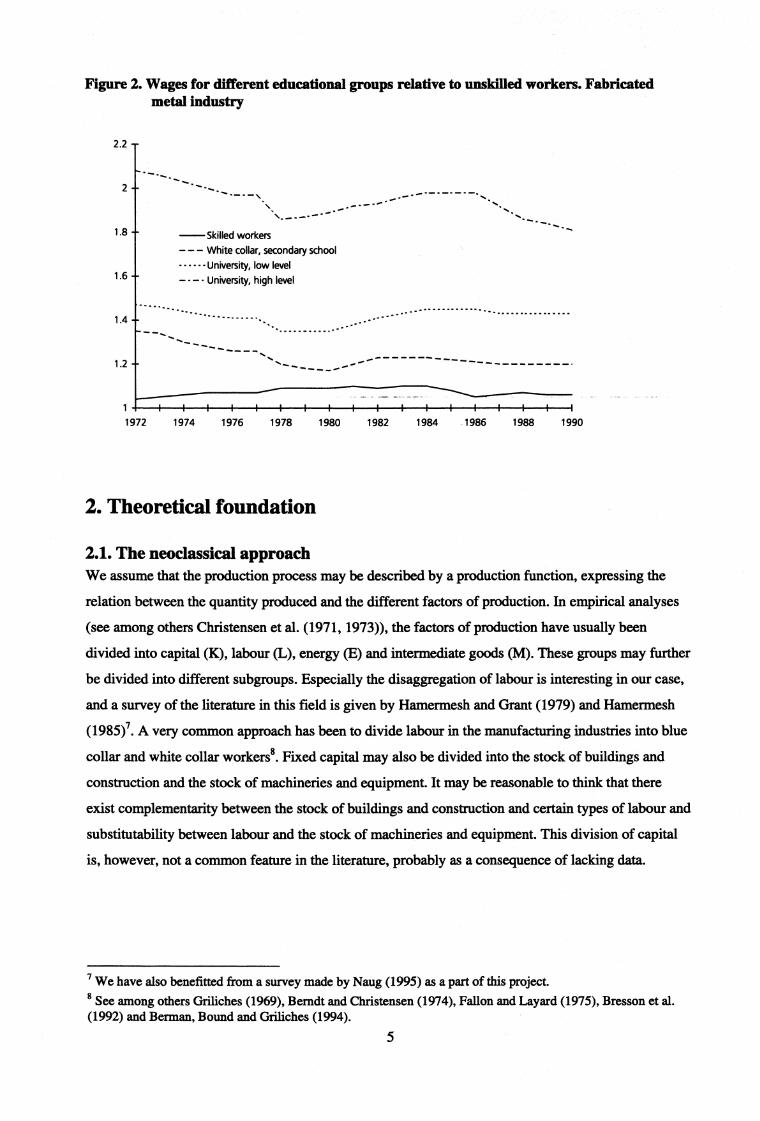
Figure 2. Wages for different educational groups relative to unskilled workers. Fabricatedmetal industry
2.2 —
2 —
".• -
—Skilled workers—— — White collar, secondary schoolUniversity, low level—- — - University, high level
.....
1.8 —
1.6 —
1.4 — ............
.................. .........
1.2 —
1 1972 1974 1976 1978 1980 1982 1984 1986 1988 1990
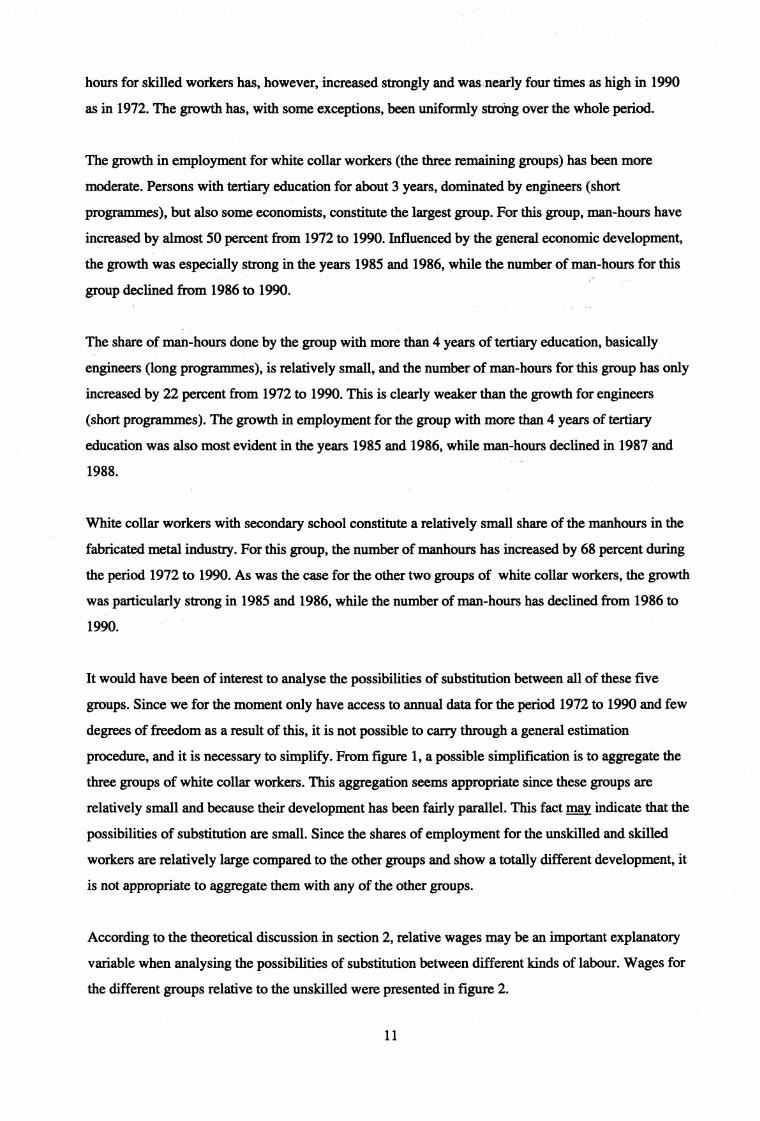
2. Theoretical foundation
2.1. The neoclassical approachWe assume that the production process may be described by a production function, expressing the
relation between the quantity produced and the different factors of production. In empirical analyses
(see among others Christensen et al. (1971, 1973)), the factors of production have usually been
divided into capital (K), labour (L), energy (E) and intermediate goods (M). These groups may further
be divided into different subgroups. Especially the disaggregation of labour is interesting in our case,
and a survey of the literal= in this field is given by Hamermesh and Grant (1979) and Hamemiesh
(1985). A very common approach has been to divide labour in the manufacturing industries into blue
collar and white collar workers8. Fixed capital may also be divided into the stock of buildings and
construction and the stock of machineries and equipment. It may be reasonable to think that there
exist complementarity between the stock of buildings and construction and certain types of labour and
substitutability between labour and the stock of machineries and equipment. This division of capital
is, however, not a common feature in the literature, probably as a consequence of lacking data.
7 We have also benefitted from a survey made by Naug (1995) as a part of this project.
8 See among others Grriliches (1969), Berndt and Christensen (1974), Fallon and Layard (1975), Bresson et al.(1992) and Berman, Bound and Griliches (1994).
5

In the general analyses of factor demand9, it is often assumed that capital, labour, energy and
materials constitute separable subgroups, but the empirical results from analyses where labour is
divided into different catagories indicate that this may not be appropriate. A very common result in
the literature is «capital-skill complementarity» which means that the possibilities of substitution
between blue collar workers and capital are greater than the possibilities of substitution between white
collar workers and capital. This result is found by among others Griliches (1969), Fallon and Layard
(1975) and Berman, Bound and Griliches (1994), and the results by Berndt and Christensen (1974)
indicate that white collar workers and fixed capital even may be technical complementary factors of
production.
In most countries a considerable decrease in the relative demand for unskilled workers is observed.
The technological progress may have been an important factor behind this development, and in most
of the earlier analyses it has been represented by a trend. Although a «look» at the data may indicate
that technical progress is not neutral, this is taken into consideration in only a few of the earlier
analyses reported in Hamermesh (1993). But after the analysis by Berman, Bound and Griliches
(1994) technical progress represented by expenditures on R&D and computers has been held to be a
main explanatory factor. An expanding international trade with higher import shares is also found to
be of importance in some analyses.
In earlier analyses of producer behaviour on Norwegian data it has been difficult to construct relevant
time series for the user cost of capital. Particularly, it may be troublesome to get good data for the
enterprises' price expectations. As pointed out by Hamermesh (1986), this is a common problem in
most countries, and some simplifications are made. An additional problem in Norway is the fact that
a regulated credit market with low rates of interest until the middle of the 1980s contributed to very
low user costs, and even negative ones for years with a strong increase in prices of fixed capital. To
avoid the problems with the user cost of capital, we have chosen to regard the stock of capital as given
to concentrate the analysis on the possibilities of substitution between the variable inputs. Our focus
here is thus on the conditional demand functions.
Based on assumptions of cost minimizing behaviour for a given level of production, capital stock and
input prices, demand for the different kinds of labour may be expressed like:
(1) Li = g i (Wi / , . . I W„ I Pm ,X,CB,CM,TIME)
=
9 Cf. Christensen et al. (1971, 1973) and Hesse and Tarkka (1986).
6

where Li is the number of manhours for educational group i, Wi is wages per manhour for group i, Pm
is the price of intermediate goods, X is gross output, CB is the stock of buildings and construction, CM
is the stock of machineries and equipment, and TIME is a trend representing technological progress.
The equations for demand for labour ought to be estimated simultaneously together with intermediate
goods. In the case with more than two factors of production, a functional form like CES will be too
restrictive regarding substitution. In most of the empirical works with more than two factors of production,
a common approach has been to use the dual cost function and from this derive the demand equations.
The translog cost function introduced by Christensen, Jorgenson and Lau (1971, 1973) is a widely
used functional form in this respect because of its flexibility, not imposing any a priori restrictions on
the possibilities of substitution. This function may be interpreted as a quadratic approximation in the
logarithms of a general, continous, twice differentiable cost function and may be expressed as:
1 wk--,v-,(2) ln C(Wi , Pm , X, CB, CM , TIME) = c +I c i ln Wi + — 2., 2_, c i; n Wi ln Wi c p n Pm +
1 1 ir 1 i v. 1 r.,, no, 1-""-- C pmpm On Pm ) 2 + Cx in Lk + --- Cxx (in ii.) + C cB ...n ........., + — C cBcB On CB) 2 +CCM 1nCM+2 2 2
—1
ccmcm On CA4) 2 + CT ln TIME + — c n, On TIME) 2 + I C ip ln Wi ln PA, + 1, . in Wi ln X +1
2 2 i i
If icB ln Wi ln CB +li c ich, ln Wi in CM + Ii C iT ln VVi in T/ME + cpmx ln Pm in X +
C pmcB in Pm in CB + C mow in Pm in CM + C pmT in Pm In TIME + c Ix ln X In CB + CXCM nX1nCA1
+cxT in X ln TIME + C atoll in CB in CM + C cBT in CB ln TIME + C cmT in CM ln TIME
= 1, . , n
By partial differentiation of the translog cost function with respect to wages for group i, using
Shephard's lemma and claiming symmetry, we find the following expression for the shares of total
variable costs:
dinC L.(3) S. = = = c i + cu inC iPM in + C LIC in X C iCB in CB +
CiCM
a in Wi C
in CM + c ln TIME
i= 1,...,n
In addition, there will be a similar equation for the cost share of intermediate goods.
7

2.2. Rationing from the supply sideThe existence of an extensive unemployment in many countries indicates that wages are not so
flexible that they are able to clear the labour market in the short-mn. This is the basis for the
discussion of macroeconomic disequilibrium models by Sneessens (1983) and Drèze and Sneessens
(1986). They also discuss a possible disequilibrium in the product market and distinguish between
classical and keynesian unemployment. In order to simplify, we ignore the last aspect, but concentrate
on the possibility for disequilibrium in the labour market.
In its simplest form the disequilibrium thought implies that the actual observed employment is the
smallest of supply and demand and may be expressed as follows:
(4) Li = min(LD i , LSi )
where LDi is the demand for labour of type i and LS i is the supply of labour of type i.
Even if labour is divided into different categories, there may be a large heterogeneity within these
groups. Therefore, it is relevant to assume that a relation like (4) applies to each enterprise. Further,
the enterprises may face different situations in such a way that some are rationed from the supply side
while the actual employment is determined from the demand side for others.
Assuming a log-normal distribution among the micro units regarding this aspect, Lambert (1988) has
shown that aggregate employment may be expressed as a simple CBS-aggregate of demand and supply.
(5) Li =(L,Di-P +LSi-P ) uP
Here 1/p is proportional to the mismatch between supply and demand at the micro level. The situation
may be illustrated as in figure 3. Actual employment can never be as large as supply or demand, but
will approach the smallest of them asymptotically when the discrepancy becomes large. The distance
between actual employment L? and the point of intersection between supply and demand LD° LS°
measures the mismatch for this category of labour.

Figure 3. The relation between observed employment, supply and demand
W/P
Li LD? =LS?
A simplification in the works by Sneessens (1983) and Drèze and Sneessens (1986) is that they only
specify one kind of labour (even though inhomogeneity implicitly is the basis for the structural
problems). Our aim is to analyse demand for several kinds of labour simultaneously. In such a
situation, limitations from the supply side concerning one kind of labour may also be of importance
for the actual employment of other groups. Lack of labour with one kind of education may therefore
lead to higher employment for labour with a related education (especially if the latter level of
education is higher than what is needed, but also to a certain extent if it is lower).
The situation with two categories of labour may be illustrated as in figure 4. Assuming cost
minimisation for a given output, the situation with unrestricted demand is given by A. We then
assume that there is a limitation on the supply of labour of type 1. The limited supply, denoted L I , is
smaller than the unrestricted demand, LI, . In order to produce the quantity X = )7, the use of labour
of category 2 has to increase to 14 which is larger than the use of this category without rationing. We
notice from the figure that if the supply of category 1 increases, the demand for category 2 will
decrease.
The situation also raises some other questions. With rationing, the produced quantity may be
influenced by the supply of the specific category of labour. Relative wages may also be influenced if a
disequilibrium situation lasts. A rather comprehensive analysis is needed in order to analyse these
questions. The econometric methodology for estimating disequilibrium models is described in among
9

Figure 4. The situation with rationing of one kind of labour
L2
L B2
L A2
x=
Lt
others Quandt (1982). However, it may be rather irrelevant to talk about a specific supply of labour
directed towards a single industry 10. In order to simplify, this analysis is limited to include supply of
different categories of labour as additional factors of importance for the actual composition of
employment.
3. Actual development - Choice of aggregationIn Statistics Norway, time series for wages and employment in the fabricated metal industry
consistent with the National Accounts are established for the following 5 educational groups (cf.
Skotner (1994)) (length of education in parentheses):
Compulsory education / upper secondary school, first year (-10 years): Unskilled
Upper secondary school, second and third year, vocational training (11 - 12 years): Skilled
Upper secondary school, second and third year, general education (11 - 12 years): White collar,
secondary school
Tertiary education, one to four years (13 - 16 years): University low level
Tertiary education, more than 4 years (17 years - ): University high level
As presented in figure 1, unskilled workers constitute the largest group, and the number of man-hours
for this group has fallen dramatically during the depicted period. Approximately half as many man-
hours were executed by the unskilled in 1990 compared to the situation in 1972. The number of man-
10 Cf. the discussion of supply variables in section 3.
10
hours for skilled workers has, however, increased strongly and was nearly four times as high in 1990
as in 1972. The growth has, with some exceptions, been uniformly strong over the whole period.
The growth in employment for white collar workers (the three remaining groups) has been more
moderate. Persons with tertiary education for about 3 years, dominated by engineers (short
programmes), but also some economists, constitute the largest group. For this group, man-hours have
increased by almost 50 percent from 1972 to 1990. Influenced by the general economic development,
the growth was especially strong in the years 1985 and 1986, while the number of man-hours for this
group declined from 1986 to 1990.
The share of man-hours done by the group with more than 4 years of tertiary education, basically
engineers (long programmes), is relatively small, and the number of man-hours for this group has only
increased by 22 percent from 1972 to 1990. This is clearly weaker than the growth for engineers
(short programmes). The growth in employment for the group with more than 4 years of tertiary
education was also most evident in the years 1985 and 1986, while man-hours declined in 1987 and
1988.
White collar workers with secondary school constitute a relatively small share of the manhours in the
fabricated metal industry. For this group, the number of manhours has increased by 68 percent during
the period 1972 to 1990. As was the case for the other two groups of white collar workers, the growth
was particularly strong in 1985 and 1986, while the number of man-hours has declined from 1986 to
1990.
It would have been of interest to analyse the possibilities of substitution between all of these five
groups. Since we for the moment only have access to annual data for the period 1972 to 1990 and few
degrees of freedom as a result of this, it is not possible to carry through a general estimation
procedure, and it is necessary to simplify. From figure 1, a possible simplification is to aggregate the
three groups of white collar workers. This aggregation seems appropriate since these groups are
relatively small and because their development has been fairly parallel. This fact may indicate that the
possibilities of substitution are small. Since the shares of employment for the unskilled and skilled
workers are relatively large compared to the other groups and show a totally different development, it
is not appropriate to aggregate them with any of the other groups.
According to the theoretical discussion in section 2, relative wages may be an important explanatory
variable when analysing the possibilities of substitution between different kinds of labour. Wages for
the different groups relative to the unskilled were presented in figure 2.
11

— Gross output— — — Buildings and construction Machineries and equipment
40 —
30 —
20 —
60 —
50 —
We notice that these wage ratios have not changed much, indicating that changes in relative wages
probably have not been very important when explaining the changes in the composition of
employment over the depicted period.
Changes in production and the stock of capital may have influenced the composition of employment,
and the development in gross output, the stock of buildings and construction and the stock of
machineries and equipment in the fabricated metal industry is shown in figure 5.
Figure 5. Gross output, stock of buildings and construction and stock of machineries andequipment in the fabricated metal industry. Billion kroner. Fixed 1991 prices.
10-------------- _ _ _ _ _
---------------- ----------------
..................................................................
0
1972 1974 1976 1978 1980 1982 1984 1986 1988 1990
We notice that the stock of buildings and construction and the stock of machineries and equipment
have increased steadily over the period. The importance for the composition of employment will
depend on whether there are complementarity or altemativity between the different educational
groups and the two kinds of capital. The graph for gross output reflects the business cycles; a clear
growth in 1972 - 1974, thereafter a weak development until 1983, a strong growth over the period
1984 - 1986 and then stagnation and decline until 1989. This development may have been of some
importance when explaining the changes in the composition of labour, especially in the short-run as
demand for unskilled labour may be more sensitive to changes in production than demand for skilled.
Since there has been a large shift in the composition of labour although relative wages have been
almost constant, this may indicate that supply has been a limiting factor. This may especially be the
case for skilled workers and white collar employees with higher education. A complicating element is
that a specific kind of labour is used by several sectors. Apart from some kinds of education, mainly
12

..
directed towards certain sectors, it makes no sence to talk about sector specific supply of labour. If
there is lack of one category of labour, this may affect several sectors, and the analyses of actual
employment in these sectors ought to be dealt with simultaneously. This may turn out to become a
rather complex analysis, and it has been necessary to simplify in order to grasp the most important
elements. The number of persons 16-66 years old with their highest completed education in the group
metal trade, electrical and electronics programmes and the group of engineers (both short and long
programmes) may be used as indicators for the supply of skilled workers and white collar employees
with education relevant for the fabricated metal industry. These variables are included as additional
explanatory factors in the empirical analysis according to the discussion in sectibil '2.2. Figure 6
shows that these variables have increased substantially during the period 1972 to 1990.
Figure 6. Number of persons 16-66 years by education. 1000 persons
160 —
Metal trade, electrical and electronics programmes140 — Energineers (both short and long programmes)
120 —
100 —
80 — . . ..•
60
— .............. ................ . .... ......
40
20 —
1972 1974 1976 1978 1980 1982 1984 1986 1988 1990
4. Empirical analysisAccording to equation (3), demand for different kinds of labour constitutes a system of equations. In
such a demand system, economic theory imposes restrictions across equations, and these restrictions
ought to be taken into account. The full information maximum likelihood method (FIML) is therefore
used.
With several explanatory variables and a general demand system for three kinds of labour, there are
no degrees of freedom left with annual data from 1972 to 1990. Partial estimation of the three demand
equations has thus been necessary to eliminate the less important variables and so increasing the
degrees of freedom in the system of equations.
13

4.1. Partial estimationsIt is reasonable to assume that the possibility for substitution with other categories of labour and other
factors of production is largest for unskilled employees, and therefore a rather general demand
equation has been estimated for this group. Both the wage level relative to the other two groups and the
price of intermediate goods, gross output, the stock of buildings and construction, the stock of machinery
and equipment and a term indicating technological progress (a linear trend) have been included. If supply
of skilled workers has been scarce at the actual wages, unskilled workers may have been employed
instead. In order to take this into consideration, the number of persons in working age with their highest
completed education in metal trade, electrical and electronics programmes was included as an
explanatory variable. For skilled workers and white collar employees, possibilities of substitution against
each other and against intermediate goods were assumed away a priori in the partial estimations.
The three equations for the different kinds of labour were estimated separately as an error-correction
model, using Ordinary least squares (OLS). The estimation results presented in appendix A indicate
that gross output may be of importance both in the short- and the long-run for all groups, except for
skilled workers, where no effect was found in the long-run. Further, a hypothesis claiming that the
elasticity for the impact of gross output is equal to 1 in the long-run could not be rejected, indicating
that employment and production, partially considered, may change equivalently in the long-run.
A negative trend was significant for all the three groups. The results also indicated that supply of
persons with education in metal trade, electrical and electronics programmes is of importance for the
observed man-hours done by skilled workers and that the supply of engineers is of importance for the
observed man-hours done by white collars. In general, the stock of buildings and construction and the
stock of machineries and equipment were of no importance, the only exception is the demand for
skilled workers, where the stock of buildings and construction was significant. The elasticity was
relatively large, and together with a large negative trend this may indicate some problems of
multicollinearity.
For the unskilled workers, their wage level relative to the skilled workers was not significant, neither
in the short-mn nor in the long-run, while the coefficient of their wage level relative to white collar
employees was significant in the short-mn, but not in the long-run. For skilled workers, however, their
wage level relative to the unskilled workers level was significant, both in the short- and long-run,
while the wage level between white collars and unskilled was of no significance for the white collars.
Since most of the wage coefficients were insignificant, this may be an indication of small possibilities
of substitution. However, as the wage ratios have been fairly constant over the estimation period, this
may have caused problems in getting precise estimates.
14

For the unskilled workers the price on intermediate goods relative to the unskilled's wage level was
not significant neither in the short-run nor in the long-run. This variable was assumed away apriori for
the skilled workers and the white collars.
4.2. Shnultaneous estimationBased on the results from the partial estimations, the demand system (3) is simplified as we have
omitted the stock of machineries and equipment and the price on intermediate goods both in the short-
and long-run. As intermediate goods are excluded from the analysis, each educational group's share of
total labour costs is used as dependent variables. Production is omitted because of the assumption of
constant returns to scale in the long-mn, a restriction which was not rejected by the partial
estimations. From the discussion in section 2.2, supply variables are included as additional
explanatory variables. More specifically, the supply of skilled and white collars is included since a
hypothesis claiming that there have been too few skilled persons and white collars may seem realistic.
Finally, we have imposed the restriction cups = -csps since an effect on demand for white collar
employees as a result of a change in supply of skilled workers may seem unrealistic. By limiting the
analysis to the three kinds of labour: unskilled (U), skilled workers (S) and white collar employees
(W), the symmetry and homogeneity restrictions mean that csu is equal to cus (symmetry), and cuw
and csw are, respectively, equal to -(cuu + cus) and -(cus + css) (homogeneity).
The adjustment to the long-run solution (which is conditional on the capital stock) may take time, and we
have therefore used a general error-correction representation. Since the cost shares for the different
educational groups always sum to 1, 14S i will equal 0, and any of the three cost share equations may be
expressed in temis of the other two by using adding-up conditions. This also means that the sum of the
residuals for the three educational groups in the econometric specification equals zero, implying a singular
and non-diagonal error covariance matrix. When estimating, one of the cost shares must therefore be
omitted (see Anderson and Blundell (1982)), and we have chosen to leave out the white collar employees.
Because of the few degrees of freedom, we only include the current changes in the explanatory
variables in the short-run part of the model. The following two simplified error-correction equations
are the point of departure for the simultaneous estimation. Lower case indicate the natural logarithm
of the variables (t = ln(TIME)).
(6) ASia =a ix Ax t +a i Awy,t ±aisAws,t Aww,t +a ips APSt +ct i APWt —
biU (SU,t-1 CU CUU W
C US W S4-1 + UU + C US* W t-1 "-n". C Ul t t-1
C UPS PS t-1 C UPW PWt-1 C UCB Cb t-1) bis (S(S,_1 cuswu,t-i ws,t-i+(cus css w,t-1
-"-.0 sr !' t_i C sps PS C spw PWt_i C s Cb i
15
= U, S
Here, PS is the ratio between the number of persons educated in metal trade, electrical and electronics
programmes and the total population in the group 16 - 66 years, PW is the ratio between the number
of persons educated as engineers (both short and long programmes) and the total population in the
group 16-66 years, CB is the stock of buildings and construction and ui t is the error-term. We assume
that the explanatory variables are weakly exogenous in the cost share equations, and that the errors are
normally distributed with mean zero, in addition to the following assumption:
, {/ fort=sE(u t ,u s )=
0 otherwise
where ut is a vector at time t, containing the two errors uGt and UvR.
In order to estimate the two equations in (6), the one-stage procedure is generally recognised. The
one-stage procedure means that both long-run and short-mn coefficients are estimated simultaneously.
Because of few degrees of freedom and almost constant relative wages, the one-stage approach turned
out to be troublesome. There were severe problems with stability and convergence when simulating the
two cost share equations from 1991 onwards, holding all the exogenous variables constant at their 1990
level. The elasticities of substitution, in addition to some of the trend and supply coefficients, were
unreasonably large. We therefore chose a two-stage procedure, that is first estimating the two static,
long-run equations and then using the lagged residuals as input when estimating the dynamic model, that
is getting estimates for the short-mn coefficients and the adjustment parameters. Draper and Manders
(1996) have used such a two-stage procedure, but in addition re-estimated the long-nm parameters in
another round given the dynamic structure and repeating this procedure until convergence is obtained.
The estimation results from the two-stage procedure are presented in the first column of table B1 in
appendix B. We first estimated the two static, long-run equations using FIML. As we could not use t-
values or the likelihood ratio test since the variables probably are non-stationary and the estimators
therefore had a non-standard distribution, see for instance Barierjee, Dolado, Galbraith and Hendry
(1993), we looked at the values of the estimated coefficients in order to determine the omission of
variables (variables with coefficients with wrong sign were omitted).
In the second stage we estimated the short-run coefficients and the adjustment parameters, using the
lagged residuals from the first stage as variables. The calculated eigenvalues of the coefficient matrix
of the two cost share variables now became 0.64 and 0.28, indicating a stable system. According to
the estimation results, the stock of buildings and construction has no effect on any of the cost shares
and wages for skilled and supply of engineers have no effect on the cost share for skilled in the long-
16

run. Concerning the adjustment parameters and the other short-mn effects, the deviation from the
long-mn relation for unskilled was omitted in the equation for skilled, in addition to wages for white
collars and supply of engineers. In the fmal estimation result we also imposed the restriction aups = -
asps which was not rejected.
Because the cost shares must stay in the interval 0 to 1 also when the equations are used for
projections outside the sample, we have found it more appropriate with a log-linear than a linear
vend. In other words, the effect of the trend on the cost shares decreases over time. According to the
simultaneous two-stage estimation, the partial effects of the trend from 1990 to 1991 implies a 0.15
percentage point decrease in the cost share for unskilled workers, a 0.11 percentage point increase in
the cost share for skilled workers and a partial increase of 0.05 percentage point in the cost share for
the white collars.
There are indications that there has been a structural break in the technological development,
particularly in the US, over the 1980s, see OECD (1994). This technical change has been biased in
favour of more highly educated persons. In order to investigate if this is the case in Norway, we
introduced a dummy variable in the final estimation result for the two static, long-mn equations. This
dummy variable is 0 before 1984 and 1 from 1984 onwards (the chosen break point is a bit arbitrary),
and is multiplied with the additional variable log(1TME). We can not rely on an ordinary Chow-test
with the two-stage estimation method. Instead, large changes in the estimated elasticities and in the
adjustment parameters when introducing the mentioned dummy variable may be an indication of a
structural break in the technological development. The sign of the trend coefficients alters after the
break point for all the three groups, but apparently in the wrong direction. The price elasticities are
also somewhat altered, but the changes are, however, not very large (see table 1). From this exercise
there are thus no indications of a shift in the technological progress in favour of more skilled and
white collar workers relative to unskilled. However, the results are rather inconclusive as the change
in the trend coefficients also may be influenced by other factors than the technological development.
The long-mn Hicks-Allen partial elasticities of substitution and the wage elasticities are defmed in
equation (7)-(10), see Berndt and Wood (1975). The elasticities of substitution are given by:
(7 ' +1) a i . = +1 for i j.1 Si Si
and
i2(8)
+S= cli or all
Si2
17

The wage elasticities are given by:
(9) e 1 =Sa
and
(10) E = j og ii
The presented elasticities in table 1 are based on the cost share from the last year of observation,
1990, because this gives the most up-to-date figures. We also present the wage elasticities from the
partial estimation in order to compare the results.
Table 1. Long-run Hicks-Allen partial elasticities of substitution and long-run own and crossprice elasticities. Partial, two-stage and two-stage with break in the trend
Elasticities of substitution Partial estimation Two-stage Two-stage with breakin the trend
aus 2.99
2.09
auw 1.65
0.47
asw -2.37 -0.84
Wage elasticities
euu 0 -1.22 -0.67
eus 0 0.77 0.54
euw 0 0.46 0.13
esu 3.07 1.40 0.98
ess -3.07 -0.74 -0.74
esw 011 -0.65 -0.23
ewu 0 0.77 0.22
ews 0" -0.61 -0.22
eww 0 -0.16 -0.004
for i j
for all i.
11 Assumed apriori.
18

We notice that the results from the simultaneous estimations indicate substitutability between
unskilled and both skilled and white collar employees and complementarity between white collars and
skilled. The elasticities of substitution from the two-stage estimation with break in the trend all have
the same sign as those without break. The elasticities are, however, a bit smaller. The direct
elasticities of wages have the correct sign (negative) in both the simultaneous estimations.
The results from table B1 further indicate that supply of skilled persons has an effect on the cost share
for the unskilled and the skilled while the effect on the white collar's cost share is assumed away
apriori. The supply of engineers is also found to have an effect on the cost share for unskilled and
white collars, but no effect on the cost share for skilled. The estimated long-run coefficients from the
simultaneous two-stage estimation without break in the trend indicate that when the number of
persons with education in metal trade, electrical and electronics programmes increases with 1 percent,
the cost share for the unskilled decreases with 0.42 percent and the cost share for the skilled increases
with 0.76 percent. The values of the cost shares and the supply variables from the last year of
observation, 1990, are used.
When the number of persons educated as engineers (both short and long programmes) increases with
1 percent, the cost share for white collars increases with 0.88 percent while the cost share for the
unskilled decreases with 0.52 percent.
In order to investigate whether the size of the coefficients of the supply variables is appropriate or not,
the shifts and the effects are converted into number of persons. A one percent increase in the number
of persons educated in metal trade, electrical and electronics programmes means an increase of about
1500 persons with this education. We then take into account that only a fraction of these persons will
get employed, about 1100 when using the labour force participation rate and the unemployment rate.
These persons will then be spread over the different sectors using skilled persons with this type of
education.
The cost share for the skilled increases with 0.76 percent. We look upon this as if the demand for
man-hours from skilled persons increases with the same amount. Assuming that an employed person
works 1600 man-hours a year, the increase in the cost share for the skilled is equivalent to an increase
of about 140 persons or about 12 percent of the total employment increase of skilled persons. This
corresponds quite well with the actual share of employed persons educated in metal trade, electrical
and electronics programmes working in the fabricated metal industry which approximately is 14
percent.
19

An increase of about 1100 employed persons educated in metal trade, electrical and electronics
programmes leads to a reduction of about 150 unskilled persons in the fabricated metal industry.
When the number of persons educated as engineers (both short and long programmes) increases with
1 percent, this is equivalent to an increase of about 600 employed persons with such an education.
This leads to an increase in the employment of white collars with 130 persons in the fabricated metal
industry, and a decrease in employment of unskilled persons with 180. This sector's share of the
employment increase of white collars is 21 percent, while its share of the total employment of
engineers is about 11 percent.
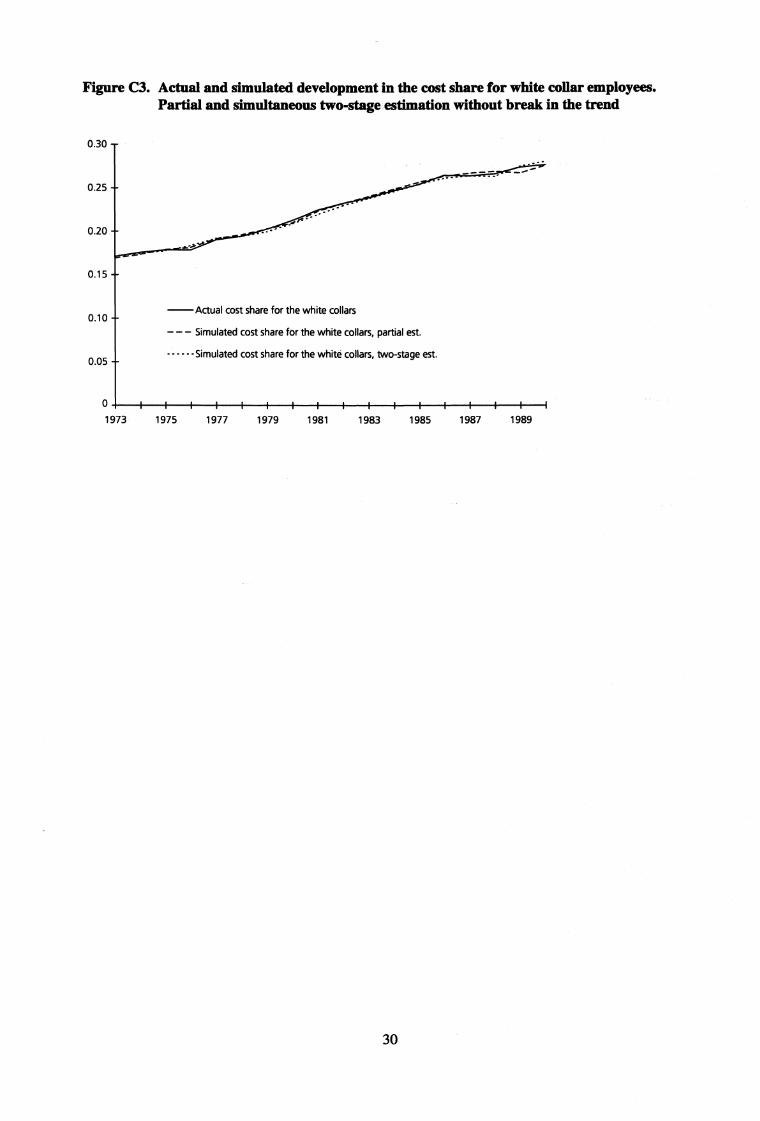
In figure Cl, C2 and C3 in appendix C, the simulated (dynamic simulation of the whole model)
developments of the two cost shares from the partial and simultaneous two-stage estimation without
break in the trend are compared to the actual. The white collar employees' cost share is calculated
using the adding-up conditions, while the simulated man-hours from the partial estimation are
transformed into simulated cost shares.
From the figures we notice that the simulated cost shares from both the partial and the simultaneous
estimation correspond quite well to the actual development although the simulated cost share from the
simultaneous estimation procedure deviates a bit more than the simulated cost share from the partial one.
4.3. Decomposition of the actual development in the contribution from thedifferent explanatory factorsIn order to evaluate how important the different variables have been in explaining the development in
the cost shares during the estimation period, we have decomposed the total change in the cost shares
over the period 1973 to 1990 into effects from each of the explanatory variables. The results from the
simultaneous two-stage estimation without break in the trend form the basis for this decomposition.
First, we have simulated the cost shares over the period 1973 to 1990 using the historical data and the
entire estimated model. Further, we have undertaken the same simulation, but this time holding a
specific variable constant, letting all the other variables vary according to their historical
development. The difference between these two simulations gives the impact of the specific variable
being held constant.
20

Table 2. Explanation of the development in the cost share for the unskilled. Change inpercentage points
Explanatory variables 1973-1980 1980-1985 1985-1990
Wages 0.8 0.6 -0.5
Production -0.2 -0.8 1.3
Supply of skilled persons -5.0 -4.5 -4.7
Supply of engineers -5.1 -2.5 -2.7
Trend -5.2 -1.9 -1.2
Cross-effects/dynamics 0.9 0 -0.1
Simulated development -13.8 -9.1 -7.9
Unexplained -0.6 0.9 0.7
Actual development -14.4 -8.2 -7.2
Table 3. Explanation of the development in the cost share for the skilled. Change in per-centage points
Explanatory variables 1973-1980 1980-1985 1985-1990
Wages 2.1 -1.7 0.7
Production 0.1 0.6 -0.9
Supply of skilled persons 4.9 4.5 4.7
Supply of engineers 0 0 0
Trend 3.6 1.3 0.8
Cross-effects/dynamics -0.6 -0.1 0
Simulated development 10.1 4.6 5.3
Unexplained 0.2 -0.5 -0.3
Actual development 10.3 4.1 5.0
We notice that especially the supply variables have been important in explaining the development in
the cost shares. The increase in supply of skilled persons has reduced the cost share of unskilled by
approximately 5 percentage points each period and increased the cost share of skilled by
approximately the same amount. Relative to the total simulated development the effect on the cost
share for unskilled has become stronger for each period, while the effect on the cost share for skilled
is especially strong in the second period (but also very important in the third). The increase in supply
21
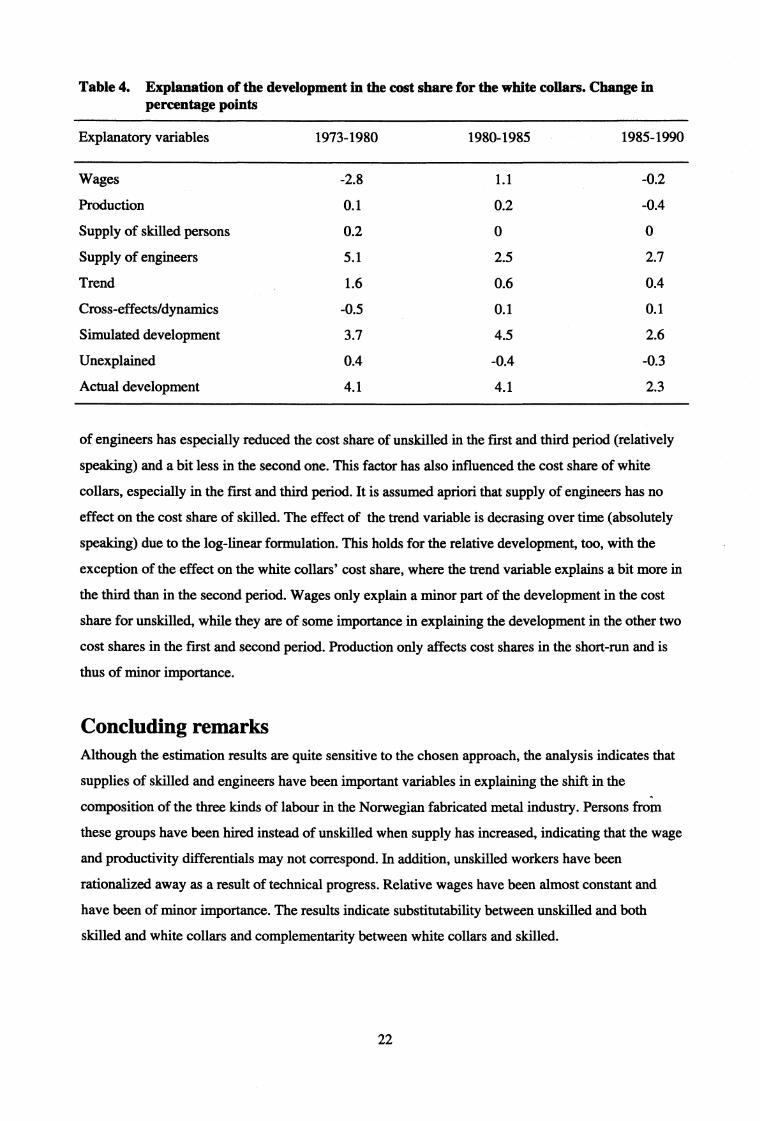
Table 4. Explanation of the development in the cost share for the white collars. Change inpercentage points
Explanatory variables 1973-1980 1980-1985 1985-1990
Wages -2.8 1.1 -0.2
Production 0.1 0.2 -0.4
Supply of skilled persons 0.2 0 0
Supply of engineers 5.1 2.5 2.7
Trend 1.6 0.6 0.4
Cross-effects/dynamics -0.5 0.1 0.1
Simulated development 3.7 4.5 2.6
Unexplained 0.4 -0.4 -0.3
Actual development 4.1 4.1 2.3
of engineers has especially reduced the cost share of unskilled in the first and third period (relatively
speaking) and a bit less in the second one. This factor has also influenced the cost share of white
collars, especially in the first and third period. It is assumed apriori that supply of engineers has no
effect on the cost share of skilled. The effect of the trend variable is decrasing over time (absolutely
speaking) due to the log-linear formulation. This holds for the relative development, too, with the
exception of the effect on the white collars' cost share, where the trend variable explains a bit more in
the third than in the second period. Wages only explain a minor part of the development in the cost
share for unskilled, while they are of some importance in explaining the development in the other two
cost shares in the first and second period. Production only affects cost shares in the short-run and is
thus of minor importance.
Concluding remarksAlthough the estimation results are quite sensitive to the chosen approach, the analysis indicates that
supplies of skilled and engineers have been important variables in explaining the shift in the
composition of the three kinds of labour in the Norwegian fabricated metal industry. Persons from
these groups have been hired instead of unskilled when supply has increased, indicating that the wage
and productivity differentials may not correspond. In addition, unskilled workers have been
rationalized away as a result of technical progress. Relative wages have been almost constant and
have been of minor importance. The results indicate substitutability between unskilled and both
skilled and white collars and complementarity between white collars and skilled.
22

ReferencesAamdal, K. (1987): Substitusjonsegenskaper for ulike arbeidskrafttyper i verkstedindustrien(Substituability between Different Kinds of Labour in the Fabricated Metal Industry). Thesis.Department of Economics, University of Oslo.
Anderson, G. J. and R. W. Blundell (1982): Estimation and Hypothesis Testing in Dynamic SingularEquation Systems, Econometrica 50, 1559-1571.
Banerjee, A., J. Dolado, J. W. Galbraith and D. F. Hendry (1993): Co-Integration, Error-Correction,and the Econometric Analysis of Non-Stationary Data. Oxford: Oxford University Press.
Berman, E., J. Bound and Z. Griliches (1994): Changes in the Demand for Skilled Labour within U.S.Manufacturing: Evidence from the Annual Survey of Manufactures. Quarterly Journal of Economics109, 367-398.
Berndt, E. and L. Christensen (1974): Testing for the Existence of a Consistent Aggregate Index ofLabour Inputs, American Economic Review 64 I, 391-404.
Berndt, E. R. and D. O. Wood (1975): Technology, Prices and the Derived Demand for Energy,Review of Economics and Statistics 57, 376-384.
Bresson, G., F. Kramarz, and P. Sevestre (1992): Heterogenous Labour and Dynamics of AggregateLabour Demand: Some Estimations Using Panel Data. Empirical Economics 17, 153 - 168.
Cappelen, A. and N.M. Stolen (1994): Forecasting Labour Market Imbalances. Economic Survey 4/94,Statistics Norway, 21-29.
Christensen, L., D. Jorgenson and L. Lau (1971): Conjugate Duality and the TranscendentalLogarithmic Production Function, Econometrica 39, 255-256.
Christensen, L., D. Jorgenson and L. Lau (1973): Transcendental Logarithmic Production Frontiers,Review of Economics and Statistics 55, 28-45.
Draper, N. and T. Manders (1996): Structural Changes in the Demand for Labor, ResearchMemorandum No 128, CPB Netherlands Bureau for Economic Policy Analysis.
Drèze, J. and H. R. Sneessens (1986): A Discussion of Belgian Unemployment Combining TraditionalConcepts and Disequilibrium Economics, Economica 53, S89-S119.
Fallon, P. R. and P. R. G. Layard (1975): Capital-Skill Complementarity, Income Distribution andOutput Accounting. Journal of Political Economy 83, 279-301.
Griliches, Z. (1969): Capital-skill complementarity, Review of Economics and Statistics 51, 57-85.
Grossman, G. M. and E. Helpman (1991): Innovation and Growth in the Global Economy. MIT Press,Cambridge, MA.
Hamermesh, D. S. (1985): Substitution between Different Categories of Labour, Relative Wages andYouth Unemployment. OECD Economic Studies 5, 57-85.
Hamermesh, D. S. (1986): «The Demand for Labour in the Long Run». In O. Ashenfelter and P. R. G.Layard (eds.): Handbook of Labour Economics. North Holland, Amsterdam.
Hamermesh, D. S. (1993): Labour Demand. Princeton University Press.23

Harnermesh, D. S. and J. Grant (1979): Econometric Studies of Labour-Labour Substitution and theirImplications for Policy. Journal of Human Resources 14, 518-542.
Hesse, D. M. and H. Tarkka (1986): The Demand for Capital, Labour and Energy in EuropeanManufacturing Industry before and after the Oil Price Shocks. Scandinavian Journal of Economics 88(3), 529-546.
Juhn, C., K. M. Murphy and R. H. Topel (1991): Why has the Natural Rate of UnemploymentIncreased over Time? Brookings Papers on Economic Activity 2, 75-142.
Keane, M. and E. Prasad (1993): Skill Levels and the Cyclical Variability of Employment, Hours andWages. IMF Staff Papers 40, 711-743.
Kydland, F. E. and E. C. Prescott (1988): Cyclical Movements of the Labour Input. ResearchDepartment Working Paper 413, Federal Reserve Bank of Minneapolis.
Lambert, J. P. (1988): Disequilibrium Macroeconomic Theory. Estimation of Rationing Models UsingBusiness Survey Data, Cambridge University Press.
Machin, S. (1994): Changes in the Relative Demand for Skills in the UK Labour Market. CEPRDiscussion Paper No. 952.
Naug, B. (1995): Etterspørsel etter arbeidskraft - En litteraturoversikt, Notater 95/31, StatisticsNorway.
OECD (1994): Evidence and Explanations. Part I, Labour Market Trends and Underlying Forces ofChange. The OECD Jobs Study.
van Ours, J. C. and G. Ridder (1995): Job Matching and Job Competition: Are Lower EducatedWorkers at the Back of Job Queues? European Economic Review 39, 1717-1731.
Quandt, R. E. (1982): Econometric Disequilibrium Models. Econometric Reviews 1, 1-63.
Romer, P. M. (1990): Endogenous Technological Change. Journal of Political Economy 98, 571-5102.
Risager, O. (1993): Labour Substitution in Denmark. Oxford Bulletin of Economics and Statistics 55,123-135.
Shadman-Mehta, F. and H. Sneessens (1995): Skill Demand and Factor Substitution. DiscussionPaper No. 1279, Centre for Economic Policy Research, London.
Skotner, K. N. (1994): Sysselsetting og lønn etter utdanning i nasjonalregnskapet (Employment andWages by Education in the Norwegian National Accounts). Notes 94/10, Statistics Norway.
Sneessens, H. (1983): A Macroeconomic Rationing Model of the Belgian Economy, EuropeanEconomic Review 20, 193-215.
24

Appendix A
Results from the partial estimationsThe following three error-correction equations are the point of departure for the partial estimations.
Lower case indicate the natural logarithm of the variables, and CM is the stock of machineries and
equipment.
Alu,, =do +dp&x, +dril(wu /Ws), +d3A(wu /ww), +d4A(wu /Pm), +d5APs,
+c17x ,_i +d8(wu Iws),_ d9(wu I ww)t--1+d1o(wu I PAI)+ ducht-i
+d12 cin t_l +clo TIME+cim ps t_l
Als, =e0 +e 1 Ax t +e2 el(w5 I wu)t+e5Apst+e6 1s,t-i e7xt-1 ± es (ws t-1
en cbt_i +e i c t-l +eo TIME+em p
Alw, = fo +Mx, +f3A(ww Iwu), +f5APw, +f6/w,,-1+Ax]. /19(w I w
+f, an t_ +fi3 TIME+ f14 D W t-1
25

Table Al. Results from the partial estimations (t-values in parentheses)
Coefficients Unskilled Skilled White collars
Long-run coefficients
Constant -4.66 (-5.80) -35.17 (-4.19) -24.03 (-5.30)
Output 0.64 (5.78) 0 0.89 (5.05)
Relative wages
d8,es, f8 0 -1.41 (-2.04) 012
d9, e9, f9 0 012 oOwn wage/price intermed. 0 012 012
Buildings 0 2.51 (4.69) 0
Machineries 0 0 0
Trend -0.04 (-5.98) -0.12 (-3.70) -0.06 (-5.40)
Supply, resp. skilled, white collars 0 0.74 (2.40) 1.49 (5.22)
Adjustment parameters
d6, e6, f6 -0.64 (-5.78) -0.46 (-3.62) -0.89 (-5.05)
Short-run coefficients
Output 0.57 (9.18) 0.70 (4.16) 0.61 (7.38)
Relative wages
d2, e2, f2 0 -2.02 (-2.26) 012
c13, e3, f3 -0.32 (-1.66) 012 0
Own wage/price intermed. 0 012 012
Supply 0 0 0
Statistics
R2 0.93 0.94 0.91
CR2 0.91 0.89 0.88
SER 0.012 0.021 0.015
12 Assumed apriori.
26
Appendix B
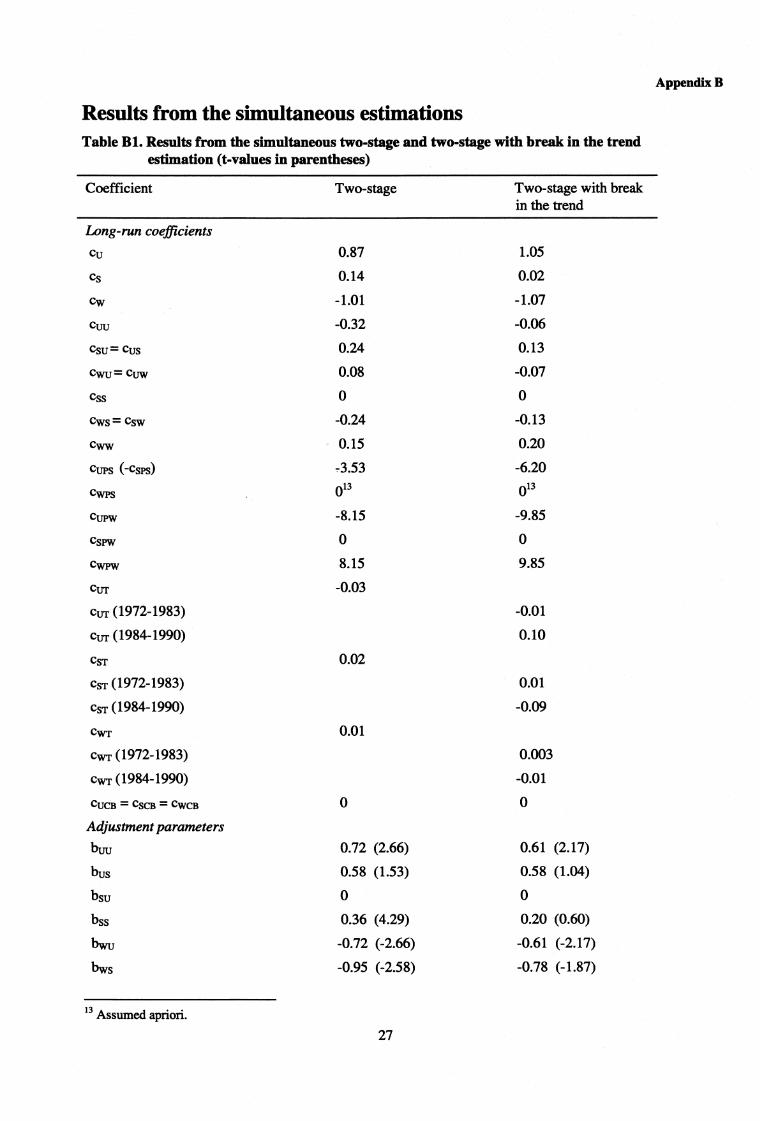
Results from the simultaneous estimationsTable Bl. Results from the simultaneous two-stage and two-stage with break in the trend
estimation (t-values in parentheses)
Coefficient
Two-stage Two-stage with breakin the trend
Long-run coefficients
Cu 0.87 1.05
cs 0.14 0.02
cw -1.01 -1.07
cuu -0.32 -0.06
csu cus 0.24 0.13
cwu = cuw 0.08 -0.07
css 0
cws = csw -0.24 -0.13
cww 0.15 0.20
CUpS (-CSPS) -3.53 -6.20
CWPS 013 013
Cupw -8.15 -9.85
cspw 0 0
Cwpw 8.15 9.85
cur-0.03
cur (1972-1983) -0.01
cur (1984-1990) 0.10
CST 0.02
csT (1972-1983) 0.01
csT (1984-1990) -0.09
CwT 0.01
cwT (1972-1983) 0.003
cwi, (1984-1990) -0.01
CUCB = CSCB = CWCB 0 0
Adjustment parameters
buu 0.72 (2.66) 0.61 (2.17)
bus 0.58 (1.53) 0.58 (1.04)
bsu 0 0
bss 0.36 (4.29) 0.20 (0.60)
bwu -0.72 (-2.66) -0.61 (-2.17)
bws -0.95 (-2.58) -0.78 (-1.87)
13 Assumed apriori.
27

Short-run coefficients
auu 0.53 (3.34) 0.59 (2.26)
asu -0.47 (-4.50) -0.45 (-2.05)
awu -0.06 (0.63) -0.14 (-1.21)
aus -0.38 (-2.78) -0.43 (-1.81)
ass 0.46 (4.85) 0.45 (2.27)
aws -0.08 (1.06) -0.02 (-0.20)
auw -0.14 (-3.41) -0.16 (-3.98)
asw 0 0
aww 0.14 (3.41) 0.16 (3.98)
aux -0.07 (-2.46) -0.04 (-1.32)
asx 0.06 (2.94) 0.02 (0.88)
awx 0.02 (1.16) 0.02 (1.25)
aups -4.59 (-7.56) -4.56 (-4.45)
asps 4.59 (7.56) 4.56 (4.45)
014 014awps
aupw -7.89 (-5.40) -8.07 (-4.98)
aspw 0
awpw 7.89 (5.40) 8.07 (4.98)
Statistics
R2 0.64 (U) 0.71 (S) 0.50 (U) 0.40 (5)
CR2 0.38 (U) 0.62 (S) 0.16 (U) 0.22 (S)
SER 0.006 (U) 0.003 (S) 0.006 (U) 0.005 (S)
The coefficients in the equation for the cost share of white collar employees are found using the
adding-up conditions mentioned earlier.
All of the adding-up conditions are linear, and we have therefore calculated these coefficients'
standard deviations by utilizing the variance formula for a linear combination of coefficients 15 .
14 This was imposed as a restriction in the final estimation result and was not rejected.15 For example: awu = -auu - asu, the variance of awu is then equal to var(auu )+ var(asu) + 2cov(auu, asa
28

—Actual cost share for the unskilled
— Simulated cost share for the unskilled, partial est.
Simulated cost share for the unskilled, two-stage est.
0.65 —
0.60 —
0.55 —
0.50 —
0.451973 1975 1977 1979 1981 1983 1985 1987 1989
0.75 —
0.70 —
Actual cost share for the skilled
— — — Simulated cost share for the skilled, partial est.
Simulated cost share for the skilled, two-stage est.
0.20 —
0.15 —
0.10 —
0.05 —
0 I I I I I I I I1973 1975 1977 1979 1981 1983 1985 1987 1989
0.30 —
0.25 —
Appendix C
Actual and simulated development in cost sharesFigure Cl. Actual and simulated development in the cost share for unskilled workers.
Partial and simultaneous two-stage estimation without break in the trend
0.80 —
Figure C2. Actual and simulated development in the cost share for skilled workers.Partial and simultaneous two-stage estimation without break in the trend
29
0.30 —
0.25 —
0.20 —
0.15 —
—Actual cost share for the white collars0.10 —
— — — Simulated cost share for the white collars, partial est.
0.05 — Simulated cost share for the white collars, two-stage est.
o -
1973 1975 1977 1979 1981 1983 1985 1987 1989
Figure C3. Actual and simulated development in the cost share for white collar employees.Partial and simultaneous two-stage estimation without break in the trend
30
Appendix D
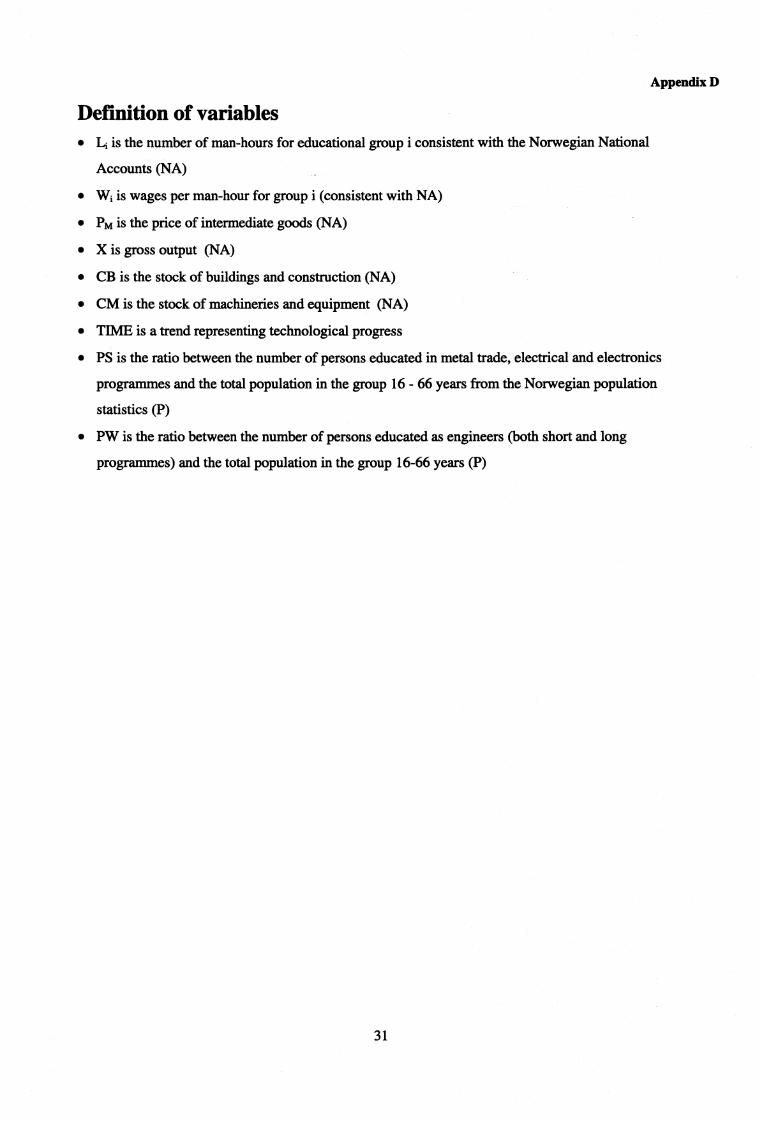
Definition of variables• Li is the number of man-hours for educational group i consistent with the Norwegian National
Accounts (NA)
wi is wages per man-hour for group i (consistent with NA)
• Pm is the price of intermediate goods (NA)
• X is gross output (NA)
• CB is the stock of buildings and construction (NA)
• CM is the stock of machineries and equipment (NA)
TIME is a trend representing technological progress
• PS is the ratio between the number of persons educated in metal trade, electrical and electronics
programmes and the total population in the group 16 - 66 years from the Norwegian population
statistics (P)
• PW is the ratio between the number of persons educated as engineers (both short and long
programmes) and the total population in the group 16-66 years (P)
31
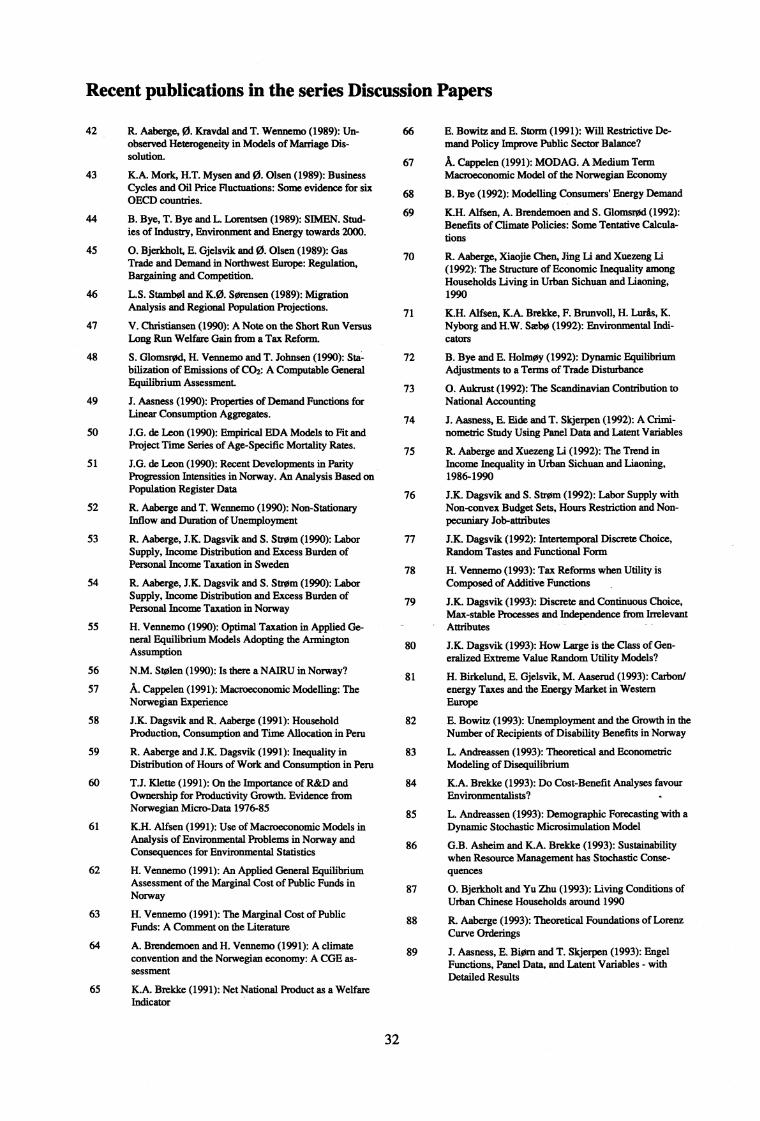
Recent publications in the series Discussion Papers
42 R. Aaberge, O. Kravdal and T. Wennemo (1989): Un-observed Heterogeneity in Models of Marriage Dis-solution.
43 K.A. Mork, H.T. Mysen and O. Olsen (1989): BusinessCycles and Oil Price Fluctuations: Some evidence for sixOECD countries.
44 B. Bye, T. Bye and L. Lorentsen (1989): SIMEN. Stud-ies of Industry, Environment and Energy towards 2000.
45 0. Bjerkholt, E. Gjelsvik and O. Olsen (1989): GasTrade and Demand in Northwest Europe: Regulation,Bargaining and Competition.
46 L.S. Stambøl and K.O. Sørensen (1989): MigrationAnalysis and Regional Population Projections.
47 V. Christiansen (1990): A Note on the Short Run VersusLong Run Welfare Gain from a Tax Reform.
48 S. Glomsrød, H. Vennemo and T. Johnsen (1990): Sta-bilization of Emissions of CO2: A Computable GeneralEquilibrium Assessment
49 J. Aasness (1990): Properties of Demand Functions forLinear Consumption Aggregates.
50 J.G. de Leon (1990): Empirical EDA Models to Fit andProject Time Series of Age-Specific Mortality Rates.
51 J.G. de Leon (1990): Recent Developments in ParityProgression Intensities in Norway. An Analysis Based onPopulation Register Data
52 R. Aaberge and T. Wennemo (1990): Non-StationaryInflow and Duration of Unemployment
53 R. Aaberge, J.K. Dagsvik and S. Strom (1990): LaborSupply, Income Distribution and Excess Burden ofPersonal Income Taxation in Sweden
54 R. Aaberge, J.K. Dagsvik and S. Strøm (1990): LaborSupply, Income Distribution and Excess Burden ofPersonal Income Taxation in Norway
55 H. Vennemo (1990): Optimal Taxation in Applied Ge-neral Equilibrium Models Adopting the ArmingtonAssumption
56 N.M. Stolen (1990): Is there a NAIRU in Norway?
57 A. Cappelen (1991): Macroeconomic Modelling: TheNorwegian Experience
58 J.K. Dagsvik and R. Aaberge (1991): HouseholdProduction, Consumption and Time Allocation in Peru
59 R. Aaberge and J.K. Dagsvik (1991): Inequality inDistribution of Hours of Work and Consumption in Peru
60 Ti. Mette (1991): On the Importance of R&D andOwnership for Productivity Growth. Evidence fromNorwegian Micro-Data 1976-85
61 K.H. Alfsen (1991): Use of Macroeconomic Models inAnalysis of Environmental Problems in Norway andConsequences for Environmental Statistics
62 H. Vennemo (1991): An Applied General EquilibriumAssessment of the Marginal Cost of Public Funds inNorway
63 H. Vennemo (1991): The Marginal Cost of PublicFunds: A Comment on the Literature
64 A. Brendemoen and H. Vennemo (1991): A climateconvention and the Norwegian economy: A CGE as-sessment
65 K.A. Brekke (1991): Net National Product as a WelfareIndicator
66 E. Bowitz and E. Storm (1991): Will Restrictive De-mand Policy Improve Public Sector Balance?
67 A. Cappelen (1991): MODAG. A Medium TermMacroeconomic Model of the Norwegian Economy
68 B. Bye (1992): Modelling Consumers' Energy Demand
69 K.H. Alfsen, A. Brendemoen and S. Glomsrød (1992):Benefits of Climate Policies: Some Tentative Calcula-tions
70 R. Aaberge, Xiaojie Chen, Jing Li and Xuezeng Li(1992): The Structure of Economic Inequality amongHouseholds Living in Urban Sichuan and Liaoning,1990
71 K.H. Alfsen, K.A. Brekke, F. Brunvoll, H. Luris, K.Nyborg and H.W. Sæbø (1992): Environmental Indi-cators
72 B. Bye and E. Holmøy (1992): Dynamic EquilibriumAdjustments to a Terms of Trade Disturbance
73 0. Aukrust (1992): The Scandinavian Contribution toNational Accounting
74 J. Aasness, E. Eide and T. Skjerpen (1992): A Crimi-nometric Study Using Panel Data and Latent Variables
75 R. Aaberge and Xuezeng Li (1992): The Trend inIncome Inequality in Urban Sichuan and Liaoning,1986-1990
76 J.K. Dagsvik and S. Strøm (1992): Labor Supply withNon-convex Budget Sets, Hours Restriction and Non-pecuniary Job-attributes
77 J.K. Dagsvik (1992): Interteraporal Discrete Choice,Random Tastes and Functional Form
78 H. Vennemo (1993): Tax Reforms when Utility isComposed of Additive Functions .
79 J.K. Dagsvik (1993): Discrete and Continuous Choice,Max-stable Processes and Independence from IrrelevantAttributes
80 J.K. Dagsvik (1993): How Large is the Class of Gen-eralized Extreme Value Random Utility Models?
81 H. Birkelund, E. Gjelsvik, M. Aaserud (1993): Carbon/energy Taxes and the Energy Market in WesternEurope
82 E. Bowitz (1993): Unemployment and the Growth in theNumber of Recipients of Disability Benefits in Norway
83 L Andreassen (1993): Theoretical and EconometricModeling of Disequilibrium
84 K.A. Brekke (1993): Do Cost-Benefit Analyses favourEnvironmentalists?
85 L Andreassen (1993): Demographic Forecasting 'with aDynamic Stochastic Microsimulation Model
86 G.B. Asheim and K.A. Brekke (1993): Sustainabilitywhen Resource Management has Stochastic Conse-quences
87 0. Bjerkholt and Yu nu (1993): Living Conditions ofUrban Chinese Households around 1990
88 R. Aaberge (1993): Theoretical Foundations of LorenzCurve Orderings
89 J. Aasness, E. Biøm and T. Skjerpen (1993): EngelFunctions, Panel Data, and Latent Variables - withDetailed Results
32

L Svendsen (1993): Testing the Rational ExpectationsHypothesis Using Norwegian Microeconomic DataTesting the REH. Using Norwegian MicroeconomicData •
91 E. Bowitz, A. Rodseth and E. Storm (1993): FiscalExpansion, the Budget Deficit and the Economy: Nor-way 1988-91
92 R. Aaberge, U. Colombino and S. Strom (1993): LaborSupply in Italy
93 Ti. Klette (1993): Is Price Equal to Marginal Costs? AnIntegrated Study of Price-Cost Margins and ScaleEconomies among Norwegian Manufacturing Estab-lishments 1975-90
94 J.K. Dagsvik (1993): Choice Probabilities and Equili-brium Conditions in a Matching Market with FlexibleContracts
95 T. Komstad (1993): Empirical Approaches for Ana-lysing Consumption and Labour Supply in a Life CyclePerspective
96 T. Kornstad (1993): An Empirical Life Cycle Model ofSavings, Labour Supply and Consumption withoutIntertemporal Separability
97 S. Kvemdokk (1993): Coalitions and Side Payments inInternational CO2 Treaties
98 T Fika (1993): Wage Equations in Macro Models.Phillips Curve versus Error Correction Model Deter-mination of Wages in Large-Scale UK Macro Models
99 A. Brendemoen and H. Vennemo (1993): The MarginalCost of Funds in the Presence of External Effects
100 K.-G. Lindquist (1993): Empirical Modelling ofNorwegian Exports: A Disaggregated Approach
101 A.S. lore, T. Skjexpen and A. Rygh Swensen (1993):Testing for Purchasing Power Parity and Interest RateParities on Norwegian Data
102 R. Nesbakken and S. Strom (1993): The Choice of SpaceHeating System and Energy Consumption in NorwegianHouseholds (Will be issued later)
103 A. Aaheim and K. Nyborg (1993): "Green NationalProduct": Good Intentions, Poor Device?
104 K.H. Alfsen, H. Birkelund and M. Aaserud (1993):Secondary benefits of the EC Carbon/ Energy Tax
105 J. Aasness and B. Holtsmark (1993): Consumer Demandin a General Equilibrium Model for EnvironmentalAnalysis
106 K.-G. Lindquist (1993): The Existence of Factor Sub-stitution in the Primary Aluminium Industry: A Multi-variate Error Correction Approach on Norwegian PanelData
107 S. Kvemdokk (1994): Depletion of Fossil Fuels and theImpacts of Global Warming
108 K.A. Magnussen (1994): Precautionary Saving and Old-Age Pensions
109 F. Johansen (1994): Investment and Financial Con-straints: An Empirical Analysis of Norwegian Firms
110 K.A. Brekke and P. Boring (1994): The Volatility of OilWealth under Uncertainty about Parameter Values
111 MJ. Simpson (1994): Foreign Control and NorwegianManufacturing Performance
112 Y. Willassen and T.J. Klette (1994): CorrelatedMeasurement Errors, Bound on Parameters, and a Modelof Producer Behavior
113 D. Wetterwald (1994): Car ownership and private caruse. A microeconometric analysis based on Norwegiandata
33
114 K.E. Rosendahl (1994): Does Improved EnvironmentalPolicy Enhance Economic Growth? Endogenous GrowthTheory Applied to Developing Countries
115 L. Andreassen, D. Fredriksen and O. Ljones (1994): TheFuture Burden of Public Pension Benefits. AMicrosimulation Study
116 A. Brendemoen (1994): Car Ownership Decisions inNorwegian Households.
117 A. Langorgen (1994): A Macromodel of LocalGovernment Spending Behaviour in Norway
118 K.A. Brekke (1994): Utilitarism, Equivalence Scales andLogarithmic Utility
119 K.A. Brekke, H. Luis and K. Nyborg (1994): SufficientWelfare Indicators: Allowing Disagreement inEvaluations of Social Welfare
120 T.J. Klette (1994): R&D, Scope Economies and Com-pany Structure: A "Not-so-Fixed Effect" Model of PlantPerformance
121 Y. Willassen (1994): A Generalization of Hall's Speci-fication of the Consumption function
122 E. Holmoy, T. Hægeland and 0. Olsen (1994): EffectiveRates of Assistance for Norwegian Industries
123 K. Mohn (1994): On Equity and Public Pricing inDeveloping Countries
124
J. Aasness, E. Eide and T. Skjerpen (1994): Crimi-nometrics, Latent Variables, Panel Data, and DifferentTypes of Crime
125 E. Biom and T.J. Klette (1994): Errors in Variables andPanel Data: The Labour Demand Response to PermanentChanges in Output
126 L Svendsen (1994): Do Norwegian Firms FormExtrapolative Expectations?
127 T.J. Mate and Z. Griliches (1994): The Inconsistency ofCommon Scale Estimators when Output Prices areUnobserved and Endogenous
128 K.E. Rosendahl (1994): Carbon Taxes and the PetroleumWealth
129 S. Johansen and A. Rygh Swensen (1994): TestingRational Expectations in Vector Autoregressive Models
130 T.J. Klette (1994): Estimating Price-Cost Margins andScale Economies from a Panel of Microdata
131 L. A. Grünfeld (1994): Monetary Aspects of BusinessCycles in Norway: An Exploratory Study Based onHistorical Data
132 K.-G. Lindquist (1994): Testing for Market Power in theNorwegian Primary Aluminium Industry
133 T. J. Mette (1994): R&D, Spillovers and Performanceamong Heterogenous Finns. An Empirical Study UsingMicrodata
134 K.A. Brekke and H.A. Gravningsmyhr (1994): AdjustingNNP for instrumental or defensive expenditures. Ananalytical approach
135 T.O. Thoresen (1995): Distributional and BehaviouralEffects of Child Care Subsidies
136 T. J. Klette and A. Mathiassen (1995): Job Creation, JobDestruction and Plant Turnover in NorwegianManufacturing
137 K. Nyborg (1995): Project Evaluations and DecisionProcesses
138 L. Andreassen (1995): A Framework for EstimatingDisequilibrium Models with Many Markets
139 L. Andreassen (1995): Aggregation when Markets do notClear

140 T. Skjerpen (1995): Is there a Business Cycle Com-ponent in Norwegian Macroeconomic Quarterly TimeSeries?
141 J.K. Dagsvik (1995): Probabilistic Choice Models forUncertain Outcomes
142 M. Ronsen (1995): Maternal employment in Norway, AParity-Specific Analysis of the Return to Full-Time andPart-Time Work after Birth
143 A. Bruvoll, S. Glomsrod and H. Vennemo (1995): TheEnvironmental Drag on Long- Term Economic Perfor-mance: Evidence from Norway
144 T. Bye and T. A. Johnsen (1995): Prospects for a Com-mon, Deregulated Nordic Electricity Market
145 B. Bye (1995): A Dynamic Equilibrium Analysis of aCarbon Tax
146 T. O. Thoresen (1995): The Distributional Impact of theNorwegian Tax Reform Measured by Disproportionality
147 E. Holmoy and T. Hægeland (1995): Effective Rates ofAssistance for Norwegian Industries
148 J. Aasness, T. Bye and H.T. Mysen (1995): WelfareEffects of Emission Taxes in Norway
149 J. Aasness, E. Bjorn and Terje Skjerpen (1995):Distribution of Preferences and Measurement Errors in aDisaggregated Expenditure System
150 E. Bowitz, T. Fæhn, L. A. Grünfeld and K. Mourn(1995): Transitory Adjustment Costs and Long TermWelfare Effects of an EU-membership — The NorwegianCase
151 L Svendsen (1995): Dynamic Modelling of DomesticPrices with Time-varying Elasticities and RationalExpectations
152 L Svendsen (1995): Forward- and Backward LookingModels for Norwegian Export Prices
153 A. Langørgen (1995): On the SimultaneousDetermination of Current Expenditure, Real Capital, FeeIncome, and Public Debt in Norwegian LocalGovernment
154 A. Katz and T. Bye(1995): Returns to Publicly OwnedTransport Infrastructure Investment. A Cost Function/Cost Share Approach for Norway, 1971-1991
155 K. O. Aarbu (1995): Some Issues About the NorwegianCapital Income Imputation Model
156 P. Boug, K. A. Mork and T. Tjemsland (1995): FinancialDeregulation and Consumer Behavior: the NorwegianExperience
157 B.E. Naug and R. Nymoen (1995): Import PriceFormation and Pricing to Market: A Test on NorwegianData
158 R. Aaberge (1995): Choosing Measures of Inequality forEmpirical Applications.
159 T.J. Klette and S.E. Forre (1995): Innovation and JobCreation in a Small Open Economy: Evidence fromNorwegian Manufacturing Plants 1982-92
160 S. Holden, D. Kolsrud and B. Vikoren (1995): NoisySignals in Target Zone Regimes: Theory and MonteCarlo Experiments
161 T. Hægeland (1996): Monopolistic Competition,Resource Allocation and the Effects of Industrial Policy
162 S. Grepperud (1996): Poverty, Land Degradation andClimatic Uncertainty
163 S. Grepperud (1996): Soil Conservation as an Investmentin Land
164 K.A. Brekke, V. Iversen and J. Aune (1996): Soil Wealthin Tanzania
165 J.K. Dagsvik, D.G. Wetterwald and R. Aaberge (1996):Potential Demand for Alternative Fuel Vehicles
166 J.K. Dagsvik (1996): Consumer Demand withUnobservable Product Attributes. Part I: Theory
167 J.K. Dagsvik (1996): Consumer Demand withUnobservable Product Attributes. Part II: Inference
168 R. Aaberge, A. Björklund, M. Jäntti, M. Palme, P. J.Pedersen, N. Smith and T. Wennemo (1996): IncomeInequality and Income Mobility in the ScandinavianCountries Compared to the United States
169 K. Nyborg (1996): Some Norwegian Politicians' Use ofCost-Benefit Analysis
170 E. Berg, S. Kvemdokk and K. E. Rosendahl (1996):Market Power, International CO2 Taxation andPetroleum Wealth
171 R. Aaberge, U. Colombino and S. Strom (1996): WelfareEffects of Proportional Taxation: Empirical Evidencefrom Italy, Norway and Sweden
172 J.K. Dagsvik (1996): Dynamic Choice, MultistateDuration Models and Stochastic Structure
173 J.K. Dagsvik (1996): Aggregation in Matching Markets
174 H.C. Bjomland (1996): The Dynamic Effects ofAggregate Demand, Supply and Oil Price Shocks
175 A. Bruvoll and K. Ibenholt (1996): Future WasteGeneration. Forecasts Based on a MacroeconomicModel
176 T. Fæhn and L. A. Grünfeld (1996) Recent LeapsTowards Free Trade. The Impact on Norwegian Industryand Trade Patterns
177 R. Bartell and K. A. Magnussen (1996): CounterfactualAnalyses of Oil price Shocks using a World Model
178 E. Bowitz and S. L Hove (1996): Business cycles andfiscal policy: Norway 1973-93
179 H.C. Bjørnland (1996): Sources of Business Cycles inEnergy Producing Economies: The case of Norway andUnited Kingdom
180 K. Nyborg (1996): The Political Man and ContingentValuation: Motives Do Count
181 E. Berg, S. Kvemdokk and ICE. Rosendahl (1996):Gains from Cartelisation in the Oil Market
182 R. Aaberge and L Aslaksen (1996): Decomposition ofthe Gini Coefficient by Income Components: VariousTypes of Applications and Interpretations
183 B. Bye (1996): Taxation, Unemployment and Growth:Dynamic Welfare Effects of "Green" Policies
184 T.J. Klette and F. Johansen (1996): Accumulation ofR&D Capital and Dynamic Firm Performance: A Not-so-fixed Effect Model
185 B. Bye (1996): Environmental Tax Reform and ProducerForesight: An Intertemporal Computable GeneralEquilibrium Analysis
186 S. Grepperud (1997): Soil Depletion Choices underProduction and Price Uncertainty
187 N.M. Stolen and T. Åvitsland (1997): Has Growth inSupply of Educated Persons Been Important for theComposition of Employment?
34

Discussion Papers
Statistics NorwayResearch DepartmentP.O.B. 8131 Dep.N-0033 Oslo
Tel.: +47-22864500Fax: + 47 - 22 11 12 38
ISSN 0803-074X
Statistics Norway410 Research Department