isgs contractigrant report 1988-1 final technical report...
TRANSCRIPT
ISGS CONTRACTIGRANT REPORT 1988-1
Final Technical Report to the Coal Industry Committee, through the Center for Research on Sulfur in Coal
Contract 1-5-80270
ILLINOIS STATE GEOLOGICAL SURVEY Morris W. Leighton, Chief
Natural Resources Building 615 East Peabody Drive Champaign, Illinois 61820
ith methanol 9 Extraction of ES product with various solvents 9 AF separation on organic solvent-washed ES products 11
Oil agglomeration of methanol-washed sample 11 Changes in pH 1 1 Flocculation and reverse flotation procedures 12
er AF separation of IlTRl feed coal 12 Comparison of thermogravimetric analyses of feed
coal and ES product 13 Chemical analyses of methanol extract of ES product 14 Biochemical desulfurization of ES product 1 5 Microbial conditioning for physical desulfurization 1 6 Petrographic characterization 1 6
Kentucky feed samples 16 Illinois feed samples 24
MME 5
ve shattering (ES B. The aggregate flotation (AF) C. Forms-of-sulfur characterization 35 D. Removal of organic sulfur through ES process 37'

lysis of ES feed coal (KY1 I ) 14 lysis of ES product (KY11) 14 I treatment of ES product and coal 16 pic views of ES sample 18 pic views showing effectiveness of ES comminution 20 pic views showing clumping in ES product 21
7. Microscopic views showing vitrinite alteration 22 8-1. Size distribution of feed and product (IL6 coal) 30
A-2. Mineral particle-size distribution in feed and product after ES 30
ical analysis of feed coal (dry basis) 4 2. Particle-size distribution (5%) of feed and ES products (KY1 1) 5 3. Particle-size distribution (%) of feed and ES shattered
samples (IL6) 5 4. Chemical analysis of ES products (dry basis) 6 5. Sieve analysis of MY 1 1 feed coal 6 6. Chemical analysis of separation products of llTRl sample 7
-site tests for ESIAF as-received ES product 8 ctrolyte and methanol wash treatment of ES product
before AF separation 8 9. Analysis of organic solvent-washed ES product 9
10. AF separation of organic solvent-washed ES product 10 11. Oil agglomeration of methanol-washed ES product 11 62. AF separation of ES product at pH 10.5 11 13. Flocculation separation of ES product withhvithout dispersant 12 14. Reverse flotation of ES product 12 15. Comparison of AF yields on IlTRl KY11 feed coal with varying
per1 mill grind and reagent dosages 13 F separation of micrsbially treated ES sample (IL6) 17
17. Characteristics of initial continuous ES samples 17 18. Experimental and petrographic data for ES batch sample
preparation (KY 1 1 coal) 23 19. Petrographic data for IL6 ES feed samples, air dried 25
D-1. Evaluation of sulfur scavenging mechanisms during explosive shattering of coal 35
D-2. Reduction in sulfur content of shattered samples 35
Our overall project objective was to demonstrate that the Illinois Institute of Technology Research Institute (IITRI) Explosive Shattering (ES) process and the Illinois State Geological Survey (ISGS) Aggregate Flotation (AF) process could be used sequentially to produce a high- quality, low-ash fuel that could meet compliance standards for sulfur. In the ES process, coal macerals were selectively broken into particles less than 10 microns in diameter, while mineral particles remained roughly their original size. This was accomplished by briefly bringing the coal to about 800°F and approximately 10,000 psi and then allowing for rapid adiabatic expansion. The product was quenched with a dilute caustic solution to leach and trap the evolved H2S. The ES product was then subjected to the AF process, which separates the ash-forming minerals and pyrite from the coal by sel ectively fl oating coal -air bubble aggregates away from suspended mineral matter via use of selective foaming surfactants, hydrophobic condi- tioning of the coal macerals, and generation of small air bubbles. We hoped that the final ES/AF product would be of higher quality than that produced from conventional cleaning methods or AF alone.
So far, this ES-AF approach has been unsuccessful. The ES products obtained from the Kentucky No. 11 (KY11) and Illinois Herrin No. 6 (IL6) coals were indeed highly comminuted, but they did not respond well to AF treatment. No significant beneficiation of the ES product could be ob- served. We concluded that the ES thermal process causes evolution of organic devolatilization products that coat the finely divided macerals and minerals; this causes both particle types to become equally hydrophobic in nature and minimizes physical separation based on differences in surface characteristics. This conclusion is based on extensive chemical and petro- graphic characterization and experiments involving ES/AF separation and treatments, including changes of pH, ultrasonic treatment, and use of dis- persants, electrolytes, microbi a1 treatment, oi 1 agglomeration, fl occul a- tion, reverse flotation, and extraction with organic solvents. Analytical techniques such as thermal gravimetric analysis, chemical characterization of organic extracts of ES products, Fischer Assay, chemical analyses for the forms of sulfur, and extensive petrographic analyses were used as characterization methods. Only organic extraction of the ES product showed promise in increasing separation.
A1 though ES comminution completely 1 i berates mineral matter, the ES product cannot be significantly benefici ated by conventional cleaning methods based on surface property difference.
e tested an ul t r a f ine coal cleaning approach combining a1 comminution and e f f i c i en t physical separation. The
e Flotation ( A F ) physical coal cleaning process, developed a t the State Geological Survey (ISGS), was used t o t r e a t products obtain-
rom the Explosive Shattering (ES) process, developed a t the I l l i n o i s e of Technology Research Ins t i t u t e (IITRI). The ES process in-
volves subjecting a coal s lurry t o rapid high pressure and high temperature treatment then allowing rapid adiabatic expansion to occur; t h i s produces an explosive e f fec t t ha t breaks the macerals (organic consti tuents o f coal)
o very small par t ic les and frees the unshattered minerals. The AF cess e f f i c i en t ly removes the ash and pyri te from the coal by select ively
f loat ing coal - a i r bubble aggregates away from suspended mineral matter via use of select ive foaming surfactants, hydrophobic conditioning of the coal macerals, and generation of small a i r bubbles. The product i s a highly benef i ci ated coal .
tha t the combined approach would s ignif icant ly reduce s t o a greater extent than would the A F process alone,
nsive comminution provided by the ES process l ibera tes more a r t i c l e s than does a t t r i t i o n grinding only. However, essful thus f a r in demonstrating any s ignif icant bene
t ion with t h i s method for the Herrin coal samples tes ted. We believe the a jor problem i s t ha t vo la t i l e organic compounds produced during the ES rocess condense and recoat the par t ic les , making a l l par t ic les hydrophobic
and thereby minimizing any separation based on hydrophobic/hydrophilic d i f - ferences. We are continuing our e f fo r t s t o fur ther understand and overcome t h i s l imita t ion.

The ES process i ,000 psi for a minu
t o occur. The "trapp The expansion brea i cl es are formed. since most mineral
dix A * )
Aggregate f lotat ion, conditioning f in maceral s more hy produces small b gates. These are floated a detai 1 ed over
The anticipated prod coal, low in ash and in b retains most o 30% o f the or

LE 1. Chemical analysis of feed coal (dry basis)"
Carbon Hydrogen Nitrogen Chlorine Sul fur Ash Oxygen (by diff) Volatile matter Pyritic S Sulfatic S Organic S
Heat i ng val ue, Btu/l b
Free Swell i ng Index (FSI)
KYll CTE I SGS
I L6 CTE ISGS
* Analyses by Commercial Testing and Engineering (CTE) and ISGS
a t each s tep , and additional petrographic analyses were performed fo r se l ected sampl es . Sul f u r , ash, and t u values of the f ina l product and the s t a r t i n g feed coal were obtained t o evaluate the r e su l t s .
Results so f a r have shown t h a t the product produced from the ES proc- ess i s not a su i t ab l e feed fo r the AF process and t h a t the combination of the two processes o f fe r s l i t t l e advantage over AF alone. In f a c t , AF per- formed be t t e r on conventionally a t t r i t ion-ground coal than on ES comminuted coal , p r inc ipa l ly because of the hydrophobic nature of the ES product and possibly because of aggregation of the u l t r a f i ne pa r t i c l e s from the ES process. The F process achieved no separation of the resu l t ing ES pro- duct . Consequently, most of our e f f o r t was subsequently focused on in - creasing our understanding of the problem and attempting t o circumvent i t .
study--a Kentucky
rch was performed only with the by IITRI in conjunction with
53). The coals were ground t o y would pass through the e x i t o
under a .nitrogen a t e analyses of these
t was 'd i lu ted t o about

TABLE 2- Particle-size distribution ( X ) s f feed an
Particle-size range (microns)
ES** After per1 mill grinding ES shattered coal
Feed 5 min 10 min 20 min 3/4/86 3/27/86 4/15/86 6/10/86
Mean part i cl e size (microns) 53.3 24.1 14.2 12.1 27.3 16.4 7.6 7.2
* Analyses performed a t IITRI v i a Leeds and Northrup Microtrac Analyzer ** ES conditions: 3/4/86, 750°F, 6000 psi ; 3/27/86, 765"F, 7100 p s i ; 4/15/86, 835"F, 7500 psi ;
6/10/86, 820°F, 6000 psi
TABLE 3 . P a r t i c l e - s i z e d i s t r i b u t i o n (%I o f feed an a t t e r e d samples* ( I L6 )
ES Shat te red Coal**
Cycl one P a r t i c l e - s i z e range Drum 1 Drum 2 t r a p (microns) Feed 1 1/ 14/86 1 1/ 14/86 sampl e
Mean p a r t i c l e s i z e 60.7 (microns)
* Analyses performed a t IITRI v i a Leeds and Northrup Microtrac Analzyer ** ES cond i t i ons : 11/14/86 Drum 1, 835"F, 7400 p s i ; 11/14/86 Drum 2,
830°F, 7050 p s i ; 11/18/86 cyclone t r a p , 835"F, 7500 psi
2.2% solids (by weight) and subjected to (4 liters). Splits of the slurry were su graphic analyses. Chemical results (tabl e 6) indicate o f the ES product produced no significant reduction of very minor reduction in ash. The Btu, total sulfur, an values remained about the same for both c run. Although petrographic examination ( that the shattering process indeed frees

. Chemical analysis of ES products (dry basis)
Carbon Hydrogen Nitrogen Chlorine Sul f u r Ash Oxygen (by d i f f ) V o l a t i l e mat te r P y r i t i c S S u l f a t i c S Organic S
K Y l l 3/27/86 6/10/86
I L6" 11/14/86 Drum 2
FS I 1 . O Heat i ng val ue (Btu/l b) 11,975 13,100 12,513
" I I T R I ana lyses on d i f f e r e n t s p l i t a r e 4.14% t o t a l s u l f u r , 1.04% p y r i t i c s u l f u r
TABLE 5 , Sieve analysis of KYll feed coal
Frac t ion Sampl e Total P y r i t i c mesh s i z e number Weight Ash sul f u r s u l f u r B t u
t150 C-24587 7.81 6.75 3.28 1.75 13537 150x200 C-24588 16.72 6.69 3.22 1.87 13540 200x270 C-24589 18.31 6.45 3.29 1.93 13538 270x400 C-24591 42.91 12.29 4.69 3.08 13452 - 400 C-24591 42.91 12.29 4.69 3.08 12466 Feed (Calc)" - - - - - - 9.05 3.89 2.40 13066
* Calcula ted
most of the pa r t i c l e s appear t o recombine in to aggregates 200 t o 500 microns in s i z e . This aggregation may have been caused by petrographic sample preparation; however, i t should be noted t ha t the feed coal does not aggregate during petrographic sample preparation.
Comparison of chemical analyses of the feed coal with the IITRI ES product ( t ab l e 6) indicates t h a t no s ign i f i can t organic su l fu r was l o s t during t h i s pa r t i cu l a r r u n . (Values f o r "other" su l fu r , derived by
a l l forms of su l fu r from to t a l S, were compared with the organic S values f o r C-24386.) Values f o r s u l f i d i c (S=) and elemental (So ) forms of su l fu r may be in e r ro r because of incomplete ext ract ion. The procedure f o r determining S= and S o concentrations (appendix C) i s s t i l l being developed and refined fo r t h i s type of coal -derived sample under CRSC contract 1-5-90249.
enerated by G. Sresty under U.S. DOE Contract DE-AC22-85FC80753 ) indicate t h a t about 16% t o 37% of the organic su l fu r in simi-
(KY11 coal) was removed by the ES process. ISGS data indicate t the decrease in t o t a l su l fu r in the ES product appears t o be a t the
expense of the formation of pyrrhot i te and H2S. Appreciable su l f i de (-25 ppm) was noted in the f i l t r a t e of the f i r s t sample, a 0.4% s lu r ry received from IITWI.
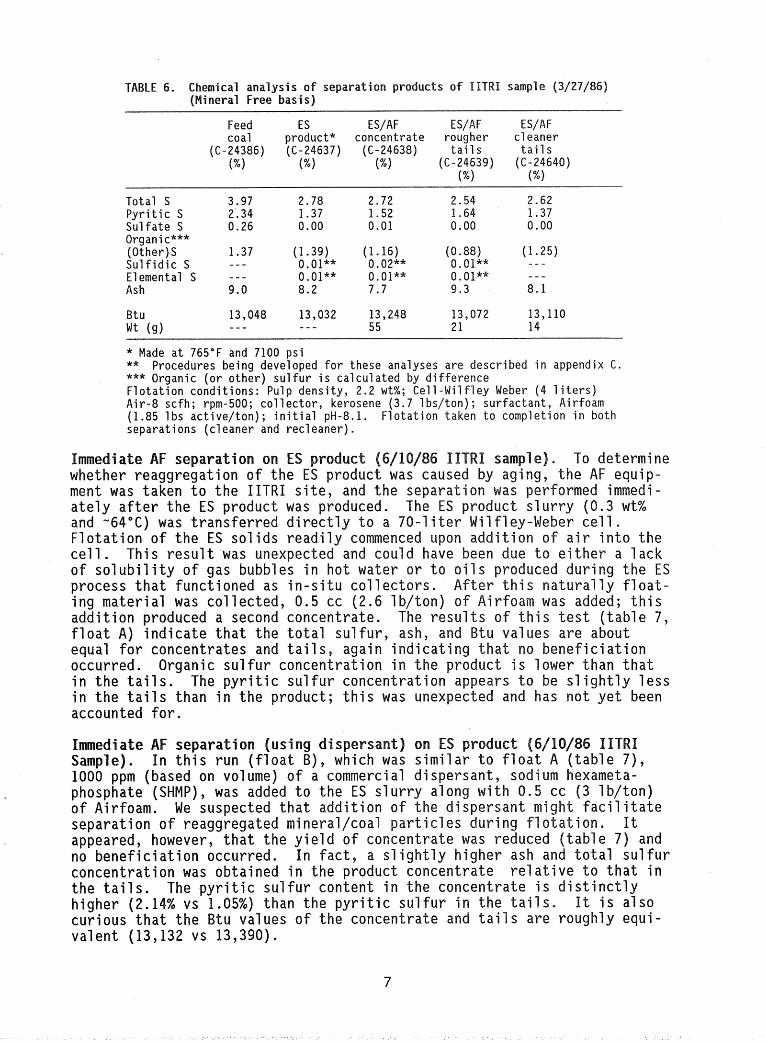
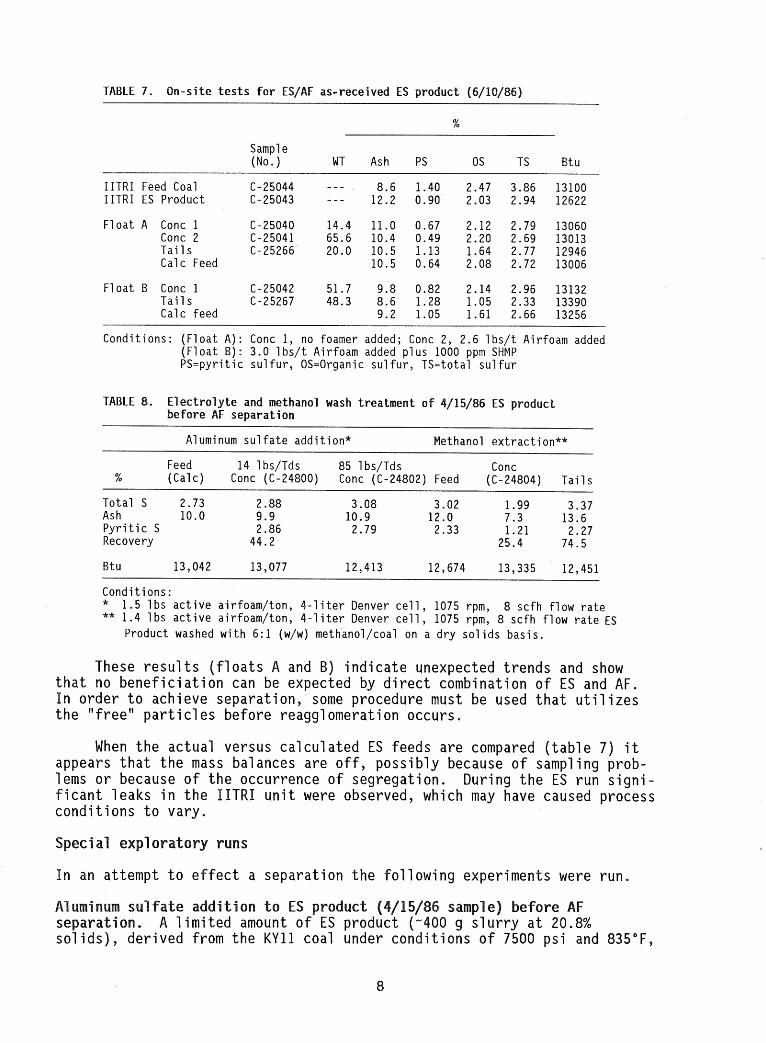
TABLE 7, O n - s i t e t e s t s f ~ r ES/AF as - rece ived ES produc t (6/10/86)
Sampl e (No. WT Ash PS OS TS 6 tu
IITRI Feed Coal C-25044 - - - , 8 . 6 1.40 2.47 3.86 13100 IITRI ES Product C-25043 - - - 12.2 0.90 2.03 2.94 12622
F l o a t A Conc 1 C-25040 14.4 11.0 0.67 2.12 2.79 13060 Conc 2 C-25041 65.6 10.4 0 .49 2.20 2.69 13013 T a i l s C-25266 20.0 10.5 1.13 1.64 2.77 12946 Calc Feed 10.5 0.64 2.08 2.72 13006
F l o a t 6 Conc 1 C-25042 51.7 9 . 8 0.82 2.14 2.96 13132 Tai 1 s C-25267 48.3 8 . 6 1 .28 1.05 2.33 13390 Calc f e e d 9.2 1 .05 1.61 2.66 13256
Condi t ions : ( F l o a t A) : Conc 1 , no foamer added; Conc 2, 2.6 1 b s / t Airfoam added ( F l o a t B) : 3 .0 1 bs / t Airfoam added p l u s 1000 ppm SHMP P S = p y r i t i c s u l f u r , OS=Organic s u l f u r , TS=total s u l f u r
TABLE 8. E l e c t r o l y t e and methanol wash t r e a t m e n t o f b e f o r e AF s e p a r a t i o n
A1 uminum s u l f a t e add i t ion* Methanol ex t rac t ion**
Feed 14 lbs/Tds 8 5 1 bs/Tds Conc % (Cal c ) Conc (C-24800) Conc (C-24802) Feed (C-24804) T a i l s
To ta l S 2.73 2.88 3.08 3.02 1.99 3.37 Ash 10.0 9 .9 10.9 12 .0 7 .3 13.6 P y r i t i c S 2.86 2.79 2.33 1.21 2.27 Recovery 44.2 25.4 74.5
B t u 13,042 13,077 12,413 12,674 13,335 12,451
Condi t ions : * 1 . 5 l b s a c t i v e air foam/ton, 4 - l i t e r Denver c e l l , 1075 rpm, 8 s c f h f low r a t e ** 1.4 I b s a c t i v e a i r foam/ ton , 4 - l i t e r Denver c e l l , 1075 rpm, 8 s c f h f low r a t e ES
Product washed wi th 6 : l (w/w) methanol/coal on a d r y s o l i d s b a s i s .
These r e su l t s ( f l oa t s A and B) indicate unexpected trends and show tha t no beneficiation can be expected by d i rec t combination of ES and A F . In order t o achieve separation, some procedure must be used tha t u t i l i ze s the "free" par t ic les before reagglomeration occurs.
hen the actual versus calculated ES feeds are compared ( tab le 7) i t appears t ha t the mass balances are o f f , possibly because of sampling prob- lems or because of the occurrence of segregation. During the ES r u n s igni- f ican t leaks in the IITRI unit were observed, which may have caused process conditions t o vary.
In an attempt t o e f fec t a se aration the following experiments were r u n .
so l id s ) , derived from the K Y l l coal under conditions of 7500 psi and 835*F,

TABLE 9. Analyses o f organic solvent-washed ES product
% Sampl e
Ash P S 0 S T S B t u number
IITRI KYl1 feed coa l (6/10) 8 .6 2.47 1.40 3.86 13100 C-25044 IITRI ES p r o d u c t (6/10) 12.2 2.03 0.90 2.94 12622 C-25043
MeOH wash feed THF wash f e e d THF/H20 wash feed Acetone wash feed
(A) So lven t wash on concen t ra ted ES p r o d u c t
ES p r o d u c t washed 6 : l (w/w) w i t h s o l v e n t s , a g i t a t e d i n a b l e n d e r f o r 5 minutes, then f i 1 t e r e d .
( B ) U l t r a s o n i c t r e a t m e n t o f meOH washed, concen t ra ted E S p r o d u c t
C o n d i t i o n s : 20% s o l i d ES p roduc t s l u r r y mixed w i t h 3 :1 methanol f o r 60 seconds. M i x t u r e then p laced i n Bronson u l t r a s o n i c b a t h f o r 30 m inu tes a t f u l l power (Model DHA-1000).
PS=pyri t i c s u l f u r ; OS=organic s u l f u r ; TS=to ta l s u l f u r
was t rea ted with several d i f f e r en t concentrations of an e l ec t ro ly t e (alum- inum su l f a t e ) p r io r t o AF separat ion. The conditions and r e s u l t s a re shown in t ab l e 8. The data indicate t h a t no beneficiat ion occurred a t these l eve l s of e l e c t ro ly t e addition and suggests t h a t clumping may not be p r i - marily an e l e c t r o s t a t i c phenomenon.
of ES product t h a t had been extracted with methanol, then f i l t e r e d . Re- s u l t s shown in t ab l e 8 indicate t h a t the ext ract ion (solvent wash) produced some AF benef ic ia t ion. The methanol washing helped considerably, indicat - ing t h a t a methanol-soluble "o i l " may have bound the l i be r a ed pa r t i c l e s together, causing a1 1 par t i cl es (maceral s and mi n e r d s ) t o e hydrophobic. A l a t e r experiment involved extraction of the ES product and chemical examination of the ex t rac t . A noticeable o i l -1 i ke smell was d i sce rn ib le in a l l ES s l u r r i e s when received; t h i s most l i ke ly was a by-product of the short-term high-temperature and high-pressure conditions, which tended t o cause some degradation of the organic s t ruc tu re in the macerals. The explanation fo r the reaggregation i s probably qui te complex, involving an o i l by-product, and possibly i s time dependent. Most c e r t a i n ly , concen- t r a t i n g and drying the so l ids would tend t o promote reaggregation. The ES samples taken fo r pa r t i c l e - s i z e analyses a t I ITRI were not concentrated (-0.5% t o 1% so l i d s ) and were t rea ted with a dispersant soon a f t e r ES treatment.
Extract ion o f ES 1 1/2 bar re l s ( 55 ga l ) of 0.3% ES product s lu r ry was obtained during the 6/10/86 IITRI continuous flow r u n and shipped t o ISGS fo r f u r t he r s tud ies . Table 9(A) shows the r e s u l t s of extraction a t room temperature separate ly

BLE 18. AF separation of organic solvent-washed ES product
Sample W t Ash PS OS TS B t u number
I I T R I K Y l l feed coa l (6/10) - - - 8.6 2.47 1.40 3.86 13100 C-25044 I I T R I ES p roduc t (6/10) - - - 12.2' 2.03 0.90 2.94 12622 C-25043
AF on MeOH-washed concen t ra ted ES p roduc t
Dosaqe
5.3 I b s / t A.F. Conc 1 17.0 9 .1 - - - - - - 2.07 13170 C-25074 10.5 I b s / t A.F. Conc 2 51.5 12.5 2.06 0.48 2.54 12502 C-25075
Ta i 1 s 31.5 19.6 2.86 0.71 3.61 - - - C-25076 Calc feed 14.2 2.80 - - -
AF on M e ~ ~ / ~ ~ ~ - w a s h e d concen t ra ted ES p roduc t Dosaqe
9.5 l b s / t A.F. Conc 1 59.9 10.5 - - - - - - 2.60 13083 C-25200 10.0 l b s / t K T a i l s 40.1 13.3 - - - - - - 2.54 11876 C-25201
Calc feed 11.6 2.58 12579
AF on MeOH/THF-washed concen t ra ted ES p roduc t Dosaqe
5.0 I b s / t A.F. Conc 1 25.0 11.7 - - - - - - 2.32 12603 C-25202 3.0 l b s / t K 5.0 l b s / t A.F. Conc 2 64.6 14.1 - - - - - - 1.91 12347 C-25203 3.0 l b s / t K 3.0 lbs /K Conc 3 8.2 16.2 - - - - - - 2.36 12739 C-25204
T a i l s 2.2 34.1 - - - - - - - - - - - - C-25205 Calc Feed 14.1
A.F.=Airfoam; P S = p y r i t i c s u l f u r ; OS=organic s u l f u r ; TS=to ta l s u l f u r ; K=Kerosene Cond i t ions : 2 - l i t e r Denver c e l l , 1075 rpm, A i r f l o w r a t e = 8 s c f h ; Note: P y r i t i c s u l f u r and o rgan ic s u l f u r d a t a a r e m i s s i n g where t h e r e was n o t enough sampl e ava i 1 ab l e.
by methanol, tetrahydrofuran (THF) , THF and water, and a'cetone. The dry so l i d s were washed with solvent (6:1 w/w % solvent t o dry s o l i d s ) , agi ta ted a t high speed ag i ta t ion in a blender f o r two minutes, then f i l t e r e d .
I t i s in te res t ing t o note t ha t washing of the ES product by methanol o r acetone tended t o concentrate the ash and decrease the B t u value r e l a - t i v e t o the individual ES product. On the other hand the THF and THF/H 0- washed ES product had s l i g h t l y higher B t u values and lower ash values t 2 an did the unwashed ES product. One possible explanation i s t h a t THF i s ab- sorbed more i n to the coal matrix, whereas methanol ac tual ly d issolves some of the "organic ; t h i s hypothesis was par t ly supported by a decrease in organ! c sul f u r he methanol-washed ES product in comparison with the unwashed ES product (.61% vs -90%). Table 9(B) indicates the r e s u l t s of ul t rasoni cal l y t r e a t i ng a methanol -extracted ES product; the ash, t o t a l su l fu r , and B t u values a re roughly the same as those fo r the untreated methanol -washed sampl e .

TABLE 11. Oil agglomeration of methanol-washed ES product --- - -
% Sample number Wt Ash P S 0 S TS Btu
IITRI feed coal (6/10) C-25094 - - - 8.6 2.47 1.40 3.86 13100 IITRI ES product (6/10) C-25043 - - - 12.2 2.03 0.90 2.94 12622
MeOH washed, 15% kerosene
Conc 1 C-25077 97.4 11.4 1.65 0.86 2.51 - - - Tai 1 s C-25078 2.6 30.2 - - -
Calc feed 11.9
PS=pyri t i c sul fur; OS=organi c sul fur; TS=total sul fur Conditions: 15% (wt%) kerosene added to 10% ES sol ids product; agitation at high speed in a Waring blender for 5 minutes. Product screened at t100 mesh.
TABLE 12. AF separation of ES product at pH 10.5
% Sampl e number Wt Ash PS OS TS Btu
Conc C-25598 56.3 12.60 1.14 1.16 2.31 12699 Tai 1 s C-25599 43.7 12.70 1.09 1.32 2.60 12473 Feed (cal cul ated) 12.64 1.12 1.23 2.44 12600
PS=pyri tic sulfur; OS=organic sulfur; TS=total sulfur Conditions: 2-liter Denver cell ; 1075 rpm, 1% solids, 5 lbs active Airfoam/tds
organic solvent w 1 AF runs were made on ES product
and combinations of methanol and THF. Results a re sh general , some ash beneficiat ion was noted in each case f o r the concentrate, as compared with the t a i l f r ac t ion . The AF separation of methanol-washed ES product appears t o be s ign i f i can t f o r TS and ash while having a f a i r y ie ld (68.5%) f o r combined concentrations 1 and 2 .
s i c
Oil aggl omeratio attempted t o determine i f another comparable f i ne coal cleaning approach could be successful in u t i l i z i ng the ES product a f t e r methanol ext ract ion. A conventional oi l agglomeration 1 aboratory procedure was used on the extracted 6/10/86 ES product. The spec i f i c conditions and resul t s a re shown in t ab l e 11. Although the y ie ld i s r a the r high ( - ! I T % ) , i t appears t h a t some beneficiat ion occurred (1.65% p y r i t i c su l fu r in concentrate versus 2.03% in ES product).
. Attempts t o physically separate the ES product by AF mpts a t f l o t a t i on a t both low (pH=3.0) and high (pH=10.5) pH
leve l s . With low pH, s ign i f i can t amounts of H2S ere evolved from the s lu r ry ; t h i s re lease of H S would be environmentally unacceptable a t a 7 commercial l eve l , and wou d preclude the subsequent AF s tep . Results in t ab l e 12 indicate no beneficiat ion a t high pH.
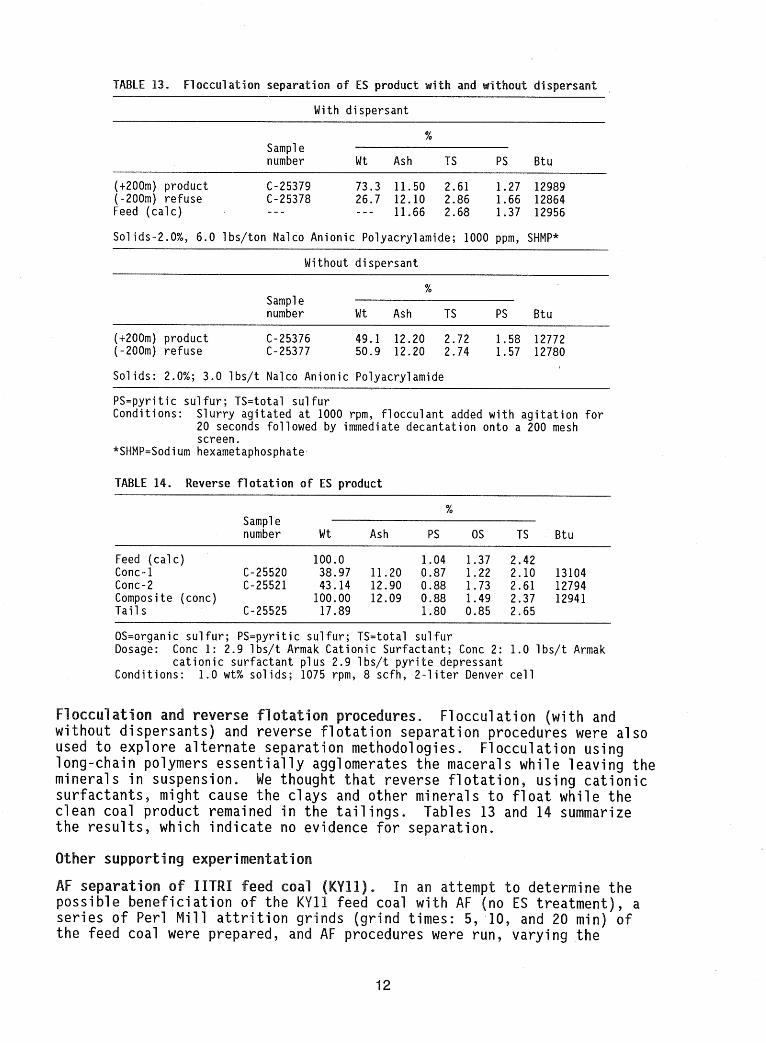
TABLE 13. Fl occul ati on separ sf ES product w i t h and n i t
With d i s p e r s a n t
% Sampl e number Gdt Ash TS PS B tu
(+200m) p roduc t C-25379 73.3 11.50 2.61 1.27 12989 (-200m) r e f u s e C-25378 26.7 12.10 2.86 1.66 12864 Feed ( c a l c ) - - - - - - 11.66 2.68 1.37 12956
Sol ids-2.0%, 6.0 I b s / t o n Nalco An ion ic Polyacry lamide; 1000 ppm, SHMP*
Wi thout d i s p e r s a n t
% Sampl e number W t Ash TS PS B t u
(t200m) p r o d u c t C-25376 49.1 12.20 2.72 1.58 12772 (-200m) r e f u s e C-25377 50.9 12.20 2.74 1.57 12780
S o l i d s : 2.0%; 3.0 l b s / t Nalco An ion ic Polyacry lamide
P S = p y r i t i c s u l f u r ; TS=to ta l s u l f u r Cond i t i ons : S l u r r y a g i t a t e d a t 1000 rpm, f l o c c u l a n t added w i t h a g i t a t i o n f o r
20 seconds f o l l o w e d by immediate d e c a n t a t i o n on to a 200 mesh screen.
*SHMP=Sodium hexametaphosphate
TABLE 14. Reverse flotation of ES product
Sampl e number W t Ash P S 0 S TS B t u
Feed ( c a l c ) 100.0 1.04 1.37 2.42 Conc- 1 C-25520 38.97 11.20 0.87 1.22 2.10 13104 Conc-2 C-25521 43.14 12.90 0.88 1.73 2.61 12794 Composite (conc) 100.00 12.09 0.88 1.49 2.37 12941 T a i 1 s C-25525 17.89 1.80 0.85 2.65
OS=organic s u l f u r ; PS=pyri t i c s u l f u r ; TS=tota l s u l f u r Dosage: Conc 1: 2.9 l b s / t Armak C a t i o n i c S u r f a c t a n t ; Conc 2: 1 .0 I b s / t Armak
c a t i o n i c s u r f a c t a n t p l u s 2.9 I b s / t p y r i t e depressant Cond i t ions : 1.0 wt% s o l i d s ; 1075 rpm, 8 scfh, 2 - l i t e r Denver c e l l
e s . Flocculation (with and rocedures were a l so
t e separation methodologies. Flocculation using long-chain polymers e s s en t i a l l y agglomerates the macerals while leaving the minerals in suspension. We thought t h a t reverse f l o t a t i on , using ca t ion ic su r fac tan t s , might cause the clays and other minerals t o f l o a t while the clean coal product remained in the t a i l i n g s . Tables 13 and 14 summarize the r e s u l t s , which indicate no evidence fo r separation.
In an attempt t o determine the AF (no ES t reatment) , a
inds (grind times: 5, 10, and 20 min) of the feed coal were prepared, and AF procedures were r u n , varying the
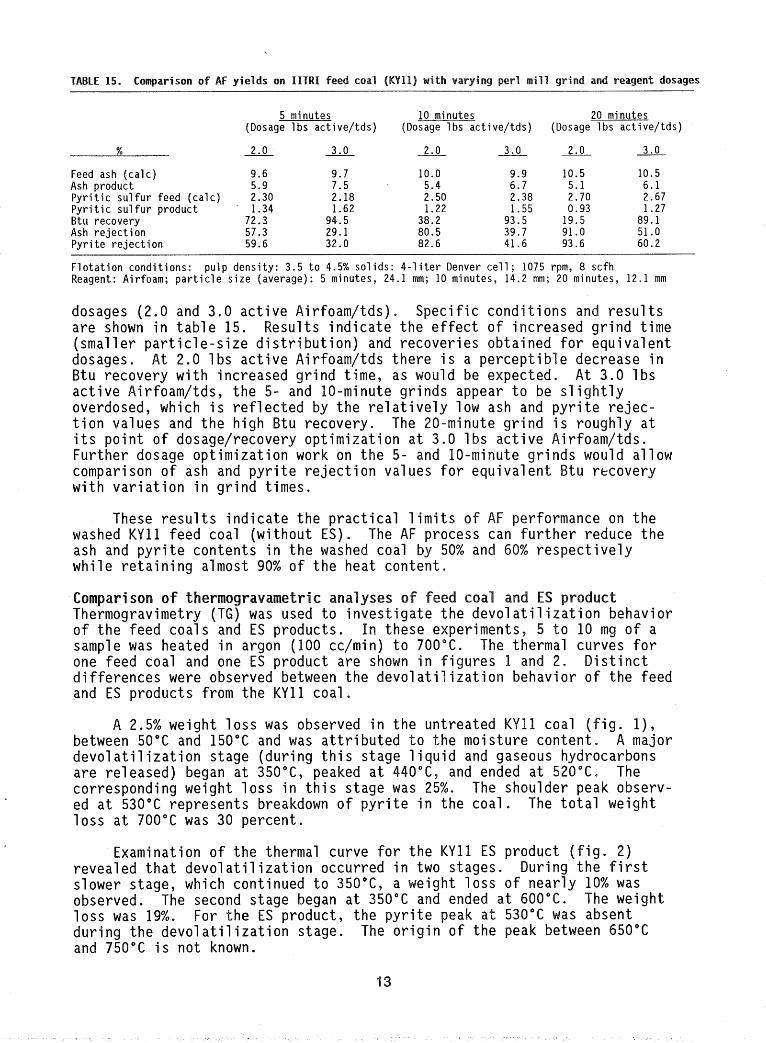
TABLE 15. C~rnparison o f F yields on IHBRI feed coal ( erl mill grind an
Feed ash ( c a l c ) Ash product P y r i t i c s u l f u r feed ( c a l c ) P y r i t i c s u l f u r p roduct B tu recovery Ash r e j e c t i o n P y r i t e r e j e c t i o n
5 minutes (Dosage 1 bs ac t i ve / t ds )
10 minutes (Dosage I b s ac t i ve / t ds )
20 minutes (Dosage l b s ac t i ve / t ds )
-- - -- - - -
F l o t a t i o n cond i t i ons : pu lp dens i t y : 3.5 t o 4.5% s o l i d s : 4 - l i t e r Denver c e l l ; 1075 rpm, 8 sc fh Reagent: Airfoam; p a r t i c l e s i z e (average): 5 minutes, 24.1 mm; 10 minutes, 14.2 mm; 20 minutes, 12.1 mm
dosages (2.0 and 3.0 active irfoam/tds). Specific conditions an are shown in table 15. Resu t s indicate the e f fec t of increased (smaller par t ic le -s ize d i s t r ibu t ion) and recoveries obtained for equivalent dosages. A t 2.0 lbs active Airfoam/tds there i s a perceptible decrease in B t u recovery with increased grind time, as would be expected. A t 3.0 lbs active Airfoam/tds, the 5- and 10-minute grinds appear t o be s l i gh t ly overdosed, which i s reflected by the re la t ive ly low ash an t ion values and the high B t u recovery. The 20-minute grin i t s point of dosage/recovery optimization a t 3.0 lbs act iv Further dosage optimization work on the 5- and 10-minute grinds would allow comparison of ash and pyri te rejection values for equivalent B t u recovery with variation in grind times.
These resu l t s indicate the practical l imi t s of erformance on the washed KYll feed coal (without ES). The AF process can fur ther reduce the ash and pyri te contents in the washed coal by 50% and 60% respectively while retaining almost 90% of the heat content.
of the feed coals and ES products. In these experiments, 5 t o 10 mg of a sample was heated in argon (100 cc/min) t o 700°C. The the ma1 curves for one feed coal and one ES product are shown in figures 1 an 2 . Distinct differences were observed between the devolat i l izat ion behavior of the feed and ES products from the KYll coal.
A 2.5% weight loss was observed in the untreate KYll coal ( f i g . 1 ) , between 50°C and 150°C and was a t t r ibuted to the moi tu re content* A major devolat i l izat ion stage (during t h i s stage l iquid and gaseous hydrocarbons are released) began a t 350°C, peaked a t 440°C, and ended a t corresponding weight loss in t h i s stage was 25%. The shoulder peak observ- ed a t 530°C represents breakdown of pyr i te in the coal. The to ta l weight loss a t 700°C was 30 percent.
Examination of the thermal curve for the KYll ES product ( f i g . 2 ) revealed t h a t devolat i l izat ion occurred in two stages. During the f i r s t slower stage, which continued t o 350°C, a weight loss of nearly 10% was observed. The second stage began a t 350°C and ended a t 600°C. The weight loss was 19%. For the ES product, the pyrite peak " C was absent during the devolat i l izat ion stage. The origin of the peak between 650°C and 750°C i s not known.

200 400 600 E temperature, "C
Figure 1. TG Analysis of ES feed coal (KY 11 ).
I , 200 400 600 E
temperature, "C
Figure 2. TG Analysis of ES product (KY 1 1 ).
comparison of the thermal curves indicated t h a t during the major devol a t i l i za t ion s tage the re lease of vol a t i 1 e matter from the ES product occurred a t a much lower r a t e than t h a t observed f o r the feed coalm. Also, the temperature corresponding t o the maximum r a t e of weight l o s s was s h i f t -
y 40°C ( i . e . , 480°C). For the ES product the weight loss observed below 350°C could be due t o evaporation of the i n - s i t u o i l t h a t had been adsorbed on maceral and mineral pa r t i c l e s . This pos s ib i l i t y leads us t o believe t h a t the o i l y coating considered responsible f o r poor AF perform- ance i s due t o sorption of evolved o i l s from the ES treatment. While the values f o r t o t a l v o l a t i l e matter in both feed (41.4%) and ES product (40.2%) a re e s s en t i a l l y equivalent, the nature of both feed and product has changed because of the higher temperature and pressure conditions during ES.
Fisher Assays were a lso performed on the IITRI K Y l l feed coal and ES product t o compare o i l y ie lds and t o observe the i n i t i a l temperature a t which t a r s s t a r t t o v o l a t i l i z e . The o i l y ie lds were s imi lar (35.5 and 34.4 gal/U.S. ton) f o r the feed coal and ES product, respectively. However, the ES product yielded t a r s a t 257°C while the feed coal did not produce t a r s un t i l 350°C. Total weight loss f o r the feed coal was 32.8% as compared with 25.9% f o r the ES product; t h i s d i f ference was caused by the higher moisture of the feed coal (11.2% as compared t o 7.4%) and i t s g rea te r amount of noncondensable gases (9.0% vs 6.3%).
In order t o be t t e r understand the chemical nature of the organic compounds t h a t a re evolved during the ES process and subsequently re-adsorbed in to the shat tered
(6 pa r t s methan ex t rac t by gel spectroscopy.
An a l iquot (100 mL) of the sample ex t rac t was centrifuged and the ernatant was decanted and concentrated t o approximate t o 50°C under a s t r e ution was again conc es t o remove the l a s t
Approximately 30 mg of the ex t rac t was d i s s s i l i c a gel was added and the THF was evaporated gas. The sampl e-coated s i l ica gel was placed on t o atography column. The column ( f rac t ion 1 ) ; 30 m L of 1:1, he benzene : methanol ons were obtained: (1) a1 iphat ics -7%, (2
When the a l i pha t i c f rac t ion (1) was analyzed the n-paraff ins f through C29 were detecte most dominant, an
The aromatic f rac t ion 2) was not analyzed fu r the r . I t probably con- s i s t s mostly of low-molecu? t o 3 r ings) compounds.
The polar f rac t ion (3) was analyzed by infrared spectroscopy. The spectrum showed peaks f o r hydroxyl (phenols), carboxylic, carbonyl, and possibly ni trogen-containing functional groups. A1 so, aromatic, and unsaturated peaks wer ( M W ) range i s thought t o be mixed ( peci es i nvol ved) .
In conclusion, t h i s samp e i s not very d i f f e r en t from o t wol a t i 1 e products obtained f r m heated coal . These r e s u l t s c presence of organic compounds t ha t apparently coat these a r t i c l e s of ES product and i nh ib i t s ign i f i can t separation.
I ITRI expl os i vel ion and a i r d r i e
separate cont oal and a 200-mesh I l l i n o i s (Herrin No. 6 added t o TMS MgS04'7H20, 0 was autocl awe ferrooxidans The cu l tu res oculated control cu l tu res were included with experiments being r u n in dup- l i c a t e . Per iodical ly , a l iquots were removed from the incubator and c e n t r i - fuged a t 10,000 x g fo r 3 nutes. Sulfa te concentration in the superna-
etermined turbi 8 days of incu surabl e sul f a t e pl osivel y shat
In the same time interval the p y r i t i c su l fu r in the 200-mesh I l l i n o i s (Herrin 6) coal ( the control sample was released as

explosively shattered coal
0 I 1 I I I I I
0 4 8 12 16 20 24 28 days
0 0 4 8 12 16 20 24 28
days
Figure 3. Microbial treatment of ES product and coal.
su l f a t e . These r e s u l t s , shown in f igure 3 , e s sen t i a l l y indicate t h a t the roduct cannot be desulfurized using microorganisms. A possible reason
i s t h a t the ES pa r t i c l e s are coated with organics; t h i s i nh ib i t s penetra- t i on , which the microbial process requires.
i c . A 1 arge (800 ml) atch cu l tu re of shattered coal in TMS was prepared as de-
scribed as above. In t h i s case, a 10% inoculum was used. The cu l tu re was incubated a t ambient temperature on a gyratory shaker a t 150 rpm. The ES material was submitted fo r AF treatment a f t e r microbial treatment f o r 20 days. A control r u n (no microbial treatments) was a lso made. These re - s u l t s a re shown in t ab le 16. We concluded t h a t no beneficiat ion occurred as a resul t s f mi crobi a1 treatment.
. The purpose of petrographic examination was t o evaluate the degree of comminution of the explosively shat tered samples in comparison t o t h a t of mill-ground samples, and t o note any problems o r unusual sample cha r ac t e r i s t i c s t ha t would a f f ec t potential cleaning behavior,
icroscopic specimens ( p e l l e t s of the f i r s t two samples and smear mounts of the l a s t f i v e ) were made with some d i f f i c u l t y because the samples tended t o clump in the bo t t l e and during mixing with epoxy. We used a low- v i scos i ty epoxy t o minimize t h i s problem. The p e l l e t s and smears were well mixed and the epoxy s e t without pressure. After polishing, the samples were examined a t 320x t o 500x magnification under o i l on a Leitz Orthoplan opt ica l mi croscope.
les . The f i r s t ES samples we examined were from e Kentucky coal feed, numbered C-24540 (3/27/86) and
6 ) . These samples were examined a t 320x magnification.
Both samples had cha rac t e r i s t i c s with which we were unfamiliar. The mean p a r t i c l e s i z e of the ES samples was c lea r ly smaller than t h a t of the 5-minute mill -ground sample. The ES pa r t i c l e s a l l had some angular faces ; many were blade-shaped, arcuate, and/or pointed. The v i t r i n i t e in the ES
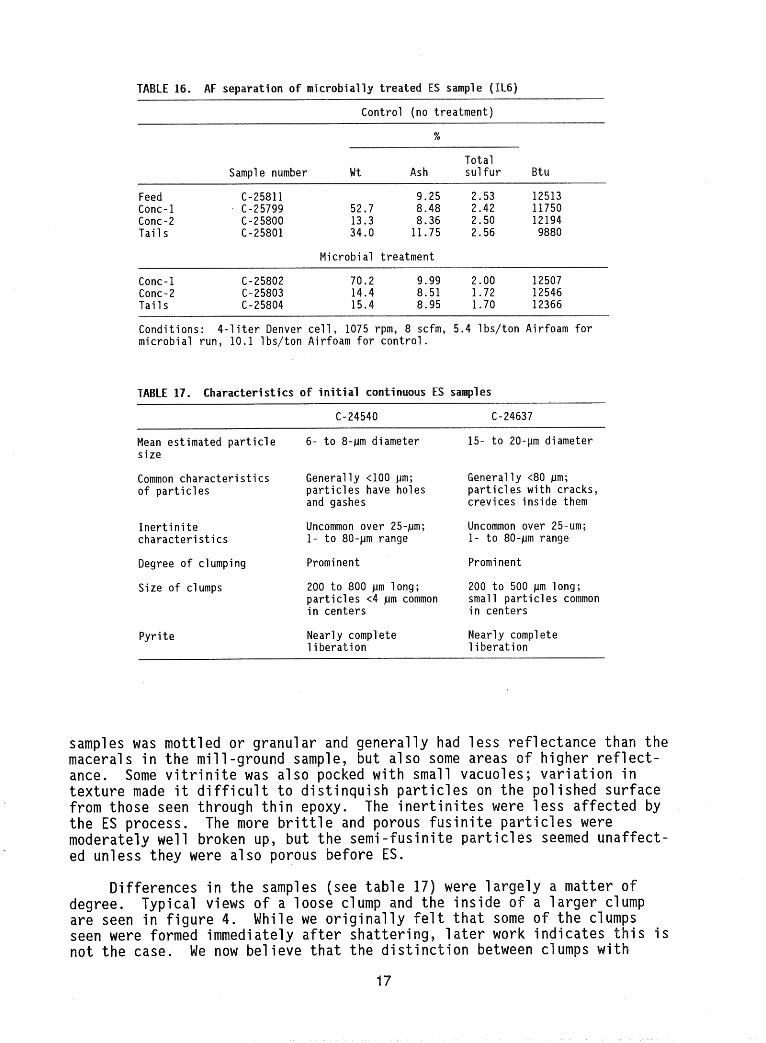
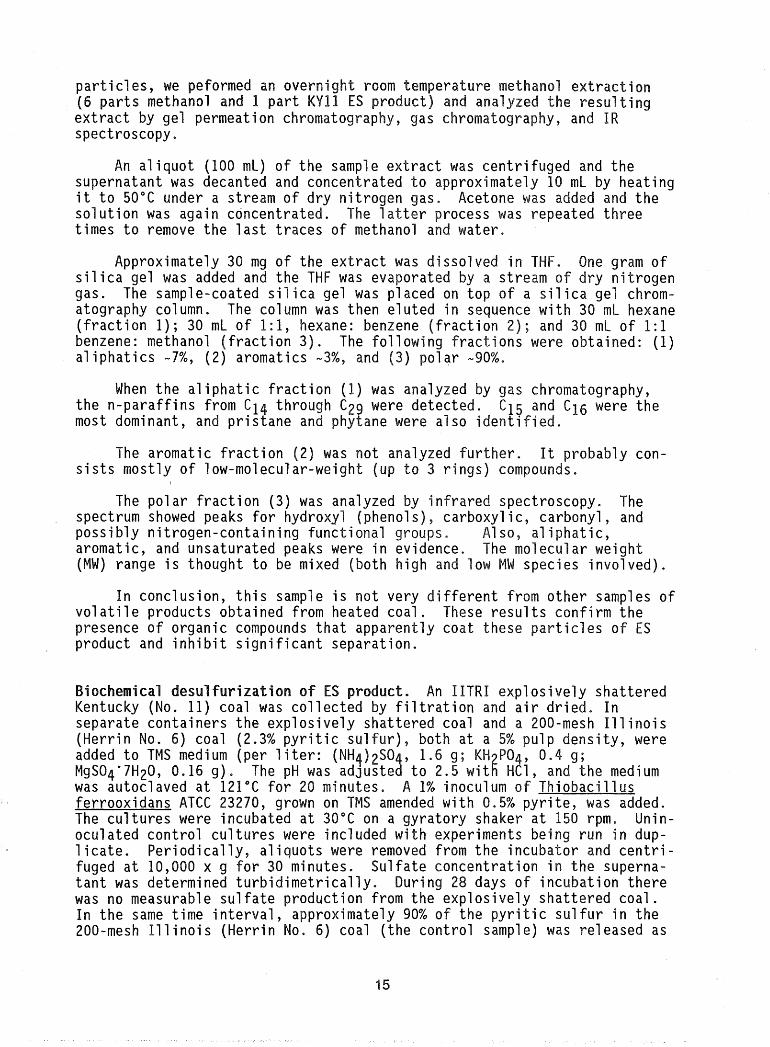
TABLE 16. AF separation o f microbially treated ES sample QIL6)
Control (no treatment)
Tot a1 Sampl e number W t Ash sulfur Btu
Feed C-25811 9.25 2.53 12513 Conc- 1 C-25799 52.7 8.48 2.42 11750 Conc-2 C-25800 13.3 8.36 2.50 12194 Tails C-25801 34.0 11.75 2.56 9880
Microbial treatment
Conc-1 C-25802 70.2 9.99 2.00 12507 Conc-2 C-25803 14.4 8.51 1.72 12546 Tails C-25804 15.4 8.95 1.70 12366
Conditions: 4-liter Denver cell, 1075 rpm, 8 scfm, 5.4 Ibs/ton Airfoam for microbial run, 10.1 lbs/ton Airfoam for control.
TABLE 17. Characteristics sf initial continuous ES samples
Mean estimated particle size
Common characteristics of particles
Inertinite characteristics
Degree of clumping
Size o f clumps
Pyrite
6- to 8-bm diameter
Generally <lo0 Nm; part i cl es have hol es and gashes
Uncommon over 25-pn; 1- to 8 0 - ~ m range
Promi nent
200 to 800 pm long; particles (4 pn common in centers
Nearly complete liberation
15- to 20-pm diameter
Generally t80 Nm; particles with cracks, crevices inside them
Uncommon over 25-um; 1- to 80-pm range
Prominent
200 to 500 pn long; small part i cl es common in centers
Near1 y complete liberation
samples was mottled o r granular and generally had less reflectance t h a n the macerals in the mill-ground sample, b u t also some areas of higher ref lec t - ance. Some v i t r in i t e was also pocked w i t h small vacuoles; variation in texture made i t d i f f i cu l t t o distinquish particles on the polished surface from those seen through t h i n epoxy. The inert ini tes were less affected by the ES process. The more b r i t t l e and porous fusini te part icles were moderately we1 1 broken up, b u t the semi -fusi ni t e ed unless they were also porous before ES.
Differences in the samples (see table 17) were largely a matter of degree. Typical views of a loose clump and the inside o f a 1 arger clump are seen in figure While we originally f e l t seen were formed im ediately af ter shattering, 1 n o t the case. We now believe that the distinction between clumps with

Figure 4. Views of an early ES sample (C24637) ( 6 0 0 ~ ) ; (a) loose clump with some pyrite; (b) inside of larger clump showing tight packing.
nepoxied centers and those
For comparison, the feed figures 5a and 7a.
Our preliminary pe
The coal particles were shattered i matter was n o t as finely comminute
Clumping of the lem, because i t liberated minerals t o ma
Pyrite 1 iberation was excellent; only a fe had attached to macerals,
The 1 argest remaining vi t r i n i te-dominate subparall el fracture/del aminat should further size reduction
To evaluate possible w se t of small -batch ES runs receiver charges were varie b u t temperature and pressur were received as s lurr ies . an ES product from the continuo sample. These seven sample thought t o contribute t o cl conditions and qua1 i ta t ive found in table 18.
Sample P2308 represents a base-level ru NaOH was added t o sample P2309 in the trap; met the trap for sample P2310; P2311 ad methanol i in the trap; and P2312 had a clay ferences in the petrographic analy
Our f i r s t observation of significance tion varied substantially ( f i cant comminution was foun comparison of the effects o could be made. Howev trol s , P2313 and P231 uous r u n ES product ( small ES batch product (P23 tendencies to clump (see f ig . 6 4 . Althou reasons for these behaviors are n o t comple geous t o keep the temperature below 900°F the pressure high, then i t i s unclear for P2309.
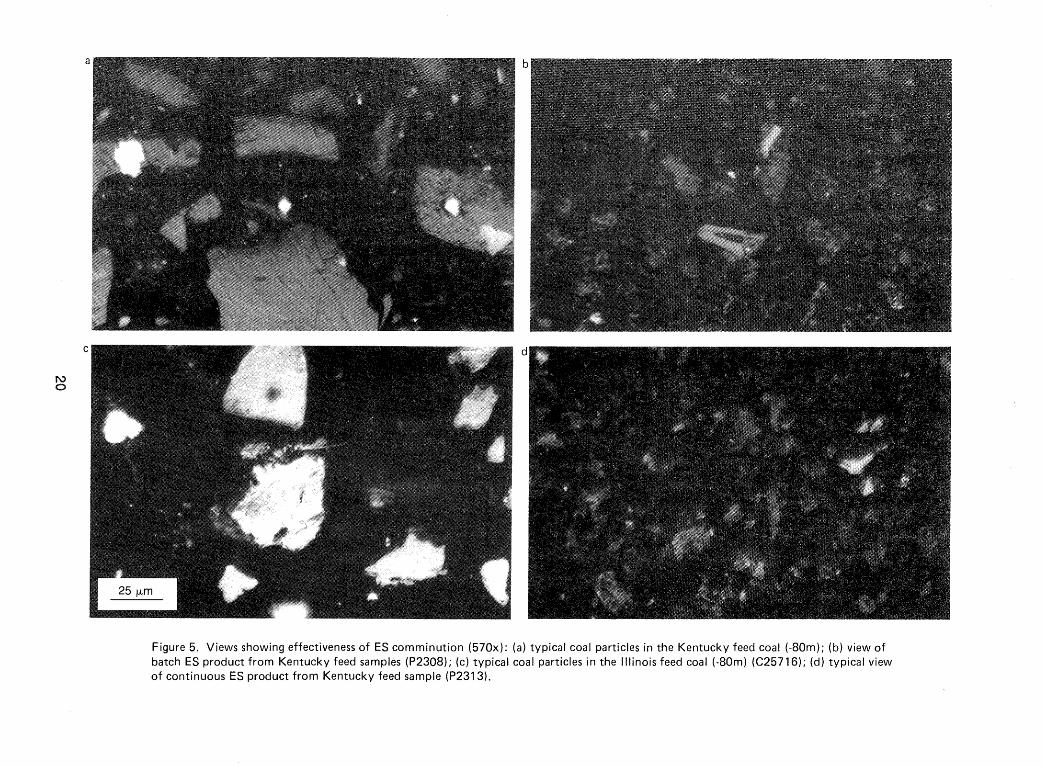
Figure 5. Views showing effectiveness of ES comminution ( 5 7 0 ~ ) : (a) typical coal particles in the Kentucky feed coal (-80m); (b) view of batch ES product from Kentucky feed samples (P2308); (c) typical coal particles in the Illinois feed coal (-80m) ((225716); (d) typical view of continuous ES product from Kentucky feed sample (P2313).
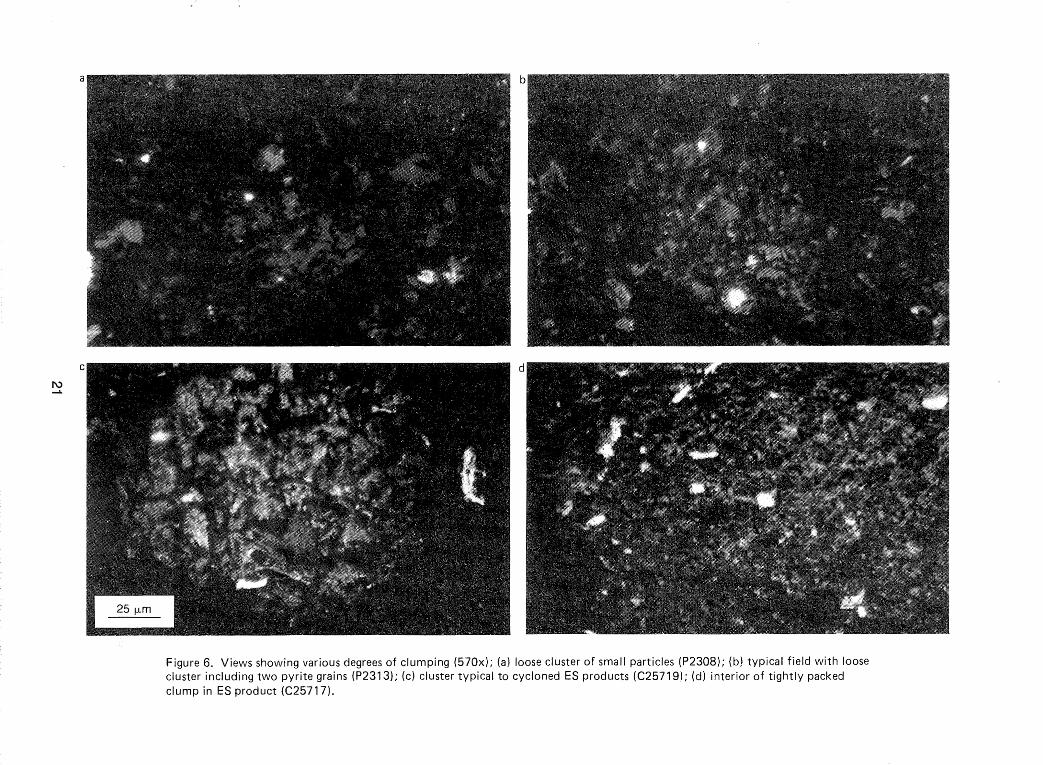
Figure 6. Views showing various degrees of clumping ( 5 7 0 ~ ) ; (a) loose cluster of small particles (P2308); (b) typical field with loose cluster including two pyrite grains (P2313); (c) cluster typical to cycloned ES products (C25719); (d) interior of tightly packed clump in ES product (C25717).
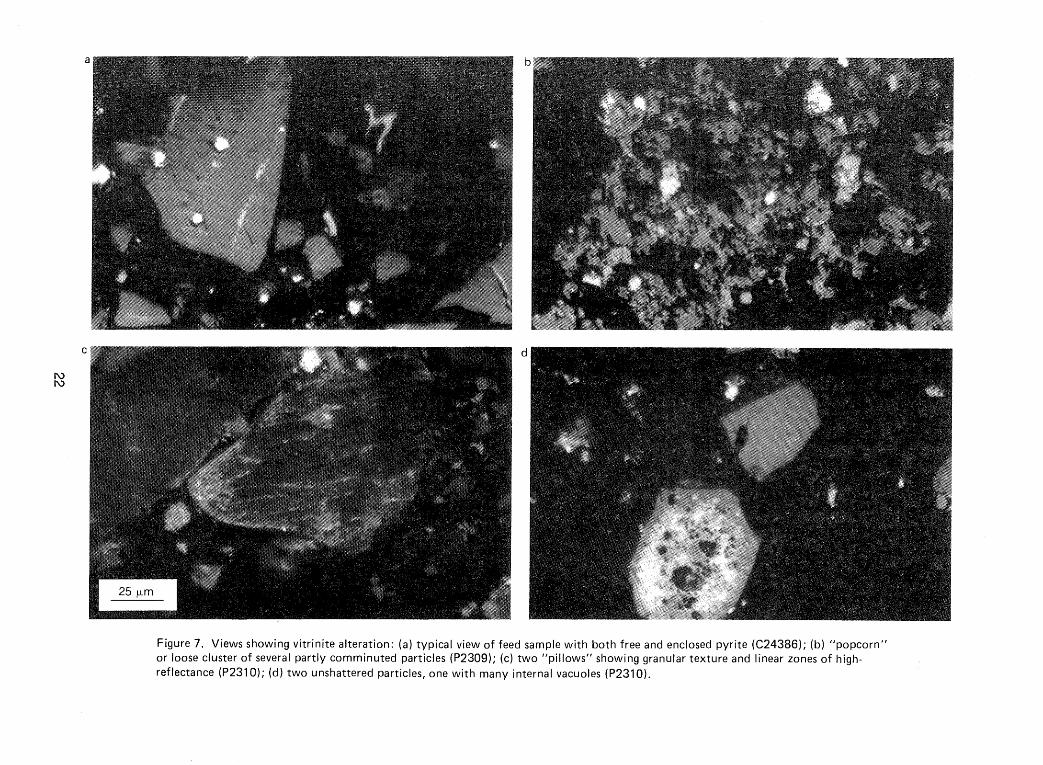
Figure 7. Views showing vitrinite alteration: (a ) typical view of feed sample with both free and enclosed pyrite ((224386); (b) "popcorn" or loose cluster of several partly comminuted particles (P2309); (c) two "pillows" showing granular texture and linear zones of high- reflectance (P23lO); (dl two unshattered particles, one with many internal vacuoles (P231 0).
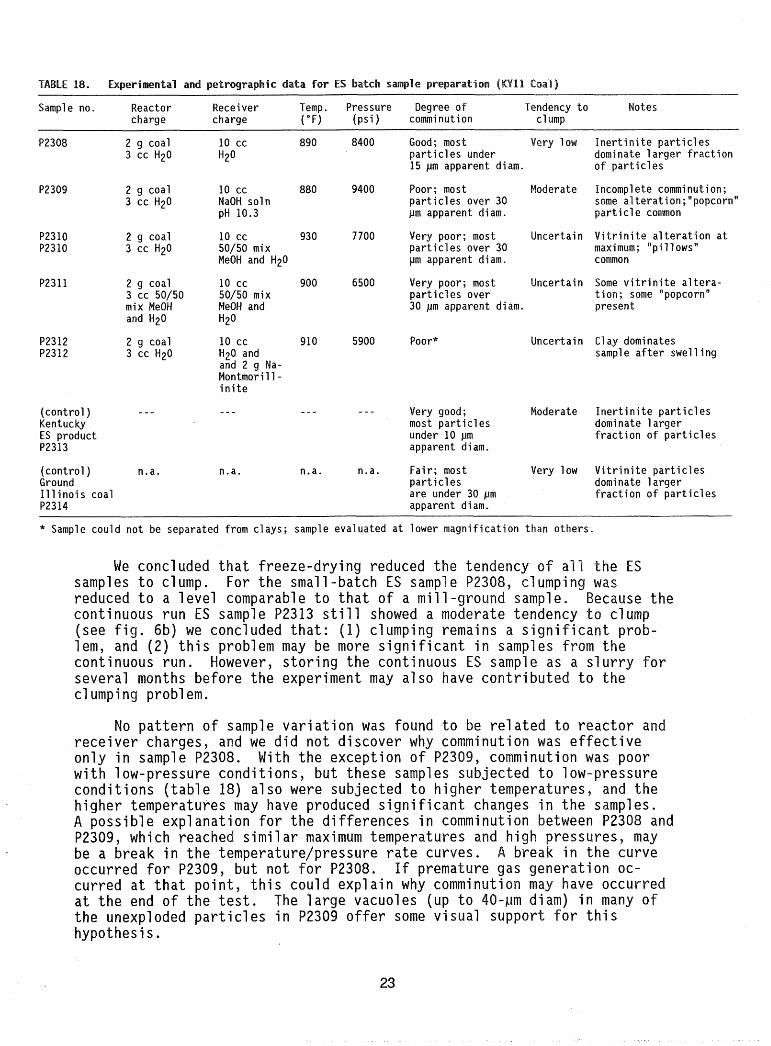
TABLE 18. Experimental and p e t r
Sample no. Reactor Recei ver Temp. Pressure Degree of Tendency t o Notes charge charge ( O F ) ( p s i ) comminution c l ump
Ine r t in i t e p a r t i c l e s dominate 1 a rge r f r ac t ion of p a r t i c l e s
P2308 2 g coal 3 cc Hz0
8400 Good; most Very low pa r t i c l e s under 15 pm apparent diam.
P2309 2 g coal 3 cc Hz0
10 cc 880 NaOH soln pH 10.3
9400 Poor; most Moderate p a r t i c l e s over 30 Nm apparent diam.
Incomplete commi nut i on; some a1 t e r a t ion; "popcorn" p a r t i c l e common
7700 Very poor; most Uncertain p a r t i c l e s over 30 ym apparent diam.
V i t r i n i t e a l t e r a t i o n a t maximum; "pillows" common
P2310 2 g coal P2310 3 cc Hz0
10 cc 930 50/50 mix MeOH and Hz0
P2311 2 g coal 3 cc 50/50 mix MeOH and Hz0
10 cc 900 50/50 mix MeOH and H20
6500 Very poor; most Uncertain p a r t i c l e s over 30 pm apparent d i m .
Some vi t r i n i t e a1 t e r a - t i o n ; some "popcorn" present
P23 12 2 g coal P2312 3 cc Hz0
10 cc 910 Hz0 and and 2 g Na- Montmori 11 - i n i t e
5900 Po o r* Uncertain C1 ay domi nates sampl e a f t e r swell i ng
(control ) - - - Kentucky ES product P2313
- - - Very good; oderate most p a r t i cl e s under 10 ,um apparent diam.
I n e r t i n i t e p a r t i c l e s dominate 1 a rge r f r ac t ion of p a r t i c l e s
(control ) n.a. Ground I l l i n o i s coal P2314
n.a. Fair ; most Very low p a r t i c l e s a re under 30 Am apparent d i am.
V i t r i n i t e p a r t i c l e s dominate 1 a rge r f r ac t ion of p a r t i c l e s
* Sample could not be separated from c lays ; sample evaluated a t lower magnification than o the r s .
We concluded t h a t freeze-drying reduced the samples t o clump. For the small-batch ES sample reduced t o a level comparable t o that of a mill -g continuous r u n ES sample P2313 s t i l l showed a moderate tend (see f ig . 6b) we concluded that: (1) clumping remains a sig lem, and ( 2 ) t h i s problem may be more significant in samples from the continuous r u n . However, storing the continuous ES sample as a slurry for several months before the experiment may also have contributed t o the cl umpi ng problem.
No pattern of sample variation was found t o be related t o reactor and receiver charges, and we did n o t discover hy comminution was effective only in sample P2308. With the exception f P2309, comminution was with low-pressure conditions, b u t these samples subjected t o low-pre conditions (table 18) also were subjected t o higher temperatures, and the higher temperatures may have produced significan A possible explanation for the differences in co P2309, which reached similar maximum temperature be a break in the temperature/ ressure rate curves. occurred for P2309, b u t n o t fo P2308. If prema curred a t t h a t point, th is could explain why com a t the end of the t e s t . The large vacuoles ( u p the unexploded particles in P2309 offer some visual support for th i s hypothesis.
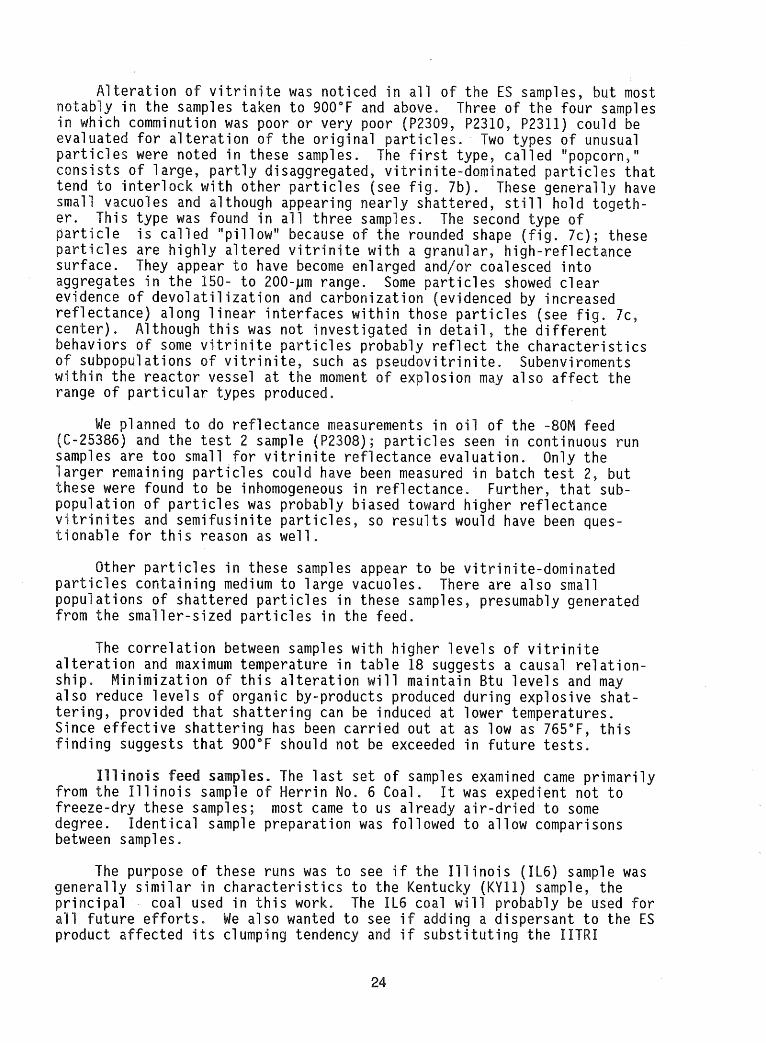
icles showed clear
lect the characteristics inite. Subenviroments
asurements in oil of the - 08); particles seen in con reflectance eval uation. Onl y the
s, SO results wo le for this reaso
ther particles i these samples e vitrinite-dominate aining medium to l arge v here are also small shattered parti cl es in
e smaller-sized particles i
etween samples ith higher levels of vitrinite on and maximum temperature i s a causal relation-
tu level s and may ing explosive $hat-
at lower temperatures.
es. The last set of samples examined came primarily rom of Herrin No. 6 Coal. It was expedient not to freeze-dry these samples; most came to us already air-dried to some
ee. Identical sample preparation was followed to allow comparisons
ns was to see eristics to t
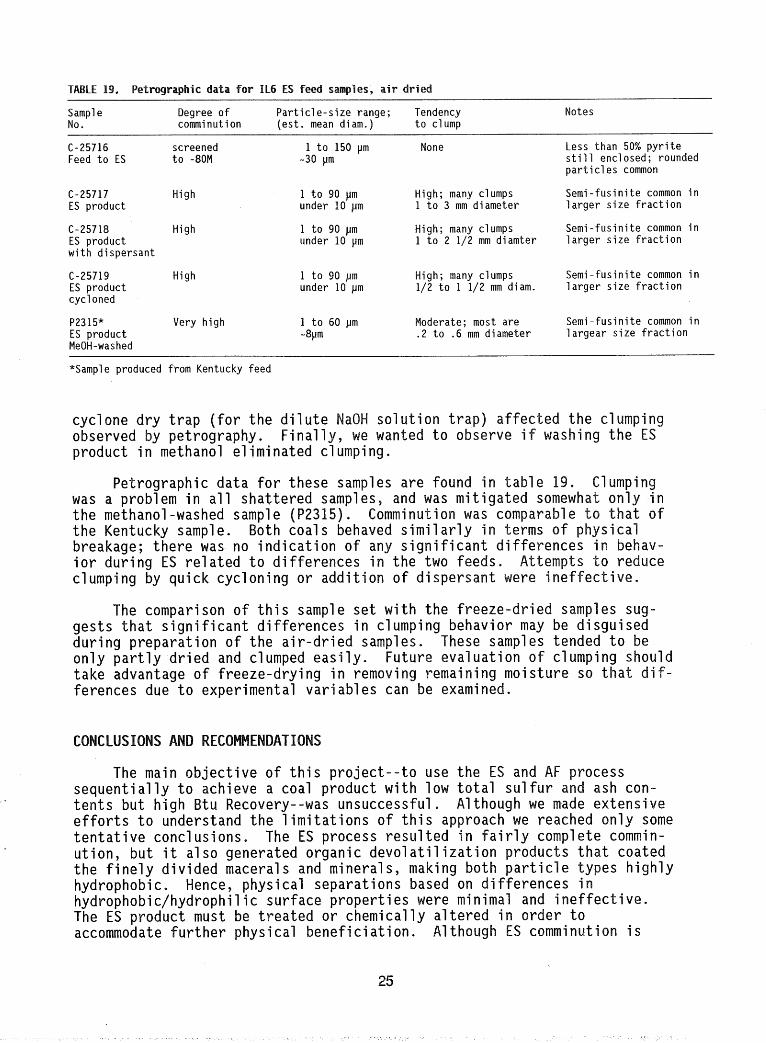
TABLE 19, Petrographic data for IL6 ES feed sam
Sample Degree of Particle-size range; Tendency No. comminution (est. mean diam.) to clump
Notes
C-25716 screened Feed to ES to -80M
C-25717 High ES product
C-25718 High ES product with dispersant
C-25719 High ES product cycl oned
P23 15* Very high ES product MeOH-washed
1 to 150 pm -30 pm
1 to 90 pm under 10 pm
1 to 90 pm under 10 pm
1 to 90 pm under 10 pm
1 to 60 pm -8pm
High; many clumps 1 to 3 mm diameter
High; many clumps 1 to 2 1/2 mm diamter
High; many clumps 1/2 to 1 1/2 mm diam.
Moderate; most are .2 to .6 mm diameter
Less than 50% pyrite sti 11 encl osed; rounded part i cl es common
Semi-fusinite common in larger size fraction
Semi-fusinite common in larger size fraction
Semi-fusinite common in 1 arger size fraction
Semi-fusinite common in largear size fraction
--
*Sample produced from Kentucky feed
cyclone dry t r ap ( f o r the d i l u t e NaOH solution t r ap ) affected the clumping observed by petrography. Finally, anted t o observe i f product in methanol el iminated cl umping.
Petrographic data f o r these samples are found in t a was a problem in a l l shattered samples, and the methanol-washed sample (P2315). Comminu the Kentucky sample. Both coals behaved s imi lar ly i breakage; there was no indication of any s ign i f i can t d i o r during ES re la ted t o d i f ferences in the two feeds. ttempts t o reduce clumping by quick cycloning o r addition of dispersant @ i ne f fec t iv
The comparison of t h i s sample s e t with the f reeze-dr ie ges t s t h a t s i gn i f i c an t d i f ferences in clumping behavior may during preparation of the a i r -d r ied samples. T only pa r t l y dr ied and clumped eas i ly . Future e take advantage of freeze-drying in removing rem ferences due t o experimental variables can be examined.
The main object ive of t h i s p ro jec t - - to use the ES and sequent ia l ly t o achieve a coal product with low to t a l sul fu t e n t s but high B t u Recovery--was unsuccessful. Although we e f f o r t s t o understand the l imi ta t ions of t h i s appro t en t a t i ve conclusions. The ES process resul ted in ompl e t e cornmi n - ut ion, but i t a l so generated organic devo l a t i l i z a t i c t s t h a t coated the f i ne ly divided macerals and minerals, making both hydrophobic. Hence, physical separat ions based on di hydrophobic/hydrophilic surface propert ies were minim The ES product must be t rea ted o r chemically a l t e red in order t o accommodate fu r the r physical beneficiat ion. Althoug
aggregate f i ne
everal o ther i ne-coal cl eani n techniques use ggl omerat i on, f l occul a t i on, an reverse f l o t a t
al so unsuccessful . ecause organic solvent extraction s f t product cause
S product observe
ur content i s su l fu r and other
ing s u l f i d i c (S=) and
improve our underst ing of problems --and possibly lead sol ut ions--incl ude
f u r t he r e f f o r t s to :
ptimize organic sol vent ashing of ES product. Some beneficiat ion served when methanol used t o ex t rac t the ES product p r io r t o AF t ion . This approach t be economically viable a t commercial
sca le , but invest igat ion of e s t conditions fo r achieving e f f i c i e n t AF enef ic ia t ion would be of i n t e r e s t .
uce hydrocarbo ional study i s needed t o e net r e lease mperature rang bly be benefic 1 porosity by

the feed coal appears t o have a ectiveness o he feed part icle-siz nution and changes i
The investigators gratef D . R . Dickerson, K.W. . Rostam-Abadi, member
. I . Brabets of IITRI, a co-patentee of the ES process.
Jameson, G.J., S. Nam, and oo Young, 1977, Physical factors affecting recovery rates i n f l otat i on, in. Sci, Eng., v .
assey L. G., R. I . undes i red comp
.S, Patent No atural Gas Se
P . , R . B. Read, s , J . 8 . FitrPatrick, D. Buckentin, L. R , R . Ruth, 198
gate Flotation Fine Coal Cleaning P ocess, in Technica for Research on Sulfur in Coal for eriod 1983-1986, Champaign, I h .
icrobubble f lo ta t io of f ine coal : epartment of Engineering, Virginia Polytechnic Ins i WX, Bl acksburg,
VA, U.S. DOE Grant DE-FG22-80PC 30234.

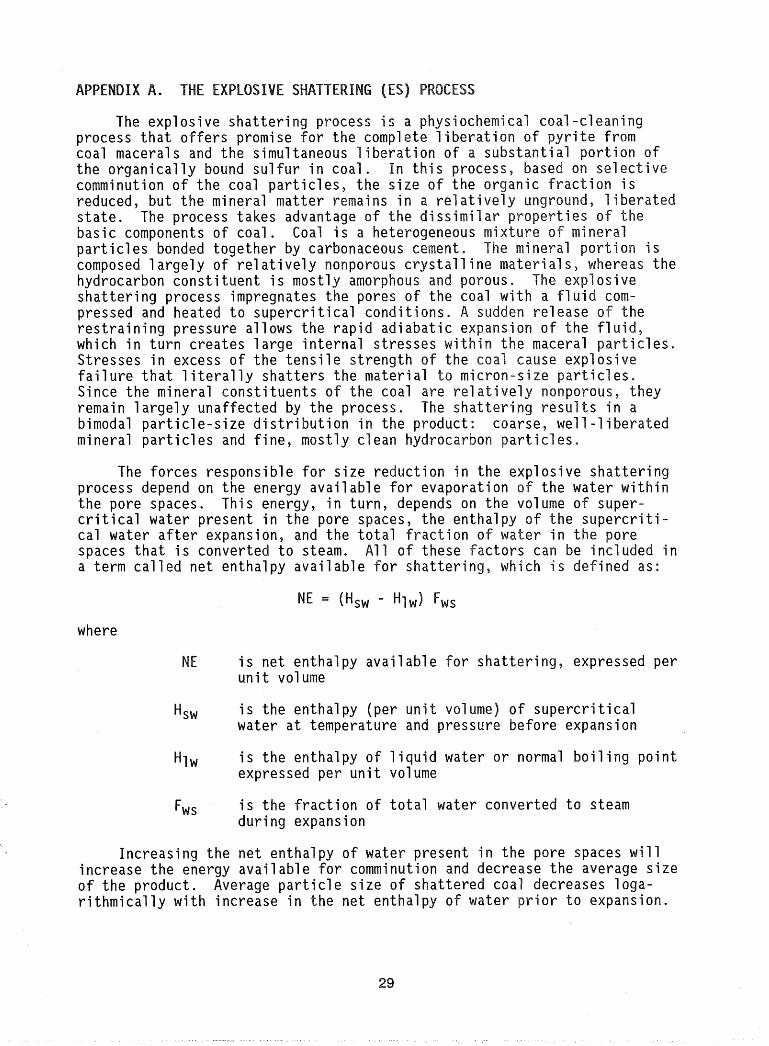
The explosive shattering p r process tha t offers promise for coal maceral s and the simultaneo the organical l y bound sul fur in comminution of the coal par t ic le reduced, but the mineral matter s t a t e . The process takes advant basic components of coal. Coal par t ic les bonded together by car composed 1 argely of re1 a t ively n hydrocarbon consti tuent i s most1 shattering process impregnates t pressed and heated t o supercr i t i res t ra ining pressure allows the which in turn creates large in te Stresses in excess of the tensi l f a i l u re t ha t l i t e r a l l y shat ters Since the mineral consti tuents o remain 1 argely unaffec
a r t i c l e - s i ze a r t i c l e s and f ine , most
The forces responsible for s ize reduction in the explosive shattering process depend on the energy avail ab the water within the pore spaces. This energy, in t u c r i t i c a l water present in the pore s cal water a f t e r expansion, and t spaces t ha t i s converted t o s tea a term called net enthalpy avail able
where
N E i s net enthalpy available a t te r ing , expressed per unit volume
h w i s the enthalpy (per unit volume supercri t i cal water a t temperature and pressur fore expansion
Hl w i s the enthalpy o f l iqui water o r normal boiling point expressed per unit volume
Fw s i s the fraction of to ta l water co during expansion
Increasing the net enthalpy of water increase the energy avai 1 abl e for comminution and of the product. Average par t ic le s ize of shat r i thmically with increase in the net enthalpy
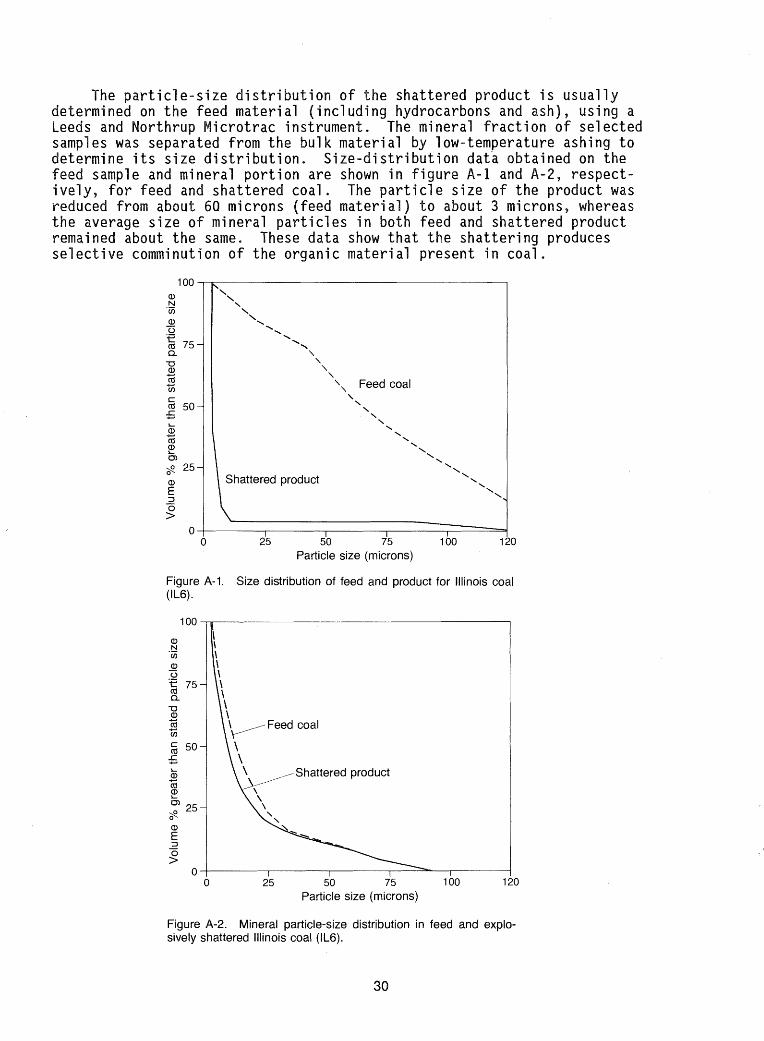
a r t i c l e - s i ze dis t r ibut ion of the shattered product i s usually determined on the feed material including hydrocarbons and ash) , using a Leeds and Northrup The mineral fraction of selected samples was separat e r ia l by low-temperature ashing to determine i t s s ize dis t r ibut ion. Size-distribution data obtained on the
sample and mineral portion are shown in figure A - l and y, fo r feed and shattered coal. The a r t i c l e s ize of t h
reduced from about 60 microns (feed material) t o about 3 microns, whereas the average s ize of mineral par t ic les in both feed and shattered product remained about the same. These data show that the shattering produces select ive comminution of the organic materi al present in coal.
\ \ \ \, Feed coal
\ \
\ \ \
Shattered product \ \ \ \ \ \
11 0 0 25 50 75 100 1
Particle size (microns)
Figure A-I. Size distribution of feed and product for Illinois coal
Shattered product
0 25 50 75 100 1 Particle size (microns)
Figure A-2. Mineral particle-size distribution in feed and explo- sively shattered Illinois coal (IL6).
During the past (ISGS), in conjunction Southern Illinois Univ mesh) advanced physica izes conventional frot
pyrite from ul trafine selective" reagents. face chemistry of coal based on coal surface of inefficient separat
A feature of the AF Proc encompasses selective agglome flocculation) of fine coal pa
ively low concentrations
from ash-forming mi neral part this means of separation is t flotation cells. Additional1 small for fine coal, is contr foaming surfactant, the colle by mechanical equipment desig erally ascribed to froth flot the major disadvantages of ea high chemical costs, respecti
The typical AF run feed coal (such as 80% - stirred-ball milling. A solids is obtained; the feed is the impeller speed is set to 107 is thoroughly mixed, and after a is added and mixed for 2 minutes. and a coal -laden froth is produced; of the cell into collection receiv froth concentrates and tailings ar weighed.
The AF process can achieve more t tu recovery w g more than 70% of the pyritic sul f
An additional 40% to 50% reduct for pre-washed coals while maint
The AF process produ Appal achi an coal , the

rocess has achieve
wi tk reasonable e required fQr
> marcasite > illite > mixed layered, iflfte/smectite.
nerates wastes that are difficult to dispose of.
coal that ar either cost
lthough processing reparati on pl ants h
increasingly mechanized, f i nes (28x100 Recovery of t sound procedu of the plant feed. Unfor size does not significant particles in Illinois coals.
One method for unlocking enclosed pyrite is extensive comminution to ul traf i ne sizes ( 4 0 can be difficult to basis. The numerous mi nerd matter i ncl u pyrite flotation, and dry processes separat i on. A1 l ave been reported
everthel ess, because o
preventing its immediate implementation.
significant problem in floating u l trafi flotation rate and resulting loss of r coal. In a flotation process, rising air bubble, and then sur adhere to the air bubbl bi 1 i t y that a particle smaller coal particle s
articles, and stre trafine sizes is d
particle collision.
Additionally, reagent selectivity, whic lic interactions between the flotati ueous environment, c n significantly of coal flotation p ocesses, Adhesi
affected not only by these interactions but of the coal particle, induc ion time, balanc coal escence, and surf ace te therefore be significantly
to control th ave been repo
generated microbubbles into and product quality over th considering the the control, the actual effectiveness
Determinations of elemental su included in t h analyt ica l methods r (procedure D - 2 92). Analytical being devel ope by the ISGS Coal proposal t i t l e d "Forms of l y s i s products" (Projec t s u l f u r in coal and i t s hi elemental sul f u r , sol vent-sol ubl e o r acid-soluble s u l f u r , p y r i t i c s u l f u r , and residual s u l f u r .
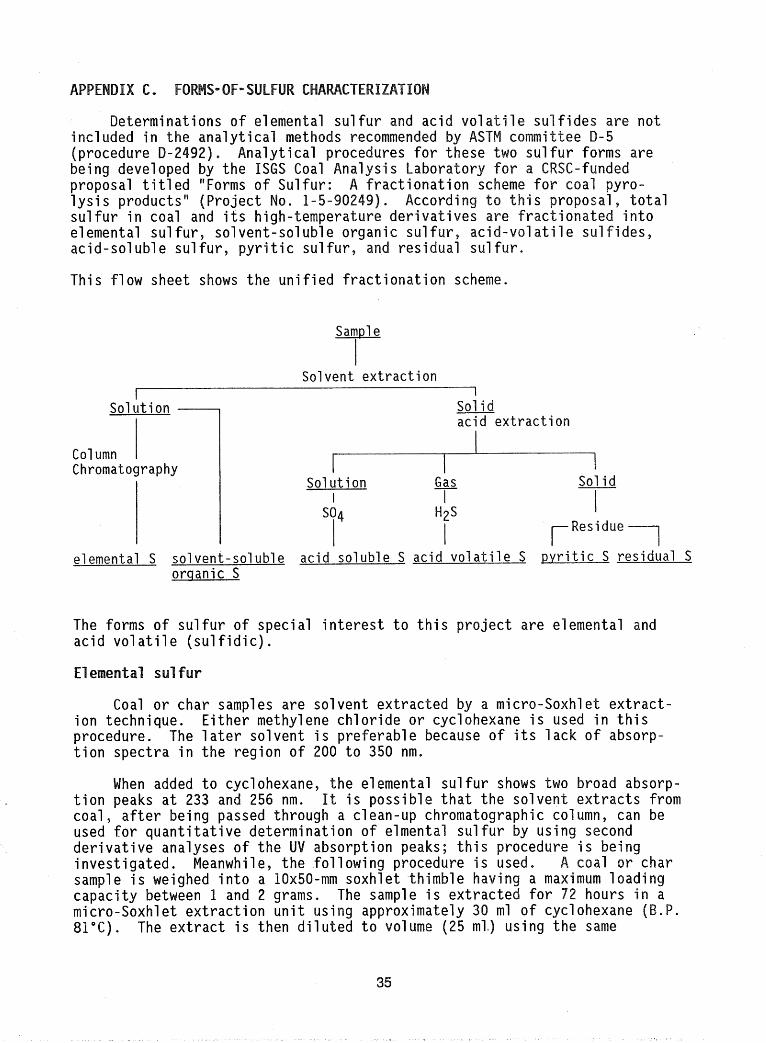
This flow sheet shows the unif ied f rac t iona t ion scheme.
Sol vent extraction 1
Sol u t i on .-,
Col umn Chromatography
Sol i d acid extraction
Sol uti on - Gas Sol id I I I
elemental S solvent-soluble acid soluble S acid vola t i le S p y r i t i c S residual S orqanic S
The forms of s u l f u r of special i n t e r e s t t o t h i s r o j e c t a re elemental and acid v o l a t i l e ( s u l f i d i c ) .
Coal o r char samples a re solvent ex t rac te y a micro-Soxhlet e x t r a c t - ion technique. Either methylene chlor ide o r cyclohexane i s used in t h i s procedure. The l a t e r solvent i s preferable because of i t s lack of absorp- t i o n spect ra in the region of 200 t o 350 nm.
When added t o cyclohexane, the elemental s u l f u r shows t ion peaks a t 233 and 256 nm. I t i s coal , a f t e r being passed through a c l used f o r quan t i t a t ive determination o de r iva t ive analyses of the UV absorpt inves t igated . Meanwhile, the fol lowi sample i s weighed i n t o a 10x50-mm sox capacity between 1 and 2 grams. The sample i s ex micro-Soxhlet ext rac t ion un i t using approximately 3 81°C). The e x t r a c t i s then d i lu ted t o volume (25 ml) using the same

ograpky. The chr ed with a 100-mm
1 hr and 130°C for 3 hr s ) . a rotary evaporator. Five
i s added t o the f lask. The or 2 minutes. Five ml of The absorbance of the so l - nm. Beer's law i s observed
P a t l ea s t 2 hours n most cases, the a1 following
l e s s t h a n 1 pg/g t o 204 pyr i te t o elemental sulfur
i s minimal. However, i f elemental sulfur were produced by ES, i t might be l o s t in the heating process and deposite in the vessels or ex i t gas l ines .
The residue remaining in the extraction thimble i s vacuum dried and in an inert-atmosphere desicc t o r unti l ready t o be analyzed. The
ing procedure i s used for the xplosive shattered samples.
e thimble i s lask connected to a d i s t i l l a t i o n through which f nitrogen gas i s maintained. An of d i lu t e pho ) i s added to t e sample via a side-
essure-equal i z l . The H2S re1 ased from the sample i s absorbed in a solution of 2 M NaOH containing an a corbic acid-EDTA mixture. The resul ing sulf ide i s then t i t r a t e d with a lead perchlorate solution employing sul f ide-sensi t i e specif ic ion electrode as the indicator. The end point i s observe a t -765 mv. When sulf ide concentra-
i s low the response of the electrode i s not rapid enough t o overcome possible oxidation by a i r .
The procedures for determining the elemental sulfur and acid vo la t i l e sulf ides used in t h i s investigation are parts of the ongoing method development for the unified sulfur fractionation scheme for feed coal and i t s pyrolyzed derivatives. This scheme requires tha t a coal sample be carried throughout the en t i re fractionation procedure; hence, the coal or char sample i s weighted into the cellulose soxhle thimbl e and el emental sulfur i s the i r s t species determined. This i n i t i a l solvent extraction has an advantage, ecause samples t h a t normally are not wettable by water become e t tab le and c n be treated with d i lu t e acid used in the subsequent method
for ac id-vola t i l e sulf ide.
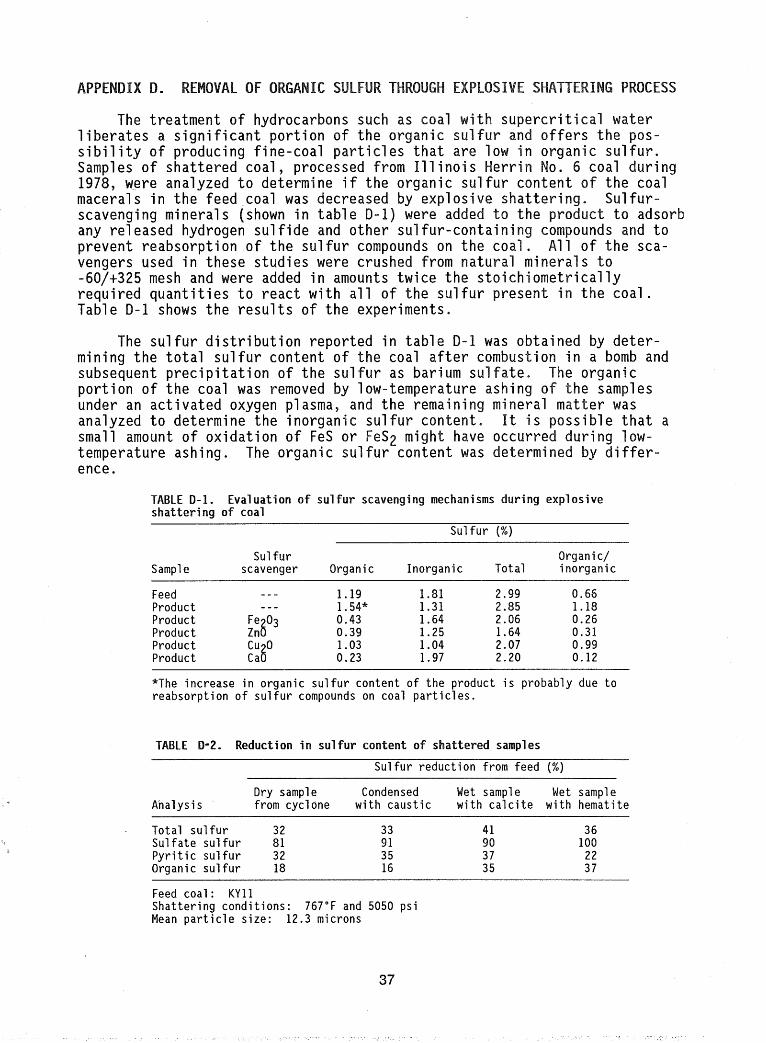
The treatment of hydrocarbon liberates a significant portion o si bil i ty of producing fine-coal particl Samples of shattered coal, processed fr
ere analyzed to determine if the macerals in the feed coal was decreased scavenging minerals (shown in table 0-1 any re1 eased hydrogen sul f ide and other prevent reabsorption of the sulfur comp vengers used in these studies were crus -60/+325 mesh and ere added in amounts required quantities to react wit Table D-1 shows the results of the experiments.
The sulfur distribution reported in tab1 e -1 was obtained by deter- mining the total sulfur content of the coal aft subsequent precipitation of the sulfur portion of the coal was removed by 1 under an activated oxygen plasma, an analyzed to determine the inorganic small amount of oxidation of FeS or FeS2 might temperature ashing. The organic sulfur content ence.
TABLE D-1. Evaluation o f s u l f u r scavenging mechanisms during explos ive s h a t t e r i n g o f coal
Sul f u r (%)
Sul f u r Organ i c/ Sampl e scavenger Organic Inorganic Total inorganic
Feed - - - 1.19 1 .81 2.99 0.66 Product - - - 1.54* 1.31 2.85 1.18 Product
:303 0.43 1.64 2.06 0.26
Product 0.39 1.25 1.64 0.31 Product C u 0 1 .03 1 .04 2.07 0.99 Product c a6 0.23 1.97 2.20 0.12
*The i nc rea se i n organic s u l f u r content of t h e product i s probably due t o reabsorp t ion of s u l f u r compounds on coal p a r t i c l e s .
TABLE D-2. Reduction i n s u l f u r content o f s
Su l fu r reduction from feed (%)
Dry sample Condensed Wet sample Wet sample Anal y s i s from cyclone with c a u s t i c with c a l c i t e with hemati te
. Total s u l f u r 3 2 S u l f a t e sul f u r 81 P y r i t i c sul f u r 32 Organic sul f u r 18
Feed coal : KY 11 Sha t t e r i ng condi t ions : 767°F and 5050 psi Mean p a r t i c l e s i z e : 12.3 microns
The addit ion of su l fu r scavengers decreased the organic su l fu r content of the shat tered product by as much as 80%. Calcium oxide produced the best pnesul t s .
Addition of su l fu r scavengers was a lso investigated under the current explosive sha t t e r ing program in experiments using the K Y l l coal . D i s t r i - bution of su l fu r between organic and inorganic forms was determined using the standard ASTM procedure (D-2492). Results shown in t ab l e D-2 indicate t h a t organic su l fu r content of the product decreased by about 17% without the addit ion of su l fu r scavengers and by about 36% a f t e r the addition of su l fu r scavengers. Additional data shown in t ab le 9 of ,the main par t of h i s repor t a l so showed a 36% reduction in organic su l fu r . We believe tha t
sha t t e r ing the coal t o produce f i n e r pa r t i c l e s ( 2 t o 3 microns) wil l l i b e r a t e l a rge r quan t i t i e s of organic su l fu r .