isim in-depth tutorial - xilinx · isim in-depth tutorial 5 ug682 (v14.3) october 16, 2012 chapter...
TRANSCRIPT

ISim In-Depth Tutorial
UG682 (v14.3) October 16, 2012
This tutorial document was last validated using the following software version: ISE Design Suite 14.3This tutorial document was last validated using the following software version: ISE Design Suite 14.3This tutorial document was last validated using the following software version: ISE Design Suite 14.3This tutorial document was last validated using the following software version: ISE Design Suite 14.3
If using a later software version, there may be minor differences between the images and results shown inIf using a later software version, there may be minor differences between the images and results shown inIf using a later software version, there may be minor differences between the images and results shown inIf using a later software version, there may be minor differences between the images and results shown inthis document with what you will see in the Design Suite.this document with what you will see in the Design Suite.this document with what you will see in the Design Suite.this document with what you will see in the Design Suite.

ISim In-Depth Tutorial www.xilinx.com UG682 (v14.3) October 16, 2012
Xilinx is disclosing this user guide, manual, release note, and/or specification (the "Documentation") to you solely for use in the development of designs to operate with Xilinx hardware devices. You may not reproduce, distribute, republish, download, display, post, or transmit the Documentation in any form or by any means including, but not limited to, electronic, mechanical, photocopying, recording, or otherwise, without the prior written consent of Xilinx. Xilinx expressly disclaims any liability arising out of your use of the Documentation. Xilinx reserves the right, at its sole discretion, to change the Documentation without notice at any time. Xilinx assumes no obligation to correct any errors contained in the Documentation, or to advise you of any corrections or updates. Xilinx expressly disclaims any liability in connection with technical support or assistance that may be provided to you in connection with the Information.
THE DOCUMENTATION IS DISCLOSED TO YOU “AS-IS” WITH NO WARRANTY OF ANY KIND. XILINX MAKES NO OTHER WARRANTIES, WHETHER EXPRESS, IMPLIED, OR STATUTORY, REGARDING THE DOCUMENTATION, INCLUDING ANY WARRANTIES OF MERCHANTABILITY, FITNESS FOR A PARTICULAR PURPOSE, OR NONINFRINGEMENT OF THIRD-PARTY RIGHTS. IN NO EVENT WILL XILINX BE LIABLE FOR ANY CONSEQUENTIAL, INDIRECT, EXEMPLARY, SPECIAL, OR INCIDENTAL DAMAGES, INCLUDING ANY LOSS OF DATA OR LOST PROFITS, ARISING FROM YOUR USE OF THE DOCUMENTATION.
© 2011 -2012 Xilinx, Inc. XILINX, the Xilinx logo, Virtex, Zynq, Spartan, ISE, and other designated brands included herein are trademarks of Xilinx in the United States and other countries. All other trademarks are the property of their respective owners.
Revision HistoryThe following table shows the revision history for this document.
Date Version Revision
05/08/2012 14.1 • Changed revision and date. • Made small localization changes.
07/25/2012 14.2 • Verified tutorial for the 14.2 software; made minor edits.• Updated links in Appendix A, “Additional Resources.”
10/16/2012 14.3 • Validated with the 14.3 ISE/ISim software.

ISim In-Depth Tutorial www.xilinx.com 3UG682 (v14.3) October 16, 2012
Revision History . . . . . . . . . . . . . . . . . . . . . . . . . . . . . . . . . . . . . . . . . . . . . . . . . . . . . . . . . . . . . 2
Chapter 1: ISim OverviewTutorial Flow . . . . . . . . . . . . . . . . . . . . . . . . . . . . . . . . . . . . . . . . . . . . . . . . . . . . . . . . . . . . . . . . 5Understanding ISim Components . . . . . . . . . . . . . . . . . . . . . . . . . . . . . . . . . . . . . . . . . . . . 6Tool Requirements . . . . . . . . . . . . . . . . . . . . . . . . . . . . . . . . . . . . . . . . . . . . . . . . . . . . . . . . . . . 7Installing Tutorial Design Files. . . . . . . . . . . . . . . . . . . . . . . . . . . . . . . . . . . . . . . . . . . . . . . 7Design Description . . . . . . . . . . . . . . . . . . . . . . . . . . . . . . . . . . . . . . . . . . . . . . . . . . . . . . . . . . 7
Chapter 2: Running ISimCompile the Design . . . . . . . . . . . . . . . . . . . . . . . . . . . . . . . . . . . . . . . . . . . . . . . . . . . . . . . . . 11Setup and Launch Behavioral Simulation . . . . . . . . . . . . . . . . . . . . . . . . . . . . . . . . . . . . 17Result. . . . . . . . . . . . . . . . . . . . . . . . . . . . . . . . . . . . . . . . . . . . . . . . . . . . . . . . . . . . . . . . . . . . . . . 18Next Steps . . . . . . . . . . . . . . . . . . . . . . . . . . . . . . . . . . . . . . . . . . . . . . . . . . . . . . . . . . . . . . . . . . 19
Chapter 3: Using the ISim GUI and Debugging the DesignExploring the ISim GUI . . . . . . . . . . . . . . . . . . . . . . . . . . . . . . . . . . . . . . . . . . . . . . . . . . . . . 22Examine and Debug the Design . . . . . . . . . . . . . . . . . . . . . . . . . . . . . . . . . . . . . . . . . . . . . 26Re-Simulate the Design . . . . . . . . . . . . . . . . . . . . . . . . . . . . . . . . . . . . . . . . . . . . . . . . . . . . . 36Debug the Design . . . . . . . . . . . . . . . . . . . . . . . . . . . . . . . . . . . . . . . . . . . . . . . . . . . . . . . . . . . 43Conclusion. . . . . . . . . . . . . . . . . . . . . . . . . . . . . . . . . . . . . . . . . . . . . . . . . . . . . . . . . . . . . . . . . . 49
Chapter 4: Running ISim StandaloneGetting Started. . . . . . . . . . . . . . . . . . . . . . . . . . . . . . . . . . . . . . . . . . . . . . . . . . . . . . . . . . . . . . 51Prepare the Simulation . . . . . . . . . . . . . . . . . . . . . . . . . . . . . . . . . . . . . . . . . . . . . . . . . . . . . . 51Result. . . . . . . . . . . . . . . . . . . . . . . . . . . . . . . . . . . . . . . . . . . . . . . . . . . . . . . . . . . . . . . . . . . . . . . 53
Appendix A: Additional ResourcesXilinx Resources . . . . . . . . . . . . . . . . . . . . . . . . . . . . . . . . . . . . . . . . . . . . . . . . . . . . . . . . . . . . 55
Table of Contents
Send Feedback

4 www.xilinx.com ISim In-Depth TutorialUG682 (v14.3) October 16, 2012
Send Feedback

ISim In-Depth Tutorial www.xilinx.com 5UG682 (v14.3) October 16, 2012
Chapter 1
ISim OverviewThe ISim In-Depth Tutorial provides Xilinx® designers with a detailed introduction of the ISim simulation tool.
This tutorial is designed for running the ISim tool on a Windows environment. To run certain steps successfully in other operation systems, some modifications might be required.
ISim is a Hardware Description Language (HDL) simulator that lets you perform functional (behavioral) and timing simulations for VHDL, Verilog, and mixed-language designs. The ISim environment comprises the following key elements:
• vhpcomp (VHDL) and vlogcomp (Verilog) parsers
• fuse (HDL elaborator and linker) command
• Simulation executable
• ISim Graphical User Interface (GUI)
Note: More information about ISim is available in the ISim User Guide (UG660). Appendix A, Additional Resources, cites a link to the document.
Tutorial FlowThis tutorial provides a flow in which you can use ISim for performing a functional (behavioral) simulation from the Project Navigator in the ISE® Design Suite.
In this flow, you launch ISim using one of the simulation processes available in the Project Navigator. You use the Project Navigator to create a project and implement the design in a Xilinx FPGA.
The tutorial files contain sources that are not in Hardware Description Language (HDL), and, thus demonstrate how Project Navigator converts these sources to HDL source files that ISim can then compile.
Also, there is a chapter that shows you how to do the same work in a Standalone ISim mode, where you simulate your design by creating your own ISim project files and running the HDL linker and simulation executable in command line or batch file mode.
Send Feedback

6 www.xilinx.com ISim In-Depth TutorialUG682 (v14.3) October 16, 2012
Chapter 1: ISim Overview
Understanding ISim ComponentsTable 1-1 lists the ISim elements.
Table 1-1: ISim Components
ISim Component Description
Parsers: vhpcomp and vlogcomp
The parsers, vhpcomp and vlogcomp parse (syntax and semantic checks) the VHDL/Verilog files respectively and creates an intermediate file for compilation.
fuse Command The fuse command is the HDL elaborator and linker in the ISim tool. The fuse command performs a static elaboration (an elaboration of the existing design) on the design given the top design units and then compiles the design units into object code. The design unit object files are then linked together to create a simulation executable.
The fuse command can automatically invoke vlogcomp and vhpcomp for each VHDL or Verilog source code in a project file (.prj), so you can compile sources “on-the-fly.”
Simulation Executable The fuse command generates a simulation executable, which is by default named x.exe, that you can use to run the simulation of a design in the ISim tool.
• When you run the ISim tool inside ISE Project Navigator, that tool manages the invocation of the generated x.exe.
• When you run the ISim tool from the command line, you must explicitly invoke the generated simulation executable, as shown in Chapter 4, Running ISim Standalone.
The simulation executable starts an event-driven simulation with Tcl command support for driving and probing the design.
Note: The ISE simulation executable has an .exe extension in both Linux and Windows. The default executable naming format is x.exe.
isimgui.exe The isimgui.exe (isimgui on Linux) is the ISim GUI that contains the Wave window, toolbars, panels, and the status bar. In the main window, you can view the simulation-visible parts of the design, add and view signals in the Wave window, use ISim commands to run simulation, examine the design, and debug as necessary.
Send Feedback

ISim In-Depth Tutorial www.xilinx.com 7UG682 (v14.3) October 16, 2012
Tool Requirements
Tool RequirementsTo use this tutorial, you must install one of the following:
• ISE WebPACK™ 14.x
• An ISE Design Suite 14.x Edition (Logic, DSP, Embedded, System)
For more information about installing Xilinx tool, see the Xilinx Design Tools: Installation and Licensing Guide (UG798). Appendix A, Additional Resources, cites a link to the document.
Installing Tutorial Design FilesDesign files for this tutorial are available from the Tutorials page on the Xilinx website.
• Download the ug682.zip design file.
• Unzip the design files in a directory with full read and write permissions.
The zip file contains the directories listed in Table 1-2:
Design DescriptionThe tutorial design is a demonstration of the Dynamic Reconfiguration feature of the Virtex®-5 Digital Clock Manager (DCM).
Using the Virtex-5 DCM, the design generates an output clock using the following relationship:
Output Clock = Input Clock * (Multiplier / Divider)
Using the Dynamic Reconfiguration Ports (DRP) in the DCM, the design lets you re-define the Multiplier and Divider parameters to generate different output frequencies.
See the “Clock Resources” section of the Virtex-5 FPGA Users Guide, (UG190). Appendix A, Additional Resources, cites a link to the document.
Table 1-2: Tutorial Design Files
Folder Description
/sources Contains the necessary HDL files for a functional simulation of the design.
/scripts Contains incomplete script files to run the simulation. These script files are completed as you go through the tutorial.
/completed Contains completed script, simulation and Wave configuration files, as well as a completed ISE 14.2 project of the tutorial design, for comparison.
readme.txt A readme file about the tutorial design.
Send Feedback

8 www.xilinx.com ISim In-Depth TutorialUG682 (v14.3) October 16, 2012
Chapter 1: ISim Overview
Functional Blocks The following functional blocks are in the tutorial design.
drp_dcm (drp_dcm.vhd)
The drp_dcm.vhd is a Virtex-5 DCM macro with internal feedback, frequency controlled output, duty-cycle correction, and dynamic reconfiguration ability.
The CLKFX_OUT output provides a clock that is defined by the following relationship:
CLKFX_OUT = CLKIN_IN * (Multiplier/Divider)
For example, using a 100 MHz input clock, setting the multiplier factor to 6, and the divider factor to 5, produces a 120 MHz CLKFX_OUT output clock.
Using the DRP ports of the DCM, the Multiplier (M) and Divider (D) parameters can be dynamically redefined to produce different CLKFX_OUT frequencies. This tutorial shows how the Multiply and Divide parameters are provided to the DCM in hexidecimal format using the 16-bit wide DI_IN port:
DI_IN[15:8] = M – 1
DI_IN[7:0] = D – 1
For example, for an M/D factor of 6/5, DI_IN = 0504h.
drp_stmach (drp_stmach.vhd)
The drp_stmach.vhd module describes a Dynamic Reconfiguration Port (DRP) controller. The DRP controller asserts and monitors the DCM DRP signals to perform a dynamic reconfiguration cycle.
A dynamic reconfiguration cycle is started by asserting the drp_start signal. Following this step, the DRP controller asserts the appropriate DCM DRP pins to complete a full cycle.
The drp_done signal indicates successful cycle completion.
drp_demo (drp_demo.vhd)
This is the top module of the tutorial design that connects the DCM macro and the DRP controller modules to the external I/O ports.
drp_demo_tb (drp_demo_tb.vhd)
The drp_demo_tb.vhd is a self-checking HDL test bench, which is described in the following subsection.
Send Feedback

ISim In-Depth Tutorial www.xilinx.com 9UG682 (v14.3) October 16, 2012
Design Description
Design Self-Checking Test benchTo test the functionality of this design, the zip file provides a self-checking test bench. (Refer to source file drp_demo_tb.vhd in the /sources folder.) The self-checking test bench contains a validation routine that compares sampled values from the simulation against expected results. The self-checking test bench provided for this design performs the following functions.
• Generates a 100 MHz input clock for the design system clock (clk_in).
• Performs four different tests to dynamically change the output frequency of the design. In each test, a DRP cycle is started (using the drp_start signal) to set the output clock to a different frequency. Table 1-3, page 9 shows the expected output frequency and Multiplier/Divider parameters used for each test.
• In each test, the test bench compares the expected clock period and the clock period that is measured during simulation. Based upon the comparison results, the tesbench writes messages to the simulator indicating success or failure. Two of the source files used by the test bench deliberately contain errors so you can exercise the debugging features in the ISim tool later in the tutorial.
• Upon completion of the simulation, a summary report provides a list of tests, both passed or failed.
For more details on the functionality of this design, refer to the in-line comments included in the sources of the design.
Tip: To create an HDL test bench in Project Navigator, select Project > Create New Sources and select VHDL Testbench or Verilog Test Fixture.
Note: To learn more about designing HDL test benches, see Application Note XAPP199 “Writing Effective Testbenches.”
Table 1-3: Expected Output Frequency and Multiplier/Divider Parameters
Test Freq. (MHz) Period (ps) Multiplier (M) Divider (D)
1 75 13,332 3 4
2 120 8,332 6 5
3 250 4,000 5 2
4 400 2,500 4 1
Send Feedback

10 www.xilinx.com ISim In-Depth TutorialUG682 (v14.3) October 16, 2012
Chapter 1: ISim Overview
Send Feedback

ISim In-Depth Tutorial www.xilinx.com 11UG682 (v14.3) October 16, 2012
Chapter 2
Running ISim
The Xilinx® ISE® Design Suite provides an integrated flow with ISim that lets you launch simulations directly from the ISE Project Navigator.
Simulation commands that prepare the ISim simulation are generated, and automatically run in the background when simulating a design.
In this chapter you compile the design in Project Navigator, then set up and launch simulation.
Compile the DesignThe ISim integrated flow lets you perform behavioral and timing simulations of your design in either the ISE Project Navigator tool.
In this tutorial flow, you create an ISE project for the tutorial design first. You then set behavioral simulation properties, and launch the ISim simulator to perform a behavioral simulation of the design.
Create a Project in ISE Project NavigatorUse the New Project Wizard in ISE Project Navigator to create an ISE project for the tutorial design.
Note: Be sure that you have read the Installing Tutorial Design Files, page 7 to obtain the files required for this design.
Launch Project Navigator and Use New Project Wizard
To launch the Project Navigator tool and create an ISE project.
1. Launch ISE Project Navigator.
2. Select File > New Project to launch the New Project Wizard.
3. In the Create New Project dialog box, provide a name (for example, Isim_Tutorial) and an appropriate location for the project.
4. Click Next.
5. In the Project Settings dialog box, select the device and project properties. Change the settings to match the settings shown in Figure 2-1, page 12, and click Next to continue.
Send Feedback

12 www.xilinx.com ISim In-Depth TutorialUG682 (v14.3) October 16, 2012
Chapter 2: Running ISim
6. Review the Project Summary page and click Finish.
Figure X-Ref Target - Figure 2-1
Figure 2-1: New Project Wizard: Project Settings
Send Feedback

ISim In-Depth Tutorial www.xilinx.com 13UG682 (v14.3) October 16, 2012
Compile the Design
Add Tutorial Source Files to the Project
1. Select Project > Add Source to add a source file.
2. Navigate to the location where you saved your source files in Installing Tutorial Design Files, page 7.
3. In the /sources subfolder, select and open all the files.
4. In the Adding Source Files dialog box, ensure that the association and libraries are properly specified for the tutorial sources. Compare your settings with those in Figure 2-2.
Figure X-Ref Target - Figure 2-2
Figure 2-2: Adding Sources Files Dialog Box: Status of Source Files and Associations
Send Feedback

14 www.xilinx.com ISim In-Depth TutorialUG682 (v14.3) October 16, 2012
Chapter 2: Running ISim
5. Click OK.
Project Navigator adds the source files to the project. Your Project Navigator main window should now look like Figure 2-3, page 14.
Create a VHDL Library
Next, you create a user VHDL library for a VHDL package (drp_tb_pkg.vhd) that is used by the design test bench. The VHDL package contains VHDL functions used by the test bench to perform verification routines.
After you create the VHDL library, you move the VHDL package file from the /work library to the newly-created VHDL library.
To create a VHDL library.
1. In Project Navigator, select Project > New Source.
The New Source Wizard opens.
2. Select VHDL Library as the source type.
Figure X-Ref Target - Figure 2-3
Figure 2-3: ISE Project Navigator Design Summary
Send Feedback

ISim In-Depth Tutorial www.xilinx.com 15UG682 (v14.3) October 16, 2012
Compile the Design
3. Type drp_tb_lib for the VHDL library name. (Refer to Figure 2-4).
Note: Leave the Add to project check box selected.
4. Click Next.
5. In the Summary dialog box, click Finish.
Move VHDL Files to a Library
Move the VHDL package file to the drp_tb_lib library:
1. Click the Libraries tab to switch to the libraries.
2. Expand the /work library (see Figure 2-5.)
Figure X-Ref Target - Figure 2-4
Figure 2-4: Select Source Type
Send Feedback

16 www.xilinx.com ISim In-Depth TutorialUG682 (v14.3) October 16, 2012
Chapter 2: Running ISim
3. Right-click the drp_tb_pkg.vhd file, and select Move to Library.
4. In the Move to Library dialog box, select drp_tb_lib as the library into which to move the drp_tb_pkg.vhd file.
Alternatively, you can drag and drop the files into the library.
Recall that the fuse command can automatically invoke vlogcomp and vhpcomp for each VHDL or Verilog source code in a project file (.prj), so you can compile sources “on-the-fly”.
5. Click OK.
Observe that the drp_tb_lib library contains the VHDL drp_tb_pkg.vhd package file. (See Figure 2-6.)
Figure X-Ref Target - Figure 2-5
Figure 2-5: Libraries Panel
Figure X-Ref Target - Figure 2-6
Figure 2-6: Source Libraries
Send Feedback

ISim In-Depth Tutorial www.xilinx.com 17UG682 (v14.3) October 16, 2012
Setup and Launch Behavioral Simulation
Setup and Launch Behavioral SimulationNow that you have created an ISE project for the tutorial design, you can set up and launch an ISim behavioral simulation.
Set Behavioral Simulation PropertiesTo set behavioral simulation properties in ISE:
1. In the View pane of the Design pane, select the Simulation radio button at the top.
The Simulation type drop-down list opens.
2. Select Behavioral from the drop-down list.
3. Select the drp_demo_tb test bench file.
The simulation processes available for the design display in the Processes pane. (See Figure 2-7, page 17).
4. In the Processes pane, expand the ISim Simulator tree and right-click Simulate Behavioral Model under the ISim Simulator process and select Process Properties.
The ISim Properties dialog box opens (see Figure 2-8).
In this dialog box you can set different simulation properties with which to launch the simulation, such as:
• Simulation runtime
• Waveform database file location
• User-defined simulation command file
5. Uncheck the Run for Specified Time property, and click OK.
Figure X-Ref Target - Figure 2-7
Figure 2-7: Behavioral Simulation Processes
Send Feedback

18 www.xilinx.com ISim In-Depth TutorialUG682 (v14.3) October 16, 2012
Chapter 2: Running ISim
Launch Behavioral SimulationYou can now launch ISim to perform a behavioral simulation of the tutorial design.
In the Processes Panel, double-click Simulate Behavioral Model.
ResultThe ISim GUI (Figure 2-9) opens after successfully parsing and compiling the design.
Figure X-Ref Target - Figure 2-8
Figure 2-8: Process Properties: ISim Properties Dialog Box
Send Feedback

ISim In-Depth Tutorial www.xilinx.com 19UG682 (v14.3) October 16, 2012
Next Steps
Next Steps In Chapter 3, Using the ISim GUI and Debugging the Design, you can learn more about the ISim GUI features and tools for analyzing and debugging HDL designs, or you can run through the same design using the manual (Standalone) ISim commands in Chapter 4, Running ISim Standalone.
Figure X-Ref Target - Figure 2-9
Figure 2-9: ISim GUI
Send Feedback

20 www.xilinx.com ISim In-Depth TutorialUG682 (v14.3) October 16, 2012
Chapter 2: Running ISim
Send Feedback

ISim In-Depth Tutorial www.xilinx.com 21UG682 (v14.3) October 16, 2012
Chapter 3
Using the ISim GUI and Debugging the Design
The ISim GUI contains the Wave window, toolbars, tabbed panels, and a status bar. In the main window, you can view the simulation-visible parts of the design, add and view signals in the Wave window, use ISim commands to run simulation, examine the design, and debug as necessary (see Figure 3-1).
See the ISim User Guide (UG660) for more information about the GUI components. A link to the document is available in Appendix A, Additional Resources.
X-Ref Target - Figure 3-1
Figure 3-1: ISim Graphical User Interface
Send Feedback

22 www.xilinx.com ISim In-Depth TutorialUG682 (v14.3) October 16, 2012
Chapter 3: Using the ISim GUI and Debugging the Design
Exploring the ISim GUI
Main Toolbar The toolbars available in the ISim main window consist of many functionally different options. Each toolbar offers access to frequently used commands that you can also access from the menus. See the ISim User Guide (UG660) for more information about the GUI components. A link to the document is available in Appendix A, Additional Resources.
The main window toolbar icons are near the top of the ISim GUI. Figure 3-2 shows the toolbar icons in two rows. You can set the toolbars to your preference, displaying only those toolbars you want to use.
Instances and Processes PanelThe Instances and Processes panel displays the block (instance and process) hierarchy associated with the Wave configuration that is open in the Wave page. Instantiated and elaborated entities (VHDL) and modules (Verilog) display in a tree structure, with port, signal, and clocking components (see Figure 3-3).
X-Ref Target - Figure 3-2
Figure 3-2: Main Toolbar
X-Ref Target - Figure 3-3
Figure 3-3: Instances and Processes Panel
Send Feedback

ISim In-Depth Tutorial www.xilinx.com 23UG682 (v14.3) October 16, 2012
Exploring the ISim GUI
Source Files PanelThe Source Files panel displays the list of all the files associated with the design. The fuse command provides the list of design parsing and elaboration files, which is run in the background for GUI users. The HDL source files are available for quick access to the read-only source code. Figure 3-4 shows the Source Files panel.
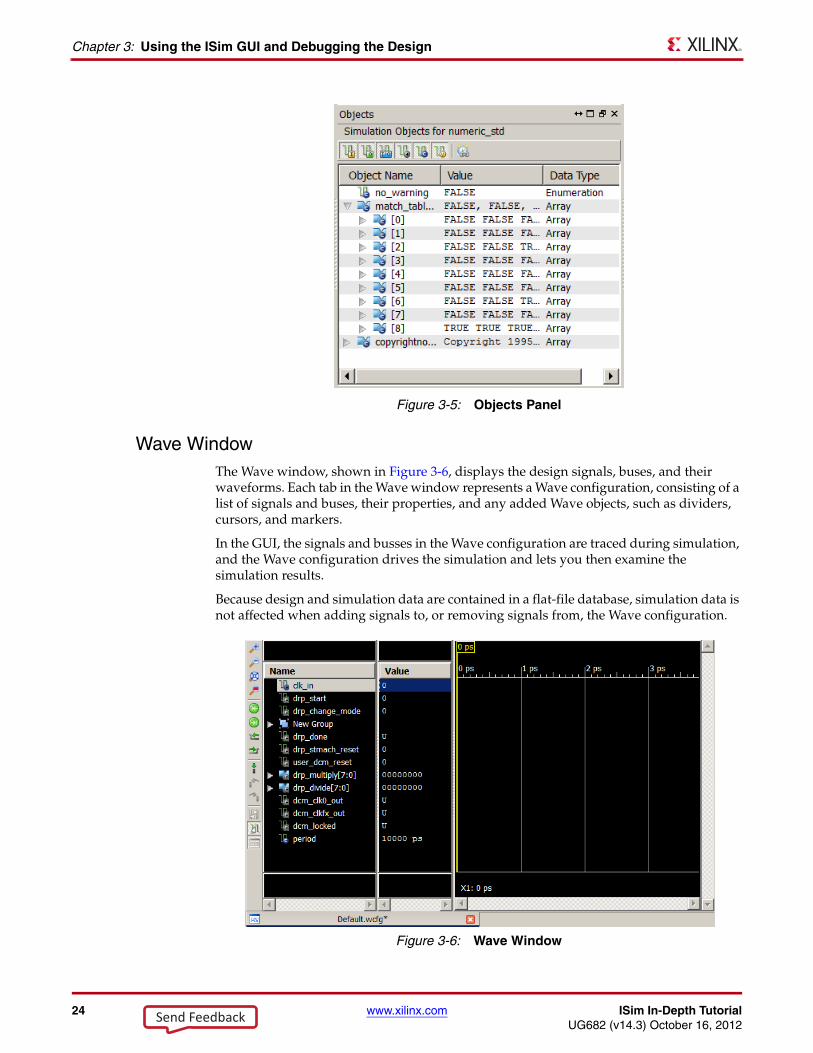
Objects Panel The Objects panel displays the ports and signals associated with the selected instances and processes in the Instances and Processes panel.
The top of the panel displays which instance or process is selected in the Instances and Processes panel; those objects and their values are listed in the Objects panel.
The table columns are defined as follows:
• Object Name: Displays the name of the signal, accompanied by the symbol which represents the type of object it is.
• Value: The value of the signals at the simulation time or at the main cursor, as determined by the Sync Time toolbar button .
• Data Type: Displays the data type of the corresponding simulation object, logic, or array.
Figure 3-5, page 24, shows the Objects panel.
X-Ref Target - Figure 3-4
Figure 3-4: Source Files Panel
Send Feedback
24 www.xilinx.com ISim In-Depth TutorialUG682 (v14.3) October 16, 2012
Chapter 3: Using the ISim GUI and Debugging the Design
Wave WindowThe Wave window, shown in Figure 3-6, displays the design signals, buses, and their waveforms. Each tab in the Wave window represents a Wave configuration, consisting of a list of signals and buses, their properties, and any added Wave objects, such as dividers, cursors, and markers.
In the GUI, the signals and busses in the Wave configuration are traced during simulation, and the Wave configuration drives the simulation and lets you then examine the simulation results.
Because design and simulation data are contained in a flat-file database, simulation data is not affected when adding signals to, or removing signals from, the Wave configuration.
X-Ref Target - Figure 3-5
Figure 3-5: Objects Panel
X-Ref Target - Figure 3-6
Figure 3-6: Wave Window
Send Feedback

ISim In-Depth Tutorial www.xilinx.com 25UG682 (v14.3) October 16, 2012
Exploring the ISim GUI
Text Editor Panel The text editor panel, shown in Figure 3-7, provides access to the HDL source files used in the simulation. In the text editor, you can:
• Open HDL source files for viewing and editing
• Set breakpoints to source files for debugging
• Step through the source code
Breakpoints PanelThe Breakpoints panel, shown in Figure 3-8, displays a list of breakpoints that are set in the design. For each breakpoint set in your source files, the list in the Breakpoints panel identifies the file location, file name, and line number. You can delete a selection, delete all breakpoints, and go to the source code from the Breakpoint toolbar buttons or context menu.
For more information, see Chapter 4, “Debugging the Design,” in the ISim User Guide (UG660). A link to the document is available in Appendix A, Additional Resources.
X-Ref Target - Figure 3-7
Figure 3-7: Text Editor Panel
X-Ref Target - Figure 3-8
Figure 3-8: Breakpoints Panel
Send Feedback

26 www.xilinx.com ISim In-Depth TutorialUG682 (v14.3) October 16, 2012
Chapter 3: Using the ISim GUI and Debugging the Design
Console PanelThe Console panel, shown in Figure 3-9, lets you view a log of messages generated by ISim, and is where you can enter standard Tcl and ISim-specific commands at the command prompt.
Examine and Debug the DesignIn this section, you look at the functional behavior of the tutorial design, which includes:
• Running and restarting the simulation to review the design functionality, using signals in the Wave window and messages from the test bench shown in the Console panel.
• Adding signals from the test bench and other design units to the Wave window so their status can be monitored.
• Adding groups and dividers to better identify signals in the Wave window.
• Changing signal and Wave properties to better interpret and review the signals in the Wave page.
• Using markers and cursors to highlight key events in the simulation and to perform zoom and time measurement features.
• Using multiple Wave configurations to enhance your ability to review multiple signals in one simulation session.
Add SignalsNote: Skip this step if you completed Chapter 2, Running ISim. All visible simulation objects from the test bench were added to the Wave page.
Prior to running simulation for a specified time, you must add signals to the Wave window to observe the signal status.
You add the available simulation objects from the test bench to the Wave window, which include:
• Input Clock (clk_in): This is a 100 MHz clock generated by the test bench and is the input clock into the Digital Clock Manager (DCM).
• Dynamic Reconfiguration Ports (DRP) (drp_*): These are signals associated with the DCM DRP feature. The test bench asserts and monitors these signals to control and review the DCM DRP functionality.
• DCM Output signals (dcm_*): These are output clocks from the DCM.
X-Ref Target - Figure 3-9
Figure 3-9: Console Panel
Send Feedback
ISim In-Depth Tutorial www.xilinx.com 27UG682 (v14.3) October 16, 2012
Examine and Debug the Design
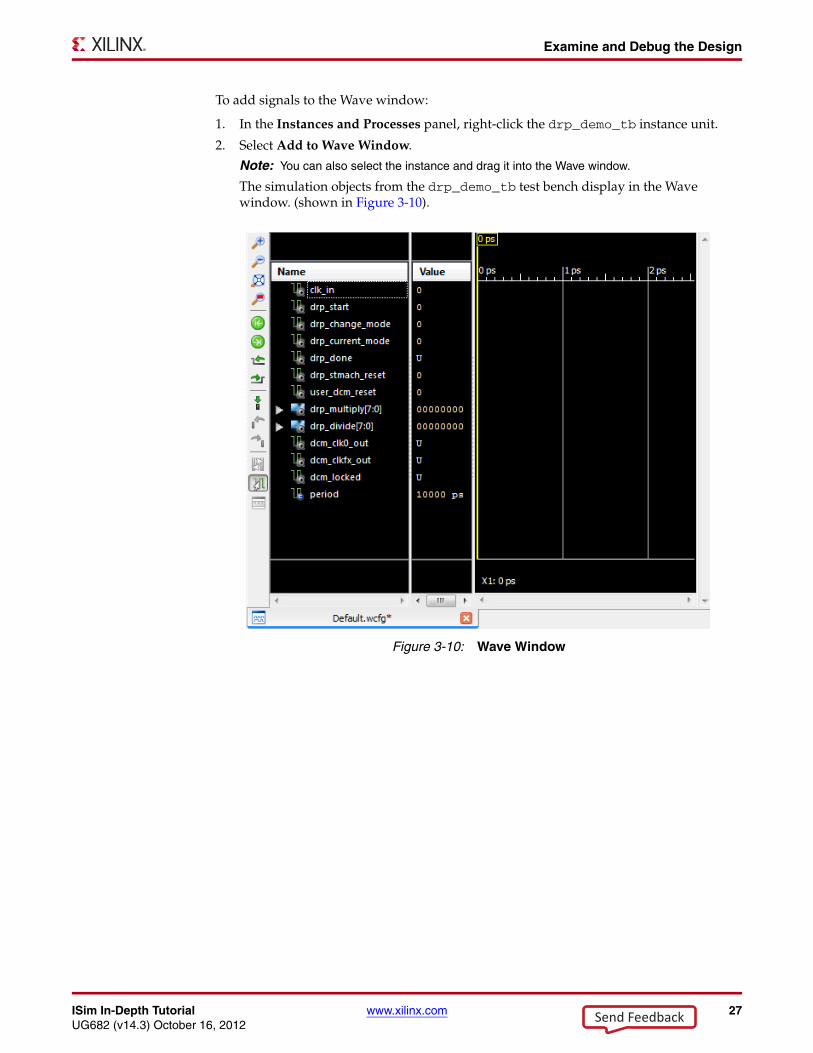
To add signals to the Wave window:
1. In the Instances and Processes panel, right-click the drp_demo_tb instance unit.
2. Select Add to Wave Window.
Note: You can also select the instance and drag it into the Wave window.
The simulation objects from the drp_demo_tb test bench display in the Wave window. (shown in Figure 3-10).
X-Ref Target - Figure 3-10
Figure 3-10: Wave Window
Send Feedback

28 www.xilinx.com ISim In-Depth TutorialUG682 (v14.3) October 16, 2012
Chapter 3: Using the ISim GUI and Debugging the Design
Run the Simulation for a Specified TimeYou now run the simulator for a specified time (5 microseconds (μs)).
1. In the ISim menu toolbar, type 5 μs in the Simulation Time field and click the Run toolbar button. .
Note: You can also type run 5 μs at the Tcl prompt and press Enter.
The Wave window now shows traces of the signals up to 5 microseconds in simulation time (see Figure 3-11).
2. To display the full time spectrum in the Wave window, select View > Zoom > To Full View or click the Zoom Full View button.
You can use the horizontal and vertical scroll bars to view the full Wave configuration.
There are assertions from the test bench during the time of simulation.
3. Review the Console panel for messages from the test bench (see Figure 3-12)..
Observe that Test 2 failed, as designed. You have an opportunity to fix the issue later in the tutorial.
X-Ref Target - Figure 3-11
Figure 3-11: Wave Window
X-Ref Target - Figure 3-12
Figure 3-12: Console Panel
Send Feedback

ISim In-Depth Tutorial www.xilinx.com 29UG682 (v14.3) October 16, 2012
Examine and Debug the Design
Restart the SimulationNext, you restart the simulation by clicking the Restart button.
The restart clears the Wave window and sets the simulation time to 0 picoseconds (ps).
Note: You can also restart the simulation by typing restart at the Tcl prompt.
The Wave window opens, as shown in Figure 3-13.
In the next section, you analyze the simulation of the tutorial design in more detail using features from the Wave window, such as dividers, groups, cursors, and markers.
Add GroupsIn the next steps, you add signals from other design units to better analyze the functionality of this design.
When you add additional signals to the Wave window, the size of the Wave window is not large enough to display all signals in the same view. Reviewing all signals would require the use of the vertical scroll bar in the Wave window repeatedly, making the review process tedious.
To enable better viewing, you can collect signals into a Group. With a group, you can collectively show or hide signals of similar purpose.
To group signals in the Wave configuration:
1. In the Wave window, click and hold the Ctrl key, and select all signals in the drp_demo_tb design unit that start with drp_.
2. With the signals selected, right-click and select New Group.
Alternatively, you can select the signals and drag them into the Wave window.
3. Type a name for the new group. For this example, name the group DRP Test Signals.
ISim creates a collapsed group in the Wave window.
4. To expand the group, click once to the left of the group name.
X-Ref Target - Figure 3-13
Figure 3-13: Wave Window
Send Feedback

30 www.xilinx.com ISim In-Depth TutorialUG682 (v14.3) October 16, 2012
Chapter 3: Using the ISim GUI and Debugging the Design
5. Make a group for all signals in the drp_demo_tb design unit that start with dcm_.
6. Name this group DCM Test Signals.
7. Expand the created groups.
Your Wave window should be similar to Figure 3-14.
If your signal groups do not match what is shown in Figure 3-14, you can do the following to fix them:
• If you included an unrelated signal, use cut and paste to move it into the main list.
• If you created the group but missed a signal in the main list, drag and drop the signal into the group.
• You can undo the group using the Edit > Undo menu command.
• You can start over by ungrouping; right-click and select Ungroup.
X-Ref Target - Figure 3-14=
Figure 3-14: Adding Groups
Send Feedback

ISim In-Depth Tutorial www.xilinx.com 31UG682 (v14.3) October 16, 2012
Examine and Debug the Design
Add DividersTo better visualize which signals belong to which design units, add dividers to separate the signals by design unit.
To add dividers to the Wave window, right-click anywhere on the Wave window, select New Divider, then enter a name.
1. Add three dividers named:
• TESTBENCH
• DCM
• DRP CONTROLLER
2. Click and drag the TESTBENCH divider to the top of the list.
3. Move the other dividers to the bottom of the list.
Note: Divider names can be changed at any time by double-clicking the divider name or pressing the F2 function key, and entering a new name.
Your Wave window should be similar to the one shown in Figure 3-15.X-Ref Target - Figure 3-15
Figure 3-15: Adding Dividers
Send Feedback

32 www.xilinx.com ISim In-Depth TutorialUG682 (v14.3) October 16, 2012
Chapter 3: Using the ISim GUI and Debugging the Design
Add Signals from SubmodulesIn this section you add lower-level module signals from the instantiated DCM module (Inst_drp_dcm) and the instantiated DRP controller module (Inst_drp_stmach) to study the interactions between these submodules and the test bench test signals. The easiest way to add signal to a group is to filter and then select the signals.
To add the necessary signals:
1. Select the Instances and Processes panel, and in the panel, expand the hierarchy under drp_demo_tb as shown in Figure 3-16.
2. Click the Inst_drp_dcm entity.
Simulation objects associated with the currently highlighted design unit display in the Objects panel (see Figure 3-17).
X-Ref Target - Figure 3-16
Figure 3-16: Instances and Processes Panel
X-Ref Target - Figure 3-17
Figure 3-17: Objects Panel
Send Feedback

ISim In-Depth Tutorial www.xilinx.com 33UG682 (v14.3) October 16, 2012
Examine and Debug the Design
By default, all types of simulation objects (such as variables, and constants) display in the Objects panel. The types of objects are shown in Figure 3-18, page 33.
You can filter the type of simulation objects shown in this panel. Use the Objects panel toolbar to filter by inputs, outputs, bi-directional, internal, constants, and variables.
3. Toggle the object types by clicking the corresponding button, shown in Figure 3-19.
4. With the Inst_drp_dcm design unit in the Instance and Processes panel selected, select input and output ports and internal signals in the Object panel toolbar.
5. In the Objects panel, select all the displayed objects by type, then drag and drop them into the Wave window, under the DCM divider.
Note: You can also add these signals to the Wave window using the wave add Tcl command at the ISim Tcl prompt. For example:
wave add /drp_demo_tb/uut/inst_drp_dcm
6. Add the input and output ports and the internal signals of Inst_drp_stmach instantiated design unit below the DRP CONTROLLER divider.
7. Create groups for the signals you added. Define the groups as Inputs, Outputs, and Internal for each set of signals.
X-Ref Target - Figure 3-18
Figure 3-18: Signals and Icons
X-Ref Target - Figure 3-19
Figure 3-19: Objects Panel Toolbar Buttons
Send Feedback

34 www.xilinx.com ISim In-Depth TutorialUG682 (v14.3) October 16, 2012
Chapter 3: Using the ISim GUI and Debugging the Design
Your Wave window should look like Figure 3-20 (with groups collapsed).
Change Signal and Wave Window PropertiesNext, you change the properties of some of the signals shown in the Wave window to better visualize the simulation.
Change the Signal Name Format
By default, ISim adds signals to the Waveform using a short name with the hierarchy reference removed. For some signals, it is important to know to which module they belong.
To change the signal name format for the drp_multiply and drp_divide bus signals:
1. In the Wave window, Ctrl-click to select the drp_multiply and drp_divide signals listed in the DRP Test Signals group.
2. Right-click and select Name > Long.
The name format changes from Short to Long.
Change the Signal Radix Format
Some signals are better interpreted if seen in hexadecimal rather than in binary. For example, the signals drp_multiply and drp_divide are bus signals that are best interpreted in hexadecimal format, rather than binary.
To change the radix options for these signals:
1. In the Wave window, select the drp_demo_tb/drp_multiply and drp_demo_tb/drp_divide signals.
2. Right-click and select Radix > Hexadecimal.
X-Ref Target - Figure 3-20
Figure 3-20: Configuring the Wave Window
Send Feedback

ISim In-Depth Tutorial www.xilinx.com 35UG682 (v14.3) October 16, 2012
Examine and Debug the Design
Change the Signal Color
ISim lets you change the signal color in the Wave window to help distinguish similar signals from each other.
To change the color of the drp_multiply and drp_divide signals.
1. In the Wave window, right-click a signal name in the Name column.
2. Select Signal Color, and pick a color from the color palette or a custom color by clicking the Browse button, (see Figure 3-21).
Note: You can also use the Divider Color option to change the color of the dividers you created in the Wave window.
Float the Wave Window Depending upon your screen resolution, you might notice that the Wave window is populated with more signals than the interface can show at one time. To increase the viewable area, you can float the Wave window. This opens a new window with just the Waveform contents.
To float a window, click the Float Window button on the main toolbar.
You are done making modifications to the Wave window. The Wave window should look similar to Figure 3-22 when test bench groups are expanded.
X-Ref Target - Figure 3-21
Figure 3-21: Changing the Signal Color
Send Feedback

36 www.xilinx.com ISim In-Depth TutorialUG682 (v14.3) October 16, 2012
Chapter 3: Using the ISim GUI and Debugging the Design
Save the Wave Window ConfigurationYou can save the current Wave Window configuration so it is available for use in future ISim simulation sessions of your design.
To save the Wave configuration:
1. Select File > Save As to assign a name to the current Wave configuration.
2. Save the current Wave configuration to the filename tutorial_1.wcfg.
The Wave configuration is now saved for future use.
Note: You can load the saved Wave window configuration using the menu command File > Open.
Re-Simulate the DesignYou are ready to simulate the design again with the updated Wave configuration. Click the Run All button to re-run the simulation.
Note: You can also re-run the simulation by typing run all at the Tcl prompt.
The simulation runs for about 13 microseconds.
After the simulation is complete, click the Zoom to Full View button to zoom to full view.
The Wave configuration should look similar to Figure 3-23.
X-Ref Target - Figure 3-22
Figure 3-22: Fully Configured Floating Wave Window
Send Feedback

ISim In-Depth Tutorial www.xilinx.com 37UG682 (v14.3) October 16, 2012
Re-Simulate the Design
Use MarkersThe self-checking test bench used in this design performs four different tests to show the functionality of the DCM Dynamic Reconfiguration feature.
To use markers to mark each time a new test starts:
1. In the Console panel, identify the simulation times when each test has started. For example, Test 1 starts at about 1,150 ns, as shown in Figure 3-24.
2. From the ISim menu, select Edit > Go To and enter 1150 ns in the Go To Time field to move the main (yellow) cursor to the first test bench test.
X-Ref Target - Figure 3-23
Figure 3-23: Wave Window After 13 us Simulation Time
X-Ref Target - Figure 3-24
Figure 3-24: Console Window
X-Ref Target - Figure 3-25
Figure 3-25: Go To Time Field
Send Feedback

38 www.xilinx.com ISim In-Depth TutorialUG682 (v14.3) October 16, 2012
Chapter 3: Using the ISim GUI and Debugging the Design
3. Click the Add Marker toolbar button.
Note: Although you typed the time in nanoseconds, the Wave window displays the time unit in microseconds. You could have also typed the measurement in picoseconds. You can use whichever measurement you prefer, and the Wave window will adjust accordingly.
4. Search in the Console for the four tests performed by the test bench, and add a marker for each test start. The Wave window should look similar to Figure 3-26.
X-Ref Target - Figure 3-26
Figure 3-26: Using Markers to Identify Start of Tests
Send Feedback

ISim In-Depth Tutorial www.xilinx.com 39UG682 (v14.3) October 16, 2012
Re-Simulate the Design
Use CursorsThe Console Panel reports that Test 2 and Test 4 failed, as shown in Figure 3-27.
In Test 2 and Test 4, a Dynamic Reconfiguration (DRP) write cycle is performed to change the multiply and divide factors of the Digital Frequency Synthesizer, and to set new clock output (CLKFX) frequencies (120 MHz and 400 MHz, respectively).
However, at the end of the DRP cycle, the test bench measured a period that did not match the expected period. Test 2 and Test 4 failed due to the period discrepancy. You can view the failure for Test 2 in Figure 3-28.
In the next steps, you use the ISim main cursor (yellow cursor) to zoom in the Wave window when one of the failing tests takes place. You also use the cursor to measure the period of signal dcm_clkfx_out and verify that the test bench is making accurate measurements.
X-Ref Target - Figure 3-27
Figure 3-27: Console Report: Tests 2 and 4 Failed
X-Ref Target - Figure 3-28
Figure 3-28: Test 2 Fails Due To Period Discrepancy
Send Feedback

40 www.xilinx.com ISim In-Depth TutorialUG682 (v14.3) October 16, 2012
Chapter 3: Using the ISim GUI and Debugging the Design
Zoom InIn the Wave window, zoom in to the start of Test 2 to review the status of output clock dcm_clkfx_out.
To use a cursor for zooming in on a specific area:
1. Place the cursor on the area by clicking and dragging the main (yellow) cursor close to the marker that represents the start of Test 2 (marker at time 3.461664 μs). The cursor snaps onto the marker.
Note: You can also click the Previous Marker and Next Marker toolbar buttons to quickly move the main cursor from marker to marker.
2. Zoom in using the Zoom In button .
The Wave window zooms in around the area specified by the cursor.
3. Repeat step 2 until you can clearly see the rising and falling edges of DCM test signals dcm_clk0_out and dcm_clkfx_out (see Figure 3-29).
Measure TimeYou can use your mouse cursor to measure time between two endpoints. You use this feature to confirm the test bench calculations reported in the Console during Test 2 by measuring the period of dcm_clkfx_out after the DRP cycle has completed (signal drp_done is asserted).
To measure time using cursors:
1. Use the Snap to Transition toggle button to snap the cursor to transition edges.
2. Click and hold in an area around the first clock rising edge following DRP cycle completion (drp_done signal asserted). The main cursor snaps to the rising edge of dcm_clkfx_out.
X-Ref Target - Figure 3-29
Figure 3-29: Viewing dcm_clk0_out and dcm_clkfx_out
Send Feedback

ISim In-Depth Tutorial www.xilinx.com 41UG682 (v14.3) October 16, 2012
Re-Simulate the Design
3. While holding the button, move the mouse over to the next clock rising edge.
A second marker appears.
The time between the two defined endpoints shows at the bottom of the Wave window as a time delta (see Figure 3-30).
The cursors show that a measured time difference of 7,142 ps is between two rising edges of the dcm_clkfx_out output clock. This translates to a 140 MHz clock signal. Test 2 fails due to the frequency discrepancy (expected is 120 MHz).
4. Analyze the Test 4 failure using the same steps. You can observe that while the test bench expects a frequency of 400 MHz, the actual frequency measured is 300 MHz.
Note: You can use the Floating Ruler feature (available from the Wave window toolbar) to display a hovering ruler over the Wave configuration. This feature is available when performing a time measurement using cursors between two endpoints. The zero (0 ps) on the ruler is placed at the first time endpoint. This feature is useful when making multiple time measurements with respect to the first endpoint.
Use Multiple Wave ConfigurationsDepending on the resolution of the screen, a single Wave window might not display all the signals of interest at the same time. You can open multiple Wave windows, each with their own set of signals and signal properties.
To open a new Wave window:
1. In ISim, select File > New.
2. In the New dialog box, select Wave Configuration, and click OK.
A blank Wave configuration opens.
You can move dividers, groups, and simulation objects to the new Wave configuration.
X-Ref Target - Figure 3-30
Figure 3-30: Measuring Time in the Wave Window
Send Feedback

42 www.xilinx.com ISim In-Depth TutorialUG682 (v14.3) October 16, 2012
Chapter 3: Using the ISim GUI and Debugging the Design
To move the simulation objects associated with the DCM and DRP Controller units to a new Wave window:
1. Press and hold the Ctrl key, and highlight objects (dividers, groups, and so on) you want to move to the new Wave window.
2. Right-click any selected signals, and select Cut.
Note: Although you are moving signals from one Wave Configuration to another for this tutorial, you can also use the Copy command to copy the signals so that they remain in both windows.
You could also select the signals and drag them to the new Wave configuration window.
3. Click the window panel for the new Wave configuration.
4. Right-click in the Name column area of the Wave configuration, and select Paste.
5. Select File > Save As to save this Wave configuration as tutorial_2.wcfg.
You should now have two Wave windows that look similar to Figure 3-31 and Figure 3-32, page 43.
X-Ref Target - Figure 3-31
Figure 3-31: tutorial_1.wcfg
Send Feedback

ISim In-Depth Tutorial www.xilinx.com 43UG682 (v14.3) October 16, 2012
Debug the Design
Debug the DesignYou examined the design using markers, cursors, and multiple Wave configurations.
Now, use ISim debugging features, such as setting breakpoints and stepping through source code, to debug the design and address the two failing DRP tests.
View Source CodeFirst, look at the test bench for the tutorial design and learn how each test is performed.
Do one of the following to open the source code for the tutorial design test bench (drp_demo_tb.vhd). The source file opens using the integrated text editor (See Figure 3-33, page 44).
• Select File > Open to point to the file of choice.
• In the Instances and Processes panel, right-click on the design unit described by the source file of interest, then select Go to Source Code.
• In the Objects panel, right-click on any of the simulation objects declared in the source file of choice, then select Go to Source Code.
• In the Source Files panel (viewable by clicking the Source Files panel), double-click a source file.
X-Ref Target - Figure 3-32
Figure 3-32: tutorial_2.wcfg
Send Feedback

44 www.xilinx.com ISim In-Depth TutorialUG682 (v14.3) October 16, 2012
Chapter 3: Using the ISim GUI and Debugging the Design
Use Breakpoints and SteppingA breakpoint is a user-determined stopping point in the source code used for debugging the design. When simulating a design with set breakpoints, simulation of the design stops at each breakpoint to verify the design behavior. After the simulation stops, an indicator shows in the text editor next to the line of source code where the breakpoint was set, so you can compare the Wave window results with a particular event in the source code.
Another useful ISim debugging tool is the Stepping feature. With stepping, you can run the simulator one simulation unit at the time. This is helpful if you are interested in learning how each line of your source code affects the results in simulation.
You next use both of these debugging features to learn how the DRP cycle is performed during Test 2 to debug the failing test.
Set Breakpoints
Begin by setting a breakpoint around the first signal assignment performed during each of the DRP cycle tests.
To set a breakpoint at line 185 in drp_demo_tb.vhd:
1. Open the source code in which you want to add the breakpoint.
2. Go to an executable line in the source code.
X-Ref Target - Figure 3-33
Figure 3-33: Integrated Text Editor
Send Feedback
ISim In-Depth Tutorial www.xilinx.com 45UG682 (v14.3) October 16, 2012
Debug the Design
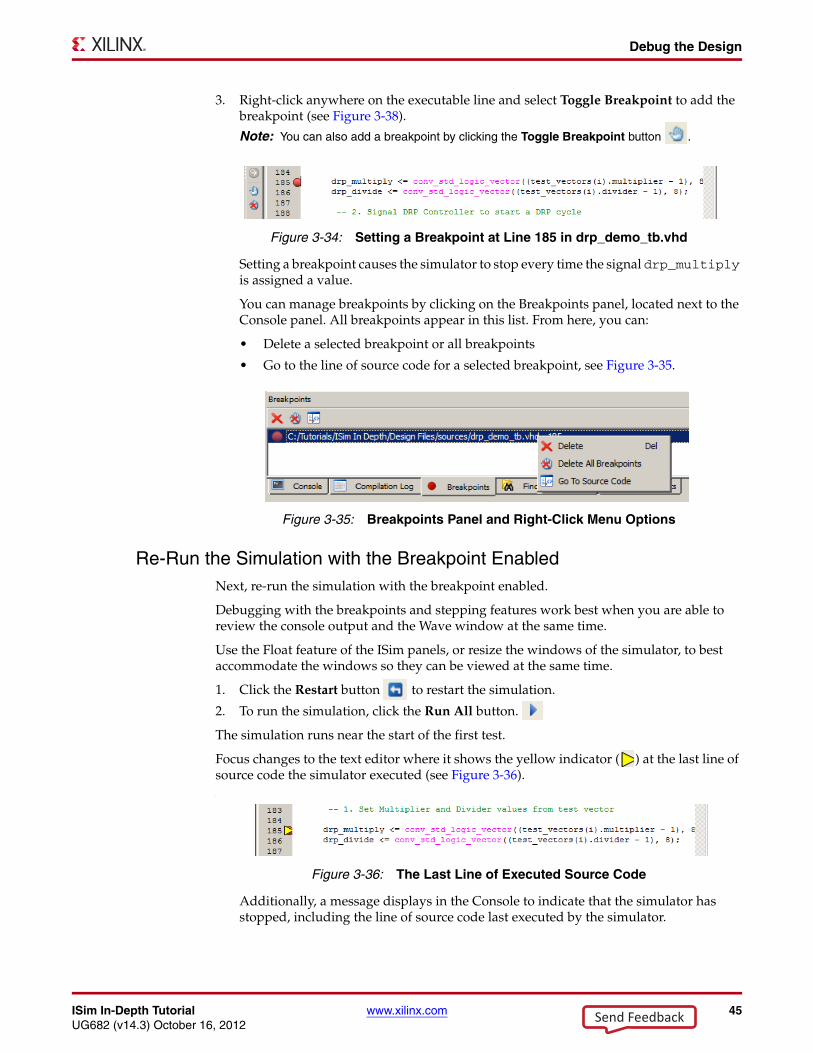
3. Right-click anywhere on the executable line and select Toggle Breakpoint to add the breakpoint (see Figure 3-38).
Note: You can also add a breakpoint by clicking the Toggle Breakpoint button .
Setting a breakpoint causes the simulator to stop every time the signal drp_multiply is assigned a value.
You can manage breakpoints by clicking on the Breakpoints panel, located next to the Console panel. All breakpoints appear in this list. From here, you can:
• Delete a selected breakpoint or all breakpoints
• Go to the line of source code for a selected breakpoint, see Figure 3-35.
Re-Run the Simulation with the Breakpoint EnabledNext, re-run the simulation with the breakpoint enabled.
Debugging with the breakpoints and stepping features work best when you are able to review the console output and the Wave window at the same time.
Use the Float feature of the ISim panels, or resize the windows of the simulator, to best accommodate the windows so they can be viewed at the same time.
1. Click the Restart button to restart the simulation.
2. To run the simulation, click the Run All button.
The simulation runs near the start of the first test.
Focus changes to the text editor where it shows the yellow indicator ( ) at the last line of source code the simulator executed (see Figure 3-36). .
Additionally, a message displays in the Console to indicate that the simulator has stopped, including the line of source code last executed by the simulator.
X-Ref Target - Figure 3-34
Figure 3-34: Setting a Breakpoint at Line 185 in drp_demo_tb.vhd
X-Ref Target - Figure 3-35
Figure 3-35: Breakpoints Panel and Right-Click Menu Options
X-Ref Target - Figure 3-36
Figure 3-36: The Last Line of Executed Source Code
Send Feedback

46 www.xilinx.com ISim In-Depth TutorialUG682 (v14.3) October 16, 2012
Chapter 3: Using the ISim GUI and Debugging the Design
Test 1 finished successfully based on the earlier design examination. Skip debugging this test.
3. Continue to Test 2, and click the Run All button.
The simulation now stops at the start of Test 2, shown in Figure 3-37.
Step Through Source CodeYou first need to verify that in Test 2, the appropriate Multiplier and Divider parameters are being set correctly using the drp_multiply and drp_divide bus signals. Use Stepping to step through the source code line-by-line, and review how the drp_multiply and drp_divide bus signals are assigned to the DCM DRP ports.
To step through a simulation:
1. Click the Step toolbar button.
Note: You can also step through the simulation by typing step at the Tcl prompt.
2. Use this process to step through the design, paying attention to each of these events:
• drp_multiply and drp_divide bus signals are assigned values from a constant test_vectors.
• drp_start asserts to start a DRP cycle.
• drp_multiply bus signal is assigned to the 8 uppermost bits of bus signal DI_IN, while drp_divide bus signal is assigned to the 8 lowermost bits of the same bus.
• The DRP controller (drp_stmach.vhd) leaves idle mode and moves to the next DRP cycle step, clearing the DCM status registers.
3. In the tutorial_2 Wave window, expand the DCM Inputs bus.
4. Continue stepping through the simulation until the di_in bus signal is updated with a new value (you might need to zoom in to observe the change). At around 3,465 ns, the bus should be updated from 0203h to 0604h (see Figure 3-38).
X-Ref Target - Figure 3-37
Figure 3-37: Message in the Console Indicating That the Simulator Has Stopped
Send Feedback

ISim In-Depth Tutorial www.xilinx.com 47UG682 (v14.3) October 16, 2012
Debug the Design
Note: Change the radix of bus signal di_in to Hexadecimal to verify this value change.
The output clock frequency of this design (dcm_clkfx_out) depends upon the multiply and divide factors you provide. For Test 2, use the following parameters and expected output clock frequency:
Recall that for M=6 and D=5, di_in[15:0] bus value should be 0504h. Notice that the status of di_in in Test 2 is 0604h. Test 2 fails because an incorrect M/D factor is provided in the test bench drp_multiply and drp_divide signals.
5. Repeat the steps above to determine the cause of failure for Test 4. You can determine that the failure is also due to incorrect assignments of the multiply and divide signals in the test bench.
X-Ref Target - Figure 3-38
Figure 3-38: Wave Window: Analyzing Output of DCM DI_IN Input Bus
Table 3-1: Parameters and Expected Output Clock Frequency
Test Freq. (MHz) Period (ps) Multiplier (M) Divider (D)
2 120 8,332 6 5
Send Feedback

48 www.xilinx.com ISim In-Depth TutorialUG682 (v14.3) October 16, 2012
Chapter 3: Using the ISim GUI and Debugging the Design
Fix Design BugsBy using breakpoints and stepping, you have determined that the incorrect multiply and divide values are assigned to the test bench drp_multiply and drp_divide signals.
In the next steps, revise the test bench test vectors to use the correct Multiplier and Divider parameters in Test 2 and Test 4.
1. In the ISim main menu, click the Source Files panel.
2. Right-click the drp_demo_tb.vhd file, and select Go To Source Code.
3. In lines 117 through 127, the test vectors for the four DRP tests are defined. Revise the constant declaration to the following displayed values (changes are highlighted in bold).
------------------------------------------------ -- ** TEST VECTORS ** -- (Test, Frequency, Period, Multiplier, Divider) ------------------------------------------------
constant test_vectors : vector_array := ( ( 1, 75, 13332 ps, 3, 4), ( 2, 120, 8332 ps, 6, 5), ( 3, 250, 4000 ps, 5, 2), ( 4, 400, 2500 ps, 4, 1));
4. Save the file.
Verify Bug FixNow that you have corrected the test bench source code, you re-compile the source code and build a new simulation executable.
1. Click the Breakpoints panel and remove the previously-set breakpoint.
2. Click the Re-launch button to re-launch ISim.
ISim recompiles the source files and reloads the simulation.
You are ready to simulate the design again with the updated test bench.
3. Click the Run All button to re-run the simulation.
Note: You can also re-run the simulation by typing run all at the Tcl prompt.
If the test vectors in the test bench were properly revised, the simulation should run to completion, showing that all tests pass (see Figure 3-39).X-Ref Target - Figure 3-39
Figure 3-39: Console Showing That All Tests Pass
Send Feedback

ISim In-Depth Tutorial www.xilinx.com 49UG682 (v14.3) October 16, 2012
Conclusion
ConclusionThis completes the ISE® ISim in-depth tutorial. In this tutorial, you:
• Ran ISim from either Project Navigator or in Standalone mode.
• In Project Navigator, you:
- Created a project
- Added source files to the project
- Created a VHDL library and moved files into the library
- Compiled the design within the project
- Launched Behavioral simulation after setting the properties for that simulation
- Reviewed the ISim GUI
- Debugged the design
- Verified the bug fix
• In the ISim Standalone, described in Chapter 4, Running ISim Standalone, you can do all the same steps using the command line mode.
See Appendix A, Additional Resources for links to more detailed information about ISim.
Send Feedback

50 www.xilinx.com ISim In-Depth TutorialUG682 (v14.3) October 16, 2012
Chapter 3: Using the ISim GUI and Debugging the Design
Send Feedback

ISim In-Depth Tutorial www.xilinx.com 51UG682 (v14.3) October 16, 2012
Chapter 4
Running ISim Standalone
You can use the ISim standalone flow to simulate your design without setting up a project in ISE® Project Navigator. In this flow, you:
• Prepare the simulation project by manually creating an ISim project file to create a simulation executable using the fuse command.
• Start the ISim Graphical User Interface (GUI) by running the simulation executable generated by the fuse command.
Getting StartedThe tool requirements and location of tutorial design files are described in Chapter 1, Tool Requirements, and Chapter 1, Installing Tutorial Design Files.
Prepare the SimulationThe ISim standalone flow lets you simulate your design without setting up a project in ISE Project Navigator. In this flow, you manually create an ISim project file that the fuse command uses to create a simulation executable. Following completion of this step, you can launch the ISim GUI by running the simulation executable.
Manually Create an ISim Project FileThe typical syntax for an ISim project file is as follows:
verilog|vhdl <library_name> {<file_name_1>.v|.vhd}
where:
• verilog|vhdl indicates that the source is a Verilog or VHDL file. Include either Verilog or VHDL source files.
• <library_name> indicates with which library a particular source on the given line to be compiled. The /work is the default library.
• <file_name> is the source file or files associated with the library.
Note: While one or more Verilog source files can be specified on a given line, only one VHDL source can be specified on a given line.
To build an ISim project file for the tutorial design:
1. Browse to the script folder.
2. Open the simulate_isim.prj project file with a text editor.
The project file is incomplete.
Send Feedback
52 www.xilinx.com ISim In-Depth TutorialUG682 (v14.3) October 16, 2012
Chapter 4: Running ISim Standalone
3. List the missing sources using the syntax guidelines.
Missing sources:
• drp_dcm.vhd: VHDL source file. It must be compiled with the /work library.
• drp_tb_pkg.vhd: VHDL package file. It must be compiled with the /drp_tb_lib library.
Note: You do not need to list the sources based on their order of dependency. The fuse command automatically resolves the order of dependencies and processes the files in the appropriate order.
You can browse to the /completed folder of the tutorial files for a completed version of the project file for comparison.
4. Save and close the file.
Build the Simulation ExecutableIn this simulation step, the fuse command uses the project file created in the previous section to parse, compile, and link all the sources for the design. This creates a simulation executable that lets you to run the simulation in the ISim GUI.
Use the fuse Command The typical fuse syntax is as follows:
fuse –incremental –prj <project file> -o <simulation executable> <library.top_unit>
where:
• -incremental: requests fuse to compile only the files that have changed since the last compile
• -prj: specifies an ISim project file to use for input
• -o: specifies the name of the simulation executable output file
• <library.top_unit>: specifies the top design unit
Complete the following steps to parse, compile and elaborate the tutorial design using fuse:
1. Browse to the /scripts folder from the downloaded files.
2. Open the fuse_batch.batfile using a text editor.
3. This fuse command is incomplete. Using the syntax information provided above, edit the command line so it includes the following options:
a. Use incremental compilation.
b. Use simulate_isim.prj as the project file.
c. Use simulate_isim.exe as the simulation executable.
d. Use work.drp_demo_tb as the top design unit for simulation.
4. Save and close the batch file.
5. Using the ISE Command prompt, navigate to the /scripts folder and run the fuse_batch.bat file to run fuse.
Note: To open the ISE Command prompt, go to Start > Programs > Xilinx ISE Design Suite > Accessories and click the ISE Design Suite Command Prompt item.
Send Feedback

ISim In-Depth Tutorial www.xilinx.com 53UG682 (v14.3) October 16, 2012
Result
After the fuse command completes compiling source code, elaborating design units, and linking the object code, a simulation executable (simulate_isim.exe) is available in the /scripts folder.
Browse to the /completed folder to see the completed version of the fuse batch file for comparison.
Manually Simulate the Design In this simulation step you launch the ISim GUI by running the simulation executable which was generated by the fuse command in the previous section, Build the Simulation Executable, page 52. After this step is complete, you will be able to use the ISim GUI to explore the design in more detail.
Run the Simulation Executable
The command syntax when launching the simulation executable is:
isim_exe –gui –view <wave_configuration_file> -wdb <waveform_database_file>
where:
• -gui: Launches ISim in GUI mode.
• -view: Opens the specified Waveform file in the ISim GUI.
• -wdb: Specifies the file name of the simulation database output file.
Launch SimulationTo launch the simulation:
1. Browse to the /scripts folder from the downloaded files.
2. Open the simulate_isim.bat file using a text editor. The batch file is intentionally blank.
3. Using the syntax information provided above, edit the batch file so it includes the following settings:
a. Simulation Executable name: simulate_isim.exe.
b. Launch in GUI mode.
c. Set simulation database output name to simulate_isim.wdb.
Note: A Wave configuration file is not provided in the tutorial files. This file is created during simulation.
4. Save and close the file.
5. Using the ISE Command prompt, navigate to and run the simulate_isim.bat file to run the simulator.
ResultThe ISim GUI opens and loads the design. The simulator time remains at 0 ns until you specify a run time.
For comparison purposes, you can browse to the /completed folder for a completed version of the simulate_isim.bat batch file.
Send Feedback

54 www.xilinx.com ISim In-Depth TutorialUG682 (v14.3) October 16, 2012
Chapter 4: Running ISim Standalone
Send Feedback
ISim In-Depth Tutorial www.xilinx.com 55UG682 (v14.3) October 16, 2012
Appendix A
Additional Resources
Xilinx Resources This appendix provides links to Xilinx® documents referenced in this document:
• Xilinx Design Tools: Installation and Licensing Guide (UG798): http://www.xilinx.com/support/documentation/sw_manuals/xilinx14_3/iil.pdf
• Xilinx Design Tool Release Notes Guide (UG631): http://www.xilinx.com/support/documentation/sw_manuals/xilinx14_3/irn.pdf
• Xilinx Glossary: http://www.xilinx.com/support/documentation/sw_manuals/glossary
• Xilinx Documentation and Support: http://www.xilinx.com/support.htm
• ISE® Documents:http://www.xilinx.com/support/documentation/dt_ise14-2.htm
• Virtex-5 FPGA Users Guide, (UG190):http://www.xilinx.com/support/documentation/user_guides/ug190.pdf
• Writing Effective Testbenches, (XAPP199): http://www.xilinx.com/support/documentation/application_notes/xapp199.pdf
• ISim User Guide (UG660): http://www.xilinx.com/support/documentation/sw_manuals/xilinx14_3/plugin_ism.pdf
Tutorials Page - To find the ug682.zip design files and other ISE® Design Suite and the ISim Hardware Co-Simulation tutorial, see the Xilinx website:http://www.xilinx.com/support/documentation/dt_ise14-3_tutorials.htm
Send Feedback

56 www.xilinx.com ISim In-Depth TutorialUG682 (v14.3) October 16, 2012
Appendix A: Additional Resources
Send Feedback