island studies journal, vol. 9, no. 2, 2014, pp. 293-306 accessibility
TRANSCRIPT
Island Studies Journal, Vol. 9, No. 2, 2014, pp. 293-306
Accessibility of islands: towards a new geography based on transportation modes and choices Sofia Karampela University of the Aegean Mytilini, Greece [email protected]
Thanasis Kizos University of the Aegean Mytilini, Greece [email protected]
&
Ioannis Spilanis University of the Aegean Mytilini, Greece [email protected]
ABSTRACT: Accessibility is a multifaceted concept that expresses the case of access between two points in space. For islands, accessibility is a key quality, since isolation and small size considered as inherent characteristics of “islandness”. In this paper, we discuss differences between geographical distance and accessibility potential in the Greek Aegean, combining different transportation modal choice (ferries and airplanes) with the use of an accessibility index that incorporates modes and frequency of connection and data of actual usage. The findings indicate that geographical distance is not determining accessibility and new geographies emerge based more on the availability of transport modal choices.
Keywords: accessibility; Aegean islands; Greece; index; transportation; modal choice
© 2014 – Institute of Island Studies, University of Prince Edward Island, Canada.
Introduction
Accessibility is a concept used in a number of scientific fields such as transportation planning, urban planning and geography; it plays an important role in policy making (Geurs & van Wee, 2004, p. 127). It has been applied to transportation planning studies since the 1950s when it was defined as the ease of reaching desirable destinations. The work by Hansen (1959, pp. 73-76) represented one of the first efforts by planners to develop measures that linked land use and activity systems with the transportation networks that serve them. Improving accessibility has recently re-emerged as a central aim of urban planners and aligned disciplines (Iacono, Krizek & El-Geneidy, 2010, p. 133). In addition, many studies limit their focus on access to employment (van Wee, Hagoort & Annema, 2001, p. 199).
Accessibility is the main output of a transport system. It determines the locational advantage of an area relative to others (ESPON, 2013). Indicators of accessibility measure the
S. Karampela, T. Kizos & I. Spilanis
294
benefits of households and firms in an area from the existence and use of the transport infrastructure relevant for their area. In general terms, accessibility is a construct of two functions, one representing the activities or opportunities to be reached and the other representing the effort, time, distance or cost needed to reach them.
The concept of accessibility has been developed, and cast into measurable indicators, in parallel with the concept of mobility (Curtis & Scheurer, 2010, p. 56). While mobility is concerned with the performance of transport systems, accessibility adds the interplay of transport systems and land use patterns as a further layer of analysis. Litman (2003) points out that traffic and mobility planning have traditionally been concerned primarily with the movement of motor vehicles (traffic) or people and goods in general (mobility). Accessibility is a multifaceted concept, not readily packaged into a one-size-fits-all indicator or index. In Litman’s (2003, p. 16) words, “there is no single way to measure transportation performance that is both convenient and comprehensive”. However, Geurs and van Wee (2004) produced a checklist of recommendations of how any accessibility measure should behave, regardless of its perspective (Curtis & Scheurer, 2010, p. 57).
Van Wee, Hagoort & Annema (2001, p. 200) categorize definitions, measures and applications we found in the literature into three clusters: infrastructure related, activities related and mixed measures. Infrastructure-related definitions and applications focus on the characteristics of infrastructure and sometimes also on its use: for example, speeds on motorways, the road network in general or travel times by train, total length of the road or railroad, or the density of these networks in an area (e.g. motorway kilometres per square kilometre). Some of these definitions, measures and applications are only related to the infrastructure supply, others also include demand factors (van Wee, Geurs & Chorus, 2013, p. 5). Another cluster of definitions, measures and applications is related to activities, such as living, working, recreating and shopping. They focus on the number of activities reachable within certain travel times or distances, e.g. the number of jobs reachable from a zone within 45 min by car. The last cluster is the mixed cluster, related to both activities and infrastructure. Most of the definitions, measures and applications of accessibility included aspects related to (1) travel costs, not only monetary costs, but also travel time, risks, comfort and other quality characteristics; (2) volume aspects, such as number of people, jobs, shops etc. and (3) location aspects e.g. is accessibility considered from only one place to other places or from several places to other places (van Wee et al., 2001, p. 200)?
Accessibility, in the context of this article, is a general term used to describe the ease by which a target location can be reached by a specific group of people. Distance is an important component for determining accessibility, but it ‘clearly involves much more than geometry (Yoshida & Deichmann, 2009, p. 3). How to measure distance is an important factor defining the accessibility index. The distance to a facility can be measured by a straight line between the origin and the destination or as the travel time along the existing transport network. Needless to say, the selection of target sites is also a critical factor in defining an accessibility index.
Farrington (2007, p. 320) formulates a “new narrative of accessibility” echoing Moseley’s conceptualization of accessibility as “the degree to which something is “get-at-able” and as an idea much more far-reaching than that of mobility or transport per se”.
Island access: a new geography based on transportation modes and choices
295
Islands as special cases Islands are considered as special cases of accessibility. Small size and isolation are key factors in considering island accessibility. If in continental areas, private transport, at least in theory, can cover for the absence of public transportation, the geographical discontinuity of space on islands makes this alternative unavailable. The fact that most European islands are located in the geographical periphery of Europe results in low levels of accessibility, especially for smaller ones that do not or cannot have an air service, and so can only be accessed by sea (Baldacchino, 2007; Spilanis, Kizos & Petsioti, 2012, p. 201). Islandness is not only about “boundedness” but also about “connectedness”. All island habitats depend on links with the world outside (Baldacchino, 2004, p. 133). Short and Kim (1999) assess the “connectedness” of cities by incorporating several measures of global air traffic, including the number of airline passengers, the volume of air freight, and the number of connecting air routes (Zook & Stanley, 2006, p. 474). Connectedness issues on a small island and within its communities not only concern the level of established linkages but also relate to the extent of accessibility and communications under the constraints of scale economies, micro-climate, and spatial reach of networks (Mehmood, 2009, p. 5).
The largely a-spatial approach that most measures of accessibility employ is one of the reasons for considering islands as different from larger scale, urban, transportation infrastructure. Another reason is that in most of these measures the frequency of the actual public transportation is not considered at all and accessibility is calculated as if all transportation is available any time of any day of the week (Farrington, 2007), a fact that simply is not true for islands (CPMR, 2002). For islands, if a service is not provided on the island, the cost and the time required to access it is disproportionably high compared to that on the mainland (Spilanis et al., 2012, p. 201).
A typical and characteristic example is the multimodal accessibility index (MAI) that is used to calculate the accessibility of towns of the EU from a perceived European center (ESPON, 2006; Spilanis, 2012, p. 126). The approach relies much on accessibility by air (90%) and does not consider discontinuities of space. Therefore, island related realities such as the additional time and cost needed to get to an island by ferry or airplane, or the fact that islands do not have railway networks are not taken into account (Spilanis, Kizos, Vaitis & Koukourouvli, 2013; 2012).
Previous approaches for the islands have been applied in consideration of these issues at European level (EURISLES, 1998; CPMR, 2002) and at Greek territory, using the concept of virtual distance in kilometers (taking into account the frequency of weekly ferry routes, travel speed of ferries, real travel time and waiting time in ports, Spilanis, Spiridonidis, & Misailidis, 2002; Spilanis, Kizos, Kondili & Misailidis, 2005; Spilanis, 2012; ESPON, 2011; Kizos, 2007, p. 140) and also the concept of the accessibility of services in hours (Spilanis et al., 2012, p. 206). Lekakou & Vitsounis (2011, p. 77) employ a “straightforward description of accessibility” which consider accessibility as a feature of human perception of space, and take into account the frequency of trips and the weighted travel time of ship crossings.
According to Di Piazza (2014, p. 76), Bretagnolle noted that as “differences in accessibility of places become increasingly great, they become more and more difficult to show on a map”. As early as the 19th century, partly because of innovations in transport technology, researchers began to attempt to map space in terms of travel time.
S. Karampela, T. Kizos & I. Spilanis
296
In this paper, we discuss differences between geographical distance and accessibility potential combining different transportation modes (ferries and airplanes) with the use of accessibility index that incorporates different modes and frequency of connection and actual usage of data. The case study area is the Aegean Islands, Greece, an archipelago of more than 50 inhabited islands of various sizes and transportation choices that include ferries and air travel with mainland in a radial system. In planning, it is important to assess the coverage of the island area by various kinds of public services. An effective way to do so is to compute isochrones (Bauer, Gamper, Loperfido, Profanter, Putzer & Timko, 2008). Isochrones are defined as the set of all points from which a specific point of interest is reachable within a given time span. Francis Galton, an English polymath, a varied contributor to data visualization (Friendly, 2006, p. 16), drew the first “isochronic passage-chart to show the extreme distances that can be traversed in “equal times” from a common starting-point” (Galton, 1881, p. 657). Our goal is to develop a new geography for the Aegean Islands, selecting Athens–Piraeus as a starting point, around which neighbouring islands become either ‘closer’ or ‘farther away’, depending on transportation patterns and modal performance. Methods and data
In Greece, there are four insular administrative NUTS II1 regions, two of which comprise the majority of the Greek Aegean archipelago (North and South Aegean, some other islands lying close to continental Greece are parts of continental NUTS II level regions, see Figure 1). Geographically, the Aegean Islands are a complex of 3,053 islands in a space defined by Crete in the South, continental Greece in the North and West, and continental Turkey in the East, with a total land area of 19,076 km2. In the regions of the North and South Aegean, there are 53 inhabited islands (Hellenic Statistical Authority, 2013).
Historically, geographically, politically and economically, islands are very important to Greece. Their distinctive geographical features (many islands of various sizes, many at considerable distances from the Greek mainland and scattered in space) and unequal development patterns make the Aegean islands well-suited to study patterns of transportation for residents and tourists via ferry and airplane (Karampela, Kizos & Papatheodorou, 2014). In this paper, 40 distinct cases of inhabited islands in the North and South Aegean archipelago with direct connections to the mainland, the capital of the country, are selected: 6 islands from the North Aegean and 34 islands from the South Aegean.
Seventeen international airports operate in the case study islands having domestic or international airports (the latter for charter flights) and at least one port on each island. The ferry system is radial and oriented towards Athens (at Piraeus port) with inter-island connections of different importance and frequency. The quality and frequency of connections varies, and bigger islands with more tourism enjoy the faster, newer ferries and more frequent sailings, while small and remote islands have services supplied by older ferries and fewer connections. Frequency is reduced in winter due to lower demand, and sea travel is difficult in
1 The NUTS classification (Nomenclature of Territorial Units for Statistics) is a hierarchical system for dividing up the economic territory of the EU for the purpose of: (a) the collection, development and harmonisation of EU regional statistics, (b) socio-economic analyses of the regions (NUTS I: major socio-economic regions, NUTS II: basic regions for the application of regional policies, NUTS III: small regions for specific diagnoses) and (c) framing of EU regional policies. The NUTS classification valid from 1 January 2012 until 31 December 2014 lists 97 regions at NUTS I, 270 regions at NUTS II, and 1,294 regions at NUTS III level (Eurostat, 2014)

Island access: a new geography based on transportation modes and choices
297
strong winds: for example, 2004 was a rather windy year, and local port authorities on the island of Lesvos banned ferry departures for 26 days in total, or 2 days per month on average (Kizos, Spilanis & Koulouri, 2007, p. 334). Air traffic is of higher frequency than ferry traffic and therefore more alternatives are offered for the passengers on the islands where airports are located. Only on Naxos the frequency of sea routes is almost twice as frequent as air routes and on Syros, mostly due to the proximity to Athens (a 4 and 6 hr ferry trip away respectively, compared to 10 hrs for Lesvos and 18 hrs for Rodos). Figure 1: Location of the case study islands.
Source: Produced by Sofia Karampela and Thanasis Kizos. The accessibility index for the residents and tourists of the islands to central ports and airports is estimated here by taking into account the real time needed to access the port or the airplane via public transportation only: ferry boat or airplane. In the case of the Aegean islands the central port is in Piraeus in the greater Athens metropolitan area and the central airport is Eleftherios Venizelos in Spata, the largest airport in Greece (see Figure 1). As for the use of the port of Piraeus for almost all the islands included in this study, this is because most passengers
S. Karampela, T. Kizos & I. Spilanis
298
and commercial cargo are moved through Athens / Piraeus and reflects the reality of the residents of the islands in the winter and the 'hub and spoke' transport system.
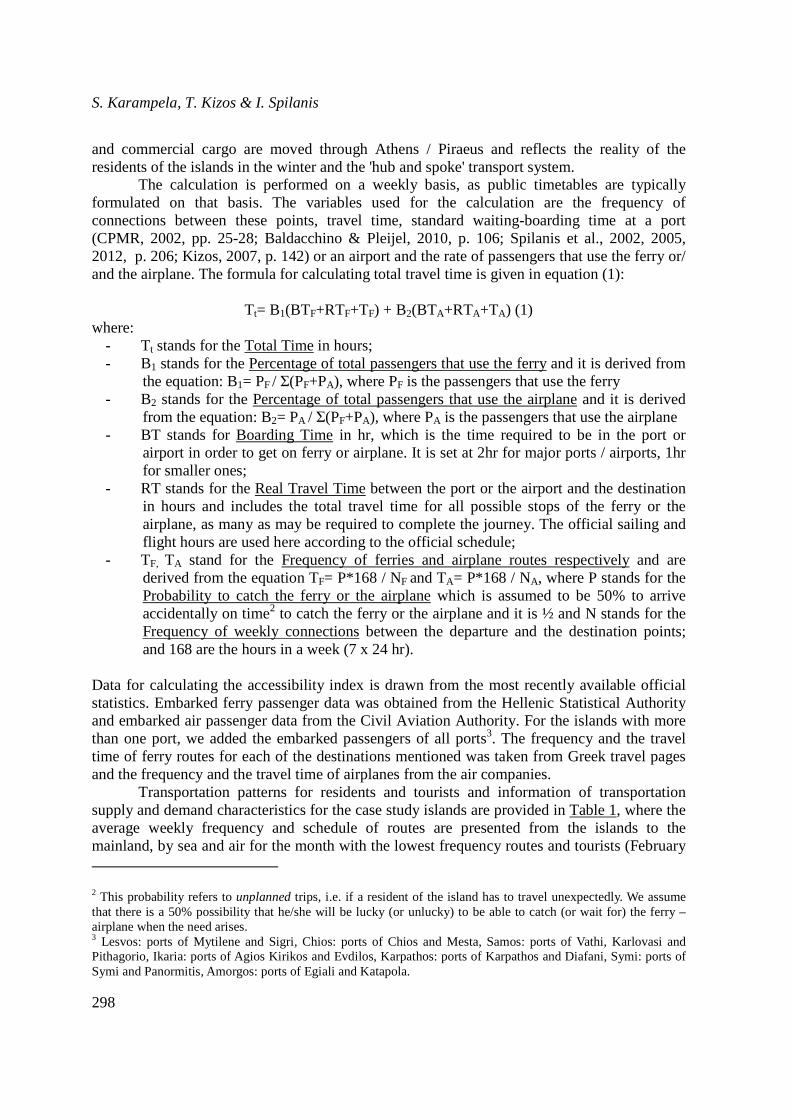
The calculation is performed on a weekly basis, as public timetables are typically formulated on that basis. The variables used for the calculation are the frequency of connections between these points, travel time, standard waiting-boarding time at a port (CPMR, 2002, pp. 25-28; Baldacchino & Pleijel, 2010, p. 106; Spilanis et al., 2002, 2005, 2012, p. 206; Kizos, 2007, p. 142) or an airport and the rate of passengers that use the ferry or/ and the airplane. The formula for calculating total travel time is given in equation (1):
Tt= B1(BTF+RTF+TF) + B2(BTA+RTA+TA) (1) where:
- Tt stands for the Total Time in hours; - B1 stands for the Percentage of total passengers that use the ferry and it is derived from
the equation: B1= PF / Σ(PF+PA), where PF is the passengers that use the ferry - B2 stands for the Percentage of total passengers that use the airplane and it is derived
from the equation: B2= PA / Σ(PF+PA), where PA is the passengers that use the airplane - BT stands for Boarding Time in hr, which is the time required to be in the port or
airport in order to get on ferry or airplane. It is set at 2hr for major ports / airports, 1hr for smaller ones;
- RT stands for the Real Travel Time between the port or the airport and the destination in hours and includes the total travel time for all possible stops of the ferry or the airplane, as many as may be required to complete the journey. The official sailing and flight hours are used here according to the official schedule;
- TF, TA stand for the Frequency of ferries and airplane routes respectively and are derived from the equation TF= P*168 / NF and TA= P*168 / NA, where P stands for the Probability to catch the ferry or the airplane which is assumed to be 50% to arrive accidentally on time2 to catch the ferry or the airplane and it is ½ and N stands for the Frequency of weekly connections between the departure and the destination points; and 168 are the hours in a week (7 x 24 hr).
Data for calculating the accessibility index is drawn from the most recently available official statistics. Embarked ferry passenger data was obtained from the Hellenic Statistical Authority and embarked air passenger data from the Civil Aviation Authority. For the islands with more than one port, we added the embarked passengers of all ports3. The frequency and the travel time of ferry routes for each of the destinations mentioned was taken from Greek travel pages and the frequency and the travel time of airplanes from the air companies.
Transportation patterns for residents and tourists and information of transportation supply and demand characteristics for the case study islands are provided in Table 1, where the average weekly frequency and schedule of routes are presented from the islands to the mainland, by sea and air for the month with the lowest frequency routes and tourists (February
2 This probability refers to unplanned trips, i.e. if a resident of the island has to travel unexpectedly. We assume that there is a 50% possibility that he/she will be lucky (or unlucky) to be able to catch (or wait for) the ferry – airplane when the need arises. 3 Lesvos: ports of Mytilene and Sigri, Chios: ports of Chios and Mesta, Samos: ports of Vathi, Karlovasi and Pithagorio, Ikaria: ports of Agios Kirikos and Evdilos, Karpathos: ports of Karpathos and Diafani, Symi: ports of Symi and Panormitis, Amorgos: ports of Egiali and Katapola.
Island access: a new geography based on transportation modes and choices
299
2014) and the embarked passengers to ferries and airplanes for the year 2011 (the most recent available data). Some explanations are required for the actual calculations of ferry connections. February is the month in which ‘winter’ and ‘spring’ ferry schedules overlap and there were some routes that changes their day of approach or their frequency. In these cases, we divided the actual number of days of ferry routes by the total number of days in February: E.g. one of the ferry routes for Limnos terminated on 02/17/2014 and the other on 02/19/2014 and the total frequency of weekly ferry connections is 17/28+19/28=1.29.
The representation of the results is performed with the use of isochrone lines that depict equal classes of the accessibility index, i.e. the combined time in hours required to reach the island via public transport systems which follow a standard schedule (Gamper, Böhlen, Cometti & Innere, 2011). Here, we consider islands as points in space and therefore the same value of accessibility is assigned to their whole territory. The computation of an isochrone area from an isochrone network is similar to the computation of a footprint for a set of points (Marciuska & Gamper, 2010). The visualization of these lines therefore, provides a depiction of space “warped” around less accessible islands or groups of islands and a “new” geography of insular space, based on ease of access and geographical distance.
Findings and results
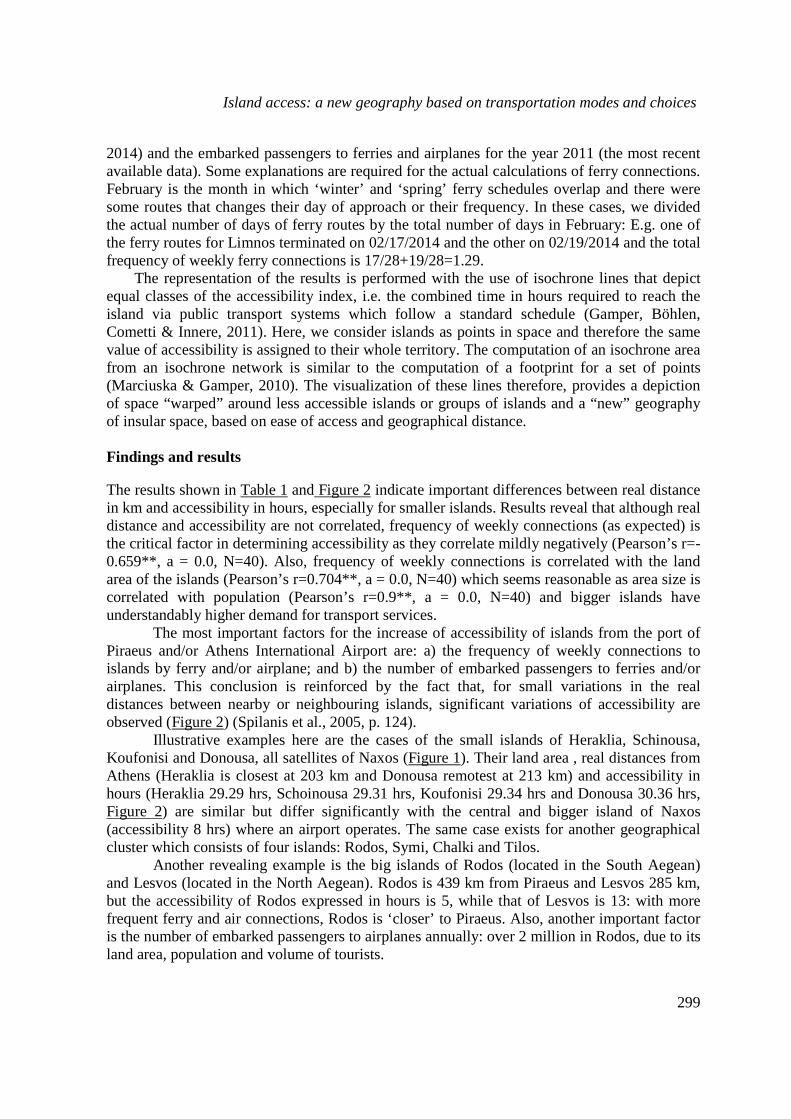
The results shown in Table 1 and Figure 2 indicate important differences between real distance in km and accessibility in hours, especially for smaller islands. Results reveal that although real distance and accessibility are not correlated, frequency of weekly connections (as expected) is the critical factor in determining accessibility as they correlate mildly negatively (Pearson’s r=-0.659**, a = 0.0, N=40). Also, frequency of weekly connections is correlated with the land area of the islands (Pearson’s r=0.704**, a = 0.0, N=40) which seems reasonable as area size is correlated with population (Pearson’s r=0.9**, a = 0.0, N=40) and bigger islands have understandably higher demand for transport services.
The most important factors for the increase of accessibility of islands from the port of Piraeus and/or Athens International Airport are: a) the frequency of weekly connections to islands by ferry and/or airplane; and b) the number of embarked passengers to ferries and/or airplanes. This conclusion is reinforced by the fact that, for small variations in the real distances between nearby or neighbouring islands, significant variations of accessibility are observed (Figure 2) (Spilanis et al., 2005, p. 124).
Illustrative examples here are the cases of the small islands of Heraklia, Schinousa, Koufonisi and Donousa, all satellites of Naxos (Figure 1). Their land area , real distances from Athens (Heraklia is closest at 203 km and Donousa remotest at 213 km) and accessibility in hours (Heraklia 29.29 hrs, Schoinousa 29.31 hrs, Koufonisi 29.34 hrs and Donousa 30.36 hrs, Figure 2) are similar but differ significantly with the central and bigger island of Naxos (accessibility 8 hrs) where an airport operates. The same case exists for another geographical cluster which consists of four islands: Rodos, Symi, Chalki and Tilos.
Another revealing example is the big islands of Rodos (located in the South Aegean) and Lesvos (located in the North Aegean). Rodos is 439 km from Piraeus and Lesvos 285 km, but the accessibility of Rodos expressed in hours is 5, while that of Lesvos is 13: with more frequent ferry and air connections, Rodos is ‘closer’ to Piraeus. Also, another important factor is the number of embarked passengers to airplanes annually: over 2 million in Rodos, due to its land area, population and volume of tourists.

S. Karampela, T. Kizos & I. Spilanis
300
Table 1: Accessibility of islands, February 2014
Α.Α Islands PA 2011
PF 2011
Passengers on ferries & planes (PF+PA)
B1 B2 BTF BTA RTF RTA NF NA TF TA Tt Real
Distance (km)
Population 2011
Land area (km2)
1 Chios 120,022 211,247 331,269 0.64 0.36 1 1 6:58 0:45 3.82 16 21.99 5.25 17.12 223 51,269 841 2 Fourni 18,224 18,224 1.00 0.00 1 0 11:27 1.89 44.44 45.92 255 1,343 30
3 Ikaria 19,243 82,753 101,996 0.81 0.19 1 1 9:58 0:50 1.29 5 65.12 16.80 57.34 238 8,431 255 4 Lesvos 238,369 207,331 445,700 0.47 0.53 1 1 9:57 0:50 3.82 21 21.99 4.00 13.58 285 86,312 1.630 5 Limnos 47,340 75,665 123,005 0.62 0.38 1 1 31:52 0:50 1.29 6 65.12 14.00 47.27 248 16,743 476
6 Samos 206,612 116,751 323,363 0.36 0.64 1 1 6:28 0:55 1.29 12 65.12 7.00 29.10 294 33,339 476 7 Astypalea 6,841 11,490 18,331 0.63 0.37 1 1 9:28 0:55 3.89 4 21.59 21.00 22.63 287 1,270 97
8 Chalki 6,535 6,535 1.00 0.00 1 0 10:45 1.79 46.93 48.38 399 702 28 9 Kalymnos 12,873 29,399 42,272 0.70 0.30 1 1 10:55 1:00 2.79 7 30.11 12.00 25.92 315 16,073 111 10 Karpathos 91,194 19,703 110,897 0.18 0.82 1 1 19:02 1:13 1.79 7 46.93 12.00 19.39 421 6,748 301 11 Kasos 2,617 6,866 9,483 0.72 0.28 1 1 11:49 1.79 46.93 35.33 407 1,070 66 12 Kos 966,915 137,972 1,104,887 0.12 0.88 1 1 11:43 0:55 5.61 20 14.97 4.20 6.64 346 46,099 290 13 Leros 16,810 50,812 67,622 0.75 0.25 1 1 10:21 1:00 2.75 7 30.55 12.00 27.27 298 7,915 53
14 Lipsi 10,873 10,873 1.00 0.00 1 0 9:45 0.93 90.32 91.73 283 784 16
15 Megisti
(Kastelorizo) 4,168 3,950 8,118 0.49 0.51 1 1 23:43 1.86 45.16 23.46 565 496 9
16 Nisyros 4,782 4,782 1.00 0.00 1 0 13:41 1.86 45.16 46.73 346 1,003 41 17 Patmos 58,733 58,733 1.00 0.00 1 0 8:20 2.75 30.55 31.89 267 3,429 34 18 Rodos 2,081,463 285,945 2,367,408 0.12 0.88 1 1 18:28 1:00 7.39 28 11.37 3.00 5.14 439 152,538 1.398 19 Symi 12,029 12,029 1.00 0.00 1 0 16:43 1.93 43.52 45.22 398 3,068 58
20 Tilos 4,235 4,235 1.00 0.00 1 0 15:10 1.86 45.16 46.79 367 829 63
21 Amorgos 50,468 50,468 1.00 0.00 1 0 8:32 6.00 14.00 15.36 234 1,950 121 22 Anafi 11,272 11,272 1.00 0.00 1 0 9:45 0.96 87.50 88.91 260 294 38
23 Donousa 9,802 9,802 1.00 0.00 1 0 7:10 2.89 29.07 30.36 213 176 13 24 Folegandros 38,302 38,302 1.00 0.00 1 0 9:41 2.68 31.34 32.75 186 787 32 25 Heraklia 7,433 7,433 1.00 0.00 1 0 7:00 3.00 28.00 29.29 203 150 18 26 Ios 113,200 113,200 1.00 0.00 1 0 9:23 7.68 10.94 12.33 202 2,084 108 27 Kimolos 36,491 36,491 1.00 0.00 1 0 8:31 1.71 49.12 50.48 153 901 36 28 Koufonisi 31,763 31,763 1.00 0.00 1 0 8:05 3.00 28.00 29.34 208 412 6
29 Kythnos 71,562 71,562 1.00 0.00 1 0 3:05 1.71 49.12 50.25 92 1,436 99
30 Milos 13,529 133,226 146,755 0.91 0.09 1 1 6:40 0:45 3.54 7 23.73 12.00 23.90 157 4,966 151 31 Mykonos 245,540 425,102 670,642 0.63 0.37 1 1 5:45 0:40 7.00 8 12.00 10.50 12.61 160 14,189 85
32 Naxos 13,510 390,268 403,778 0.97 0.03 1 1 5:55 0:50 13.00 6 6.46 14.00 7.95 181 18,340 428 33 Paros 14,066 438,306 452,372 0.97 0.03 1 1 13:10 0:45 13.00 14 6.46 6.00 7.64 165 13,694 195
34 Santorini (Thira)
409,912 522,810 932,722 0.56 0.44 1 1 10:03 0:47 11.50 12 7.30 7.00 8.42 237 17,430 76
35 Serifos 63,611 63,611 1.00 0.00 1 0 4:36 2.61 32.18 33.38 119 1,378 73
36 Sikinos 9,916 9,916 1.00 0.00 1 0 10:20 2.68 31.34 32.77 197 270 41 37 Sifnos 96,750 96,750 1.00 0.00 1 0 5:35 2.68 31.34 32.58 140 2,543 73
38 Syros 5,684 336,640 342,324 0.98 0.02 1 1 4:08 0:35 9.07 6 9.26 14.00 10.51 129 21,475 84 39 Schinousa 9,324 9,324 1.00 0.00 1 0 7:20 3.00 28.00 29.31 206 225 8 40 Tinos 415,695 415,695 1.00 0.00 1 0 5:00 7.00 12.00 13.21 140 8,699 194
Sources: Hellenic Statistical Authority, Civil Aviation Authority, Greek Travel Pages, air companies, processed by the authors.
Island access: a new geography based on transportation modes and choices
301
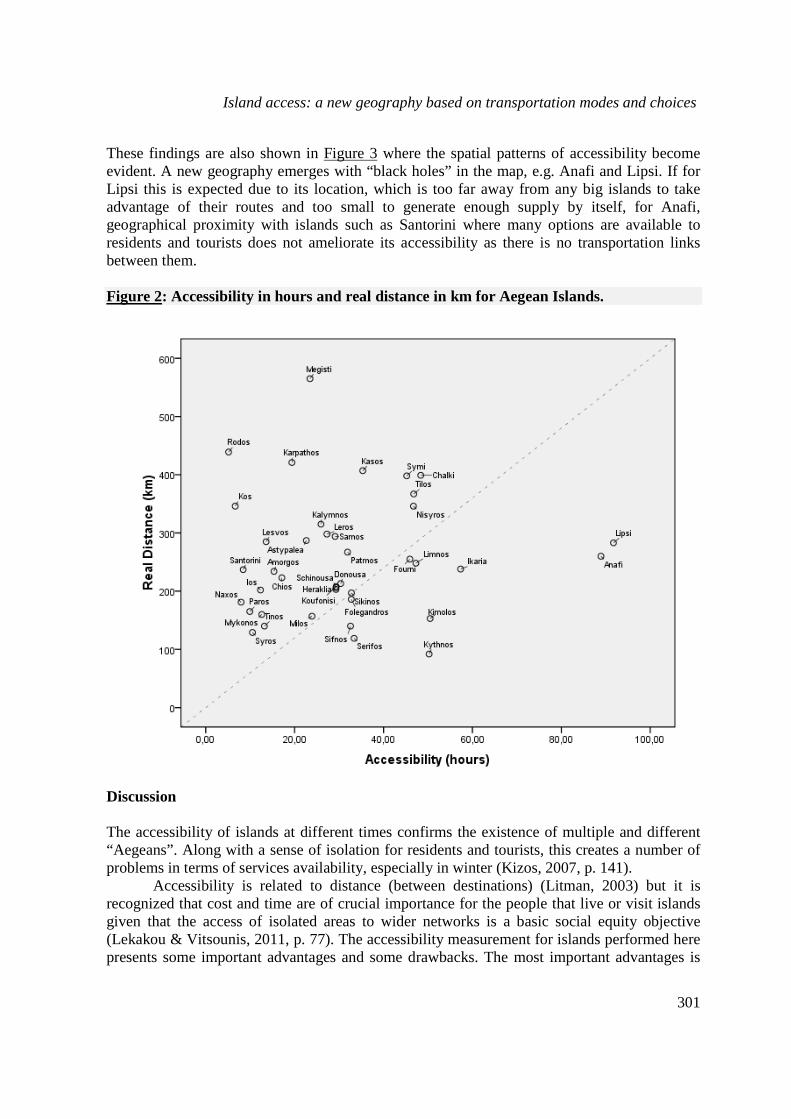
These findings are also shown in Figure 3 where the spatial patterns of accessibility become evident. A new geography emerges with “black holes” in the map, e.g. Anafi and Lipsi. If for Lipsi this is expected due to its location, which is too far away from any big islands to take advantage of their routes and too small to generate enough supply by itself, for Anafi, geographical proximity with islands such as Santorini where many options are available to residents and tourists does not ameliorate its accessibility as there is no transportation links between them.
Figure 2: Accessibility in hours and real distance in km for Aegean Islands.
Discussion The accessibility of islands at different times confirms the existence of multiple and different “Aegeans”. Along with a sense of isolation for residents and tourists, this creates a number of problems in terms of services availability, especially in winter (Kizos, 2007, p. 141).
Accessibility is related to distance (between destinations) (Litman, 2003) but it is recognized that cost and time are of crucial importance for the people that live or visit islands given that the access of isolated areas to wider networks is a basic social equity objective (Lekakou & Vitsounis, 2011, p. 77). The accessibility measurement for islands performed here presents some important advantages and some drawbacks. The most important advantages is
S. Karampela, T. Kizos & I. Spilanis
302
that it takes into account all public transportation modes available (ferries and airplanes), the frequency of connections and can reveal seasonal differences in accessibility for the same island or group of islands. Another key advantage is that it is flexible and can be calculated for separate islands or for groups of islands. It can also be calculated for the same island via different ports and airports. The weekly basis that is used for the calculation of connections and frequencies reflects the reality of sea travel that is scheduled on this basis. Weekly data is more meaningful than daily averages (Spilanis et al., 2012, p. 207).
Figure 3: Accessibility from Athens metropolitan area for Aegean Islands in isochrone lines (hrs).
Its disadvantages include the fact that the quality of ferry boats (speed) and the capacity of ferry boats and airplanes are not included in the index and this can be of great importance. Additionally, the issue of travel costs is not considered in the index, because of the different prices between seasons and different transportation mean (Spilanis et al., 2012, p. 207; Spilanis, 2012, p. 60; ESPON, 2011). The issue of higher costs of ferry and airplane trips compared to public or private transport costs in the mainland has to be considered as well. Additionally, canceled ferry routes due to weather conditions (air velocity), or social reasons (strikes) were not included in this index.
Island access: a new geography based on transportation modes and choices
303
The results indicate that residents and tourists (especially of smaller islands) have to travel long hours. Islanders arrange their lives according to ferry and air routes, adding more potential expenses and inconvenience in their daily schedules when these routes take place at inappropriate hours. A typical example is the island of Chios that is serviced by the ferry route of Lesvos island, which is primarily planned for the residents of Lesvos (they depart at night from Piraeus to arrive early morning to Lesvos), meaning that residents and tourists of Chios island arrive at Chios very early in the morning, with extra costs and inconvenience. This cannot be depicted in the measurement of accessibility.
Also, this accessibility approach does not differentiate between island residents, effectively considering them all as members of the same, relatively uniform, social group. So, within the approach employed here, island residents and tourists are considered as relatively homogeneous and having similar service needs (Spilanis et al., 2012; Farrington, 2007).
The results indicate that residents and tourists (especially of smaller islands) have to travel long hours, longer than their geographical distance would imply. The case of the “black hole” of Anafi demonstrates clearly two linked issues related with this. First, the dead end of the central accessibility planning of a radial system which operates today in the Aegean, which places more importance on a connection with the mainland (in the case of Aegean is Piraeus and Athens Metropolitan area in general) rather than providing more links and options between the islands. The fact that highly accessible islands are nearby (Santorini) compounds the issue.
The case of Lipsi also demonstrates that, although geographical distance and limited accessibility are related, local administrations can serve the needs of islanders better than a distant authority: these have managed to provide links with nearby islands of higher accessibility (Patmos and Leros, these links are not recorded here) which illustrate again how a transportation system for such a complex archipelago should be managed and planned. These cases (and many others) also illustrate that accessibility in archipelagos pose special challenges but also opportunities, since they concern connections between islands and not only with a “central” continental place.
Conclusion Accessibility for islanders has both a ‘real’ and ‘psychological’ or perceived dimension: the first is related to infrastructure or services (available transportation modes and the quality of each craft/vessel), the frequency of connections, the destination (the mainland, or another island) in relation to the reason for travel, and of course cost. The later dimension is related to how people perceive and evaluate accessibility. Lesvos was until recently linked via two different ferries daily to Piraeus, plus 5-7 flights daily; then one daily ferry plus 3 flights. This past winter, it is linked 3 times a week via ferry and with 3 air connections daily, but locals feel “isolated”, even though most ferries used to travel empty and now are much fuller (roughly the same number of passengers is serviced by half the number of ferry connections). It seems that the availability of a travel option is equally important for this perceived accessibility rather than the actual use of this option.
In this paper, we have explored a number of issues regarding the ‘real’ accessibility of islands. In many cases, it is difficult for island communities to equitably share the socio-economic life of the rest of Europe, since island transport policies are distinctly influenced by islandness, and vice versa (Chlomoudis, Kostagiolas, Papadimitriou & Tzannatos, 2011, p.
S. Karampela, T. Kizos & I. Spilanis
304
345). The index and the visualization offered here are intended as tools towards the integration of real and perceived accessibility and the improvement of transportation planning for islands.
Greek policy for the accessibility of islands has focused in the past decades on a largely radial system, centered around Piraeus port. Many lines were subsidized by the state as they were not considered economically viable and island residents considered this link of high importance for “their” island, even if the ferries came and went half empty. Our findings point that this radial system has not served smaller islands and that more local everyday or frequent links between smaller and more inaccessible islands and nearby bigger ones, can be the key towards a cheaper and more efficient system that could ‘whiten’ some of the ‘blackest’ spots of the map. Acknowledgements Part of this work involved in this paper was supported by the Integrated Program for Island Research (IPIR) of the Program: 'The University of the Aegean, the prominent and driving factor for the economic and social growth of the wide Aegean area' of the Operational Program 'Education and Lifelong Learning', which is co-funded by the European Union (European Social Fund) and National Resources. Credit for drawing Figure 3 goes to Nikoletta Koukourouvli, whom we thank. References Aegean Airlines. (2014). Various reports. Retrieved from http://en.aegeanair.com. Baldacchino, G. (2004). The impact of bridges and other ‘fixed links’ on island communities:
when small islands are connected to mainlands. Proceedings of ‘Islands of the World VIII’ International Conference: Changing Islands: Changing Worlds, November 1-7, Kinmen Island (Quemoy), Taiwan, 132-145.
Baldacchino, G. (ed.) (2007). A world of islands: An island studies reader. Charlottetown, Canada and Luqa, Malta: Institute of Island Studies and Agenda Academic.
Baldacchino, G., & Pleijel, C. (2010). European islands, development and the Cohesion Policy: a case study of Kökar, Åland islands. Island Studies Journal, 5(1), 89-110.
Bauer, V., Gamper, J., Loperfido, R., Profanter, S., Putzer, S., & Timko, I. (2008). Computing isochrones in multi-modal, schedule-based transport networks. Proceedings of the ACM GIS’08, November 5–7, Irvine CA, USA.
CPMR. (2002). Off the coast of Europe: European construction and the problem of the islands. Corsica, France: Eurisles on the initiative of the Islands Commission, Conference of Peripheral Maritime Regions (CPMR).
Chlomoudis, C., Kostagiolas, P. A., Papadimitriou S., & Tzannatos E. S. (2011). A European perspective on public service obligations for island transport services. Maritime Economics & Logistics, 13(3), 342-354.
Curtis, C., & Scheurer J. (2010). Planning for sustainable accessibility: developing tools to aid discussion and decision-making, Progress in Planning, 74(2), 53-106.
Di Piazza, A. (2014). An isochrone map of the prehistoric seascape around Samoa. Geographical Research, 52(1), 74-84.
ESPON (2006). Transport services & networks: Territorial trends and supply. ESPON Project 1.2.1, 2011/10/29. Retrieved from http://www.espon.eu
Island access: a new geography based on transportation modes and choices
305
ESPON (2011). The development of the islands: European islands and Cohesion Policy (EUROISLANDS), Targeted Analysis, 2013/2/2. Retrieved from http://www.espon.eu
ESPON (2013). Transport accessibility at regional/local scale and patterns in Europe. (TRACC), 2014/2/2. Retrieved from http://www.espon.eu
Eurostat (2014) Introduction into the NUTS Classification, 2014/4/1. Retrieved from http://epp.eurostat.ec.europa.eu/portal/page/portal/nuts_nomenclature/introduction
Farrington, J.H. (2007). The new narrative of accessibility: its potential contribution to discourses in (transport) geography, Journal of Transport Geography, 15(5), 319-330.
Friendly, M. (2006). A brief history of data visualization. In Handbook of computational statistics on data visualization, April 2014. Retrieved from http://www.datavis.ca/papers/hbook.pdf.
Galton, F. (1881). On the construction of isochronic passage-charts. Proceedings of the Royal Geographical Society XI, 57-658.
Gamper, J., Böhlen, M., Cometti, W., & Innere, M. (2011). Defining isochrones in multimodal spatial networks. CIKM '11, Proceedings of the 20th ACM international conference on information and knowledge management. October, Glasgow, Scotland, UK, pp. 2381-2384.
Geurs, K.T., & van Wee, B. (2004). Accessibility evaluation of land-use and transport strategies: review and research directions. Journal of Transport Geography, 12(1), 127-140.
Greek Travel Pages. (2014). Various reports. Retrieved from http://www.gtp.gr Hansen, W. (1959). How accessibility shapes land use. Journal of the American Institute of
Planners, 25(1), 73-76. Hellenic Civil Aviation Authority. (2014). Various reports. Retrieved from http://www.hcaa.gr Hellenic Statistical Authority. (2014). Various reports. Retrieved from
http://www.statistics.gr/portal/page/portal/ESYE Iacono, M., Krizek, J.K., & El-Geneidy, A. (2010). Measuring non-motorized accessibility:
issues, alternatives, and execution. Journal of Transport Geography, 18(1), 133-140. Karampela, S., Kizos, T., & Papatheodorou, A. (2014). Patterns of transportation for tourists
and residents in the Aegean archipelago, Greece. In G. Baldacchino (Ed.), Archipelago tourism: Policies and practices. Farnham: Ashgate (in press).
Kizos, T. (2007). Island lifestyles in the Aegean Islands, Greece: heaven in summer, hell in winter? In H. Palang, H. Sooväli, & A. Printsmann (Eds.), Seasonal landscapes (pp. 127-149). New York: Springer.
Kizos, T., Spilanis, I., & Koulouri, M. (2007). The Aegean islands: a paradise lost? Tourism as a driver for changing landscapes. In B. Pedroli, A. Van Doorn, G. De Blust, M.L. Paracchini, D. Wascher, & F. Bunce (Eds.), Europe's living landscapes. Essays exploring our identity in the countryside: Landscape Europe (pp. 333-348). Zeist, Wageningen: KNNV Publishing.
Lekakou, M.B., & Vitsounis, T.K. (2011). Market concentration in coastal shipping and limitations to island accessibility, Research in Transportation Business & Management, 2(1), 74-82.
Litman, T. (2003). Measuring transportation traffic, mobility and accessibility. Journal of Transportation of the Institute of Transportation Engineers, 73(10), 28-32.
S. Karampela, T. Kizos & I. Spilanis
306
Marciuska, S., & Gamper, J. (2010). Determining Objects within Isochrones in Spatial Network Databases. Advances in Databases and Information Systems Lecture Notes in Computer Science, 6295, 392-405.
Mehmood, Α. (2009). Understanding spatial development and interactions in small islands. Proceedings of Annual Regional Studies Association Conference. Understanding and shaping regions: spatial, social, economic futures, April 6-8, Leuven, Belgium, 1-22.
Olympic Air. (2014). Various reports. Retrieved from https://www.olympicair.com Spilanis, I. (2012). European islands and cohesion policy, Athens: Gutenberg (in Greek). Spilanis, I., Spiridonidis, E., & Misailidis, N. (2002). Accessibility of the Aegean Islands: real
and virtual distance. Proceedings of 7th Greek National Cartography Conference: Island Cartography, October, Mytilini, (in Greek).
Spilanis, I., Kizos, T., Kondili, I., & Misailidis, N. (2005). Accessibility and attractiveness of Aegean Islands. Aeihoros, 4(1), 106-135, (in Greek).
Spilanis, I. Kizos, T., & Petsioti, P. (2012). Accessibility of peripheral regions: evidence from Aegean islands. Island Studies Journal, 7(2), 199-214.
Spilanis, I., Kizos, T., Vaitis, M., & Koukourouvli, N. (2013). Measuring the economic, social and environmental performance of European island regions: emerging issues for European and regional policy. European Planning Studies, 21(12), 1998-2019.
van Wee, B., Hagoort, M., & Annema, J. A. (2001). Accessibility measures with competition. Journal of Transport Geography, 9(3), 199-208.
van Wee, B., Geurs, K.T., & Chorus, C. (2013). Information, communication, travel behaviour and accessibility. Journal of Transportation & Land Use, 6(3), 1-16. Retrieved from http://doc.utwente.nl/88255/1/282-2183-1-PB.pdf
Yoshida, N., & Deichmann U. (2009). Measurement of accessibility and its applications, Journal of Infrastructure Development, 1(1), 1-16.
Zook, M.A., & Stanley, D. B. (2006). From podes to antipodes: positionalities and global airline geographies. Annals of the Association of American Geographers, 96(3), 471-490.