isleep: unobtrusive sleep quality monitoring using …lusu/cse721/papers/isleep unobtrusive...
TRANSCRIPT
iSleep: Unobtrusive Sleep Quality Monitoring usingSmartphones∗
Tian HaoMichigan State University
Guoliang XingMichigan State University
Gang ZhouCollege of William and Mary
ABSTRACTThe quality of sleep is an important factor in maintain-ing a healthy life style. To date, technology has not en-abled personalized, in-place sleep quality monitoring andanalysis. Current sleep monitoring systems are often dif-ficult to use and hence limited to sleep clinics, or invasiveto users, e.g., requiring users to wear a device during sleep.This paper presents iSleep – a practical system to moni-tor an individual’s sleep quality using off-the-shelf smart-phone. iSleep uses the built-in microphone of the smart-phone to detect the events that are closely related to sleepquality, including body movement, couch and snore, and in-fers quantitative measures of sleep quality. iSleep adoptsa lightweight decision-tree-based algorithm to classify vari-ous events based on carefully selected acoustic features, andtracks the dynamic ambient noise characteristics to improvethe robustness of classification. We have evaluated iSleepbased on the experiment that involves 7 participants andtotal 51 nights of sleep, as well the data collected from realiSleep users. Our results show that iSleep achieves consis-tently above 90% accuracy for event classification in a va-riety of different settings. By providing a fine-grained sleepprofile that depicts details of sleep-related events, iSleep al-lows the user to track the sleep efficiency over time and relateirregular sleep patterns to possible causes.
1. INTRODUCTIONSleep plays an important role in our overall health. Hav-
ing insufficient amount of sleep can easily cause fatigue andlack of concentration during the day. Besides the amountof sleep, the quality of sleep is also an important factor inmaintaining a healthy life style. Clinical studies show thatsleep is related to many serious diseases including diabetes,obesity and depression [16] [27].
∗This work is supported in part by the NSF undergrant CNS-0954039 (CAREER), CNS-1250180 and ECCS-0901437. This study is approved by the Institutional ReviewBoard (IRB) of Michigan State University.
Permission to make digital or hard copies of all or part of this work forpersonal or classroom use is granted without fee provided that copies arenot made or distributed for profit or commercial advantage and that copiesbear this notice and the full citation on the first page. To copy otherwise, torepublish, to post on servers or to redistribute to lists, requires prior specificpermission and/or a fee.SenSys’13, November 11–15, 2013, Rome, Italy.Copyright 2013 ACM 978-1-4503-1169-4 ...$15.00.
To date, technology has not enabled personalized, in-placesleep quality monitoring and analysis. Polysomnography(PSG) is the primary clinical tool for sleep monitoring [13].It can provide a quantitative profiling of sleep to diagnosesleep disorders. However, due to the need of various sensors,PSG-based sleep quality measurement is usually limited toclinical settings. Actigraphy has been studied as an inex-pensive alternative to assess sleep and wakefulness based onbody movement [8]. Several portable sleep assessment prod-ucts are designed based on PSG or actigraphy technologies,including ZEO [7], Sleep Tracker [5] and fitbit [1]. However,they are invasive to users as they require a device to be wornby the user during sleep. A recent in-depth survey of 230participants suggested that, although most people are inter-ested in using technology to track their sleep quality, manyare resistant to the idea of having to wear a device duringsleep [14].
This paper presents iSleep – a practical system to mon-itor an individual’s sleep quality using off-the-shelf smart-phone. iSleep is very easy to use and truly unobtrusive:the user just needs to start iSleep app and place the phonesomewhere close to the bed (e.g., on a night stand). iSleepuses the built-in microphone of the smartphone to detectthe events that are closely related to sleep quality, includingbody movement, couch and snore. Based on the detectedevents, iSleep infers quantitative measures of sleep qualitybased on actigraphy and Pittsburgh Sleep Quality Index (P-SQI) [12] which are two well-established scoring criteria insleep literature. We have released an initial version of iSleepon the Google Play Store [2]. Within 6 days, iSleep was in-stalled by more than 100 users from 9 countries on variousAndroid devices. By providing a detailed sleeping profile,iSleep enables the user to be aware of irregular sleep patternslike restlessness caused by extensive snoring which are oth-erwise hard to find. Moreover, as an unobtrusive, portable,in place monitoring tool, iSleep can track sleep quality quan-titatively over a long period of time, which helps healthcareprovider diagnose trends related to certain diseases.
The design of iSleep faces several challenges such as highlydiverse acoustic profiles of sleep from person to person andin different environments. We carefully analyze the acousticdata collected from real sleep experiments and choose sever-al statistical acoustic features that can differentiate environ-ment noise and various sleep-related events. To improve therobustness of detection, iSleep tracks the ambient noise char-acteristics and updates the noise model adaptively. Finally,iSleep adopts a lightweight decision-tree-based algorithm toclassify various sleep-related events and derive quantitative

sleep quality measures. We have evaluated iSleep extensivelyin a long-term experiment that involves 7 participants andtotal 51 nights of sleep, as well as using the data collect-ed from the Android phones that downloaded and installediSleep from Google Play Store. Our results show that iSleepachieves consistently above 90% classification accuracy forvarious events, across different subjects and in a variety ofdifferent sleep environments.
2. RELATED WORKAccording to AASM (American Academy of Sleep Medicine),
the sleep stage scoring based on polysomnography (PSG)has long been considered as the “gold standard” of sleepstudy [20]. A polysomnogram typically requires the record-ing of multiple channels including electroencephalography(EEG), electromyography (EMG), electrocardiography (ECG)or heart rate, respiratory effort, air flow, oxygen saturationand etc. [13]. The result of PSG includes a collection ofindices such as sleep onset latency, total sleep time and etc,which are considered together to infer the sleep quality. Dueto the need of various sensors, PSG-based sleep quality mea-surement is usually limited to sleep clinics.
Actigraphy has been studied as an inexpensive alternativeto assess human sleep and wakefulness [8] based on the sub-ject’s body movements overnight. The basic idea is that thestate of sleep and wake can be inferred from the amountof body movement during sleep [8]. Through processing thelogged acceleration data, epoch-by-epoch (usually 30 secondor 1 minute) sleep/wake predictions are calculated. Severalalgorithms [18] [29] [15] have been proposed to derive sleepquality from actigraphy. The average accuracy of predictingsleep/wake state is around 90% (reported 88% in [15] and94-96% in [31]).
A widely used subjective sleep quality assessment methodis through PSQI (Pittsburgh Sleep Quality Index) [12], whichis a self-rated questionnaire to assess the sleep quality anddisturbance over a long-term interval. In PSQI, a set ofsleep measures are collected, including sleep latency, sleepduration, sleep disturbance and etc. PSQI has been shownuseful in numerous studies [9] [11] over a variety of popula-tions. However, the accuracy of PSQI is highly variable andis often impeded by the inaccuracy of subject’s memory andperception.
Several commercial personal sleep assessment productsare currently available. Watch PAT [6] detects respiratorydisturbances during sleep by monitoring peripheral arteri-al tone (PAT). The users are required to attach a probe totheir finger during sleep. ZEO [7] is a popular sleep monitor-ing product that infers sleep stages using three EEG sensorscontained in a head band worn by the user during sleep.Several actigraphy-based products such as Sleep Tracker [5]and fitbit [1] require the user to wear the device containingaccelerometer during sleep.
Recently, several research efforts aimed at developing low-cost sleep assessment systems. In [28], a wearable neck-cuffsystem for real-time sleep monitoring is designed based onoximetry sensor, microphone and accelerometer. Instead ofdirectly measuring the sleep, SleepMiner [10] predicts thesleep quality based on the user’s daily context informationsuch as sound, light, postures, and positions. In [19], thebody position and movements during sleep are monitoredusing accelerometers attached to bed mattress. A densepressure sensitive bedsheet for sleep posture monitoring is
proposed in [23]. However, these systems incur nontrivialmonetary costs of hardware or professional installation.
Several Android and iOS Apps such as Sleep as Android[3] and Sleep Cycle [4] can measure sleep quality. All of themexclusively rely on the actigraphy-based methods that mon-itor body movements overnight using smartphones. Howev-er, sleep-related events such as cough and snore can not bereliably detected based on acceleration. For example, snoreis the sound caused by the vibration of respiratory struc-tures while sleeping due to obstructed air movement, andis not necessarily associated with body motion. Moreover,since the motion data is collected through the built-in ac-celerometer, the phone must be put on the bed, which notonly is inconsistent with the habit of most users, but alsomay obstruct the individual’s body movement.
iSleep leverages the existing body of work on acoustic sig-nal processing (e.g. SoundSense [24] and StressSense [25]).However, iSleep employs novel techniques to address thechallenges specific to sleep-related event classification, in-cluding highly diverse acoustic profiles of sleep.
3. SYSTEM REQUIREMENTS AND CHAL-LENGES
iSleep is designed to be a “sleep diary” that provides theuser real-time, fine-grained feedback to their sleep quality ona daily basis 1. Specifically, iSleep is designed to meet thefollowing requirements: (1) Since iSleep operates over nightwhile the user is asleep, it needs to be unobtrusive. It shouldminimize the burden on the user, and the user should notfeel any kind of uncomfort when using the system. (2) iSleepneeds to provide fine-grained measurement, such as overallsleep efficiency and the occurrences of events that may inter-rupt sleep, such as cough and snore. Such fine-grained sleepprofiling helps the user understand what factors affect theirsleep quality. (3) iSleep needs to deliver robust monitor-ing accuracy across different users, smartphones and sleepenvironments. (4) The users’ privacy needs to be strict-ly protected. Due to the inherently private nature of sleep,any concern (or even suspension) of privacy breach may pre-vent the adoption of sleep monitoring technology like iSleep.For instance, the system should process the sensor sampleson the fly and only keep sleep-related data (e.g., the num-ber/loudness of snores), instead of sending any raw sensorsamples to a remote server, because they may capture sen-sitive information such as audio of sleep talks, conversationsbefore/after sleep and etc.
To meet these requirements, three major challenges needto be addressed in developing iSleep. First, in order to effec-tively monitor the sleep quality in an unobtrusive manner,iSleep samples and analyzes acoustic signals from the built-in microphone to detect sleep-related events. Therefore, theuser only needs to leave the phone somewhere close to thebed (up to several meters). However, the built-in micro-phone of smartphone is designed for capturing close vocal-s, and usually has low sensitivity. Moreover, many sleep-related events only generate low-intensity sound. For exam-ple, the intensity of the sound from a roll-over movement istypically only several dB higher than that of ambient noise.
1iSleep is not designed or certified for clinical use, althoughthe monitoring results provided by iSleep could be potential-ly useful for professional diagnosis of sleep-related diseasesuch as insomnia [8].
!"#$%"&'"()*+,*&-
./0+#"&12/&32
4)/0"&1
5*"6-27-$-($"*& 5*"6-2'*3-#
/(*!6$"(26"1&/#6
!+3/$-8)/0-6 &*"6-28)/0-6
4-/$!)-29:$)/($"*&
9;-&$27-$-($"*&
&*&%&*"6-28)/0-6
)06
)#,
;/)
8-/$!)-6
3"6$)"<!$"*&28-/$!)-6
5*"6-296$"0/$"*&
=.>?%</6-32.#--+2>!/#"$@296$"0/$"*&
A($"1)/+,%</6-32.#--+2>!/#"$@296$"0/$"*&
0*;-
0*;-
6&*)-
(*!1,
.,*)$%$-)02.#--+2>!/#"$@2
B-+*)$
C*&1%$-)02.#--+2>!/#"$@2
B-+*)$
A($"1)/+,%</6-32.#--+2>!/#"$@296$"0/$"*&
.,*)$%$-)02.#--+2>!/#"$@2
B-+*)$
2
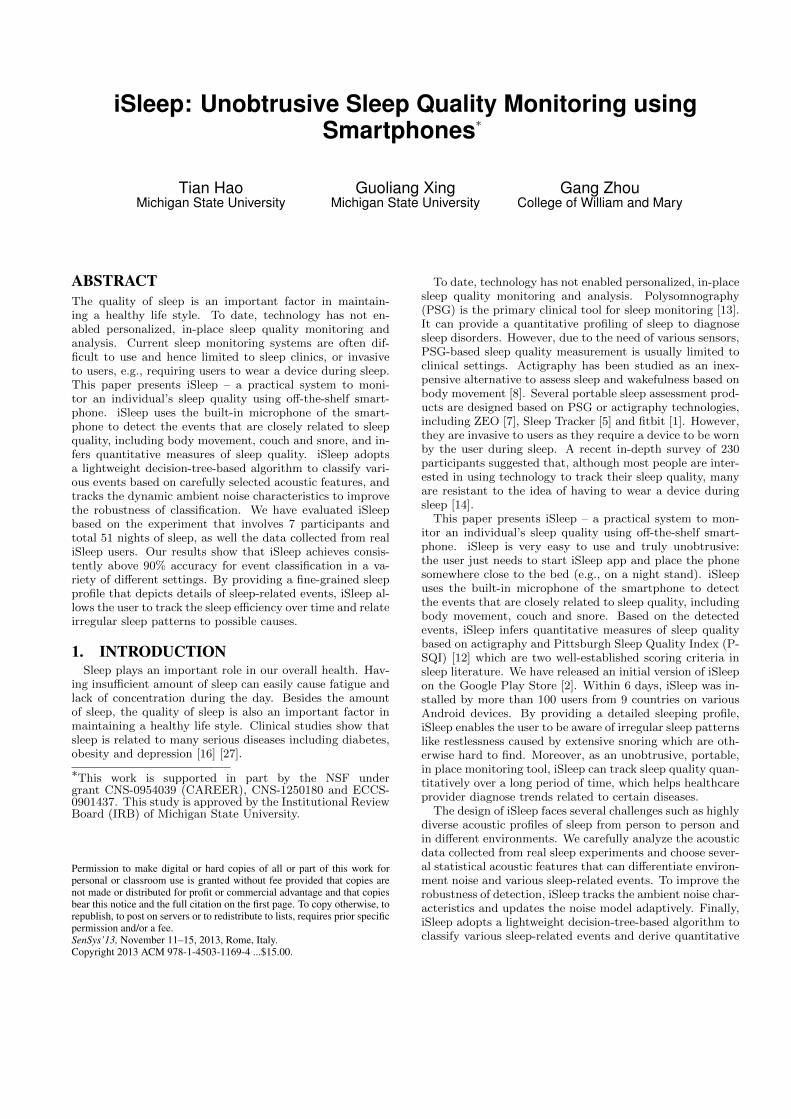
Figure 1: The architecture of iSleep system.
Second, iSleep needs to detect sleep-related events in arobust manner across different users and environments. Forinstance, different people likely snore in different ways interms of sound frequency and loudness. Moreover, even thesame person may snore differently due to the change of bodyposition overnight. Noises from appliances such as fans mayalso have a major impact on the acoustic event detectionaccuracy.
Lastly, in order to preserve users’ privacy, iSleep does notstore or transmit raw sound samples. Instead, sound data isprocessed locally on the smartphone in real-time, while onlythe event detection results such as the number of occurrencesof snore/cough/body movement are kept and shown to theuser. To capture the features of various acoustic events, themicrophone must be sampled at a high rate. Due to theresource constrains of smartphones, the acoustic processingalgorithms must be extremely lightweight in order to processthe data in real-time, while maintaining satisfactory eventdetection accuracy.
4. SYSTEM OVERVIEWKeeping the above challenges in mind, we aim to build a
light-weight sleep quality monitoring system that is reliablein detecting sleep-related events across different users andenvironments. Fig. 1 shows the architecture of the iSleepsystem. First, the acoustic signal is continuously sampled atthe frequency of 16 kHz from the microphone, and segment-ed into frames. Second, the acoustic frames are fed to NoiseDetection, where the system determines whether a frameonly contains the sound of ambient noise. The model of am-bient noise is then updated based on detected noise frames.As a result, the system is able to adapt to the changes ofambient noise. Third, acoustic features such as root meansquare and variance will be extracted from the frames thatpotentially contain events of interest. The extracted fea-tures, along with the updated ambient noise model, are fedto the Sleep Event Detection, where sleep-related events suchas snoring, coughing and body movement will be detected.
iSleep derives both short-term (one-night) and long-termsleep quality from sleep-related events according to two well-established sleep scoring criteria: actigraphy and PittsburghSleep Quality Index (PSQI) [12]. iSleep uses actigraphy toestimate the sleep/wake states overnight and then computesa metric called sleep efficiency, which is the ratio of actualsleep time to total in-bed time. Compared with other qual-ity measures such as sleep stages, sleep efficiency providesa quantitative and more intuitive feedback to users. In ad-dition to one-night sleep efficiency, iSleep employs PSQI toestimate long-term sleep quality over multiple nights. PSQI
0 5000 10000 150000
1
2
3
x 10−4
Power spectral density of moving
Frequency (Hz)0 500 1000 1500
0
0.005
0.01
0.015
0.02
Frequency (Hz)0 1000 2000 3000 4000
0
2
4
6
8
10
12
Frequency (Hz)
(a)Power spectral density of snoring Power spectral density of coughing
(b) (c)
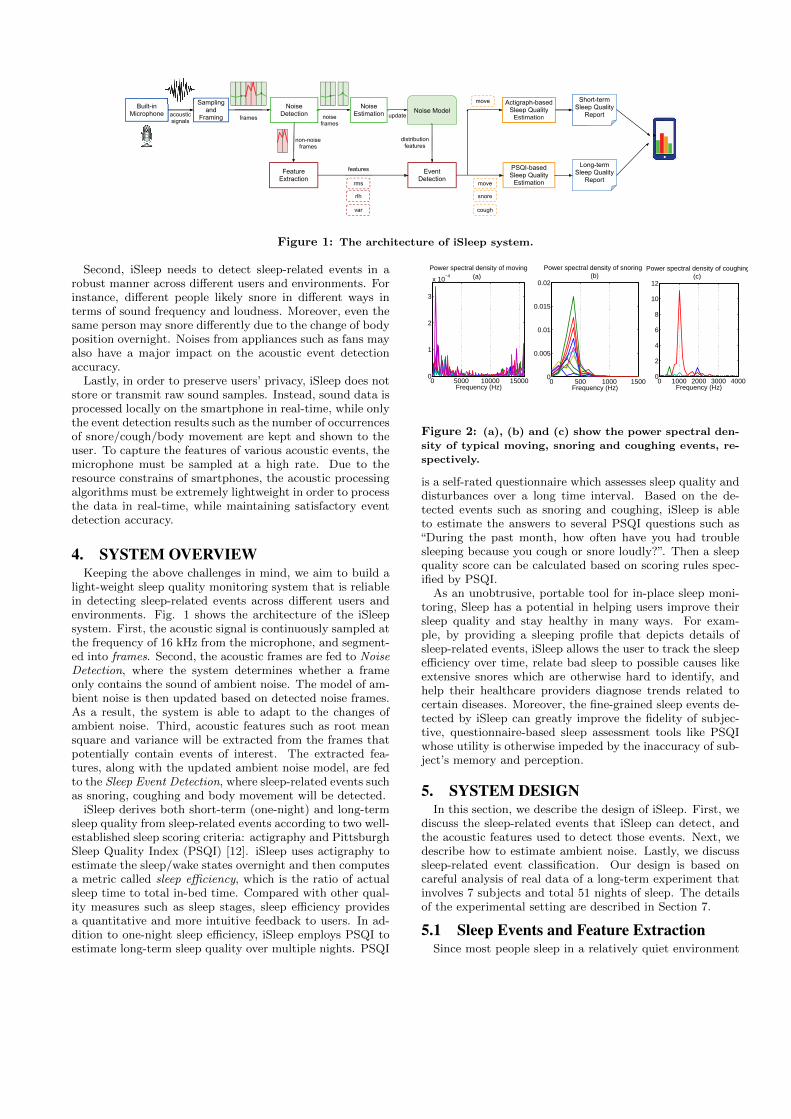
Figure 2: (a), (b) and (c) show the power spectral den-
sity of typical moving, snoring and coughing events, re-
spectively.
is a self-rated questionnaire which assesses sleep quality anddisturbances over a long time interval. Based on the de-tected events such as snoring and coughing, iSleep is ableto estimate the answers to several PSQI questions such as“During the past month, how often have you had troublesleeping because you cough or snore loudly?”. Then a sleepquality score can be calculated based on scoring rules spec-ified by PSQI.
As an unobtrusive, portable tool for in-place sleep moni-toring, Sleep has a potential in helping users improve theirsleep quality and stay healthy in many ways. For exam-ple, by providing a sleeping profile that depicts details ofsleep-related events, iSleep allows the user to track the sleepefficiency over time, relate bad sleep to possible causes likeextensive snores which are otherwise hard to identify, andhelp their healthcare providers diagnose trends related tocertain diseases. Moreover, the fine-grained sleep events de-tected by iSleep can greatly improve the fidelity of subjec-tive, questionnaire-based sleep assessment tools like PSQIwhose utility is otherwise impeded by the inaccuracy of sub-ject’s memory and perception.
5. SYSTEM DESIGNIn this section, we describe the design of iSleep. First, we
discuss the sleep-related events that iSleep can detect, andthe acoustic features used to detect those events. Next, wedescribe how to estimate ambient noise. Lastly, we discusssleep-related event classification. Our design is based oncareful analysis of real data of a long-term experiment thatinvolves 7 subjects and total 51 nights of sleep. The detailsof the experimental setting are described in Section 7.
5.1 Sleep Events and Feature ExtractionSince most people sleep in a relatively quiet environment
0 0.5 1 1.5 2−500
0
500
time (sec)
ampl
itude
(a) acoustic signal of snoring event
0 0.5 1 1.5 20
20
40
time (sec)
(b) rlh feature
time (sec)
freq
uenc
y (H
z)
(c) spectrogram by FFT
0 0.5 1 1.5 2
1500
1000
500
0 0 0.5 1 1.5 20
1000
2000
time (sec)
(d) sum of energy from 0~750Hz
time (sec)
chan
nel i
ndex
(e) MFCC
0 0.5 1 1.5 2
12
9
5
10 0.5 1 1.5 2
−20
0
20
40
time (sec)
(f) sum of energy of mfcc channel 6,7 and 8
100
200
300
−10
0
10
snore
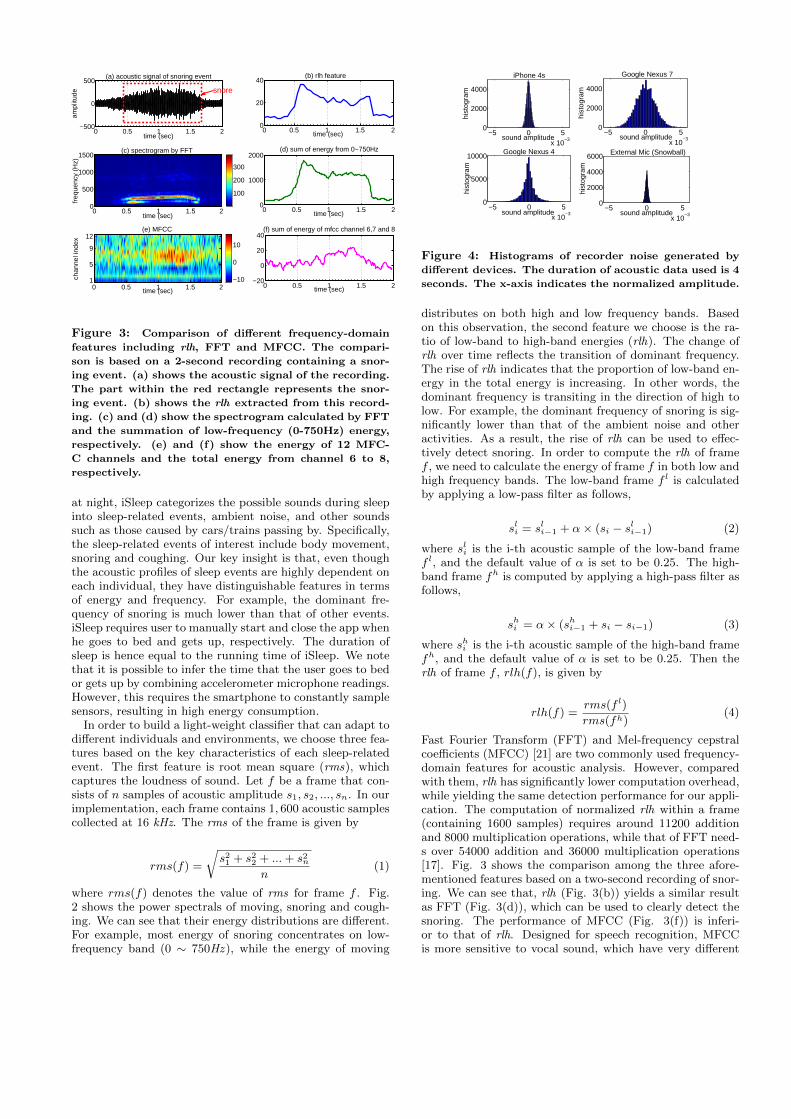
Figure 3: Comparison of different frequency-domain
features including rlh, FFT and MFCC. The compari-
son is based on a 2-second recording containing a snor-
ing event. (a) shows the acoustic signal of the recording.
The part within the red rectangle represents the snor-
ing event. (b) shows the rlh extracted from this record-
ing. (c) and (d) show the spectrogram calculated by FFT
and the summation of low-frequency (0-750Hz) energy,
respectively. (e) and (f) show the energy of 12 MFC-
C channels and the total energy from channel 6 to 8,
respectively.
at night, iSleep categorizes the possible sounds during sleepinto sleep-related events, ambient noise, and other soundssuch as those caused by cars/trains passing by. Specifically,the sleep-related events of interest include body movement,snoring and coughing. Our key insight is that, even thoughthe acoustic profiles of sleep events are highly dependent oneach individual, they have distinguishable features in termsof energy and frequency. For example, the dominant fre-quency of snoring is much lower than that of other events.iSleep requires user to manually start and close the app whenhe goes to bed and gets up, respectively. The duration ofsleep is hence equal to the running time of iSleep. We notethat it is possible to infer the time that the user goes to bedor gets up by combining accelerometer microphone readings.However, this requires the smartphone to constantly samplesensors, resulting in high energy consumption.
In order to build a light-weight classifier that can adapt todifferent individuals and environments, we choose three fea-tures based on the key characteristics of each sleep-relatedevent. The first feature is root mean square (rms), whichcaptures the loudness of sound. Let f be a frame that con-sists of n samples of acoustic amplitude s1, s2, ..., sn. In ourimplementation, each frame contains 1, 600 acoustic samplescollected at 16 kHz. The rms of the frame is given by
rms(f) =
√s21 + s22 + ...+ s2n
n(1)
where rms(f) denotes the value of rms for frame f . Fig.2 shows the power spectrals of moving, snoring and cough-ing. We can see that their energy distributions are different.For example, most energy of snoring concentrates on low-frequency band (0 ∼ 750Hz ), while the energy of moving
−5 0 5x 10
−3
0
2000
4000
sound amplitude
hist
ogra
m
iPhone 4s
−5 0 5x 10
−3
0
2000
4000
sound amplitude
hist
ogra
m
Google Nexus 7
−5 0 5x 10
−3
0
5000
10000
sound amplitude
hist
ogra
m
Google Nexus 4
−5 0 5x 10
−3
0
2000
4000
6000
sound amplitude
hist
ogra
m
External Mic (Snowball)
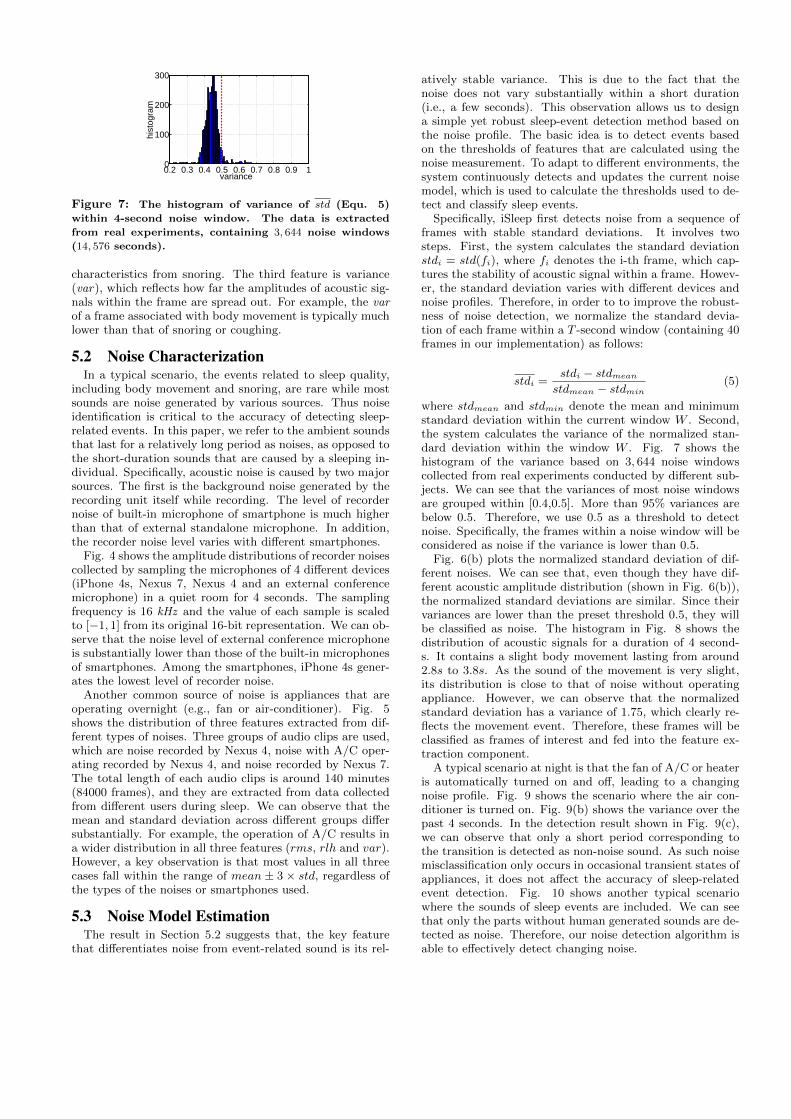
Figure 4: Histograms of recorder noise generated by
different devices. The duration of acoustic data used is 4
seconds. The x-axis indicates the normalized amplitude.
distributes on both high and low frequency bands. Basedon this observation, the second feature we choose is the ra-tio of low-band to high-band energies (rlh). The change ofrlh over time reflects the transition of dominant frequency.The rise of rlh indicates that the proportion of low-band en-ergy in the total energy is increasing. In other words, thedominant frequency is transiting in the direction of high tolow. For example, the dominant frequency of snoring is sig-nificantly lower than that of the ambient noise and otheractivities. As a result, the rise of rlh can be used to effec-tively detect snoring. In order to compute the rlh of framef , we need to calculate the energy of frame f in both low andhigh frequency bands. The low-band frame f l is calculatedby applying a low-pass filter as follows,
sli = sli−1 + α× (si − sli−1) (2)
where sli is the i-th acoustic sample of the low-band framef l, and the default value of α is set to be 0.25. The high-band frame fh is computed by applying a high-pass filter asfollows,
shi = α× (shi−1 + si − si−1) (3)
where shi is the i-th acoustic sample of the high-band framefh, and the default value of α is set to be 0.25. Then therlh of frame f , rlh(f), is given by
rlh(f) =rms(f l)
rms(fh)(4)
Fast Fourier Transform (FFT) and Mel-frequency cepstralcoefficients (MFCC) [21] are two commonly used frequency-domain features for acoustic analysis. However, comparedwith them, rlh has significantly lower computation overhead,while yielding the same detection performance for our appli-cation. The computation of normalized rlh within a frame(containing 1600 samples) requires around 11200 additionand 8000 multiplication operations, while that of FFT need-s over 54000 addition and 36000 multiplication operations[17]. Fig. 3 shows the comparison among the three afore-mentioned features based on a two-second recording of snor-ing. We can see that, rlh (Fig. 3(b)) yields a similar resultas FFT (Fig. 3(d)), which can be used to clearly detect thesnoring. The performance of MFCC (Fig. 3(f)) is inferi-or to that of rlh. Designed for speech recognition, MFCCis more sensitive to vocal sound, which have very different
0.2 0.3 0.4 0.5 0.6 0.7 0.8 0.9 10
100
200
300
variance
hist
ogra
m
Figure 7: The histogram of variance of std (Equ. 5)
within 4-second noise window. The data is extracted
from real experiments, containing 3, 644 noise windows
(14, 576 seconds).
characteristics from snoring. The third feature is variance(var), which reflects how far the amplitudes of acoustic sig-nals within the frame are spread out. For example, the varof a frame associated with body movement is typically muchlower than that of snoring or coughing.
5.2 Noise CharacterizationIn a typical scenario, the events related to sleep quality,
including body movement and snoring, are rare while mostsounds are noise generated by various sources. Thus noiseidentification is critical to the accuracy of detecting sleep-related events. In this paper, we refer to the ambient soundsthat last for a relatively long period as noises, as opposed tothe short-duration sounds that are caused by a sleeping in-dividual. Specifically, acoustic noise is caused by two majorsources. The first is the background noise generated by therecording unit itself while recording. The level of recordernoise of built-in microphone of smartphone is much higherthan that of external standalone microphone. In addition,the recorder noise level varies with different smartphones.
Fig. 4 shows the amplitude distributions of recorder noisescollected by sampling the microphones of 4 different devices(iPhone 4s, Nexus 7, Nexus 4 and an external conferencemicrophone) in a quiet room for 4 seconds. The samplingfrequency is 16 kHz and the value of each sample is scaledto [−1, 1] from its original 16-bit representation. We can ob-serve that the noise level of external conference microphoneis substantially lower than those of the built-in microphonesof smartphones. Among the smartphones, iPhone 4s gener-ates the lowest level of recorder noise.
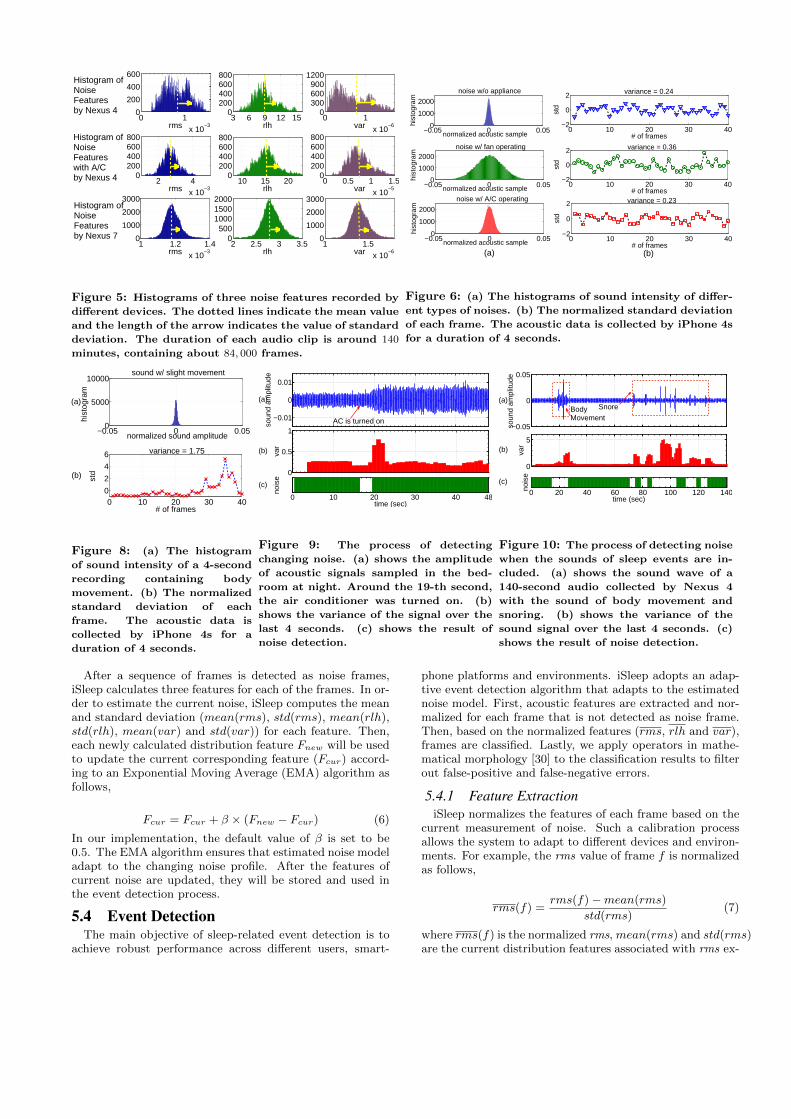
Another common source of noise is appliances that areoperating overnight (e.g., fan or air-conditioner). Fig. 5shows the distribution of three features extracted from dif-ferent types of noises. Three groups of audio clips are used,which are noise recorded by Nexus 4, noise with A/C oper-ating recorded by Nexus 4, and noise recorded by Nexus 7.The total length of each audio clips is around 140 minutes(84000 frames), and they are extracted from data collectedfrom different users during sleep. We can observe that themean and standard deviation across different groups differsubstantially. For example, the operation of A/C results ina wider distribution in all three features (rms, rlh and var).However, a key observation is that most values in all threecases fall within the range of mean ± 3 × std, regardless ofthe types of the noises or smartphones used.
5.3 Noise Model EstimationThe result in Section 5.2 suggests that, the key feature
that differentiates noise from event-related sound is its rel-
atively stable variance. This is due to the fact that thenoise does not vary substantially within a short duration(i.e., a few seconds). This observation allows us to designa simple yet robust sleep-event detection method based onthe noise profile. The basic idea is to detect events basedon the thresholds of features that are calculated using thenoise measurement. To adapt to different environments, thesystem continuously detects and updates the current noisemodel, which is used to calculate the thresholds used to de-tect and classify sleep events.
Specifically, iSleep first detects noise from a sequence offrames with stable standard deviations. It involves twosteps. First, the system calculates the standard deviationstdi = std(fi), where fi denotes the i-th frame, which cap-tures the stability of acoustic signal within a frame. Howev-er, the standard deviation varies with different devices andnoise profiles. Therefore, in order to to improve the robust-ness of noise detection, we normalize the standard devia-tion of each frame within a T -second window (containing 40frames in our implementation) as follows:
stdi =stdi − stdmean
stdmean − stdmin(5)
where stdmean and stdmin denote the mean and minimumstandard deviation within the current window W . Second,the system calculates the variance of the normalized stan-dard deviation within the window W . Fig. 7 shows thehistogram of the variance based on 3, 644 noise windowscollected from real experiments conducted by different sub-jects. We can see that the variances of most noise windowsare grouped within [0.4,0.5]. More than 95% variances arebelow 0.5. Therefore, we use 0.5 as a threshold to detectnoise. Specifically, the frames within a noise window will beconsidered as noise if the variance is lower than 0.5.
Fig. 6(b) plots the normalized standard deviation of dif-ferent noises. We can see that, even though they have dif-ferent acoustic amplitude distribution (shown in Fig. 6(b)),the normalized standard deviations are similar. Since theirvariances are lower than the preset threshold 0.5, they willbe classified as noise. The histogram in Fig. 8 shows thedistribution of acoustic signals for a duration of 4 second-s. It contains a slight body movement lasting from around2.8s to 3.8s. As the sound of the movement is very slight,its distribution is close to that of noise without operatingappliance. However, we can observe that the normalizedstandard deviation has a variance of 1.75, which clearly re-flects the movement event. Therefore, these frames will beclassified as frames of interest and fed into the feature ex-traction component.
A typical scenario at night is that the fan of A/C or heateris automatically turned on and off, leading to a changingnoise profile. Fig. 9 shows the scenario where the air con-ditioner is turned on. Fig. 9(b) shows the variance over thepast 4 seconds. In the detection result shown in Fig. 9(c),we can observe that only a short period corresponding tothe transition is detected as non-noise sound. As such noisemisclassification only occurs in occasional transient states ofappliances, it does not affect the accuracy of sleep-relatedevent detection. Fig. 10 shows another typical scenariowhere the sounds of sleep events are included. We can seethat only the parts without human generated sounds are de-tected as noise. Therefore, our noise detection algorithm isable to effectively detect changing noise.
0 1x 10
−3
0
200
400
600
rms3 6 9 12 15
0200400600800
rlh0 1
x 10−6
0300600900
1200
var
2 4x 10
−3
0200400600800
rms10 15 20
0200400600800
rlh0 0.5 1 1.5
x 10−5
0200400600800
var
1 1.2 1.4x 10
−3
0
1000
2000
3000
rms2 2.5 3 3.5
0500
100015002000
rlh1 1.5
x 10−6
0
1000
2000
3000
var
Histogram ofNoiseFeaturesby Nexus 7
Histogram ofNoiseFeatureswith A/Cby Nexus 4
Histogram ofNoiseFeaturesby Nexus 4
Figure 5: Histograms of three noise features recorded by
different devices. The dotted lines indicate the mean value
and the length of the arrow indicates the value of standard
deviation. The duration of each audio clip is around 140
minutes, containing about 84, 000 frames.
−0.05 0 0.050
1000
2000
hist
ogra
m
noise w/o appliance
0 10 20 30 40−2
0
2
# of frames
std
variance = 0.24
−0.05 0 0.050
1000
2000
hist
ogra
m
noise w/ fan operating
0 10 20 30 40−2
0
2
# of frames
std
variance = 0.36
−0.05 0 0.050
1000
2000
hist
ogra
m
noise w/ A/C operating
0 10 20 30 40−2
0
2
# of frames
std
variance = 0.23
(b)(a)
normalized acoustic sample
normalized acoustic sample
normalized acoustic sample
Figure 6: (a) The histograms of sound intensity of differ-
ent types of noises. (b) The normalized standard deviation
of each frame. The acoustic data is collected by iPhone 4s
for a duration of 4 seconds.
−0.05 0 0.050
5000
10000
normalized sound amplitude
hist
ogra
m
sound w/ slight movement
0 10 20 30 400
2
4
6
# of frames
std
variance = 1.75
(b)
(a)
Figure 8: (a) The histogram
of sound intensity of a 4-second
recording containing body
movement. (b) The normalized
standard deviation of each
frame. The acoustic data is
collected by iPhone 4s for a
duration of 4 seconds.
−0.01
0
0.01
soun
d am
plitu
de
0
0.5
1
var
0 10 20 30 40 48time (sec)
nois
e
AC is turned on
(a)
(b)
(c)
Figure 9: The process of detecting
changing noise. (a) shows the amplitude
of acoustic signals sampled in the bed-
room at night. Around the 19-th second,
the air conditioner was turned on. (b)
shows the variance of the signal over the
last 4 seconds. (c) shows the result of
noise detection.
−0.05
0
0.05
soun
d am
plitu
de
0
5
var
0 20 40 60 80 100 120 140time (sec)
nois
e
BodyMovement
(a)
(b)
(c)
Snore
Figure 10: The process of detecting noise
when the sounds of sleep events are in-
cluded. (a) shows the sound wave of a
140-second audio collected by Nexus 4
with the sound of body movement and
snoring. (b) shows the variance of the
sound signal over the last 4 seconds. (c)
shows the result of noise detection.
After a sequence of frames is detected as noise frames,iSleep calculates three features for each of the frames. In or-der to estimate the current noise, iSleep computes the meanand standard deviation (mean(rms), std(rms), mean(rlh),std(rlh), mean(var) and std(var)) for each feature. Then,each newly calculated distribution feature Fnew will be usedto update the current corresponding feature (Fcur) accord-ing to an Exponential Moving Average (EMA) algorithm asfollows,
Fcur = Fcur + β × (Fnew − Fcur) (6)
In our implementation, the default value of β is set to be0.5. The EMA algorithm ensures that estimated noise modeladapt to the changing noise profile. After the features ofcurrent noise are updated, they will be stored and used inthe event detection process.
5.4 Event DetectionThe main objective of sleep-related event detection is to
achieve robust performance across different users, smart-
phone platforms and environments. iSleep adopts an adap-tive event detection algorithm that adapts to the estimatednoise model. First, acoustic features are extracted and nor-malized for each frame that is not detected as noise frame.Then, based on the normalized features (rms, rlh and var),frames are classified. Lastly, we apply operators in mathe-matical morphology [30] to the classification results to filterout false-positive and false-negative errors.
5.4.1 Feature ExtractioniSleep normalizes the features of each frame based on the
current measurement of noise. Such a calibration processallows the system to adapt to different devices and environ-ments. For example, the rms value of frame f is normalizedas follows,
rms(f) =rms(f) −mean(rms)
std(rms)(7)
where rms(f) is the normalized rms, mean(rms) and std(rms)are the current distribution features associated with rms ex-
rlh
rms
varvar
Snore
Other
OtherCough
Move
1
2
3
4
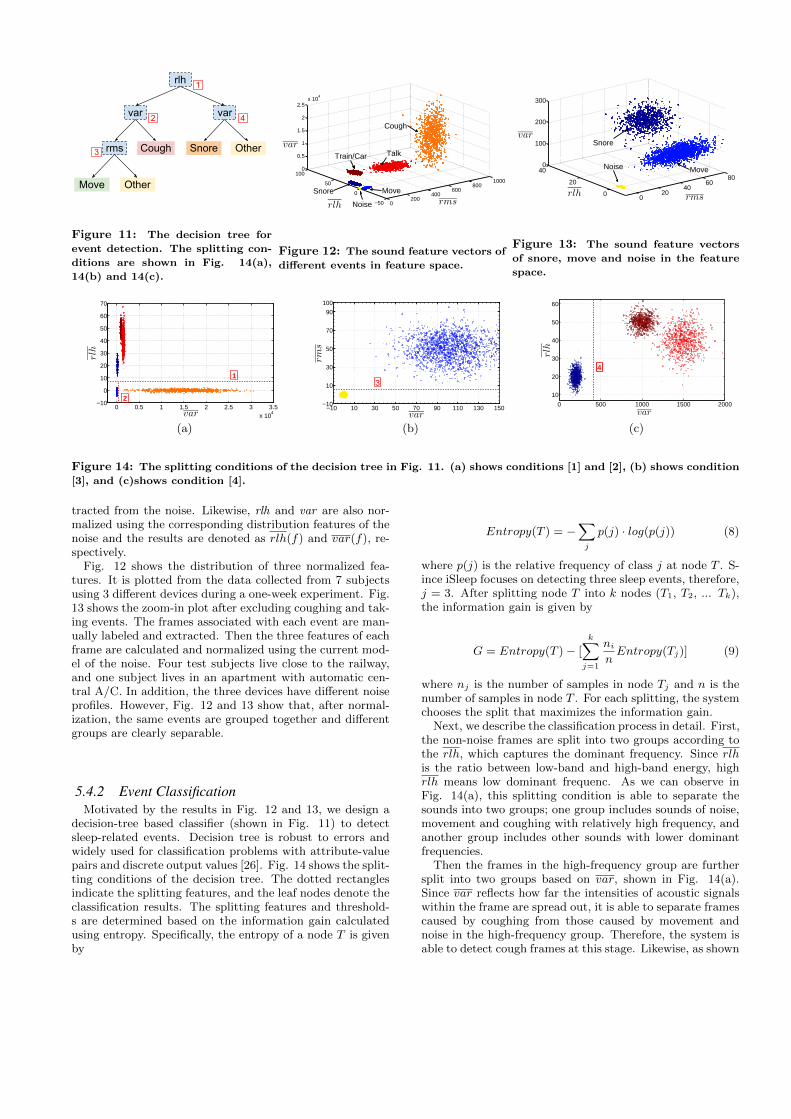
Figure 11: The decision tree for
event detection. The splitting con-
ditions are shown in Fig. 14(a),
14(b) and 14(c).
0200
400600
8001000
−50
0
50
1000
0.5
1
1.5
2
2.5x 10
4
Snore
Noise
Move
TalkTrain/Car
Cough
var
rlh rms
Figure 12: The sound feature vectors of
different events in feature space.
020
4060
80
0
20
400
100
200
300
Snore
Noise Move
rlh rms
var
Figure 13: The sound feature vectors
of snore, move and noise in the feature
space.
0 0.5 1 1.5 2 2.5 3 3.5x 10
4
−10
0
10
20
30
40
50
60
70
rlh
2
1
var
(a)
−10 10 30 50 70 90 110 130 150−10
10
30
50
70
90
100
var
rms
3
(b)
0 500 1000 1500 2000
10
20
30
40
50
60
rlh
4
var
(c)
Figure 14: The splitting conditions of the decision tree in Fig. 11. (a) shows conditions [1] and [2], (b) shows condition
[3], and (c)shows condition [4].
tracted from the noise. Likewise, rlh and var are also nor-malized using the corresponding distribution features of thenoise and the results are denoted as rlh(f) and var(f), re-spectively.
Fig. 12 shows the distribution of three normalized fea-tures. It is plotted from the data collected from 7 subjectsusing 3 different devices during a one-week experiment. Fig.13 shows the zoom-in plot after excluding coughing and tak-ing events. The frames associated with each event are man-ually labeled and extracted. Then the three features of eachframe are calculated and normalized using the current mod-el of the noise. Four test subjects live close to the railway,and one subject lives in an apartment with automatic cen-tral A/C. In addition, the three devices have different noiseprofiles. However, Fig. 12 and 13 show that, after normal-ization, the same events are grouped together and differentgroups are clearly separable.
5.4.2 Event ClassificationMotivated by the results in Fig. 12 and 13, we design a
decision-tree based classifier (shown in Fig. 11) to detectsleep-related events. Decision tree is robust to errors andwidely used for classification problems with attribute-valuepairs and discrete output values [26]. Fig. 14 shows the split-ting conditions of the decision tree. The dotted rectanglesindicate the splitting features, and the leaf nodes denote theclassification results. The splitting features and threshold-s are determined based on the information gain calculatedusing entropy. Specifically, the entropy of a node T is givenby
Entropy(T ) = −∑j
p(j) · log(p(j)) (8)
where p(j) is the relative frequency of class j at node T . S-ince iSleep focuses on detecting three sleep events, therefore,j = 3. After splitting node T into k nodes (T1, T2, ... Tk),the information gain is given by
G = Entropy(T ) − [
k∑j=1
ni
nEntropy(Tj)] (9)
where nj is the number of samples in node Tj and n is thenumber of samples in node T . For each splitting, the systemchooses the split that maximizes the information gain.
Next, we describe the classification process in detail. First,the non-noise frames are split into two groups according tothe rlh, which captures the dominant frequency. Since rlhis the ratio between low-band and high-band energy, highrlh means low dominant frequenc. As we can observe inFig. 14(a), this splitting condition is able to separate thesounds into two groups; one group includes sounds of noise,movement and coughing with relatively high frequency, andanother group includes other sounds with lower dominantfrequencies.
Then the frames in the high-frequency group are furthersplit into two groups based on var, shown in Fig. 14(a).Since var reflects how far the intensities of acoustic signalswithin the frame are spread out, it is able to separate framescaused by coughing from those caused by movement andnoise in the high-frequency group. Therefore, the system isable to detect cough frames at this stage. Likewise, as shown
0 1 2 3 4 5 6 7 80
306090
120
Act
ivity
Sco
re
0 1 2 3 4 5 6 7 801234
D
0 1 2 3 4 5 6 7 8SleepWake
Time (hr)
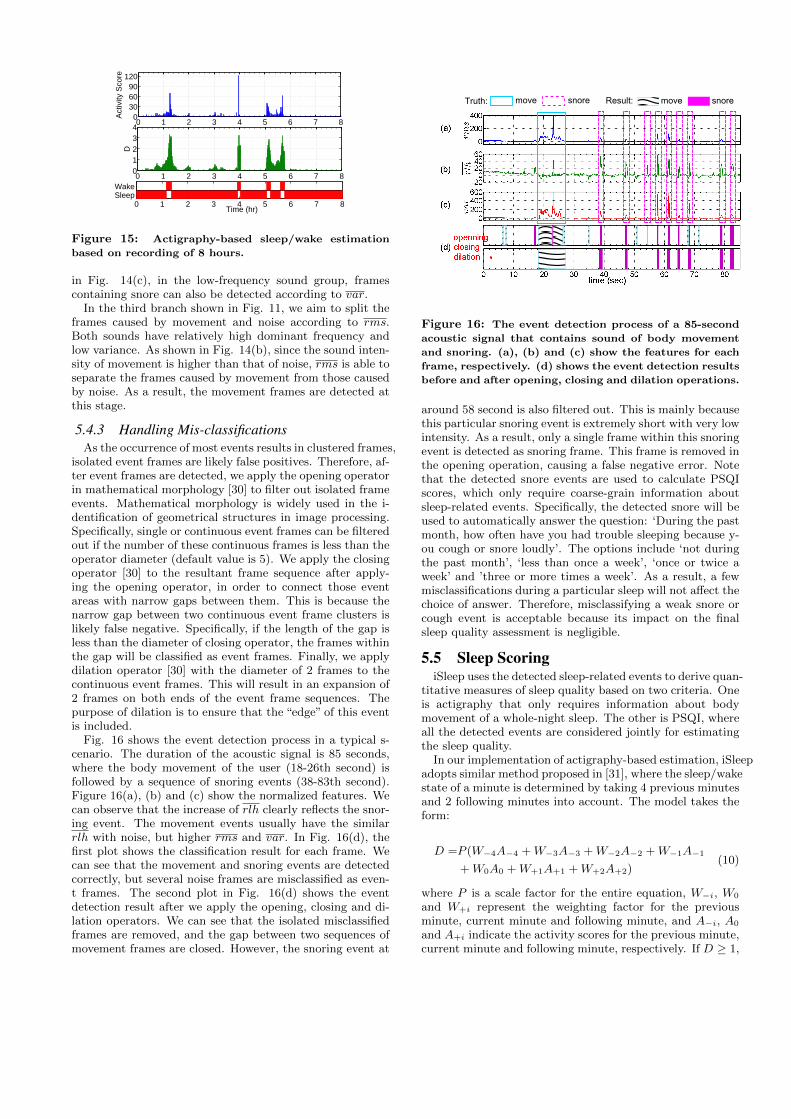
Figure 15: Actigraphy-based sleep/wake estimation
based on recording of 8 hours.
in Fig. 14(c), in the low-frequency sound group, framescontaining snore can also be detected according to var.
In the third branch shown in Fig. 11, we aim to split theframes caused by movement and noise according to rms.Both sounds have relatively high dominant frequency andlow variance. As shown in Fig. 14(b), since the sound inten-sity of movement is higher than that of noise, rms is able toseparate the frames caused by movement from those causedby noise. As a result, the movement frames are detected atthis stage.
5.4.3 Handling Mis-classificationsAs the occurrence of most events results in clustered frames,
isolated event frames are likely false positives. Therefore, af-ter event frames are detected, we apply the opening operatorin mathematical morphology [30] to filter out isolated frameevents. Mathematical morphology is widely used in the i-dentification of geometrical structures in image processing.Specifically, single or continuous event frames can be filteredout if the number of these continuous frames is less than theoperator diameter (default value is 5). We apply the closingoperator [30] to the resultant frame sequence after apply-ing the opening operator, in order to connect those eventareas with narrow gaps between them. This is because thenarrow gap between two continuous event frame clusters islikely false negative. Specifically, if the length of the gap isless than the diameter of closing operator, the frames withinthe gap will be classified as event frames. Finally, we applydilation operator [30] with the diameter of 2 frames to thecontinuous event frames. This will result in an expansion of2 frames on both ends of the event frame sequences. Thepurpose of dilation is to ensure that the “edge” of this eventis included.
Fig. 16 shows the event detection process in a typical s-cenario. The duration of the acoustic signal is 85 seconds,where the body movement of the user (18-26th second) isfollowed by a sequence of snoring events (38-83th second).Figure 16(a), (b) and (c) show the normalized features. Wecan observe that the increase of rlh clearly reflects the snor-ing event. The movement events usually have the similarrlh with noise, but higher rms and var. In Fig. 16(d), thefirst plot shows the classification result for each frame. Wecan see that the movement and snoring events are detectedcorrectly, but several noise frames are misclassified as even-t frames. The second plot in Fig. 16(d) shows the eventdetection result after we apply the opening, closing and di-lation operators. We can see that the isolated misclassifiedframes are removed, and the gap between two sequences ofmovement frames are closed. However, the snoring event at
move snore move snoreTruth: Result:
Figure 16: The event detection process of a 85-second
acoustic signal that contains sound of body movement
and snoring. (a), (b) and (c) show the features for each
frame, respectively. (d) shows the event detection results
before and after opening, closing and dilation operations.
around 58 second is also filtered out. This is mainly becausethis particular snoring event is extremely short with very lowintensity. As a result, only a single frame within this snoringevent is detected as snoring frame. This frame is removed inthe opening operation, causing a false negative error. Notethat the detected snore events are used to calculate PSQIscores, which only require coarse-grain information aboutsleep-related events. Specifically, the detected snore will beused to automatically answer the question: ‘During the pastmonth, how often have you had trouble sleeping because y-ou cough or snore loudly’. The options include ‘not duringthe past month’, ‘less than once a week’, ‘once or twice aweek’ and ’three or more times a week’. As a result, a fewmisclassifications during a particular sleep will not affect thechoice of answer. Therefore, misclassifying a weak snore orcough event is acceptable because its impact on the finalsleep quality assessment is negligible.
5.5 Sleep ScoringiSleep uses the detected sleep-related events to derive quan-
titative measures of sleep quality based on two criteria. Oneis actigraphy that only requires information about bodymovement of a whole-night sleep. The other is PSQI, whereall the detected events are considered jointly for estimatingthe sleep quality.
In our implementation of actigraphy-based estimation, iSleepadopts similar method proposed in [31], where the sleep/wakestate of a minute is determined by taking 4 previous minutesand 2 following minutes into account. The model takes theform:
D =P (W−4A−4 +W−3A−3 +W−2A−2 +W−1A−1
+W0A0 +W+1A+1 +W+2A+2)(10)
where P is a scale factor for the entire equation, W−i, W0
and W+i represent the weighting factor for the previousminute, current minute and following minute, and A−i, A0
and A+i indicate the activity scores for the previous minute,current minute and following minute, respectively. If D ≥ 1,
A1 Time to go bed at nightA2 Minutes taken to fall asleepA3 Get-up time in the morningA4 Hours of actual sleep per nightB1 Cannot sleep within 30 minitesB2 Wake up in the middle of the night or early morningB3 Cannot breath comfortablyB4 Cough or snore loudly
Table 1: Metrics from PSQI that iSleep uses to estimate
the sleep quality.
Duration of Sleep A4Sleep Disturbance B1, B2, B3, B4Sleep Latency A2, B1Sleep Efficiency A1, A3, A4
Table 2: The left column is the components in PSQI that
can be derived from detected events. The right column is
the metrics that are used to calculate the corresponding
component score.
the state of the current is determined as wake, whereasD ≤ 1 means the current minute is in sleep state. Themodel used in iSleep adopts the weighting factors suggestedin [31]. It takes the following form:
D =0.125(0.15A−4 + 0.15A−3 + 0.15A−2 + 0.08A−1
+ 0.21A0 + 0.12A+1 + 0.13A+2)(11)
where the activity score A is the number of frames associatedwith body movement in each minute. Fig. 15 shows theprediction of wake/sleep state over a 8-hour recording duringsleep. The first plot shows the calculated activity scores foreach minute. The second plot shows the calculated D valueby using Eqn. 10. The last plot is the sleep/wake estimationresult. We can see that the user changes from sleep state towake state 4 times throughout the night. The duration ofeach wake state lasts around 10 minutes. The sleep efficiencyis defined as the ratio of actual sleep time to total in-bedtime:
Sleep Efficiency =Tsleep
Tsleep + Twake(12)
For the long-term sleep quality estimation, iSleep calcu-lates the scores of 4 components listed in Table 2 from PSQI.In order to calculate the component scores, iSleep measuresthe metrics listed in Table. 1 based on the detected events.However, some of the metrics used to calculate the score ofSleep Disturbance can not be measured by iSleep. For ex-ample, some of them are related to the bedroom’s temper-ature, whether having dream, or feeling pain during sleep.As a result, instead of using the 9 metrics, iSleep uses only4 metrics that can be inferred from the detected events andscales the score by multiplying 9
4. The scoring rules of the
other components are the same as specified in PSQI.
6. IMPLEMENTATIONiSleep is implemented on Android 4.2.2 Jelly Bean. The
application file has a size of around 1 MB and takes 2.7MB storage on the phone after installed. It requires about20 MB RAM allocation while running. The displaying andprocessing functions are implemented in separate threads toensure the timeliness of acoustic sampling and processing.
(a) (b) (c)
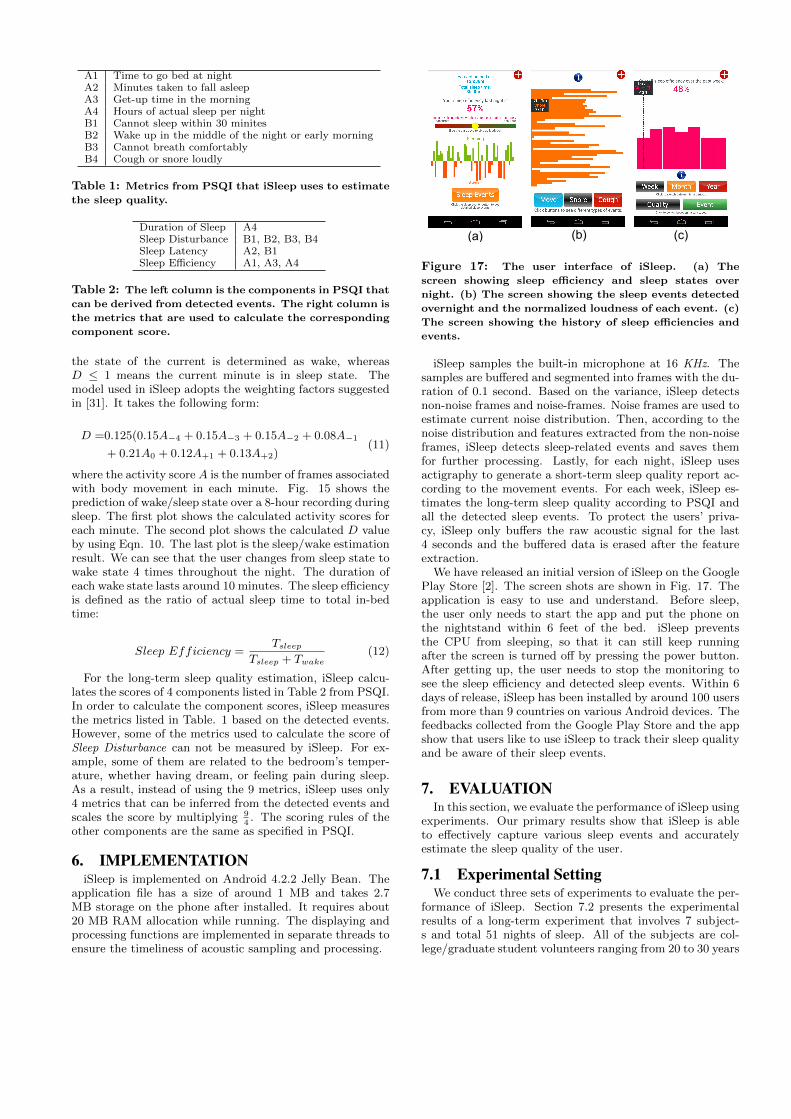
Figure 17: The user interface of iSleep. (a) The
screen showing sleep efficiency and sleep states over
night. (b) The screen showing the sleep events detected
overnight and the normalized loudness of each event. (c)
The screen showing the history of sleep efficiencies and
events.
iSleep samples the built-in microphone at 16 KHz. Thesamples are buffered and segmented into frames with the du-ration of 0.1 second. Based on the variance, iSleep detectsnon-noise frames and noise-frames. Noise frames are used toestimate current noise distribution. Then, according to thenoise distribution and features extracted from the non-noiseframes, iSleep detects sleep-related events and saves themfor further processing. Lastly, for each night, iSleep usesactigraphy to generate a short-term sleep quality report ac-cording to the movement events. For each week, iSleep es-timates the long-term sleep quality according to PSQI andall the detected sleep events. To protect the users’ priva-cy, iSleep only buffers the raw acoustic signal for the last4 seconds and the buffered data is erased after the featureextraction.
We have released an initial version of iSleep on the GooglePlay Store [2]. The screen shots are shown in Fig. 17. Theapplication is easy to use and understand. Before sleep,the user only needs to start the app and put the phone onthe nightstand within 6 feet of the bed. iSleep preventsthe CPU from sleeping, so that it can still keep runningafter the screen is turned off by pressing the power button.After getting up, the user needs to stop the monitoring tosee the sleep efficiency and detected sleep events. Within 6days of release, iSleep has been installed by around 100 usersfrom more than 9 countries on various Android devices. Thefeedbacks collected from the Google Play Store and the appshow that users like to use iSleep to track their sleep qualityand be aware of their sleep events.
7. EVALUATIONIn this section, we evaluate the performance of iSleep using
experiments. Our primary results show that iSleep is ableto effectively capture various sleep events and accuratelyestimate the sleep quality of the user.
7.1 Experimental SettingWe conduct three sets of experiments to evaluate the per-
formance of iSleep. Section 7.2 presents the experimentalresults of a long-term experiment that involves 7 subject-s and total 51 nights of sleep. All of the subjects are col-lege/graduate student volunteers ranging from 20 to 30 years
50
75
100
0
60
120
0
40
80
1 2 3 4 5 6 7 8 9 10 11 12 130
2040
user1
user2
user3
user4
user5
user6
user7coughevents(d)
snoreevents
(c)
move(sec)(b)
(a)
time (night)
sleepeff. (%)
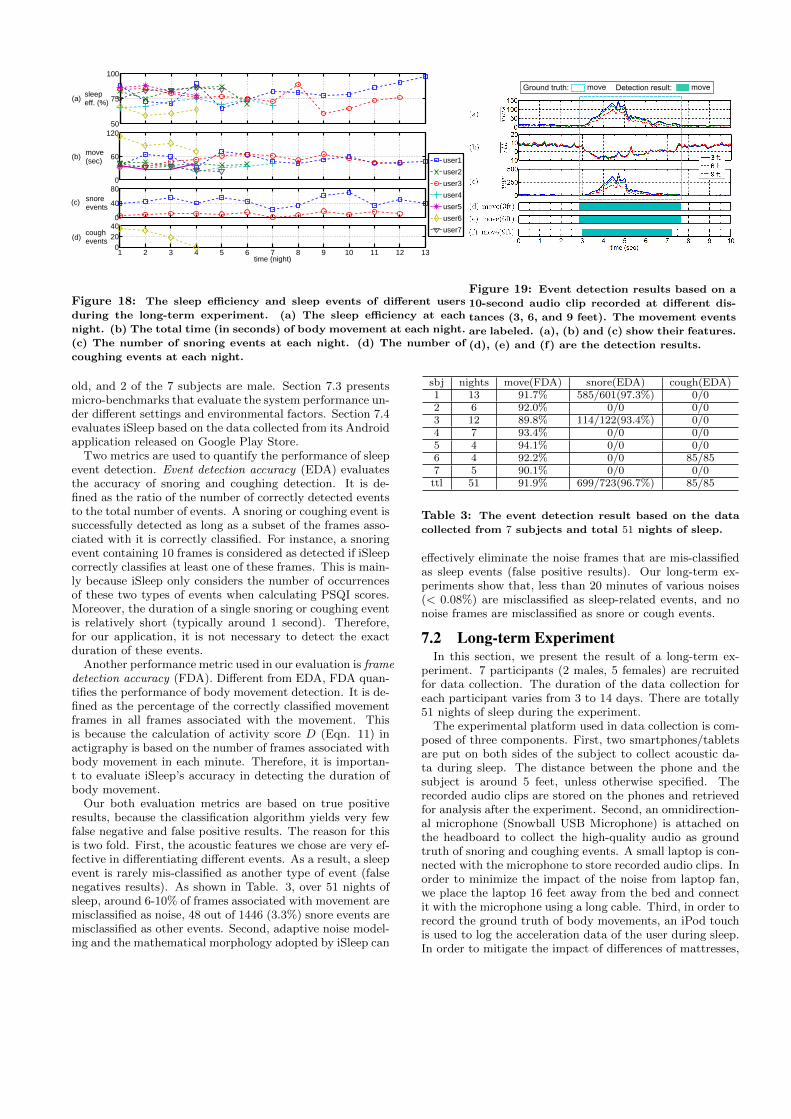
Figure 18: The sleep efficiency and sleep events of different users
during the long-term experiment. (a) The sleep efficiency at each
night. (b) The total time (in seconds) of body movement at each night.
(c) The number of snoring events at each night. (d) The number of
coughing events at each night.
Ground truth: Detection result:move move
Figure 19: Event detection results based on a
10-second audio clip recorded at different dis-
tances (3, 6, and 9 feet). The movement events
are labeled. (a), (b) and (c) show their features.
(d), (e) and (f) are the detection results.
old, and 2 of the 7 subjects are male. Section 7.3 presentsmicro-benchmarks that evaluate the system performance un-der different settings and environmental factors. Section 7.4evaluates iSleep based on the data collected from its Androidapplication released on Google Play Store.
Two metrics are used to quantify the performance of sleepevent detection. Event detection accuracy (EDA) evaluatesthe accuracy of snoring and coughing detection. It is de-fined as the ratio of the number of correctly detected eventsto the total number of events. A snoring or coughing event issuccessfully detected as long as a subset of the frames asso-ciated with it is correctly classified. For instance, a snoringevent containing 10 frames is considered as detected if iSleepcorrectly classifies at least one of these frames. This is main-ly because iSleep only considers the number of occurrencesof these two types of events when calculating PSQI scores.Moreover, the duration of a single snoring or coughing eventis relatively short (typically around 1 second). Therefore,for our application, it is not necessary to detect the exactduration of these events.
Another performance metric used in our evaluation is framedetection accuracy (FDA). Different from EDA, FDA quan-tifies the performance of body movement detection. It is de-fined as the percentage of the correctly classified movementframes in all frames associated with the movement. Thisis because the calculation of activity score D (Eqn. 11) inactigraphy is based on the number of frames associated withbody movement in each minute. Therefore, it is importan-t to evaluate iSleep’s accuracy in detecting the duration ofbody movement.
Our both evaluation metrics are based on true positiveresults, because the classification algorithm yields very fewfalse negative and false positive results. The reason for thisis two fold. First, the acoustic features we chose are very ef-fective in differentiating different events. As a result, a sleepevent is rarely mis-classified as another type of event (falsenegatives results). As shown in Table. 3, over 51 nights ofsleep, around 6-10% of frames associated with movement aremisclassified as noise, 48 out of 1446 (3.3%) snore events aremisclassified as other events. Second, adaptive noise model-ing and the mathematical morphology adopted by iSleep can
sbj nights move(FDA) snore(EDA) cough(EDA)1 13 91.7% 585/601(97.3%) 0/02 6 92.0% 0/0 0/03 12 89.8% 114/122(93.4%) 0/04 7 93.4% 0/0 0/05 4 94.1% 0/0 0/06 4 92.2% 0/0 85/857 5 90.1% 0/0 0/0
ttl 51 91.9% 699/723(96.7%) 85/85
Table 3: The event detection result based on the data
collected from 7 subjects and total 51 nights of sleep.
effectively eliminate the noise frames that are mis-classifiedas sleep events (false positive results). Our long-term ex-periments show that, less than 20 minutes of various noises(< 0.08%) are misclassified as sleep-related events, and nonoise frames are misclassified as snore or cough events.
7.2 Long-term ExperimentIn this section, we present the result of a long-term ex-
periment. 7 participants (2 males, 5 females) are recruitedfor data collection. The duration of the data collection foreach participant varies from 3 to 14 days. There are totally51 nights of sleep during the experiment.
The experimental platform used in data collection is com-posed of three components. First, two smartphones/tabletsare put on both sides of the subject to collect acoustic da-ta during sleep. The distance between the phone and thesubject is around 5 feet, unless otherwise specified. Therecorded audio clips are stored on the phones and retrievedfor analysis after the experiment. Second, an omnidirection-al microphone (Snowball USB Microphone) is attached onthe headboard to collect the high-quality audio as groundtruth of snoring and coughing events. A small laptop is con-nected with the microphone to store recorded audio clips. Inorder to minimize the impact of the noise from laptop fan,we place the laptop 16 feet away from the bed and connectit with the microphone using a long cable. Third, in order torecord the ground truth of body movements, an iPod touchis used to log the acceleration data of the user during sleep.In order to mitigate the impact of differences of mattresses,
time
(nig
ht)
(a)user 1
wakesnore
sleep
coughtim
e (n
ight
)
(b)user 6
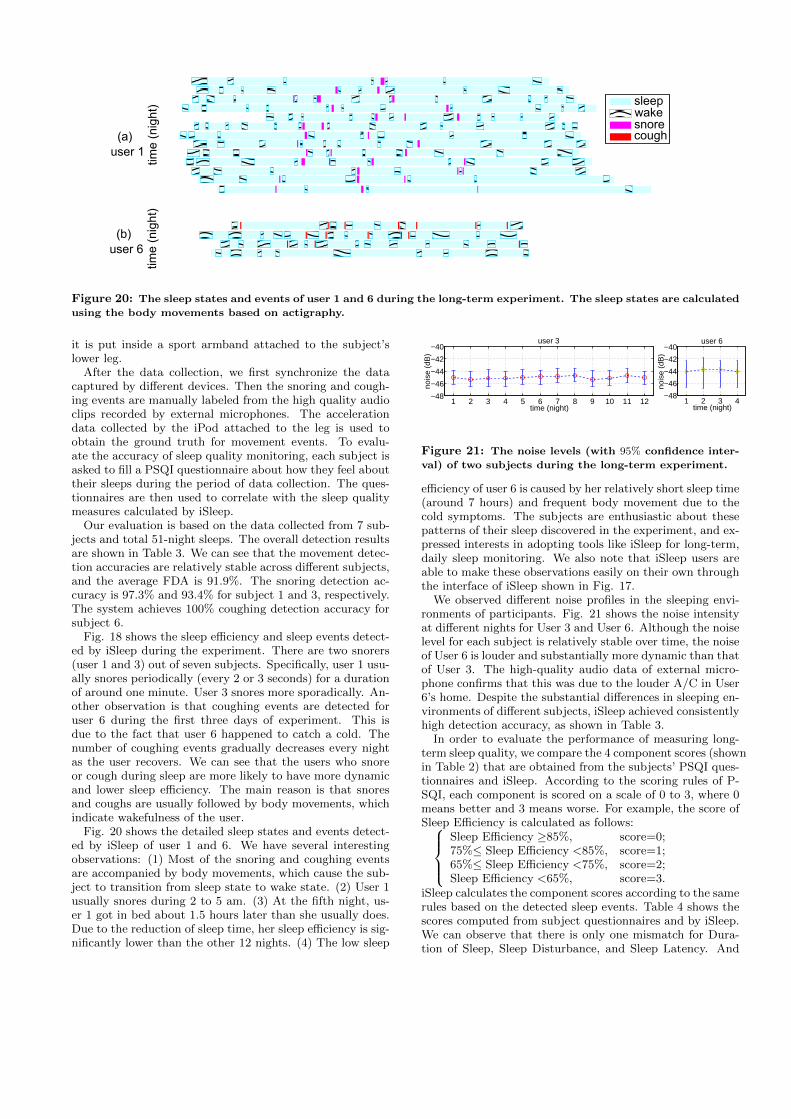
Figure 20: The sleep states and events of user 1 and 6 during the long-term experiment. The sleep states are calculated
using the body movements based on actigraphy.
it is put inside a sport armband attached to the subject’slower leg.
After the data collection, we first synchronize the datacaptured by different devices. Then the snoring and cough-ing events are manually labeled from the high quality audioclips recorded by external microphones. The accelerationdata collected by the iPod attached to the leg is used toobtain the ground truth for movement events. To evalu-ate the accuracy of sleep quality monitoring, each subject isasked to fill a PSQI questionnaire about how they feel abouttheir sleeps during the period of data collection. The ques-tionnaires are then used to correlate with the sleep qualitymeasures calculated by iSleep.
Our evaluation is based on the data collected from 7 sub-jects and total 51-night sleeps. The overall detection resultsare shown in Table 3. We can see that the movement detec-tion accuracies are relatively stable across different subjects,and the average FDA is 91.9%. The snoring detection ac-curacy is 97.3% and 93.4% for subject 1 and 3, respectively.The system achieves 100% coughing detection accuracy forsubject 6.
Fig. 18 shows the sleep efficiency and sleep events detect-ed by iSleep during the experiment. There are two snorers(user 1 and 3) out of seven subjects. Specifically, user 1 usu-ally snores periodically (every 2 or 3 seconds) for a durationof around one minute. User 3 snores more sporadically. An-other observation is that coughing events are detected foruser 6 during the first three days of experiment. This isdue to the fact that user 6 happened to catch a cold. Thenumber of coughing events gradually decreases every nightas the user recovers. We can see that the users who snoreor cough during sleep are more likely to have more dynamicand lower sleep efficiency. The main reason is that snoresand coughs are usually followed by body movements, whichindicate wakefulness of the user.
Fig. 20 shows the detailed sleep states and events detect-ed by iSleep of user 1 and 6. We have several interestingobservations: (1) Most of the snoring and coughing eventsare accompanied by body movements, which cause the sub-ject to transition from sleep state to wake state. (2) User 1usually snores during 2 to 5 am. (3) At the fifth night, us-er 1 got in bed about 1.5 hours later than she usually does.Due to the reduction of sleep time, her sleep efficiency is sig-nificantly lower than the other 12 nights. (4) The low sleep
1 2 3 4 5 6 7 8 9 10 11 12−48
−46
−44
−42
−40
time (night)
nois
e (d
B)
user 3
1 2 3 4−48
−46
−44
−42
−40
time (night)
nois
e (d
B)
user 6
Figure 21: The noise levels (with 95% confidence inter-
val) of two subjects during the long-term experiment.
efficiency of user 6 is caused by her relatively short sleep time(around 7 hours) and frequent body movement due to thecold symptoms. The subjects are enthusiastic about thesepatterns of their sleep discovered in the experiment, and ex-pressed interests in adopting tools like iSleep for long-term,daily sleep monitoring. We also note that iSleep users areable to make these observations easily on their own throughthe interface of iSleep shown in Fig. 17.
We observed different noise profiles in the sleeping envi-ronments of participants. Fig. 21 shows the noise intensityat different nights for User 3 and User 6. Although the noiselevel for each subject is relatively stable over time, the noiseof User 6 is louder and substantially more dynamic than thatof User 3. The high-quality audio data of external micro-phone confirms that this was due to the louder A/C in User6’s home. Despite the substantial differences in sleeping en-vironments of different subjects, iSleep achieved consistentlyhigh detection accuracy, as shown in Table 3.
In order to evaluate the performance of measuring long-term sleep quality, we compare the 4 component scores (shownin Table 2) that are obtained from the subjects’ PSQI ques-tionnaires and iSleep. According to the scoring rules of P-SQI, each component is scored on a scale of 0 to 3, where 0means better and 3 means worse. For example, the score ofSleep Efficiency is calculated as follows:
Sleep Efficiency ≥85%, score=0;75%≤ Sleep Efficiency <85%, score=1;65%≤ Sleep Efficiency <75%, score=2;Sleep Efficiency <65%, score=3.
iSleep calculates the component scores according to the samerules based on the detected sleep events. Table 4 shows thescores computed from subject questionnaires and by iSleep.We can observe that there is only one mismatch for Dura-tion of Sleep, Sleep Disturbance, and Sleep Latency. And
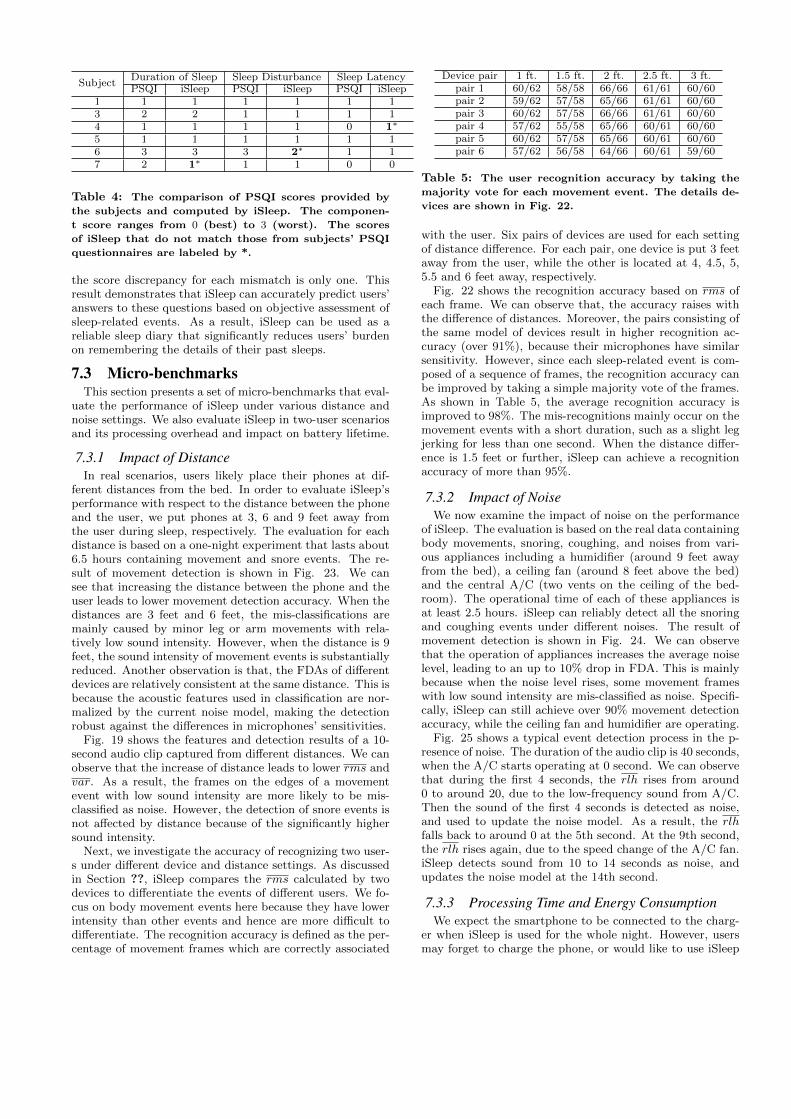
SubjectDuration of Sleep Sleep Disturbance Sleep LatencyPSQI iSleep PSQI iSleep PSQI iSleep
1 1 1 1 1 1 13 2 2 1 1 1 14 1 1 1 1 0 1∗
5 1 1 1 1 1 16 3 3 3 2∗ 1 17 2 1∗ 1 1 0 0
Table 4: The comparison of PSQI scores provided by
the subjects and computed by iSleep. The componen-
t score ranges from 0 (best) to 3 (worst). The scores
of iSleep that do not match those from subjects’ PSQI
questionnaires are labeled by *.
the score discrepancy for each mismatch is only one. Thisresult demonstrates that iSleep can accurately predict users’answers to these questions based on objective assessment ofsleep-related events. As a result, iSleep can be used as areliable sleep diary that significantly reduces users’ burdenon remembering the details of their past sleeps.
7.3 Micro-benchmarksThis section presents a set of micro-benchmarks that eval-
uate the performance of iSleep under various distance andnoise settings. We also evaluate iSleep in two-user scenariosand its processing overhead and impact on battery lifetime.
7.3.1 Impact of DistanceIn real scenarios, users likely place their phones at dif-
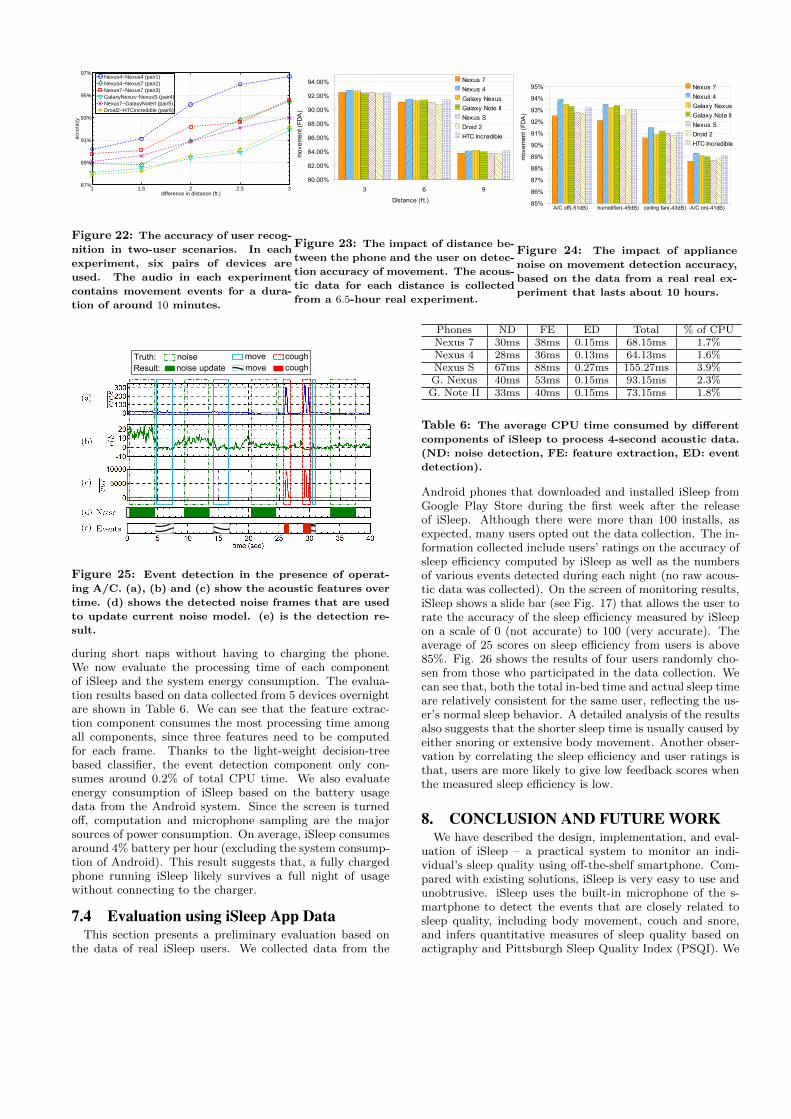
ferent distances from the bed. In order to evaluate iSleep’sperformance with respect to the distance between the phoneand the user, we put phones at 3, 6 and 9 feet away fromthe user during sleep, respectively. The evaluation for eachdistance is based on a one-night experiment that lasts about6.5 hours containing movement and snore events. The re-sult of movement detection is shown in Fig. 23. We cansee that increasing the distance between the phone and theuser leads to lower movement detection accuracy. When thedistances are 3 feet and 6 feet, the mis-classifications aremainly caused by minor leg or arm movements with rela-tively low sound intensity. However, when the distance is 9feet, the sound intensity of movement events is substantiallyreduced. Another observation is that, the FDAs of differentdevices are relatively consistent at the same distance. This isbecause the acoustic features used in classification are nor-malized by the current noise model, making the detectionrobust against the differences in microphones’ sensitivities.
Fig. 19 shows the features and detection results of a 10-second audio clip captured from different distances. We canobserve that the increase of distance leads to lower rms andvar. As a result, the frames on the edges of a movementevent with low sound intensity are more likely to be mis-classified as noise. However, the detection of snore events isnot affected by distance because of the significantly highersound intensity.
Next, we investigate the accuracy of recognizing two user-s under different device and distance settings. As discussedin Section ??, iSleep compares the rms calculated by twodevices to differentiate the events of different users. We fo-cus on body movement events here because they have lowerintensity than other events and hence are more difficult todifferentiate. The recognition accuracy is defined as the per-centage of movement frames which are correctly associated
Device pair 1 ft. 1.5 ft. 2 ft. 2.5 ft. 3 ft.pair 1 60/62 58/58 66/66 61/61 60/60pair 2 59/62 57/58 65/66 61/61 60/60pair 3 60/62 57/58 66/66 61/61 60/60pair 4 57/62 55/58 65/66 60/61 60/60pair 5 60/62 57/58 65/66 60/61 60/60pair 6 57/62 56/58 64/66 60/61 59/60
Table 5: The user recognition accuracy by taking the
majority vote for each movement event. The details de-
vices are shown in Fig. 22.
with the user. Six pairs of devices are used for each settingof distance difference. For each pair, one device is put 3 feetaway from the user, while the other is located at 4, 4.5, 5,5.5 and 6 feet away, respectively.
Fig. 22 shows the recognition accuracy based on rms ofeach frame. We can observe that, the accuracy raises withthe difference of distances. Moreover, the pairs consisting ofthe same model of devices result in higher recognition ac-curacy (over 91%), because their microphones have similarsensitivity. However, since each sleep-related event is com-posed of a sequence of frames, the recognition accuracy canbe improved by taking a simple majority vote of the frames.As shown in Table 5, the average recognition accuracy isimproved to 98%. The mis-recognitions mainly occur on themovement events with a short duration, such as a slight legjerking for less than one second. When the distance differ-ence is 1.5 feet or further, iSleep can achieve a recognitionaccuracy of more than 95%.
7.3.2 Impact of NoiseWe now examine the impact of noise on the performance
of iSleep. The evaluation is based on the real data containingbody movements, snoring, coughing, and noises from vari-ous appliances including a humidifier (around 9 feet awayfrom the bed), a ceiling fan (around 8 feet above the bed)and the central A/C (two vents on the ceiling of the bed-room). The operational time of each of these appliances isat least 2.5 hours. iSleep can reliably detect all the snoringand coughing events under different noises. The result ofmovement detection is shown in Fig. 24. We can observethat the operation of appliances increases the average noiselevel, leading to an up to 10% drop in FDA. This is mainlybecause when the noise level rises, some movement frameswith low sound intensity are mis-classified as noise. Specifi-cally, iSleep can still achieve over 90% movement detectionaccuracy, while the ceiling fan and humidifier are operating.
Fig. 25 shows a typical event detection process in the p-resence of noise. The duration of the audio clip is 40 seconds,when the A/C starts operating at 0 second. We can observethat during the first 4 seconds, the rlh rises from around0 to around 20, due to the low-frequency sound from A/C.Then the sound of the first 4 seconds is detected as noise,and used to update the noise model. As a result, the rlhfalls back to around 0 at the 5th second. At the 9th second,the rlh rises again, due to the speed change of the A/C fan.iSleep detects sound from 10 to 14 seconds as noise, andupdates the noise model at the 14th second.
7.3.3 Processing Time and Energy ConsumptionWe expect the smartphone to be connected to the charg-
er when iSleep is used for the whole night. However, usersmay forget to charge the phone, or would like to use iSleep
1 1.5 2 2.5 387%
89%
91%
93%
95%
97%
difference in distance (ft.)
accu
racy
Nexus4−Nexus4 (pair1)Nexus4−Nexus7 (pair2)Nexus7−Nexus7 (pair3)GalaxyNexus−NexusS (pair4)Nexus7−GalaxyNoteII (pair5)Droid2−HTCincredible (pair6)
Figure 22: The accuracy of user recog-
nition in two-user scenarios. In each
experiment, six pairs of devices are
used. The audio in each experiment
contains movement events for a dura-
tion of around 10 minutes.
3 6 9
80.00%
82.00%
84.00%
86.00%
88.00%
90.00%
92.00%
94.00% Nexus 7Nexus 4Galaxy NexusGalaxy Note IINexus SDroid 2HTC Incredible
Distance (f t.)
mov
emen
t (FD
A)
Figure 23: The impact of distance be-
tween the phone and the user on detec-
tion accuracy of movement. The acous-
tic data for each distance is collected
from a 6.5-hour real experiment.
85%
86%
87%
88%
89%
90%
91%
92%
93%
94%
95% Nexus 7Nexus 4Galaxy NexusGalaxy Note IINexus SDroid 2HTC Incredible
mov
emen
t (FD
A)
A/C off(-51dB) humidifier(-45dB) ceiling fan(-43dB) A/C on(-41dB)
Figure 24: The impact of appliance
noise on movement detection accuracy,
based on the data from a real real ex-
periment that lasts about 10 hours.
noise Truth: coughmove
Result: noise update move cough
Figure 25: Event detection in the presence of operat-
ing A/C. (a), (b) and (c) show the acoustic features over
time. (d) shows the detected noise frames that are used
to update current noise model. (e) is the detection re-
sult.
during short naps without having to charging the phone.We now evaluate the processing time of each componentof iSleep and the system energy consumption. The evalua-tion results based on data collected from 5 devices overnightare shown in Table 6. We can see that the feature extrac-tion component consumes the most processing time amongall components, since three features need to be computedfor each frame. Thanks to the light-weight decision-treebased classifier, the event detection component only con-sumes around 0.2% of total CPU time. We also evaluateenergy consumption of iSleep based on the battery usagedata from the Android system. Since the screen is turnedoff, computation and microphone sampling are the majorsources of power consumption. On average, iSleep consumesaround 4% battery per hour (excluding the system consump-tion of Android). This result suggests that, a fully chargedphone running iSleep likely survives a full night of usagewithout connecting to the charger.
7.4 Evaluation using iSleep App DataThis section presents a preliminary evaluation based on
the data of real iSleep users. We collected data from the
Phones ND FE ED Total % of CPUNexus 7 30ms 38ms 0.15ms 68.15ms 1.7%Nexus 4 28ms 36ms 0.13ms 64.13ms 1.6%Nexus S 67ms 88ms 0.27ms 155.27ms 3.9%G. Nexus 40ms 53ms 0.15ms 93.15ms 2.3%G. Note II 33ms 40ms 0.15ms 73.15ms 1.8%
Table 6: The average CPU time consumed by different
components of iSleep to process 4-second acoustic data.
(ND: noise detection, FE: feature extraction, ED: event
detection).
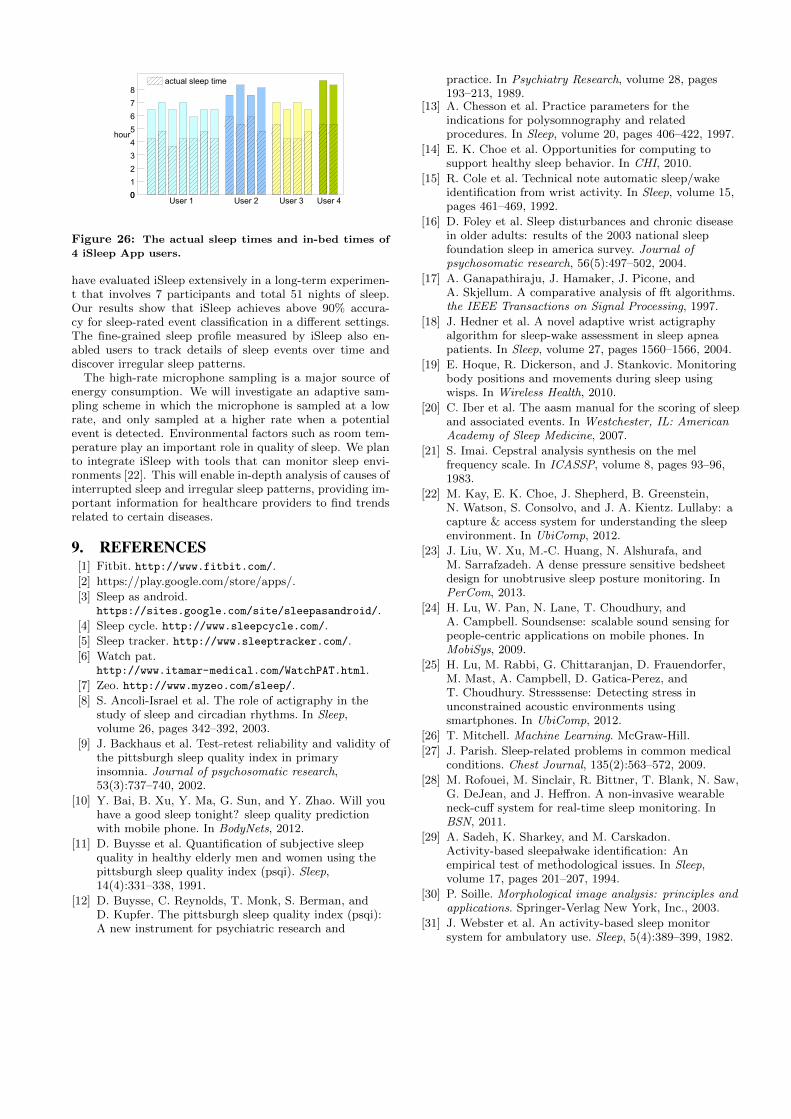
Android phones that downloaded and installed iSleep fromGoogle Play Store during the first week after the releaseof iSleep. Although there were more than 100 installs, asexpected, many users opted out the data collection. The in-formation collected include users’ ratings on the accuracy ofsleep efficiency computed by iSleep as well as the numbersof various events detected during each night (no raw acous-tic data was collected). On the screen of monitoring results,iSleep shows a slide bar (see Fig. 17) that allows the user torate the accuracy of the sleep efficiency measured by iSleepon a scale of 0 (not accurate) to 100 (very accurate). Theaverage of 25 scores on sleep efficiency from users is above85%. Fig. 26 shows the results of four users randomly cho-sen from those who participated in the data collection. Wecan see that, both the total in-bed time and actual sleep timeare relatively consistent for the same user, reflecting the us-er’s normal sleep behavior. A detailed analysis of the resultsalso suggests that the shorter sleep time is usually caused byeither snoring or extensive body movement. Another obser-vation by correlating the sleep efficiency and user ratings isthat, users are more likely to give low feedback scores whenthe measured sleep efficiency is low.
8. CONCLUSION AND FUTURE WORKWe have described the design, implementation, and eval-
uation of iSleep – a practical system to monitor an indi-vidual’s sleep quality using off-the-shelf smartphone. Com-pared with existing solutions, iSleep is very easy to use andunobtrusive. iSleep uses the built-in microphone of the s-martphone to detect the events that are closely related tosleep quality, including body movement, couch and snore,and infers quantitative measures of sleep quality based onactigraphy and Pittsburgh Sleep Quality Index (PSQI). We
User 2User 1 User 3 User 4
actual sleep time
010
2345678
hour
Figure 26: The actual sleep times and in-bed times of
4 iSleep App users.
have evaluated iSleep extensively in a long-term experimen-t that involves 7 participants and total 51 nights of sleep.Our results show that iSleep achieves above 90% accura-cy for sleep-rated event classification in a different settings.The fine-grained sleep profile measured by iSleep also en-abled users to track details of sleep events over time anddiscover irregular sleep patterns.
The high-rate microphone sampling is a major source ofenergy consumption. We will investigate an adaptive sam-pling scheme in which the microphone is sampled at a lowrate, and only sampled at a higher rate when a potentialevent is detected. Environmental factors such as room tem-perature play an important role in quality of sleep. We planto integrate iSleep with tools that can monitor sleep envi-ronments [22]. This will enable in-depth analysis of causes ofinterrupted sleep and irregular sleep patterns, providing im-portant information for healthcare providers to find trendsrelated to certain diseases.
9. REFERENCES[1] Fitbit. http://www.fitbit.com/.
[2] https://play.google.com/store/apps/.
[3] Sleep as android.https://sites.google.com/site/sleepasandroid/.
[4] Sleep cycle. http://www.sleepcycle.com/.
[5] Sleep tracker. http://www.sleeptracker.com/.
[6] Watch pat.http://www.itamar-medical.com/WatchPAT.html.
[7] Zeo. http://www.myzeo.com/sleep/.
[8] S. Ancoli-Israel et al. The role of actigraphy in thestudy of sleep and circadian rhythms. In Sleep,volume 26, pages 342–392, 2003.
[9] J. Backhaus et al. Test-retest reliability and validity ofthe pittsburgh sleep quality index in primaryinsomnia. Journal of psychosomatic research,53(3):737–740, 2002.
[10] Y. Bai, B. Xu, Y. Ma, G. Sun, and Y. Zhao. Will youhave a good sleep tonight? sleep quality predictionwith mobile phone. In BodyNets, 2012.
[11] D. Buysse et al. Quantification of subjective sleepquality in healthy elderly men and women using thepittsburgh sleep quality index (psqi). Sleep,14(4):331–338, 1991.
[12] D. Buysse, C. Reynolds, T. Monk, S. Berman, andD. Kupfer. The pittsburgh sleep quality index (psqi):A new instrument for psychiatric research and
practice. In Psychiatry Research, volume 28, pages193–213, 1989.
[13] A. Chesson et al. Practice parameters for theindications for polysomnography and relatedprocedures. In Sleep, volume 20, pages 406–422, 1997.
[14] E. K. Choe et al. Opportunities for computing tosupport healthy sleep behavior. In CHI, 2010.
[15] R. Cole et al. Technical note automatic sleep/wakeidentification from wrist activity. In Sleep, volume 15,pages 461–469, 1992.
[16] D. Foley et al. Sleep disturbances and chronic diseasein older adults: results of the 2003 national sleepfoundation sleep in america survey. Journal ofpsychosomatic research, 56(5):497–502, 2004.
[17] A. Ganapathiraju, J. Hamaker, J. Picone, andA. Skjellum. A comparative analysis of fft algorithms.the IEEE Transactions on Signal Processing, 1997.
[18] J. Hedner et al. A novel adaptive wrist actigraphyalgorithm for sleep-wake assessment in sleep apneapatients. In Sleep, volume 27, pages 1560–1566, 2004.
[19] E. Hoque, R. Dickerson, and J. Stankovic. Monitoringbody positions and movements during sleep usingwisps. In Wireless Health, 2010.
[20] C. Iber et al. The aasm manual for the scoring of sleepand associated events. In Westchester, IL: AmericanAcademy of Sleep Medicine, 2007.
[21] S. Imai. Cepstral analysis synthesis on the melfrequency scale. In ICASSP, volume 8, pages 93–96,1983.
[22] M. Kay, E. K. Choe, J. Shepherd, B. Greenstein,N. Watson, S. Consolvo, and J. A. Kientz. Lullaby: acapture & access system for understanding the sleepenvironment. In UbiComp, 2012.
[23] J. Liu, W. Xu, M.-C. Huang, N. Alshurafa, andM. Sarrafzadeh. A dense pressure sensitive bedsheetdesign for unobtrusive sleep posture monitoring. InPerCom, 2013.
[24] H. Lu, W. Pan, N. Lane, T. Choudhury, andA. Campbell. Soundsense: scalable sound sensing forpeople-centric applications on mobile phones. InMobiSys, 2009.
[25] H. Lu, M. Rabbi, G. Chittaranjan, D. Frauendorfer,M. Mast, A. Campbell, D. Gatica-Perez, andT. Choudhury. Stresssense: Detecting stress inunconstrained acoustic environments usingsmartphones. In UbiComp, 2012.
[26] T. Mitchell. Machine Learning. McGraw-Hill.
[27] J. Parish. Sleep-related problems in common medicalconditions. Chest Journal, 135(2):563–572, 2009.
[28] M. Rofouei, M. Sinclair, R. Bittner, T. Blank, N. Saw,G. DeJean, and J. Heffron. A non-invasive wearableneck-cuff system for real-time sleep monitoring. InBSN, 2011.
[29] A. Sadeh, K. Sharkey, and M. Carskadon.Activity-based sleep ↪a lwake identification: Anempirical test of methodological issues. In Sleep,volume 17, pages 201–207, 1994.
[30] P. Soille. Morphological image analysis: principles andapplications. Springer-Verlag New York, Inc., 2003.
[31] J. Webster et al. An activity-based sleep monitorsystem for ambulatory use. Sleep, 5(4):389–399, 1982.