iso 9001 : 2008 company floor t bose road, kolkata - 700
TRANSCRIPT

ISO 9001 : 2008 COMPANY
Regrstered Office ldeal Centre, 4th Floor t
9 A.J C Bose Road, Kolkata - 700 017T (033) 4063 2393 F (033) 2290 0383
E offi [email protected] www maithanalloys.com
CIN : 127101W81 985P1C03950324th November,2021
u2)The Secretary Listing DepartmentThe Calcutta Stock Exchange Limited National Stock Exchange of India Ltd..T,Lyons Range Exchange Plaza, Bandra-Kurla Complex,Kolkata 700 001 Bandra (E), Mumbai - 400 051Scrip code: 100?3915 Scrip code: MAITHANALL
Sub: Investor Presentdtion on Un-audited Financial Resultsfor the quarter and half year ended on 30th September, 202L
Dear Sir/Madam,
We are enclosing herewith the Investor Presentation on the Un-audited Financial Results for thequarter and half year ended on 30ft September,2021,.
This information is submitted to you pursuant to Regulation 30 of the Securities and ExchangeBoard of India (Listing Obligations and Disclosure Requirements) Regulations,2015.
This is for your information and appropriate dissemination.
Thanking you,
. Yours faithfully,
For Maithan Alloys Limited
t"/ ^'ryRajesh K. ShahCompany Secretary
Encl: af a
cc: The Corporate Relationship DepartmenBSE Limited1"t Floor, New Trading Ri.g, Rotunda Building,P.J. Towers, Dalal Street, Fort, Mumbai 400 001
Script Code: 590078
Works: Unrt-l PO Kalyaneshwari .713 369, Dist Burdwan (Wesl Bengal)Unit-ll E.P.l.P., Byrnihat, Dist. Ri-bhoi-793 101 (Meghalaya)
Unit-lll Plot No 42 & 43, APSEZ, PO. Atchutapuram, Dist. Visakhapatnam - 531 011 (A P)

Investor Presentation
November 2021

This presentation and the accompanying slides (the “Presentation”), which have been prepared by Maithan Alloys Limited (the “Company”), have been prepared solely for
information purposes and do not constitute any offer, recommendation or invitation to purchase or subscribe for any securities, and shall not form the basis or be relied on in
connection with any contract or binding commitment what so ever. No offering of securities of the Company will be made except by means of a statutory offering document
containing detailed information about the Company.
This Presentation has been prepared by the Company based on information and data which the Company considers reliable, but the Company makes no representation or warranty,
express or implied, whatsoever, and no reliance shall be placed on, the truth, accuracy, completeness, fairness and reasonableness of the contents of this Presentation. This
Presentation may not be all inclusive and may not contain all of the information that you may consider material. Any liability in respect of the contents of, or any omission from, this
Presentation is expressly excluded.
Certain matters discussed in this Presentation may contain statements regarding the Company’s market opportunity and business prospects that are individually and collectively
forward-looking statements. Such forward-looking statements are not guarantees of future performance and are subject to known and unknown risks, uncertainties and
assumptions that are difficult to predict. These risks and uncertainties include, but are not limited to, the performance of the Indian economy and of the economies of various
international markets, the performance of the industry in India and world-wide, competition, the company’s ability to successfully implement its strategy, the Company’s future
levels of growth and expansion, technological implementation, changes and advancements, changes in revenue, income or cash flows, the Company’s market preferences and its
exposure to market risks, as well as other risks. The Company’s actual results, levels of activity, performance or achievements could differ materially and adversely from results
expressed in or implied by this Presentation. The Company assumes no obligation to update any forward-looking information contained in this Presentation. Any forward-looking
statements and projections made by third parties included in this Presentation are not adopted by the Company and the Company is not responsible for such third party statements
and projections.
Safe Harbor
3
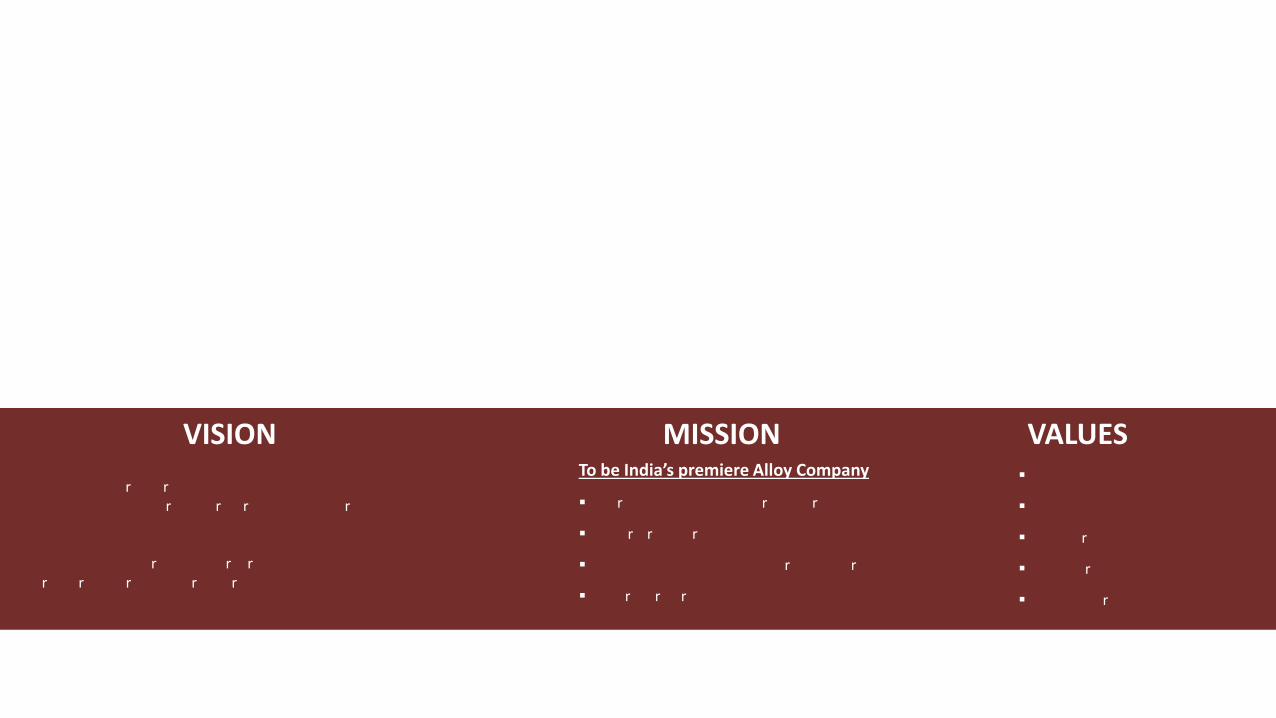
To be India’s premiere Alloy Company that is built on the solidfoundation of shareholder trust, customer commitment,employee satisfaction and sustainable communities
Consistently delivering on our promises backed by meticuloushard work is our motto for ensuring success always!
VISIONTo be India’s premiere Alloy Company
▪ Promising Excellent Shareholder Value
▪ Nurturing our Employees
▪ Utmost Commitment to our Customers
▪ Care for our Communities
MISSION VALUES▪ Commitment
▪ Loyalty
▪ Integrity
▪ Rigour
▪ Teamwork

Maintaining the Maithan Edge

Key Differentiators
5
Efficiency
Lowest in the Cost Curve
Optimum Capacity Utilization
Higher Tonnage product
Strong Credibility
Strong credibility in the market right from suppliers
to end customers
Optimising Facilities for Maximising
Returns
Source raw materials based on our product mix which largely
remains stable
PPAs with efficient power supplying utilities
Stable Asset turnover ratios with zero debt
Diversified Customer Base
International clients across 35 countries
Low Concentration Risk as exposure to no client is more than 10% of its
exports
Expanding into emerging Asian economies
Expansion Plans
Organic & Inorganic Growth Opportunities

Maithan Edge
6
Largest Manufacturer
India’s largest Manganese Alloy Producer and
Exporter
20 Years Rich Experience
Two decades of experience and
continuous growth
Niche Products
Basket of the most valuable Techno-
Commercial Products
Robust Balance Sheet
Net Cash CompanyCredit Rating:
CARE AA CRISIL AA
CARE/CRISIL A1+
Increased Stockholder’s Return Revenue Growth
Increased by
+8% CAGR
EBITDAIncreased by +28% CAGR
Profit After TaxIncreased by +54% CAGR
Net CashPosition of Rs. 867 Crores
as on September 2021
ROCE Increased by + 3,840 bps
ROE Increased by + 1,100 bps
CAGR calculated from FY2014 to FY2021

Product Offerings
7
Ferro Manganese
• An alloy of iron and manganese
• Used in steel products wherein silicon
content needs to be controlled at low levels
• Used in flat steel, manganese-rich steel and
stainless-steel manufacturing
Ferro Silicon
• An alloy of iron and silicon
• Silicon acts as a steel oxidant
• Used primarily in special steels and in small
quantities in mild steel
Ferro alloys enhance steel strength, durability, anti-corrosion and anti-stain properties and acts as de-oxidant for Steel Manufacturing
Silicon Manganese
• An alloy of silicon and manganese
• Cost-effective blend of silicon and
manganese
• Consumed in all steel products. Used in
higher quantities in 200 series stainless
steel, alloy steel and manganese steel

State of the Art Manufacturing Facilities
8
Visakhapatnam (SEZ)72.0 MVA
• Smelters: 4 x MVA 18.0 MVA
• Products: Ferro Manganese/ Silicon Manganese
• Raw Material: Maganese Ore, Coke, Coal
• Sourcing: Imports 90% ; Domestic 10%
• User Industry: Steel
Kalyaneshwari48.75 MVA
• Smelters: 2 x 5.0 MVA ; 1 x 6.5 MVA; 1 x 8.25 MVA ; 2 x 12.0 MVA
• Products: Ferro Manganese/ Silicon Manganese
• Raw Material : Maganese Ore, Coke, Coal
• Sourcing : Imports 65%, Domestic 35%
• User Industry: Steel
Byrnihat16.5 MVA
• Smelters: 2 x 8.2 MVA
• Products: Ferro Silicon
• Raw Material: Quartz, Coke, Coal
• Sourcing: Domestic 100%
• User Industry: Steel
• Quality Product • Variety of Grades Leading to better Product Mix• Logistic Advantage
WHY IMPORT ORE ?

Self Sustaining Business Model
9
Reaction in furnace and discharge of
molten metal
Sizing, Grading and Packing
Input of sized and graded Raw Material
Feed in day bins through conveyors
Automated Batch preparation and Charge
into Furnace
Pouring in cast iron and cooling of
ingots
Inspection and Dispatch
We have an ability to generate a
Larger Throughput
from our manufacturing facilities
Discharge of Slag
Ferro Manganese Slag
(Crushed)
Silico Manganese Slag
Land Filling Fly Ash Brick making
Lumpy Granulated
Strong Client Relationships
10
Association with SAIL and JSL being more than a decadeShift of focus from ‘Stable’ Europe to ‘Growing’ Asia
helping in better realizations
~100% of Domestic clients are associated with the Company
for over 7 years
Long term relationships with clients offers Competitive
Advantage
Low Concentration Risk in export markets with presence
in over 35 countries
75%Repeat Clients
“We are pleased to have formed a partnership with Maithan Alloys and we trulyappreciate their commitment to quality and customer service. They have put forthall efforts to accomplish our needs amid out dynamic priorities and have alwaysdelivered to the deadlines set by us.”
“From the beginning of our association with Maithan Alloy, we found the team to100% committed to achieving customer service at any cost. M/s. Maithan Alloysare extremely professional and competent. We are very impressed with theirability to include continuous improvement in work processes.”

Asian Economies to drive the Global Steel Demand
11
Source: www.worldsteel.org (World Steel Short Range Outlook October 2021)Note: Data for Global Finished Steel Demandg : growth for CY2022(f) vs CY2021(f)Note: Maps not to scale. All data, information, and maps are provided "as is" without warranty or any representation of accuracy, timeliness or completeness
Global Steel Demand 2022 Forecast : 1,896.4 Mn T

Advantage India
12
Anti-dumping Duty on Steel Products
India has become the 2nd largest steel producer in
CY20*
2021 Budget outlay of ~ Rs. 5.54 lakh crore in infrastructure to
drive domestic steel consumption
Steel Industry’s Outlook to increase capacity to 300 Mn T by 2030 to drive demand
for ferro alloys
‘Housing For All’ to drive housing demand thereby benefitting steel industry
India ranks 4th globally in terms of iron ore
production
India’s GDP to grow by +8.8 % (IMF) in FY22
100 % FDI allowed in the mining sector & exploration of metal & non-metal ores under the Automatic Route
*Source: www.worldsteel.org (World Steel Short Range Outlook October 2021)

Advantage Maithan
13
Alloy Producers to benefit from NSP 2017
122
300
FY 2030FY 2016
CAGR +6%
92
255
FY 2016 FY 2030
CAGR +7%
61
158
FY 2030FY 2016
CAGR +7%
Per Capita Consumption (kg)
Capacity (Mn MT) Production (Mn MT)
Reduce dependence on Steel imports and become
self sufficient in Steel production
Increase domestic availability of washed coking coal so as to reduce import dependence on
coking coal to 50%
Provide policy support & guidance to private
manufacturers, MSME Steel producers, CPSEs
Steel Ministry will facilitate R&D through the establishment of Steel Research & Technology
Mission of India (SRTMI)
Policy to increase consumption of Steel in
Infrastructure, Automobiles & Housing sector
~1.5% of Manganese Alloy is required to produce each tonne of Steel
Operating Efficiency
Better Product Mix
Strong Customer Relationships
Gaining Market Share Globally and Domestically
Maithan Alloys Production has grown
CAGR of 16% since 2007
Why Advantage Maithan…
World Crude Steel Demand
3% CAGRsince 2017
India Crude Steel Demand
Whereas…
7% CAGRsince 2017
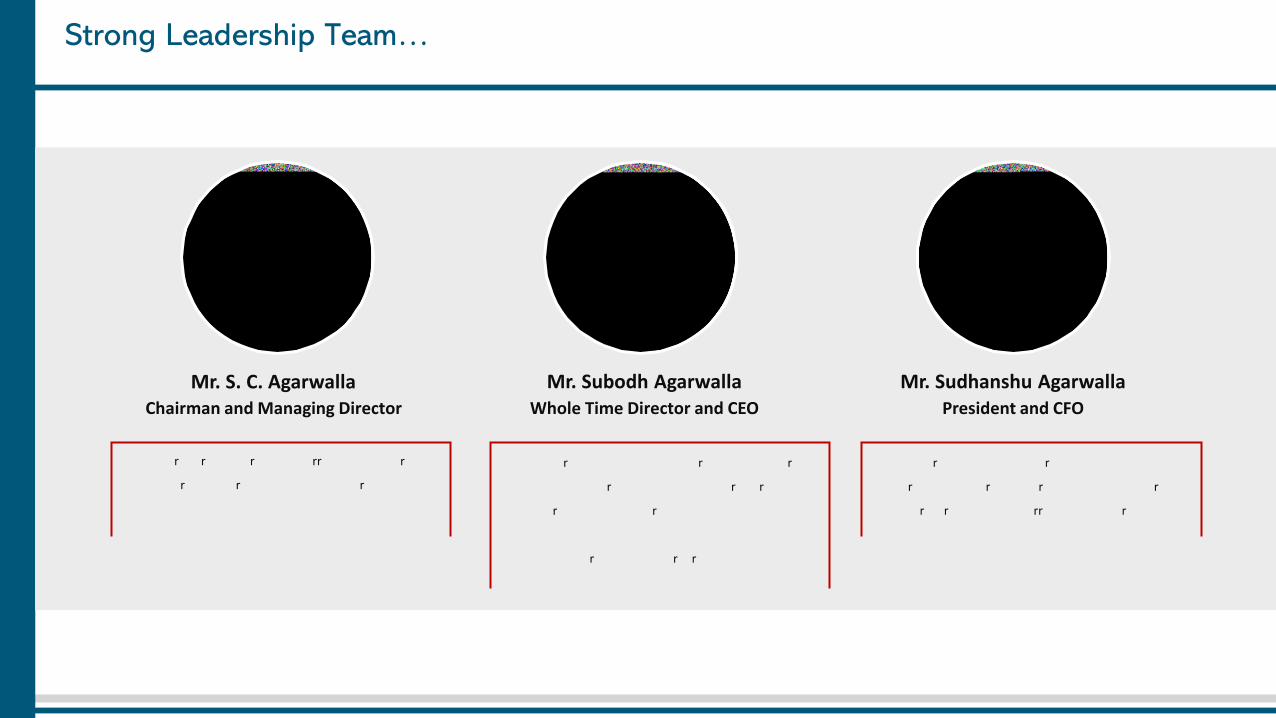
Strong Leadership Team…
14
Mr. S. C. AgarwallaChairman and Managing Director
• 30 years of rich experience in Ferro Alloys industry
• Has a strong understanding of business processes and
excellent communication and human management skills
Mr. Subodh AgarwallaWhole Time Director and CEO
Mr. Sudhanshu AgarwallaPresident and CFO
• B.Tech from IIT BHU and M.B.A. from IIM Bangalore
• At age of 43 years is the Whole Time Director and CEO
and strengthens the operational activities of the
Company
• Focuses on project setup, corporate planning and
business development, planning & budgeting
• M.B.A. from XLRI Jamshedpur
• More than 15 Years of experience in Finance, Marketing
and Procurement in the Ferro Alloys Industry

… with an Experienced Board
15
Mr. S. C. Agarwalla (Chairman and Managing Director)
• 30 years of rich experience in Ferro Alloys industry• Has a strong understanding of business processes
and excellent communication and human management skills
Mr. Subodh Agarwalla(Whole Time Director and CEO)
• B.Tech from IIT BHU and M.B.A. from IIM Bangalore
• Strengthens the operational activities of the Company
Mr. P. K. Venkatramani(Independent Director)
• Banking with specialty in Industrial Finance and staff training
• Foreign Exchange and Management Accountancy
Mrs. Kalpana Biswas Kundu (Independent Director)
Banking Sector, Accounts and Finance
Mr. Nand Kishore Agarwal(Independent Director)
Accounts, Finance and Tax Laws
Mr. Vivek Kaul(Independent Director)
Entrepreneurship and Entrepreneurship Ecosystem Development, industrial knowhow, application
development.
Mr. Ashok Bhandari(Independent Director)
Finance and negotiation with banks, governments and technology &
equipment suppliers
Mr. Srinivas Peddi( Non-Executive & Non Independent
Director)• Experienced in handling electrical equipment
and machineries of ferro alloys industry• Proficient in liaisoning with Local Bodies and
Government

Update on Auction of Impex Metal & Ferro Alloys Limited(IMFAL)
16
➢ The company emerged as a successful bidder for IMFAL having a capacity of 49,500 ton per annum of Silico Manganese located at Bobbli, Vizaianagram,
Andhra Pradesh. A sum of about Rs. 140 crore is estimated to fully rehabilitate the production facility. This compares favorably viz-a-viz establishing a
green field capacity on both time and cost fronts. The entire expenditure is being met from MAL’s internal resources
➢ Projected expenditure to be incurred by IMFAL is as follows:
➢ The work is progressing well and within budget and schedule. MAL is confident of commissioning IMFAL by January 2022. IMFAL is a one hundred
percent subsidiary of MAL and this additional capacity should make MAL the largest ferro alloy manufacturer in the country
Particulars Amount Incurred till
30.09.21Amount to be incurred Total
Payment to Bankers consortium 74.2 0.0 74.2
Repairs and Rehabilitation of facilities 16.5 19.3 35.8
Security Deposits 24.5 5.5 30.0
Sub-Total 115.2 24.8 140.0
Raw Material Purchased 5.9
Total 121.1

Financials

Consolidated Financial Highlights – Q2 FY22
18
409566
666
Q2 FY21 Q1 FY22 Q2 FY22
+18%
+63%
Rs. Crs
Total Revenue Operating EBITDA PAT
71
141
222
Q2 FY21 Q1 FY22 Q2 FY22
+57%
+213%
55
112
164
Q2 FY21 Q1 FY22 Q2 FY22
+46%
+199%
Mfg. Revenue Mfg. EBITDA
392493
571
Q2 FY21 Q1 FY22 Q2 FY22
+16%
+46%
70
141
215
Q2 FY21 Q1 FY22 Q2 FY22
+52%
+206%
17.3% 24.9% 33.3% 13.4% 19.8% 24.6%
17.8% 28.6% 37.6%
Margin
Highest Ever Quarterly Manufacturing EBITDA

Consolidated Financial Highlights – H1 FY22
19
675
1,232
H1 FY21 H1 FY22
+83%
Rs. Crs
Total Revenue Operating EBITDA PAT
112
363
H1 FY22H1 FY21
+223%
90
276
H1 FY22H1 FY21
+206%
Mfg. Revenue Mfg. EBITDA
644
1,064
H1 FY21 H1 FY22
+65%
112
356
H1 FY21 H1 FY22
+218%
16.6% 29.4% 13.4% 22.4%
17.4% 33.5%
Margin

Maintaining Sustainable Margins
20
18.3%19.2%
15.4%
11.8%
17.1%
28.8%
22.2% 22.5%
18.6%13.1%
19.2%
33.5%
19.1%20.5%
16.4%
12.2%
18.2%
32.7%
18.4%
20.3%
16.0%
12.0%
18.1%
32.6%
FY17 FY18 FY19 FY20 FY21 H1 FY22
Performance improved on the back of efficient cost
measures and better processes
Demand overpassed supply leading to
above normal industry growth
Supply catching up with demand leading
to Stable business scenario
Manufacturing EBITDA Operating EBIT
Manufacturing PBT Manufacturing EBIT
Long-term sustainable Manufacturing EBIT margin range is ~14%
Downward cycle characterised by start of shutting down of
capacities
Witnessed a strong recovery Q2 FY21
onwards post relaxation in lockdown
restrictions
Strong demand for ferro alloys driven by increased production from steel industries
and firm prices of finished products

Doing Profitable Business is the key…
21
8145
7 749
9
150
384
667 640
818873
Mar-17 Mar-19*Mar-18 Sep-21*Mar-20* Mar-21*
Total Debt Liquid AssetsRs. Crs
Debt & Liquid Assets
226
361
307
217 277
355
469 552458
609651
844
FY17 FY18 FY19 FY20 FY21 H1 FY22
EBIT Average Capital Employed
48.2% 65.4% 66.9%
Operating RoCE (%)
Higher Return Ratio is because of prudent capital allocation and superlative operating efficiency
Operating RoCE = EBIT / Average Capital Employed
EBIT = (EBIT – Other Income) Capital Employed = (Equity + Debt - Current Investments-cash and bank balances)
35.6%

Consolidated Financials – Q2 & H1 FY22
22
Particulars (Rs. Crs.) Q2 FY22 Q2 FY21 Q1 FY22 H1 FY22 H1 FY21
Revenue 666 409 566 1,232 675
Raw Material 265 213 279 544 341
Employee Expenses 19 10 14 33 18
Power 92 92 84 175 160
Other Expenses 69 23 48 117 43
Operating EBITDA 222 71 141 363 112
Depreciation 4 4 4 8 8
Operating EBIT 218 67 137 355 104
Other Income 7 4 10 17 12
Finance costs 0 0 0 1 0
PBT 224 71 147 371 116
Tax 60 16 35 95 26
PAT 164 55 112 276 90

23
Particulars (Rs. Crs.) FY21 FY20 FY19 FY18 FY17
Revenue (Net of Excise Duty/ GST) 1,620 1,831 1,988 1,879 1,342
Raw Material 841 1,067 1,126 970 628
Employee Expenses 41 42 44 45 33
Power 332 361 373 367 280
Other Expenses 114 128 122 121 130
Operating EBITDA 292 233 323 376 271
Depreciation 16 16 16 15 25
Operating EBIT 276 217 307 361 246
Other Income 24 66 26 19 8
Finance costs 1 4 6 4 10
PBT 299 279 327 376 244
Tax 69 57 72 84 64
PAT 230 222 255 292 180
Consolidated Profit & Loss Statement (Full Year Highlights)

24
Particulars (Rs. Crs.) Sep-21 Mar-21
Non-Current Assets 253.2 248.2
Property, plant and equipment 173.2 182.0
Capital Work-in-Progress 0.3 0.0
Intangible Assets 0.5 0.5
Right of Use Assets 19.9 20.4
Financial Assets
i. Investments 6.5 5.1
ii. Other Financial Assets 32.5 32.5
Non-Current Tax Assets (net) 7.8 6.9
Other Non-Current Assets 12.5 0.8
Current Assets 1,877.3 1,649.7
Inventories 360.8 348.5
Financial assets
i. Liquid Investments 749.6 790.2
ii. Cash and cash equivalents 106.2 18.6
iii. Bank balances 17.3 873.1 8.9 817.7
iv. Trade receivables 439.2 436.3
v. Loans 126.4 0.3
vi. Other financial assets 3.0 2.6
Other current assets 74.7 44.3
Total Assets 2,130.5 1,897.9
Particulars (Rs. Crs.) Sep-21 Mar-21
Equity 1,798.9 1,521.3
Equity share capital 29.1 29.1
Other Equity 1,770.0 1,492.5
Non-Controlling Interest -0.3 -0.3
Non-current Liabilities 42.7 38.8
Financial liabilities
i. Lease Liabilities 3.4 3.5
Borrowings - -
Provisions 2.8 2.8
Deferred tax liabilities (net) 35.6 31.6
Other non-current liabilities 0.9 0.9
Current Liabilities 289.0 337.8
Financial liabilities
i. Borrowings 5.9 45.1
ii. Lease Liabilities 0.1
iii. Trade payables 112.1 183.3
iv. Other financial liabilities 37.5 21.9
Provisions 0.9 1.5
Current tax liabilities (net) 26.2 14.9
Other current liabilities 106.4 71.1
Total Equity and Liabilities 2,130.5 1,897.9
As per IND-AS
Consolidated Balance Sheet as on 30th September, 2021

25
Particulars (Rs. Crs.) Sep-21 Sep-20
Net Profit Before Tax 371.3 115.6
Adjustments for: Non Cash Items / Other Investment or Financial Items -2.4 -9.6
Operating profit before working capital changes 368.9 106.0
Changes in working capital -205.5 98.5
Cash generated from Operations 163.4 204.5
Direct taxes paid 81.1 15.7
Net Cash from Operating Activities 82.3 188.8
Net Cash from Investing Activities 45.2 -734.3
Net Cash from Financing Activities -39.9 -7.1
Net Decrease in Cash and Cash equivalents 87.6 -552.5
Add: Cash & Cash equivalents at the beginning of the period 18.6 625.3
Cash & Cash equivalents at the end of the period 106.2 72.8
Consolidated Cashflow Statement

Performance Snapshot
26
Operating Income (Rs. Crs.)
549
793903
988 9621,026
956875
675
945
1,232
H1 FY20H2FY17 H2FY18H1FY17 H1FY18 H2FY19H1FY19 H2 FY20 H1 FY21 H2 FY21 H1 FY22
50
201169
208
166 156125
108 112
180
363
H2 FY20H2FY17H1FY17 H1FY18 H1 FY20H2FY18 H2FY19H1FY19 H1 FY21 H2 FY21 H1 FY22
EBITDA (Rs. Crs.)
Particulars (Rs. In Crs)ROCE on Semi-Annual basis
H1FY17 H2FY17 H1FY18 H2FY18 H1FY19 H2FY19 H1 FY20 H2 FY20 H1 FY21 H2 FY21 H1 FY22
Equity 421.8 592.4 711.4 875.1 995.9 1,120.0 1,185.7 1,292.8 1,380.0 1,521.3 1,799
Long Term Debt 79.6 60.0 40.7 19.7 7.8 3.7 3.5 3.6 3.5 3.5 3.4
Short Term Debt 8.2 17.1 7.0 25.0 0.0 3.4 0.2 6.8 0.1 45.1 5.9
Cash & Cash Equivalents
85.4 156.0 190.4 383.6 550.7 663.7 633.8 640.5 834.7 817.7 873.1
Capital Employed 469.6 603.6 622.8 586.9 500.8 506.3 597.5 700.3 632.9 779.7 1,058.5
ROCE Half Year (%) 8.7% 40.1% 29.7% 36.3% 32.1% 32.3% 22.9% 16.5% 17.2% 26.5% 42.1%
ROCE for Full year (%) 48.2% 65.4% 66.9% 35.6% 42.5% -
EBIT (Rs. Crs.)
38
188161
201
159 148117
100 104
172
355
H1FY18H1FY17 H1 FY21H2FY17 H2FY18 H1 FY20H1FY19 H2FY19 H2 FY20 H2 FY21 H1 FY22
Every dollar is conservatively spent to generate higher ROCE

CompanyMaithan Alloys Ltd.CIN: L27101WB1985PLC039503
Mr. Rajesh K. [email protected]
www.maithanalloys.com
Investor Relations AdvisorsStrategic Growth Advisors Pvt. Ltd.CIN: U74140MH2010PTC204285
Mr. Rahul Agarwal/ Ms. Khushbu [email protected] / [email protected]+91 9821438864 / +91 9820601181
www.sgapl.net
Contact Details:
THANK YOU