isolation and characterization of mesenchymal stromal
TRANSCRIPT

Isolation and Characterization of Mesenchymal Stromal Cells from the Visceral Adipose Tissue
in Peripancreatic Region
by
Osmanmyrat Hojanepesov
A thesis submitted in partial fulfillment of the requirements for the degree of
Master of Science
Department of Surgery
University of Alberta
© Osmanmyrat Hojanepesov, 2019

ii
Abstract
Type 1 Diabetes Mellitus (T1DM) is a multigenic autoimmune disorder that leads to the
destruction of insulin producing β-cells of the pancreas by the host immune system. This can
lead to chronic hyperglycemia, diabetic ketoacidosis (DKA), retinopathy, nephropathy,
neuropathy, serious cardiovascular complications, severe hypoglycemic unawareness and
glucose instability. Conventional management therapy includes daily glucose monitoring and
exogenous insulin injections. Islet transplantation is an attractive alternative to conventional
therapy. First attempts of islet transplantation dates to 1972. Clinical feasibility and efficacy of
islet transplantation was first demonstrated by Edmonton protocol (EP) developed by the Islet
Transplant Group in Edmonton in 2000. However, some of the limitations of this approach
include limited islet supply, gradual graft loss, and harmful chronic immunosuppression regimen.
Even with marked improvements, at its current state, the procedure it is reserved for specific
subset of T1DM patients that have unstable T1DM and hypoglycemia unawareness, severe
hypoglycemic episodes and glycemic lability that cannot be controlled with intensive insulin
therapies.
Some of the major limitations of islet transplantation that need to be overcome for it to be widely
available are limited islet supply, chronic immunosuppression to prevent allograft rejection, and
gradual graft loss. The last two could be potentially be addressed with Mesenchymal Stromal
Cells (MSCs) which are multipotent stem cells found in the stroma of most of the tissues in the
body. These cells have self-renewal capacity and can be differentiate into adipocytes,
osteoblasts, and chondrocytes. MSCs can suppress the inflammation and promote tissue repair
and regeneration through the secretion of cytokines, anti-oxidants, pro-angiogenic factors, anti-
apoptotic factors, antimicrobial factors, and trophic molecules.

iii
Current literature suggests that there are source-dependent differences in MSCs with respect to
cell yield per mass of tissue, transcriptome and secretome profiles, and proliferative and mitotic
capacities. This thesis examined the ideas of microenvironment-dependent differences among
different types of MSCs and that MSCs that are ontologically and anatomically closer to the
islets might be more beneficial to them. Therefore, in this study we isolated and characterized
cells from the visceral adipose tissue specifically in the peripancreatic region. In accordance with
International Society for Cellular Therapy (ISCT), my data demonstrate that cells I prepared
attached to the plastic, expressed a MSC-defining cell surface markers, and differentiated into
adipocytes but not chondroblasts and osteoblasts. Reduced differentiation potential could be
explained by the fact that the donors were elderly and obese, and the cells have undergone many
mitotic divisions before undergoing differentiation protocols. Given the results from multiply
analyses we denoted them as ppaMSCs. This newly characterized cells could be used in the
future studies to assess their effects in islets transplantation.

iv
Preface
This thesis is an original work by Osmanmyrat Hojanepesov. The research project, of which this
thesis is a part, received ethics approval from the University of Alberta Research Ethics Board
(HREB; Pro00001416)

v
Acknowledgements
Using this opportunity, I would like to acknowledge everybody in my life who helped me to any
degree and in any form to accomplish this goal of completing my thesis and acquiring Master of
Science in Surgery.
First of all, I would like to express my sincere appreciation to my dear supervisor and academic
mentor, Dr. Greg Korbutt. Thank you for taking me on board and providing me with an
opportunity to pursue the research topic that was of most interest to me. I was really hesitant to
accept offers from other professors as I really wanted to pursue diabetes research and the day
when you offered me a position in your lab I was very happy. I was able to reconcile my brain
and heart. Also, thank you for the mentorship you provided through my studies. I have acquired
new knowledge, skills, and learnt a lot about the diabetes research.
Next, I would like to say thank you for the members of my supervisory committee for their input
in the production of this thesis. I would like to acknowledge members of Dr. Korbutt’s lab for
their technical input. I appreciate the support that members of the Department of Surgery have
provided through my studies. I am grateful to Alberta Diabetes Institute and their donors for
providing opportunities for a naïve student like me to follow his passion, learn, and lead the
research.
Most importantly I would like to acknowledge my support system that helped me to pursue my
interests and achieve my goals. Dear mentors, you were invaluable assets of my life. You helped
me to become a more mature, well-rounded, and intelligent human being. Dear friends, thank
you for being there for me and the support you have provided. Finally, and most importantly, I

vi
am immensely grateful to my family members. Thank you for everything. If it were not you,
chances are this thesis would not be produced. I would like to dedicate this thesis to my family.

vii
Table of Contents
Abstract .......................................................................................................................................................... i
Preface ......................................................................................................................................................... iv
Acknowledgements ....................................................................................................................................... v
Table of Contents ........................................................................................................................................ vii
List of Tables ................................................................................................................................................ ix
List of Figures ................................................................................................................................................ x
Chapter 1: Introduction ................................................................................................................................ 1
1.1 Type 1 Diabetes Mellitus (T1DM) ....................................................................................................... 2
1.1.1 Normal Physiology of Glucose Homeostasis ................................................................................ 2
1.1.2 Etiology and Pathophysiology of T1DM ....................................................................................... 3
1.1.3. Complications of T1DM ............................................................................................................... 6
1.1.4 T1DM compared to other types of diabetes.............................................................................. 12
1.1.5. Epidemiology ............................................................................................................................. 14
1.2 Treatment Methods for T1DM.......................................................................................................... 15
1.2.1 The search for a cure—discovery of islets of Langerhans and insulin ....................................... 15
1.2.2 Exogenous Insulin Therapy for T1DM ........................................................................................ 16
1.2.3 Transplantation Approaches for T1DM ..................................................................................... 19
1.2.3.1 Whole Pancreas Transplantation for T1DM........................................................................ 19
1.2.3.2 β-cell transplantation for T1DM ......................................................................................... 20
1.2.3.2.1 Islet Allotransplantation............................................................................................... 20
1.2.3.2.2Porcine Islet Xenotransplantation ................................................................................ 22
1.2.3.2.3 Human Embryogenic Stem Cells (hESCs) derived β-cells ............................................. 26
1.2.3.2.4 Induced Pluripotent Stem Cells (iPSCs) derived β-cells ............................................... 29
1.3 Mesenchymal Stromal Cells (MSCs) for β-cell Transplantation ........................................................ 31
1.3.1 Characterization of MSCs ........................................................................................................... 31
1.3.1.1 Plastic adherence ................................................................................................................ 32
1.3.1.2 Cell Surface Markers ........................................................................................................... 33
1.3.1.3. Trilineage Differentiation ................................................................................................... 33
1.3.2 Sources of MSCs ......................................................................................................................... 36
viii
1.3.2.1 Bone-Marrow Derived MSCs (BM-MSCs) ........................................................................... 36
1.3.2.2 Adipose Derived MSCs (AD-MSCs) ...................................................................................... 38
1.3.3 MSCs in tissue repair and regeneration ..................................................................................... 39
1.4 Summary ........................................................................................................................................... 42
Chapter 2: Isolation and Characterization of Mesenchymal Stromal Cells from the Visceral Adipose Tissue
in Peripancreatic Region ............................................................................................................................. 42
2.1 Introduction ...................................................................................................................................... 43
2.2 Material and Methods ...................................................................................................................... 45
2.2.1 Isolation of Peripancreatic Adipose Tissue-Derived MSCs......................................................... 45
2.2.2 Cell counting using Crystal Violet and Initial Seeding ................................................................ 46
2.2.3 Passaging ppaMSCs .................................................................................................................... 47
2.2.4 Colony Forming Unit (CFU) assay and Population Doublings (PD) ............................................ 48
2.2.5 Flow Cytometry for Cell Surface Markers Expression ................................................................ 49
2.2.6 Trilineage Differentiation Assay ................................................................................................. 50
2.2.6.1 Adipogenesis ....................................................................................................................... 50
2.2.6.2 Osteogenesis ....................................................................................................................... 51
2.2.6.3 Chondrogenesis................................................................................................................... 51
2.2.7 RNA Extraction and Reverse Transcription-Quantitative Real-Time Polymerase Chain Reaction
(RT-qPCR) Analysis of Differentiation Samples ................................................................................... 52
2.2.8 Glycosaminoglycan (GAG) and DNA Quantification of Chondrogenic Pellets ........................... 53
2.2.9 Statistical Analysis ...................................................................................................................... 53
2.3 Results ............................................................................................................................................... 55
2.3.1 Morphological Analysis of ppaMSCs .......................................................................................... 55
2.3.2 Clonogenicity of ppaMSCs ......................................................................................................... 56
2.3.3 Growth Kinetics .......................................................................................................................... 56
2.3.4 Cell Surface Marker Expression ................................................................................................. 58
2.3.5 Mesoderm Differentiation Potential ......................................................................................... 59
2.4 Discussion .......................................................................................................................................... 63
Chapter 3: Conclusion and Discussion ........................................................................................................ 69
3.1 General Discussion and Future Direction ......................................................................................... 70
References .................................................................................................................................................. 75

ix
List of Tables
Table 2.1 Table showing available donor information such as sex, age, BMI, and A1C.

x
List of Figures
Figure 2.1 ppaMSCs were isolated and passaged 3 times in total.
Figure 2.2 Qualitative analysis for morphological changes ppaMSCs using phase-contrast
microscopy throughout 9 days reveals gradual adherence of the cells to the plastic and
appearance of spindle-shaped morphology.
Figure 2.3 Images of representative CFU plates showing formed colonies that were stained with crystal
violet (CV; blue).
Figure 2.4 Growth Kinetics in terms of population doublings (PD) and cumulative population doublings
(CPD) of ppaMSCs (n=4).
Figure 2.5 Cell surface expression of MSC-characterizing markers in ppaMSCs (n=4).
Figure 2.6 P4 ppaMSCs differentiated into adipocytes but not chondrocytes and osteoblasts.
Figure 2.7 Reverse Transcription-Quantitative Real-Time Polymerase Chain Reaction (RT-
qPCR) analysis of differentiation samples.
Figure 2.8 Glycosaminoglycan (GAG) and DNA quantification of chondrogenic pellets (n=4).

1
Chapter 1: Introduction

2
1.1 Type 1 Diabetes Mellitus (T1DM)
1.1.1 Normal Physiology of Glucose Homeostasis
Glucose is the main source of energy for cells in human body. Under aerobic conditions, all cells
in the body harvest energy stored in glucose to produce adenosine triphosphate (ATP) molecules,
which are used in almost all cellular processes. After a meal, macromolecules such as proteins,
polysaccharides, lipids in food which have entered the intestines are broken down into smaller
absorbable constituents: amino acids, monosaccharides, and free fatty acids (FFA), respectively.
Liberated glucose residues are then absorbed into blood mainly by collaborated action of SGLT1
and GLUT2 transporter proteins located in the small intestinal epithelium cells 1,2. Islets of
Langerhans in the pancreas regulate blood glucose levels through complex mechanisms by
constantly monitoring and responding to it. Human islets contain approximately 30% α-cells that
produce glucagon, 60% β-cells that produce insulin, and 10% are made up of δ-cells that produce
somatostatin, pancreatic polypeptide (PP) cells that produce PP, and ε-cells that produce ghrelin
3.
When the blood glucose levels are relatively high glucose enters into β-cells through GLUT1,
GLUT2, and glucokinase; next, glucose is metabolized into ATP molecules that result in closure
of ATP-sensitive K+ channels; this leads to membrane depolarization and opening of voltage-
gated L-type calcium channels; increased influx of calcium results in the exocytosis of insulin-
containing vesicles 3. Secrete insulin into the blood stream signals body cells to take up the blood
glucose from the blood. Blood glucose then comes to a normal range which is defined by
Diabetes Canada 2018 Clinical Practice Guidelines as either fasting plasma glucose (no caloric
intake for at least 8 hours) of less than 6.1 mmol/L but more than 4.0 mmol/L, plasma glucose of
less than 7.8 mmol/L but more than 4.0 mmol/L after 2-hour postprandial glucose test, or plasma

3
glucose of less than less 11.1 mmol/L but more than 4.0 mmol/L at any time of day 4. Insulin
secretion is enhanced by incretin hormones and inhibited by somatostatin of δ-cells, adrenaline,
galanin, ghrelin of ε-cells, leptin 3.
During the first 8-12 hours of fasting when the blood glucose levels are low, β-cells are not
stimulated to secrete insulin; therefore, α-cells are relived from inhibitory paracrine/endocrine
effects induced by β-cells and δ-cells and they are stimulated by autonomic inputs which are
stimulated by hypoglycemia; this culminates in α-cells secreting glucagon, which signals liver to
release glucose into the bloodstream by breaking down its glycogen stores, in the process called
glycogenolysis 5,6. Blood glucose then comes to a normal range. If more glucose is needed and
glycogen stores are depleted, as at a times of relative short-term starvation, the liver tries to meet
the glucose needs of peripheral cells by synthesizing it from non-carbohydrate molecules mainly
from amino acids and lactic acids, but also from glycerol and pyruvate (gluconeogenesis) 5,7. If
these mechanisms do not satisfy energy needs of the body as in the case of long-term starvation,
liver starts breaking down fatty acids and release ketone bodies through the process of
ketogenesis which can then be utilized by other cells in the brain and muscles to meet the energy
needs. All these mechanisms are important since they provide means to keep the maintain
glucose homeostasis.
1.1.2 Etiology and Pathophysiology of T1DM
The pathophysiological model of T1DM is a multigenic autoimmune disorder, which is often
precipitated by an exogenous factor, which culminates in the destruction of insulin producing β-
cells of the pancreas by the host immune system. Neither the initial trigger for autoimmunity nor
the progression of self-destruction is well understood so far. However, it is widely acknowledged

4
that there is a significant genetic component to T1DM pathogenesis. Twin studies presented
30%-50% concordance rate for monozygotic twins and 6%-10% for dizygotic twins 8. To date
more than 40 genetic loci that are related either to immune function, insulin expression, or β-cell
function have been linked to T1DM 8,9. Noteworthy ones are HLA region, CTLA-4, and PTPN22.
CTLA-4 which encodes cytotoxic T-lymphocyte associated protein 4, plays a role in T-cell
development and functionality 10. Failure of proper development or functionality of T-cells can
result in overamplified immune responsiveness. PTPN22 codes for a special phosphatase in T-
cells that functions to down-regulate the signals coming from the T-cell receptor (TCR) 10. It can
be expected that mutations that cause diminished activity of this “braking system” in T-cells will
cause T-cell hyperactivity, and, diminished self-tolerance.
The most important genetic region among all identified ones so far is the Human Leukocyte
Antigen (HLA) region on chromosome 6 which includes HLA Class I genes, HLA Class II
genes, and HLA class III genes. It is suggested that these genes, and, most importantly, HLA
Class II genes contribute around 60% to the overall genetic susceptibility 8. Implications of HLA
genes in the pathogenesis of several diseases was suggested as early as in 1975 11.
HLA gene complex encodes major histocompatibility complex (MHC) class I and class II cell-
surface proteins. MHC class I proteins are present on almost all nucleated cells. These cells
present fragments of proteins from inside the cell on these MHC class I proteins to activate T-
cells. In cases when a virus gets into the cell and hijacks cellular machinery to make more
viruses, presentation of virus particles on MHC class I proteins will flag this infected cell for the
destruction by T-cells. MHC class II proteins, on the other hand, present only on specialized
antigen-presenting cells (APC) such as macrophages and dendritic cells. These APCs detect
extracellular antigens, and following engulfment and digestion, antigen particles are presented on

5
MHC class II proteins to T-cells. Furthermore, MHC proteins also play role in positive and
negative selection of thymocytes (mature T-cell progenitors) in the thymus where T-cell
development occurs 12. Thymocytes are selected based on their interaction with MHC complexes
of APCs. If the thymocyte TCR binds too strongly to self-peptide/self-MHC of APC then this
cell die through apoptosis, the mechanism known as negative selection. This process helps to
eliminate autoreactive T-cells that recognize self-antigens as foreign antigens, which can lead
impaired self-tolerance and autoimmunity. If the thymocyte TCR binds to MHC with proper
affinity, then this thymocyte will survive and mature, the mechanism known as positive
selection. In the process of death by neglect, a thymocyte that does not interact with APC at all
dies.
Given the function of MHC class II proteins change in the gene composition can enhance or
diminish their binding to antigens and TCRs of T-cells. In fact, HLA class II genes
polymorphism were found to affect the susceptibility from protection to strongly at-risk 13. The
DRB1*1501-DQA1*0102-DQB1*0602 haplotype is found in 20% of non-T1DM and only in
1% of T1DM patients, which suggests its protection from developing T1DM 13. Polymorphism
in HLA region was suggested to be responsible for 40-50% of the genetic risk in developing
T1DM 14. 90% of T1DM patients and only 40% of non-T1DM patients have either HLA class II
HLA-DR3, DQB1*0201 (DR3-DQ2) or HLA-DR4, DQB1*0302 (DR4-DQ8) haplotypes 14.
These evidences suggest that patients with T1DM have APCs with MHC molecules that
recognize β-cell-related proteins as non-self and activate autoreactive T-cells which will cause
cascade of activation and proliferation to destroy self β-cells.
The concordance rate for monozygotic twins of 30%-50% highlights that the pathophysiology
and etiology of T1DM cannot be explained solely by genetic factors. These rates suggest that

6
there might be environmental factors that contribute to the disease. Studies in which susceptible
individuals were monitored for the appearance of the first diabetes-associated antibodies
revealed temporal variation: mostly in fall and winter, and rarely in the spring and summer 15.
Then, one proposed environmental candidate that might act as a trigger in T1DM in a seasonal
manner is a virus. This is suggested by the strong temporal relationship between enterovirus
infections and the appearance of the first diabetes-associated autoantibodies 15. Children that
were exposed to rubella during fetal development are more likely to develop T1DM 14. On the
other hand, molecular mimicry hypothesis suggests that immune system is activated by
autoantigens such as glutamic acid decarboxylase (GAD65) because of its close similarity to
viral antigen such as P2-C 14.
Even though the viral infection might be an attractive piece in a pathogenesis puzzle, there are a
lot of controversies and inconsistencies which require further research and investigation. In
addition to viruses there are other proposed environmental factors in T1DM pathogenesis such as
shortened period of breastfeeding and cow’s milk exposure in infants 8. Some studies have
shown that T1DM and non-T1DM differ in their gut microbiota composition which suggests that
gut microbiota may be involved in T1DM pathogenesis 14. These findings combined strengthen
the proposition that T1DM is a complex disease and etiology is dependent strongly on genetical
predisposition, but also environmental factors may play big role.
1.1.3. Complications of T1DM
Diabetes is associated with many detrimental complications such as potentially fatal diabetic
ketoacidosis (DKA); microvascular complications such as retinopathy nephropathy, and

7
neuropathy; and macrovascular diseases such coronary heart disease, cerebrovascular disease, or
peripheral artery disease.
Most common acute complication is diabetic ketoacidosis (DKA), which is estimated to occur in
about one-third of cases 16. Patients usually have hyperventilation, tachycardia, altered mental
state, and acetone smell in their breath. DKA occurs when the body cannot secrete enough
insulin to allow glucose to be taken up by cells and metabolized to fuel vital cellular processes.
Starving cells signal to body’s regulatory mechanisms, which will induce the body to switch
gears and start to burn fatty acids (FA) that are stored in adipocytes. The liver takes up FAs
released from adipocytes and metabolizes them into ketone bodies, which are transportable form
of Acetyl-CoA that can be utilized by other parts of the body. This metabolic state is known as
ketosis and it helps the body to survive through relatively short periods of fasting 17. However,
ketone bodies are very acidic and prolonged periods of elevated blood ketone bodies as in DKA
can cause acidic blood; hence the term acidosis in DKA. DKA is responsible for ~50% of all
deaths in diabetic patients younger than 24 years of age 18. Even though DKA is more common
in T1DM, patients with T2DM can have it too.
Another serious acute complication is hypoglycemia (low blood glucose). This can be a common
side effect of insulin injections in T1DM. If a T1DM patient overshoots insulin injection,
excessive insulin will cause clearance of “more-than-needed” amount of glucose from the blood,
which can lead to very low levels of glucose. In healthy individuals, this acute hypoglycemia is
sensed by alpha-cells and hypothalamus which will unleash the cascade of counter-regulatory
mechanisms, including autonomic nervous system (ANS) activation, throughout the body to
normalize the blood glucose. ANS activation produces many neurogenic symptoms such as
palpitations, sweating and tremor. Healthy individuals can recognize these internal signs of

8
hypoglycemia. However, a subset of diabetic patients seem to have dampened counter-regulatory
mechanisms which leads to neuroglycopenia before the appearance of ANS symptoms, or so-
called hypoglycemia unawareness (HU) 19. This ANS malfunction can kill without any warnings.
One case study described a 23-year-old man with T1DM who was found dead in his bed 20.
Postmortem data in continuous glucose monitoring system (CGMS) revealed severe
hypoglycemia around time of death, with appearance of minimal counter-regulatory response,
which are sings of HU.
Chronic hyperglycemia leads to glycation of hemoglobin (Hb) in circulating red blood cells
(RBC). Glycated Hb (HbA1c) is degraded by erythrocyte proteolytic enzymes which leads to the
release of heme and ferrous iron (II) in association with free radicals; released iron reacts further
to form ferric iron (II) and hydroxyl radicals, which lead to oxidative stress and RBC fragility 21.
Furthermore, oxidative stress promotes cellular damage and release of potent oxidative agents
from RBCs into the bloodstream that are harmful to endothelial cells of the blood vessels 21.
Damage to the endothelial lining will promote local inflammation. Increased HbA1c lowers
RBC’s oxygen-carrying capacity and flexibility, increases their aggregation tendency, and
ultimately leads to increased blood viscosity and impaired blood flow which will further
exacerbate local inflammation and vascular damage 22. Since the lifespan of RBC is about 8-12
weeks, HbA1c is clinical diagnostic marker of long-term glycemic control 4,23,24
Microvascular complications are thought to be the result of those cells being unable to
downregulate glucose influx. Normally, most cells in the body can regulate the rate at which
glucose is taken up into the cells. They can downregulate transport rate under conditions of
hyperglycemia. However, there are some cells such as capillary endothelial cells in the retina,
mesangial cells in the renal glomerulus, and neurons with their glial cells in the periphery, that

9
are vulnerable to hyperglycemia 25. Build-up of glucose in endothelial cells results in its
metabolism through the polyol pathway, hexosamine pathway, advanced glycation end-products
(AGE) pathway, and activation of PKC pathway. Activation of the polyol pathway results in
sorbitol accumulation and consumption of NADPH, which is also essential cofactor in
production of reduced glutathione, an important intracellular antioxidant. Therefore, reduced
glutathione levels may increase cell susceptibility to oxidative stress 25. Also, since sorbitol is an
osmotically active molecule, sorbitol accumulation may increase osmotic stress on cells 26. On
the other hand, production of AGE precursors from glucose molecules results in glycation of
intracellular proteins including transcription factors (TFs), which are important in regulation of
gene expressions 25. Intracellular hyperglycemia stimulates the synthesis of diacyl glycerol
(DAG), the important activating cofactor for protein kinase C (PKC). Activation of PKC
compromises barriers formed by endothelial cells and increases the permeability of small
capillaries to albumin and other macromolecules 27.
In the eyes, all these intracellular changes negatively impact retinal cells, capillary endothelial
cells, and pericytes, and lead to the development of diabetic retinopathy. Pericytes are thought to
be responsible for structural integrity of capillaries. Loss of pericytes and endothelial cells with
their junctions leads to disruption of blood flow to the retinal cells, hemorrhage, and retinal
edema 28. Since diabetic retinopathy is a progressive disease, it starts off without any symptoms,
following with progressive vision loss, and culminating with retinal detachment and complete
vision loss.
Similar scenarios take place in the kidneys. Chronic hyperglycemia leads to accumulation of
intracellular glucose in podocytes and epithelium cells in Bowman’s capsule of nephrons.
Activation of different detrimental pathways such as the polyol pathway, AGE pathway, and

10
PKC pathway partially contributes to cell death and compromised filtration. The initial stages of
diabetic nephropathy are characterized by glomerular hyperfiltration and some loss of podocytes
and epithelial cells, which allows small amounts of albumin to be excreted in the urine
(microalbuminuria) 26,29. Later stages are characterized by thickening of the basement membrane,
decreased glomerular filtration rate (GFR), increased podocyte and epithelial cell loss which
leads to impaired glomeruli filtration and increased protein excretion 26,29. If unmanaged, this can
result in end-stage renal failure 30,31.
Not only is chronic hyperglycemia detrimental for eyes and kidneys but also for nerves, since
capillaries that provide blood to peripheral neurons get damaged. The true cause of diabetic
neuropathy is still not well understood 26. However, ischemic injury caused by microcirculatory
impairment and metabolic injuries through the polyol pathway, AGEs, and PCK activity were
indicated in the pathogenesis of diabetic neuropathy 32,33. There is a wide spectrum of clinical
presentation of diabetic neuropathy: chronic neuropathic pain, limb ulcerations which can lead to
gangrene and limb loss, sensory dysfunction, and impairment of autonomic nervous system
(ANS) functions 33,34. These neurogenic problems can contribute to reduced quality of life.
Therefore, proper management and treatment will be required.
T1DM patients are at increased risk of developing cardiovascular disease (CVD) and CVD-
related mortalities 35,36. The age-adjusted relative risk (RR) for CVD such as coronary heart
disease, cerebrovascular disease, or peripheral artery disease in T1DM is about 10 times more
than general populations. Diabetes is associated with dyslipidemia, a condition in which there is
high serum triglyceride levels, VLDL and IDL, and decreased HDL 37. This process of plaque
build-up underneath the endothelium cells continues and over the years can progress into life-
threatening conditions. Atherosclerosis can occur in arteries of the body. When it occurs in

11
carotid arteries, which supply oxygenated and nutrient-rich blood to the brain and neck, it has
potential to cause a stroke. Atherosclerosis occurring in the coronary arteries, which supply
blood to the heart can lead to angina (chest pain) and myocardial infarction, where smooth
muscles of the heart die from ischemic attack. Peripheral artery disease, caused by
atherosclerosis of the abdominal aorta, iliac, and lower-extremity arteries can cause ischemic rest
pain, ischemic ulcerations and possibly limb loss through gangrene development and amputation
38.
There are few proposed models to explain the mechanism of how diabetes causes chronic
macrovascular complications 39-41. In addition to the previously described mechanisms, chronic
hyperglycemia damages vascular endothelial cells by inhibiting the production of nitric oxide
(NO, an important vasodilator), NO-activated tissue plasminogen activator (anti-clotting
protein), and causing oxidative stress through the accumulation of reactive oxygen species 42,43.
On top of that, inflammatory leukocytes (primarily monocytes and T cells) migrate and
accumulate in the deeper layers (intima media) of blood vessels 42. Once these monocytes get
into intima media, they differentiate into macrophages and scavenge the atherogenic lipoproteins
(especially LDL) until they die and fatty necrotic tissue remains .
Given these microvascular, macrovascular, and metabolic complications T1DM is a serious and
potentially fatal disease that requires strict medical management for a patient to achieve good
quality and higher life expectancy.

12
1.1.4 T1DM compared to other types of diabetes
Diabetes mellitus (DM) is a term used to describe a spectrum of related metabolic disorders with
impaired blood glucose levels resulting in increased food intake (polyphagia), water intake
(polydipsia) and urine production (polyuria). Chronic impaired blood glucose levels are
associated with detrimental complications such as diabetic retinopathy (damage to the retina in
eyes), nephropathy (damage to the nephrons in kidneys), neuropathy (injury to neurons) and
major cardiovascular diseases. Etiologically DM can be subdivided into several groups such as
type 1 diabetes mellitus (T1DM), type 2 diabetes mellitus (T2DM), gestational diabetes (GD),
and other genetically defined conditions such as neonatal diabetes mellitus (NDM) and maturity-
onset diabetes of the young (MODY). Given that there are differences in etiologies and
progression mechanisms in different types of diabetes, diagnosing subjects with proper subset is
crucial in providing proper therapeutic care.
While T1DM is an autoimmune disorder that results in absolute insulin insufficiency, T2DM is
considered as complex metabolic disorder that results in peripheral insulin resistance and relative
insulin insufficiency. Literature suggests that lifetime risk of developing T2DM for an individual
if one or both parents have diabetes is 40% or 70%, respectively 44. Furthermore, the
concordance rate for T2DM in monozygotic twins is about 70% and for dizygotic twins is 20-
30% 44. On the other hand, T2DM is also associated with physical inactivity, sedentary lifestyle,
and obesity 45. In non-T2DM subjects insulin signals to the body to uptake glucose and store it
for later use. In the liver insulin inhibits glucose production (gluconeogenesis), glycogen
breakdown (glycogenolysis), lipids breakdown (lipolysis) and promotes glycogen synthesis
(glycogenesis) and lipid synthesis (lipogenesis). However, in T2DM patients this mechanism
seems to be impaired. These patients have chronically increased basal hepatic glucose production

13
(HGP) which dumps glucose into the bloodstream and elevates blood glucose levels 46.
Furthermore, peripheral muscle cells usually account for 80% of total glucose take up from the
blood 46. However, muscle cells in T2DM patients are insulin resistant and they do not take up
glucose to the same extent as non-T2DM muscle cells 46. This prevents blood glucose clearance
and further exacerbates chronic hyperglycemia. Also, in obese non-T2DM patients β-cells seem
to be able to compensate for peripheral insulin resistance by increasing the insulin output;
however, this β-cell compensation mechanism is impaired in T2DM patients (relative insulin
insufficiency) 46. Therefore, given these differences in pathophysiology of T1DM and T2DM,
they differ in the management strategies: for T1DM it is mainly insulin therapy to compensate
for insulin insufficiency, for T2DM it is mainly change in life style, diet, and oral hypoglycemic
agents to decrease chronic hyperglycemia and re-sensitize cells to endogenous insulin actions.
GD refers to glucose intolerance during pregnancy in women. Because the pregnancy is
accompanied with a shift in hormone balance that affect glucose homeostasis, progressive insulin
resistance (IR) develops from around mid-pregnancy and advances during the third trimester 47.
Normally, β-cells compensate for IR and increased insulin needs; however, if they do not secrete
enough insulin then gestational diabetes occurs 47. GD occurs only during pregnancy and
resolves after the childbirth. Besides negatively impacting a mother, GD also affects the
offspring. Intrauterine exposure to hyperglycemia permanently changes fetal metabolism, results
in increased risk for high BMI in the offspring, and may increase the chances of the offspring in
developing diabetes later in life 48,49. Even though T1DM and GD differ in pathogenesis and
progression the management strategy is similar. Initially, GD patients are prescribed medical
nutritional therapy and exercise aimed to maintain desired glycemic control 47. If GD patients do
not respond to those therapies then they are prescribed insulin therapy as in T1DM 47.

14
MODY is a group of monogenic autosomal dominantly inherited disorders that are distinct from
other forms of diabetes 50. To date at least 9 genes have been indicated in MODY etiology which
most of them result in diabetes primarily through β-cell dysfunction 51 . The four most common
ones are GCK (MODY2), HNF1A (MODY3), HNF4A (MODY1), and HNF1B (MODY 5) 51.
GCK encodes for a protein that catalyzes rate-limiting step of glucose phosphorylation in β-cells
and hepatocytes, which lets to sense and respond blood glycemia appropriately; heterozygous
inactivating mutations in this gene raises the sensing threshold in β-cells 51. HNF1 gene plays
role in glucose transport and metabolism and mutation in this gene leads to progressive β-cell
failure 51. Mutations in HNF4A gene cause similar progressive β-cell failure as in HNF1 gene-
caused MODY 51. HNF1B gene is involved in the regulation of gene expression and embryonic
development in kidneys and pancreatic islets 51. Therefore, mutations in this gene can cause
impaired glucose tolerance. Treatment methods for MODY is dependent on etiology of the
disease.
1.1.5. Epidemiology
Estimates suggest that 87-91% of all diabetes cases in high-income countries are T2DM, 7-12%
are T1DM, and 1-3% other forms of diabetes 52. According to the International Diabetes
Federation (IDF), an estimated 30 million people had some form of DM in 1964 52. In 2000 this
number climbed to 151 million and in 2013 this number increased further to 382 million 52. In
2015 the world population which lives with DM is 415 million as estimated by (IDF) 52. The IDF
predicts 642 million people will suffer from diabetes by 2040 52. With modern medicine and its
treatment approaches diabetes and higher-than-optimal blood glucose together led to the deaths

15
of 3.7 million people in 2012 53. History shows that the incidence of diabetes is on the rise and
the given reduced quality of life and shortened life expectancy, diabetes should be taken
seriously, and better treatment options are needed.
1.2 Treatment Methods for T1DM
1.2.1 The search for a cure—discovery of islets of Langerhans and insulin
In 1869, Paul Langerhans published a dissertation in which he described in detail the
microscopic anatomy of the pancreas and identified what is now-called “islets of Langerhans”
surrounded by pancreatic acinar cells 54. However, he was not able to identify function of islets
yet 54. In 1889 Oscar Minkowski reported his findings that pancreatectomized dogs developed
diabetes following few days after the surgery and persisted in that state for a few weeks until
death has occurred 55. This is one of the major turning points in the history of diabetes care since
it was clearly shown that removal of the pancreas produced diabetic symptoms suggesting that it
had not only exocrine but also endocrine function; and this allowed investigators to concentrate
their research on the role of pancreas in pathogenesis of diabetes. In the early 1900s American
pathologist Eugene Lindsay Opie while conducting postmortem examinations on patients,
identified morphological changes in pancreatic islets of patients with DM 56. In 1907, M.A. Lane
distinguished the cells of islets as either A cells or B cells; the latter later became known as β-
cells 56. In 1921, Banting and Best obtained pancreas extracts from dogs and fetal calves and
showed their efficacy in correcting hyperglycemia in dogs 57. The same year James Collip helped
to purify active protein from the extracts that Banting obtained and this protein later was named
as insulin 56. Starting from 1922 Collip’s purified insulin mixture was used in clinics to treat

16
patients with T1DM for whom the disease meant a death sentence 58. In 1923, Banting and
Macleod won the Noble Prize “for the discovery of insulin”. This was a revolutionary discovery
since it alleviated a death penalty associated with T1DM and gave a hope for T1DM patients to
manage severe daily symptoms of diabetes. In 1957, Lucy and Davies using
immunohistochemical methods showed that insulin was produced by β-cells 56.
1.2.2 Exogenous Insulin Therapy for T1DM
In 1922, 14-year-old diabetic patient was successfully treated with Collip’s purified bovine
insulin and later the same year Banting and his colleagues reported clinical improvements in
seven patients with diabetes when administered with the same purified insulin 58. They did not
know how lucky they were by injecting bovine insulin into human patients, since molecules from
different species can cause immune reactions in immunocompetent humans 59. Only with later
development of amino acid sequencing by Frederick Sanger was it possible to sequence and
compare insulin from different species—now we know that bovine and human insulin differ in
three amino acids, but it is still weakly allergenic to humans 15,59,60. This is issue was partly
resolved by genetic engineering with introduction of recombinant human insulin in 1980—it was
then that the human insulin coding gene was inserted into E. coli to express mature insulin
protein 61. However, even with this synthetic human insulin there are major issues that need to be
addressed.
Insulin secretion in non-diabetic individuals has two components: basal insulin secretions to
suppress lipolysis and balance hepatic gluconeogenesis with glucose demands, and prandial
insulin secretions to inhibit hepatic gluconeogenesis, lipolysis and to promote glucose uptake and
storage 62. Insulin release is a very fine-tuned process that allows the body to keep blood glucose

17
levels in a narrow range. Therefore, the purpose of exogenous insulin therapy is to mimic this
natural release. Human recombinant insulin injections cannot satisfy these criteria. Therefore,
different modifications and strategies are being explored.
Today, there are different types of insulin analogues that are broadly divided into 4 categories
based on their pharmacokinetic and pharmacodynamic profiles: rapid-acting analogues and
short-acting insulins to mimic prandial insulin release, and intermediate-acting and long-acting
insulins to mimic basal levels of insulin 63. Over the years new insulin analogues have been
developed that have better clinical profiles than their predecessors, and their integrating into
standard care.
The Diabetes Control and Complication Trial (DCCT), 10-year controlled clinical trial involving
1441 T1DM patients with average follow-up of 6.5 years, was one of the major clinical studies
conducted to test so-called “glucose hypothesis”, which states that chronic hyperglycemia plays
major role in the pathogenesis of long-term complications 64. Specifically, the intensive-therapy
regimen which was designed to maintain blood glucose at concentrations as close to non-diabetic
levels as possible (with three or more insulin injections) was compared with conventional
diabetes therapy which consisted of one or two insulin injections to maintain safe asymptomatic
glucose levels with respect to long-term microvascular complications 65. Results were clear and
bold: at the end of follow-up intensive blood glucose control reduced risk of retinopathy by 76%,
microalbuminuria by 34%-43% and neuropathy by 69%-57% 64. Following DCCT, another
observational study called Epidemiology of Diabetes Interventions and Complications (EDIC)
was initiated that recruited 96% of DCCT subjects to assess the incidence and predictors of
cardiovascular events and microvascular complications. Results showed that progression of
18
atherosclerosis in the intensive-therapy group was slowed, as were the incidence of fatal and
nonfatal myocardial infarctions and strokes 39.
Even though the introduction of insulin and insulin analogous into clinical practice allowed
better control of blood glucose levels and improved quality of life of many patients, insulin
therapy is far from ideal. Insulin-induced hypoglycemia is the major severe side-effects of this
therapy 63. It can be so severe that it can cause confusion, coma and seizure, and in the worst-
case scenario it can cause nocturnal hypoglycemia with lethal outcome 63. In addition to that,
insulin injections can cause allergic reactions ranging from local reactions to severe generalized
anaphylactic reactions 66. In the real world, patient adherence to his or her recommended
treatment plan is another important factor that makes insulin therapy less favorable 67. The fact
that patients have to constantly monitor their blood glucose, predict their meal intakes and level
of physical activity in order to match that with insulin injections makes exogenous insulin far
from ideal. Even if insulins are perfected in their PK/PD profile, they are still going to remain as
a “management” and not a “cure” for diabetes since continuous monitoring, calculation and
prediction, and injection will be required from a patient. Better therapies needed to improve
quality of life of diabetic patients. Furthermore, within the population of T1DM patients there is
a subgroup that continue experiencing severe hypoglycemia, impaired awareness of
hypoglycemia, and excessive glycemic variability regardless of effective education and intensive
insulin therapy 68. Recurrent hypoglycemia increases the risk of morbidity and mortality; in fact,
4-10% of mortality in T1DM patients is attributed to severe hypoglycemia 68. This group of
T1DM patients that respond poorly to intensive insulin therapy require better management
options in order to survive and have a better quality of life.

19
1.2.3 Transplantation Approaches for T1DM
1.2.3.1 Whole Pancreas Transplantation for T1DM
Transplantation therapy is an alternative which can address major drawbacks of insulin therapy.
In 1894, Watson-Williams and Harsant attempted to treat 13-year-old diabetic boy with a sheep
pancreas transplanted subcutaneously; temporary improvement was noted and the boy died 3
days later rejecting the xenograft 69. The first human pancreas transplantation attempts with some
success date back to 1966, when Kelly and Lillehei developed a protocol for whole pancreas
transplantation in conjunction with a kidney transplantation in patients with diabetes and renal
failure, a procedure called simultaneous pancreatic kidney (SPK) transplantation, using organs
from a deceased donor 70. Their first surgery allowed the 28-year-old patient to be insulin-free
for six days, and with further modifications of protocol better results were achieved 70. In 1971,
pancreas was transplanted using urinary drainage via the native ureter; in 1973 segmental
pancreas transplantation with end-to-side ductoenterostomy 71. In 1983, Hans Sollinger
performed segmental pancreas transplantation with bladder drainage technique 71. Even though
whole pancreas transplantation was a big step towards finding a cure for T1DM, the procedure is
far from ideal. Whole pancreas transplantation requires major invasive surgical procedure and it
is associated with surgical morbidity 72. It is associated with perioperative risks, graft thrombosis,
hemorrhage, urologic complications and pancreatitis 71,73. Patients require life-long
immunosuppression. To outweigh the harm and risks associated with pancreas transplantation, it
is reserved for specific population of patients: 72% of transplants are simultaneous pancreas-
kidney (SPK) for patients who have detrimental nephropathy, 17% of transplants are pancreas
after kidney (PAK) for patients who already had kidneys transplanted and are on
immunosuppressive drugs, 4% of transplants are pancreas combined with other organs, and only

20
7% are pancreas transplant alone (PTA) procedures 74. Given that pancreas transplantation
requires major laparotomy, is associated with surgical morbidities and complications, and that
life-long immunosuppression is required, the procedure is not available for all T1DM patients.
Furthermore, due to listed and additional factors such as lack of primary referral source, lack of
endorsement of pancreas transplants alone by the American Diabetes Association, associated
high mortality rates the annual number of pancreas transplants performed has been declining in
the United States 75.
1.2.3.2 β-cell transplantation for T1DM
1.2.3.2.1 Islet Allotransplantation
A significantly less invasive alternative to whole pancreas transplantation is isolated islet
transplantation which is much safer and faster. First successful attempts of transplanting isolated
islets date back to 1972 when Ballinger and Lacey transplanted islets from rats into the
peritoneal cavity of diabetic rats which resulted in significant reduction of hyperglycemia. 76-78.
In 1973, Kemp et al. demonstrated that the infusion of islets into the portal vein achieved better
results than the transplantation into the peritoneal cavity 78 The first clinical human trials of
isolated islet transplantation in T1DM patients with optimistic results were performed by
Najarian et al. at the University of Minnesota in 1974 79. In 1980, 10 patients with chronic
pancreatitis underwent pancreatectomy and isolated autologous islets were infused back into
those patients; 3 of the patients were insulin-independent for 1, 9, and 38 months, respectively 76.
In 1990, Scharp et al. achieved for the first time clinical insulin independence with islet
transplantation for nearly a month 80. This success was conceivable because of the advances in
islet isolation and purification methods, including the development of Ricordi chamber 80,81.

21
According to International Islet Transplant Registry, out of 245 islet allograft recipients between
1990 and 1998 only 20 (8%) were insulin-independent at ≥ 1 year 82.
In 2000, Shapiro and his colleagues demonstrated the ability of islet transplants to regulate blood
glucose in all seven transplanted patients for one year with improved islet transplantation
procedure which later became known as the Edmonton Protocol (EP) 83. The major difference
between previous attempts and EP was that latter used glucocorticoid-free immunosuppressive
regimen which consisted of sirolimus, tacrolimus, and daclizumab and increased islet mass
transfusion (11,547±1604 islet equivalents per kg of recipient’s body weight) 83. This was one of
the major breakthroughs in islet transplantation field and it gave high hopes and promised to
solve problems of diabetic patients. However, recent results from the Collaborative Islet
Transplant Registry (CITR) indicates that prevalence of insulin independence is ~70% at 1 year
and ~40% at 5 year post last islet infusion 84.
Even with progress and refinements in different aspects of islet transplantation, such as organ
procurement, islet isolation, blood type matching, and choice of immunosuppressive drugs
longer-term patient follow-ups revealed some shortcomings of this approach 83,85. Islet
transplantation recipients usually require islets from more than one donor because islets die and
diminish in function during isolation, culture, and after transplantation 86. This one of the major
drawbacks since it raises the question of the supply of good quality islet. Strategies of isolating
high-yield and good quality islets are desirable. Islet transplantation, as with any other type of
transplantation procedure, requires chronic immunosuppression to prevent acute graft rejection
and gradual graft damage, that can cause loss of graft function over time. It is suggested that one
of the major contributors to the initial graft rejection is a process called instant blood-mediated
inflammatory reaction (IBMIR) caused by incompatibility between islets and the blood interface

22
87-89. In IBMIR, coagulation system, complement system, and innate cells are activated to induce
clotting, platelet aggregation, attraction of immune cells, cell lysis, inflammation, and rejection
89.
The current immunosuppression scheme consists of three phases induction, anti-inflammatory
and maintenance. Enhanced protocol for induction phase using alemtuzumab, tacrolimus,
mycophenolate mofetil is designed to deplete T-cell before the surgery 90. Anti-inflammatory
therapy using etanercept (anti-TNF) and anakinra (interleukin 1 receptor antagonist), and
maintenance therapy using tacrolimus and MMF yielded better results compared to earlier
immunosuppressive regimens 90,91. Even with these improvements, chronic immunosuppression
is undesirable since it is harmful to the recipient, increases the susceptibility of individuals to
opportunistic infections, and therefore, limits the patient inclusion 86,92.
1.2.3.2.2Porcine Islet Xenotransplantation
Another promising avenue that may solve the organ shortage problem is xenotransplantation
which is a transplantation of organs between two different species. When recipient and donor are
from two closely related species this is called concordant xenotransplantation93. When they are
from two very different species, it is called discordant xenotransplantation 93.
There are major advantages of using porcine islets for xenotransplantation. Pigs have internal
organs that are comparable to humans’ in terms of morphology and size; they are
phylogenetically closer to primates than rodents; and physiology of pigs is very similar to
humans 94. Furthermore, porcine insulin is very similar in structure to human insulin and differs
only in one amino acid (alanine in pigs and threonine in humans at B30 position). With its initial

23
introduction by Banting in 1922 and further purification by Collip the same year, porcine insulin
has been used in clinics and was a major source of therapeutic insulin before the introduction of
recombinant technologies. With further purifications of porcine insulin injection site and
systemic reactions have decreased, and insulin resistance was seen in less than 0.1% recipients
95. Retrospective analysis shows that injection site reactions were seen in 3.9% of purified
porcine insulin recipients and 2.4% of human recombinant DNA (rDNA) insulin recipients 95.
This shows that porcine insulin is only slightly less favorable than human rDNA insulin and a
good therapeutic for clinical use. Furthermore, since pigs are an acceptable source of food, they
must be an ethically acceptable source for major life-saving or life-enhancing surgeries such as
islet transplantation in diabetic patients who have a suffer from insulin insufficiency. Pigs also
have the potential to serve as unlimited source of reproducible, genetically controlled, and high-
quality islets since they have large litters and can be bred in controlled manner. In addition, if
ethics concerns are addressed, pigs can be cloned and genetically modified for desirable traits.
Recently, investigators from China reported that they were able to edit the INS gene in pigs so
they produce human insulin 96.
There are few factors in pig islet transplantation that need to be considered and addressed. The
first factor is donor age. Adult pigs can offer large number of large-sized islets and start secreting
insulin right-away. However due to many factors adult porcine islets are very fragile and
sensitive, and therefore are not suitable for clinical settings 97. Furthermore, adult islet isolation
is relatively challenging process. Fetal and neonatal pigs islets are easier to isolate and they are
more resistant to ischemic and inflammatory damage 98. However, fetal porcine extracts have
their limitations too—generally, they have a poor response to glucose 97. Dr. Korbutt’s lab have
developed and over time refined relatively easy and optimized for large-scale protocol for

24
isolation of neonatal porcine islets (NPIs). Both fetal porcine islets and NPIs do not start
functioning as fast as adult pig islets. However, NPIs start functioning significantly sooner than
fetal porcine islets, > 4 weeks versus 8 weeks, respectively 99. NPIs have growth potential post-
transplant and induce lower T-cell response than adult pig islets in T1DM patients 100,101. Some
investigators worked with embryonic pig islets tissues as possible avenue; however, these cells
require about 6 months of growth before they start effectively restoring normoglycemia and
embryonic cells have a risk of tumorigenesis 98,102. This long maturation time and risk of
developing tumors are major drawbacks of using embryonic tissue. In vitro and in vivo studies
demonstrated that NPIs are better candidates than adult and fetal porcine islets for islet source in
xenotransplantation since they are viable, resistant to isolation steps, reproducible and relatively
cheap 97,103.
Another aspect of porcine xenotransplantation that needs to be addressed is immunological
rejection. In the first 24-hour porcine xenograft is rejected immediately by the host through the
hyper acute rejection (HAR) due to the pre-existing anti-pig antibodies which upon binding to
pig cells will initiate complement-mediated damage to the endothelial cells causing thrombosis,
interstitial hemorrhage and edema. 102,104. The most important among many immunogenic
epitopes is galactose-α-1,3-galactose (Gal) which is found on the pig vascular endothelium 104.
Two promising strategies to get around HAR are genetic modification of pigs to knock out the
immunogenic genes, induction of expression of complement regulatory proteins on the surface of
islet cells (eg. hCD46, hCD55, hCD59) 102,104 Next, within a few days or weeks another immune
mechanism, acute humoral xenograft rejection (AHXR), mediated through antibody deposition
and complement activation leads to infiltration of the graft by innate immune cells that destroy
the graft 104. When knockout islets were combined with complement-regulatory proteins early

25
graft rejection was prevented 104 Finally, within 24 hours to 20 days adaptive immune response
(or cellular rejection) causes further graft damage and rejection 102,104. This process is mainly
mediated by CD4+ T-cells, CD8+ T-cells, and anti-pig antibodies 102,104. Since T-cell activation
needs co-stimulatory molecules, blocking these specific proteins such as CD870/86-CD28 and/or
CD40L (CD154)-CD40 is one way to prevent adaptive immune attack, which will further
facilitate graft survival and function 102. Another approach to allow porcine islets to function but
prevent xenograft rejections is to encapsulate the islets into biocompatible material such as
alginate and polytetrafluoroethylene 105. There have been clinical studies that assessed the safety
and efficacy of alginate encapsulated pig islet xenotransplantation 106. The results from one of
the clinical trials in New Zealand indicated low graft function and inconsistent efficacy of
encapsulated pig islet xenografts 106. Different clinical trial in Argentina showed partial graft
function and significant reduction in the number of unaware hypoglycemic episodes 106.
Another very important aspect of xenotransplantation that needs to be addressed is the risk of
transmission of pathogenic microorganisms from animals to humans. International
Xenotransplantation Association suggests that most pathogens can be eliminated by breeding
pigs in designated pathogen-free (DPF) facilities which contains Cesarean section, closed
containment, feed and waste management, staff training, and other safety procedures 107.
However, even with DPF there is a risk of transmission of viral infections such as hepatitis E
virus (HEV), herpes viruses, and porcine endogenous retrovirus (PERV) 107. With current
methods even these obstacles could be overcome. For example, studies have shown that HEV
can be treated with ribavirin and in certain regions up to 56% of the adult population already
have been exposed to HEV and have protective antibodies against it 107. Clinical relevance of the
risk of PERV transmission is debated. Islet xenotransplantation is already in clinical trials in

26
some countries and no transmission of PERVs have been reported from more than 200 recipients
or up to 35 years of post-xenotransplantation 107. Furthermore, recently emerging genetic editing
technique CRISPR/Cas9 might provide a solution for selectively eliminating genome-integrated
viruses such as PERV, HEV, and herpesviruses 108,109. In fact, feasibility of this approach has
been shown with the selective removal of 62 genomic copies of PERV in pig cell lines 107. Given
these optimistic results, porcine islet xenotransplantation can provide cost-effective and
unlimited supply of islets for clinical transplantation.
1.2.3.2.3 Human Embryogenic Stem Cells (hESCs) derived β-cells
Stem cell-based therapies offer another approach to address organ shortage problem in the
treatment of T1DM. Pluripotent stem cells (PSCs) are the cells that can renew and differentiate
into three primary groups of cells that form the human being: ectoderm, mesoderm, and
endoderm 110. Ectoderm gives rise to skin cells and cells of nervous system 111. Mesoderm gives
rise to bone cells, heart cells, and skeletal muscle cells 112. Endoderm gives rise to cells of
gastrointestinal and respiratory tracts, endocrine glands, liver and pancreas 113. Two major
sources of PSCs are human embryonic stem cells (hESCs) and induced pluripotent stem cells
(iPSCs). hESCs can be derived from inner cell mass of embryonic blastocyst that were created
through in vitro fertilization 114. There are few advantages of using these cells in the treatment of
T1DM. First, hESCs potentially can provide unlimited supply of high-quality insulin-producing
cells for regenerative medicine if ethical concerns are addressed. Second, hESCs-derived insulin-
producing cells are allografts and they will not be as immunogenic as xenografts. hESCs-derived
insulin-producing cells transplantation in combination with immunosuppressive regimen should
provide comparable results as conventional islet transplantation.

27
The field is relatively new and some of the challenges with hESCs that need to be addressed are
refinement of the differentiation protocol, prevention of the possibility of tumorigenesis, and
addressing immuno-compatibility to avoid the use immunosuppressants. The first documented
report isolating hESCs was in 1998 115. Since then many laboratories have tried to develop and
refine the protocol to produce β-cells from hESCs 116-123. In 2006, D’Amour and colleagues
presented a 5-stage (11-18 days) protocol differentiating hESCs into insulin secreting cells;
however, only 7% were insulin-positive and these cells were minimally responsive to glucose in
vitro 118. In 2006, Kroon and colleagues presented a 4-stage (12 days) protocol that resulted in
relatively low insulin-positive cells in vitro; however, in vivo studies demonstrated that these
cells after maturing in vivo can correct STZ-induced hyperglycemia in 92% of transplanted mice
119. In 2004, Pagliuca and colleagues demonstrated that their 6-stage (27-34 days) differentiation
protocol yielded 33% of cells co-expressing β-cell markers NKX6-1 and C-peptide 123. Studies
in vivo demonstrated the ability of these cells reverse hyperglycemia 123 In 20014, Rezania and
colleagues demonstrated that their refined 7-stage (27-43) in vitro differentiation protocol
produced one insulin-positive cell from every two hESCs and the expression of key β-cell
markers such as INS, MAFA, G6PC2 were indistinguishable from human islets 122. Furthermore,
their cells reversed diabetes by day 40 post-transplantation 122. Given that the field has achieved
these optimistic results in only about 14 years, it can be expected with further research and trials,
researchers will elucidate complex differentiation mechanisms and will be able to efficiently
differentiate pluripotent stem cells, including hESCs, into insulin producing β-cells.
Another important aspect of stem cell-based therapies that needs to be addressed is
tumorigenicity potential of the stem cells. hESCs spontaneously form teratomas when
transplanted into mice 124. If cells are infused into the bloodstream, complex issue of

28
biodistribution that relates to cell localization, migration, survival, and differentiation becomes
important for consideration 125. One way to solve this issue would be to develop a therapeutic
device that localizes, limits the migration of the stem cells, and allows safe immediate retrieval if
needed. One example of this approach that addresses tumorigenicity and immunogenicity
problems is the VC-01™ manufactured by ViaCyte is designed to be implanted subcutaneously.
This combination technology includes insulin-secreting pancreatic endoderm cells (PECs) that
showed promising pre-clinical results and have been optimized for large-scale manufacturing
encapsulated into biocompatible and semi-permeable barrier (Encaptra®) 126. Even though there
are some challenges and shortcomings with stem cell therapies, this field is gaining strong
momentum and gives us hope to treat diabetes. In fact, in 2014 ViaCyte has launched
prospective, multicenter, open-label, first-in-human Phase 1/2 clinical studies to evaluate the
safety, tolerability, and efficacy of VC-01™ in patients with T1DM (ClinicalTrials.gov identifier
is NCT02239354). In 2017, ViaCyte launched an open-label, first-in-human Phase 1/2 clinical
trial to evaluate the safety, tolerability, and efficacy of VC-02™ in patients with T1DM and
hypoglycemic unawareness (ClinicalTrials.gov identifier is NCT03163511). No preliminary data
is available as of right now, but the fact that clinical trials are happening today provides hope that
stem cell therapies will help to cure T1DM in very foreseeable future.
However, one aspect of hESCs that raises many ethical questions and may potentially limit their
wide-spread use is the that hESCs harvesting requires the destruction of the embryo 127. Some
examples of ethical issues related with hESCs use and research are destruction of an embryo,
informed and voluntary donation of materials, confidentiality of donor information, medical
risks, protecting the reproductive interests of women in infertility treatment 127. Even though the
hESCs field has shown great success in relatively short period of time, it is important to

29
acknowledge and address some of deficiencies its such as protocol efficiency, risk of
tumorigenesis, immunogenicity, and ethical concerns.
1.2.3.2.4 Induced Pluripotent Stem Cells (iPSCs) derived β-cells
Ethical and immunogenicity concerns can be partly addressed with the use of induced pluripotent
stem cells (iPSCs). In contrast to hESCs, iPSCs can be created from virtually any human somatic
cell through the introduction and expression of four factors, Oct3/4, Sox2, c-Myc, and Klf4 into
the cell 128,129. iPSC-based therapies will allow not only to have unlimited supply of stem cells
but also to have a solution for allograft rejection since transplants will be derived from the same
donor. As mentioned previously, one of the limitations of clinical islet transplantation is the use
of life-long immunosuppression to reduce the allograft rejection. Even though autologous iPSCs-
derived β-cells would probably be destroyed by the same mechanisms that destroyed native β-
cells in autoimmune T1DM, the body should be able to recognize the tissue as self and do not
attack through the mechanisms used in xenograft and allograft rejections. Macro- or micro-
encapsulation of β-cells into special semipermeable membrane made from non-immunogenic
material that allows nutrient exchange but prevents immune cell infiltration may help overcome
the autoimmunity problem 129. Also, genetic editing of iPSCs-derived β-cells such as removing
or modifying antigenic genes of β-cells may potentially reduce autoimmune rejection.
Furthermore, autologous iPSCs-derived β-cells could be effectively used in non-autoimmune
diabetes such as T2DM. Combination of iPSCs-derived β-cells with gene editing technologies
such as CRISP/Cas9 would help to deliver personalized therapies for MODY patients.
The fact that iPSCs do not require embryo sacrifice relieves them from many ethical questions
such as destruction of an embryo and protecting the reproductive interests of women in infertility

30
treatment that are applicable hESCs. This will simplify the barriers of using human iPSCs in
research and therapeutics and help to accelerate the development of the field.
The field is even newer than hESCs field. Only with Yamanaka’s and Takahashi’s revolutionary
work in 2006 in elucidating necessary transcription factors to induce pluripotency the field has
gained a momentum 128. In 2009, Maehr and colleagues reprogrammed fibroblast cells from
T1DM patients into iPSCs and subsequently into insulin-positive and glucose responsive cells in
vitro 130. Similarly, in 2013, Thatava and colleagues induced epidermal cells from T1DM
patients to become iPSCs, and the subsequently into islet-like clusters which expressed insulin,
glucagon and somatostatin 131. In 2012, Jeon and colleagues successfully converted mouse
somatic cells into iPSCs and then into insulin-producing β-cell-like cells; these cells expressed β-
cell markers such as IAPP, INS, and GLUT2, responded to glucose stimulation in vitro, and
corrected hyperglycemia in vivo 132. These results are remarkable because they are showing that
the field is moving forward. In 2013, Takakashi and her team converted skin cells from patients
with age-related macular degeneration into iPSCs, and then they converted these cells into retinal
pigment epithelium (RPE) sheets; in 2014, these autologous RPE sheets were transplanted into
one of the patients to treat the condition 133. Patient’s macular degeneration was halted and her
vision brightened 133
Given these results and achievements iPSC-derived therapies would allow personalized, on-
demand, and targeted therapies if certain aspects are addressed. Specifically, in T1DM
autologous iPSC-derived β-cells have the potential to cure the diabetes if protocol is optimized,
and immunogenicity related to β-cells and ethical concerns are addressed.

31
1.3 Mesenchymal Stromal Cells (MSCs) for β-cell Transplantation
Another approach that can be taken to improve clinical islet transplantation is to harness the
beneficial properties of Mesenchymal Stromal Cells (MSCs) to improve islet survival and
function. These stem cells that are found in the stroma of most the tissues in the human body
have self-renewal, differentiation, angiogenic, antimicrobial, and immunomodulatory capacities
134,135. Our group have previously showed that MSCs from the bone marrow and pancreas
protected the islets from the effect of pro-inflammatory cytokines by secreting cytoprotective
factors in vitro 136. Furthermore, we showed that co-transplantation of the bone-marrow derived
MSCs resulted in mice reaching normoglycemia faster, having better glucose tolerance, and
having more graft-derived cellular insulin 137. Given these optimistic results it is worthwhile to
discuss in details what exactly are the MSCs.
1.3.1 Characterization of MSCs
Friedenstein’s pioneering work in 1970’s lay the groundwork in the field of, which later became
knowns as, MSCs 138-140. In one of the studies, he plated bone marrow aspirates in plastic culture
dishes and removed non-adherent cells after about 4 hours of seeding. Friedenstein observed that
some cells tightly adhered to the plastic and started rapidly multiplying after about 2-4 days. The
colonies of these spindle shaped plastic-adherent cells resembled small deposits of bone or
cartilage. Further studies revealed the ability of these cells to differentiate into osteoblasts,
chondroblasts, and adipocytes 138.
Initially referred to as a colony-forming unit fibroblast (CFU-F) by Friedenstein et al, these
multipotent stem cells spiked an interest by the researchers from different laboratories 141,142.
However, with an increased and widespread interest the isolation, processing protocols and

32
defining characteristics of MSCs became inconsistent among different investigators 143. Aimed to
tackle this problem and provide common framework for researchers to come to consensus in
terminology and characteristics, the International Society of Cellular Therapy (ISCT) proposed
minimal criteria to define MSCs 143. According to ISCT’s 2006 position statement, these cells
should be called multipotent Mesenchymal Stromal Cells (MSCs), they must adhere to the
plastic, express panel of positive and negative markers, and have the ability to differentiate into
adipocytes, chondroblasts, and osteoblasts.
1.3.1.1 Plastic adherence
First criterion of ISCT in defining MSCs is plastic adherence. Friedenstein used plastic-
adherence as a characteristic to differentiate between adhering MSCs and non-adhering
Hemopoietic Stem Cells (HSCs). Since then most of the investigators have been focusing on
adherent cells for further investigation of MSCs. However, many researchers have demonstrated
the possibility of deriving MSCs from the non-adherent portion of bone marrow aspirates 142.
Therefore, despite the restrictive criterion of ISCT one should be mindful about the possible
existence of MSCs that do not necessarily adhere to the plastic after the isolation from the tissue.
Furthermore, plastic-adherence alone is not sufficient criterion to identify MSC from a
population of cells since functionally dissimilar cell type, fibroblast, morphologically is very
similar to MSC. Fibroblasts are specialized cells in a tissue that secrete extracellular molecules to
form stroma, structural part of a tissue; they also play role in tissue development, maintenance,
and repair 144. Following seeding and under standard cell culture conditions both MSCs and
fibroblasts adhere to the plastic and take on spindle-shaped morphology with long protrusions
145. Therefore, under phase contrast microscopy MSCs and fibroblasts are indistinguishable.

33
1.3.1.2 Cell Surface Markers
Second criterion of ISCT in defining MSCs is the expression of specific cell surface markers.
Since there is no one single known marker that can be used to identify MSCs, ISCT proposed a
panel of positive and negative markers which should help to reveal MSCs from the mixture of
different cells 146. To satisfy the second criterion, at least 95% of the MSC population must
express positive markers such as CD105 (known as endoglin), which is predominantly expressed
in angiogenic endothelial cells and acts as co-receptor for transforming growth factor (TGF)-β1
and TGF- β2; CD73 (known as ecto 5’ nucleotidase, Ecto5’NTase) which catalyzes the
extracellular dephosphorylation of AMP to anti-inflammatory adenosin; and CD90 (known as
Thy-1) which is expressed in various cell types and specifically in MSCs it may play an
important role in maintaining stemness 146-149. Furthermore, less than 2% of the MSC population
can express negative markers such as CD45, which is pan-leukocyte marker; CD34, which marks
primitive hematopoietic progenitor and endothelial cells; CD14 or CD11b which mark
monocytes and macrophages; CD79α and CD19 which mark B-cells; and HLA-DR is a member
of the MHC class II family proteins which are expressed on professional antigen-presenting cells
(APCs) such as dendritic cells, B cells, and macrophages 150-152.
1.3.1.3. Trilineage Differentiation
Third criterion of ISCT in defining MSCs is their multipotent differentiation potential. To induce
adipogenesis, cells are cultured in adipogenic cocktail which usually contains insulin,
dexamethasone, and 3-isobutyl-1-methyl xanthine (IBMX). Insulin activates ERK and Akt/PKB
pathways which are essential for adipogenesis in vivo; dexamethasone inhibits the expression of
Preadipocyte factor 1 (Pref-1), which is known to be inhibitor of adipocyte differentiation; and
IBMX by inhibiting cAMP- and cGMP-degrading phosphodiesterases it causes increased levels

34
of cAMP and cGMP, which results in activation of adipogenic promoting cAMP-responsive
element binding proteins and Epac pathway 153,154. There are many publications showing the
adipogenic potential of MSCs; however, there is no one standard protocol used by everybody
.155. Regardless of that, as long as the cocktail contains the important trio of insulin,
dexamethasone, and IBMX MSCs differentiate into adipocytes containing lipid droplets, which
is a hallmark of adipogenesis 156. Following the culturing period, to visualize lipid droplets in
adipocytes and confirm adipogenesis, Oil red O (ORO) staining is used. This molecule is a
lysochrome (fat-soluble) diazol dye that stains neutral lipids and cholesteryl esters but not
biological membranes 157. Hydrophobic ORO only minimally dissolves in the solvent and upon
contact with lipid droplets ORO readily associates with lipids; under the phase contrast
microscope ORO stain appears as red 157,158.
To induce osteogenesis, cells are cultured in osteogenic cocktail which usually contains
dexamethasone, ascorbic acid, and β-glycerophosphate. Dexamethasone causes increased
transcription of TAZ, MKP1, and FHL2 which in turn result in the transcription and activation of
the master osteogenic transcription factor Runx2 159. Ascorbic acid acts as a cofactor for
enzymes that hydroxylate proline and lysine in pro-collagen; therefore, it is needed for proper
helical structure formation in collagen chains and subsequent secretion of collagen type 1 into
the extracellular matrix (ECM) 159. It is suggested that the interaction between ECM and
osteoblast precursor is crucial for the induction of osteoblast phenotype in these cells 160. Lastly,
β-glycerophosphate plays a crucial role in osteogenic differentiation. It serves as a source of
phosphate needed for hydroxylapatite mineral formation in bones and intracellular signaling to
activate the expression of many genes related to osteogenesis 159. Alizarin red and von Kossa’s

35
staining protocols are commonly used to stain calcium depositions and thereby to assess
osteogenic differentiation 161.
To induce chondrogenesis, cells are condensed into pellets and cultured in chondrogenic cocktail
that usually contains dexamethasone, ascorbic acid, insulin, transferrin, selenous acid and
transforming growth factor (TGF)-β 162. Conditions are selected in an effort to mimic the nature.
For example, it is known that in vivo cell condensation is an important step in cartilage
formation, yet the full mechanism is to be worked out; therefore, pellet culture is adopted in vitro
in order to increase the cell-to-cell contact and mimic the natural chondrogenic process 163. Pellet
formation is also important because it mimics hypoxic environment of chondrocytes and
hopoyxia has been shown as a potent promoter of chondrogenesis163. The family of TGF-β
proteins play in important role in chondrogenesis such as condensation, proliferation, terminal
differentiation, and maintenance of articular chondrocytes 164. It is suggested that TGF-β family
members promote the expression of cartilage-specific genes expressions through complex
regulation of intracellular pathway molecules such as receptor-regulated Smad proteins (R-
smads), mitogen-activated protein (MAP) kinases, Rho-like GTPase, and phosphatidylinositol-3-
kinase (PI3K)/AKT pathways 164,165. Synthetic glucocorticoid, dexamethasone, acts through the
intracellular glucocorticoid receptors to induce the expression of collagen XI and enhance TGF-
β-dependent expression of aggrecan, collagen II, COMP, which are the hallmarks of
chondrogenesis 166. Ascorbic acid leads to hydroxylation and processing of procollagen so that it
can form collagen fibrils and be secreted from the cells for extracellular matrix assembly 167.
Extracellular matrix is composed of proteoglycans (PGs) such as aggrecan and fibrous proteins
such as collagens, elastins, fibronectins and laminins 168. Safranin O is a dye molecule used to

36
stain sulfated glycosaminoglycans which are structural components of PGs and the intensity of
staining is directly proportional to the PG content in the sample 169.
1.3.2 Sources of MSCs
MSCs are specialized multipotent stem cells that are found in the stroma of many body tissues.
Following their initial isolation from the bone marrow, it has been shown that MSCs can be
isolated from many other body tissues such as adipose tissue, placenta, umbilical cord, amniotic
fluid and membrane, peripheral blood, the lung, heart, synovial fluid, dental tissue, foreskin,
endometrium and menstrual blood 170,171. Even though it has been shown that these cells were
isolated from many different body tissues and labeled as MSCs according to the ISCT’s minimal
criteria, current research progress indicates that there is significant source-dependent differences
in their cell yield per mass of tissue, transcriptome and secretome profiles, and proliferative and
mitotic capacities 170,172-174. Exploring and investigating these differences may help the
regenerative medicine to harness those differential characteristics for more effective clinical
applications.
1.3.2.1 Bone-Marrow Derived MSCs (BM-MSCs)
Friedenstein discovered MSCs from bone-marrow in 1970’s. Since then bone-marrow derived
(BM) MSCs were extensively studies and well characterized. These cells are considered as a
gold standard in the field with which newer MSCs are compared. To isolate BM-MSCs, bone
marrow biopsy and aspiration is performed from the posterior, anterior superior iliac crest, or
sternum; and this procedure is associated with significant pain and discomfort 175. Generally,
once the bone marrow is obtained mononuclear cells are isolated using Ficoll-Paque density

37
gradient and seeded into plastic tissue culture-treated dish in culture medium containing 10%
FBS 176,177. Following 48-hour culture MSCs attach to the plastic and unwanted cells are washed
away with media change; from there after media is changed regularly until confluency is
achieved. Once confluent, cells are detached using trypsin solution and passaged at a desired
density. Cells are passaged up until desired passage.
BM-MSCs has been shown to possess lower proliferative capacities compared to embryonic-
stem cells-induced MSCs (ESC-MSCs) 178. This can be explained by the fact that ESC-MSCs
have longer telomeres and enhanced upregulation of the genes important in control of DNA
replication and repair when compared with BM-MSCs 178. Likewise, BM-MSCs has been shown
to possess lower population doublings compared placenta-derived MSCs, 12 versus 64,
respectively 179. Mohammed-Ahmed et al. (2018) showed that BM-MSCs had lower proliferative
capacity and adipogenic potential compared to AD-MSCs 180. However, they also showed that
BM-MSCs possessed higher osteogenic and chondrogenic potential. Similarly, Xu et al. (2017)
demonstrated that BM-MSCs had higher osteogenic and lower adipogenic potential compared to
AD-MSCs 181. These results support the notion that the cells are affected by their
microenvironments and possess source-dependent characteristics and potential.
In the context of islet transplantation, we showed that co-transplantation of islets with human
BM-MSCs enhanced graft maturation resulting in mice reaching normoglycemia significantly
faster and having better glucose tolerance 137.

38
1.3.2.2 Adipose Derived MSCs (AD-MSCs)
Fat depots are broadly divided into two main categories: subcutaneous depots, which include fat
under the skin in the buttocks, thighs, and abdomen regions, and intra-abdominal fat depots,
which include mesenteric, omental, and perirenal fat deposits 182. Subcutaneous adipose tissue is
an attractive alternative to bone marrow for harvesting MSCs since obtaining subcutaneous fat is
relatively easier and less painful procedure for a donor. To isolate MSCs from adipose tissue, the
tissue must be harvested and finely minced with a scalpel or scissors to increase the surface area
for the enzyme digestion; then, the sample is digested with collagenase solution 176. Resulted
mixture is centrifuged to condense MSCs into pellet and subsequently seed them into plastic
tissue culture-treated dish. Once confluent, cells are detached from the dish using trypsin and
passaged at a desired density; and this cycle is repeated up until desired passage. Senescence
According El-Badawy et al. (2016), rat inguinal fat pad-derived AD-MSCs and BM-MSCs
showed similar in vitro profiles with respect to morphology, differentiation potential, and cell
surface marker expression. However, in vivo AD-MSCs transplants caused enhanced
vascularization which was evidenced by CD31 (an endothelial cell marker), vascular endothelial
growth factor (VEGF; a potent angiogenic factor), SMA (a marker for vascular smooth muscle
cells) and MMP9 183. El-Badawy et al. (2016) also showed that when exposed to superoxide
stress and ischemia AD-MSCs showed better resistance than BM-MSCs. These results suggested
that AD-MSCs can probably better withstand hypoxic environment and oxidative stress when
transplanted into avascular site. Furthermore, it was found that in vitro BM-MSCs reached the
onset of replicative senescence earlier than AD-MSCs obtained from the same donor 184.

39
1.3.3 MSCs in tissue repair and regeneration
One of the most important reasons that interest in studying MSCs has increased greatly from its
fist discovery is that MSCs play an important role in tissue repair and regeneration.
Normally, when the tissue gets damaged due to various factors immune system responds by
activating inflammatory pathways in order to deal with injury-causing stimuli and facilitate the
tissue healing. Initially, to minimize the blood loss from the injured site local coagulation and
local vasoconstriction occurs. At the site of injury vascular permeability increases to allow
leukocyte recruitment and accumulation. Then, neutrophils, mast cells, monocytes, and
macrophages gets attracted to the injured site by various chemokines and chemotactic agents
such TGF-β, formylmethionyl peptides produced by bacteria, platelet-derived growth factor
(PDGF), elastin and collagen breakdown products 185. These leukocytes secrete various
inflammatory mediators such as interleukin (IL)-1β, IL-6, IL-8, TNF-α, and IFN-γ to enhance the
inflammation 186. Macrophages, one of the most important regulatory cell, secretes TGF- β,
TNF- α, heparin binding epidermal growth factor, fibroblast growth factor (FGF), which are key
molecules in activating keratinocytes, fibroblasts, and endothelial cells 185. These factors lead to
increased synthesize of extracellular matrix to and epithelialization. Once the injury gets
resolved, complex processes occur to end the inflammation and if the injury does not get
resolved or abnormality occurs then acute inflammation transitions into chronic inflammation 186.
This can lead to devastating effects.
MSCs can minimize the tissue damage by suppressing inflammation and promoting regeneration,
enhance the survival of cells by secreting trophic and angiogenic factors, induce bactericidal
effects. Current literature indicates that MSCs induce their effects through direct cell-to-cell
interaction and secretion of paracrine factors locally or systemically 187. MSCs secrete

40
cytokines, anti-oxidants, pro-angiogenic factors and trophic molecules to alleviate stress
response and apoptosis and enhance the repair 187. Specifically, at the site of inflammation MSCs
can sense the environment and respond to the stimuli by secreting at least 11 soluble cytokines:
TSG-6, hepatocyte growth factors (HGF), transforming growth factor (TGF)-β, prostaglandin
(PG) E2, IL-6, IL10, IL-1 receptor antagonist (IL-1RA), inducible nitric oxide (NO) synthase,
indoleamine 2,3-dioxygenase (IO), galectin, and human leukocyte antigen (HLA)-G 188. TSG-6
inhibits inflammation by binding to hyaluronic acid (HA) which attracts CD44+ leukocytes and
promotes leukocyte migration; IL-1RA prevents IL-1α and IL-1β function in macrophage
activation and prevents T-cell activation; PGE2 suppresses T-cells; IDO is another T-cell
repressor; NO is macrophage regulator and T-cell suppressor; TGF-β1 inhibits T-cell activation,
macrophage activation, and dendritic cell migration 189. It has been shown that MSCs can
attenuate the release of pro-inflammatory TNF-α and IFN-γ, and augment the production of anti-
inflammatory IL-10 and IL-4 185. Anti-microbial effects are mediated either by secretion of anti-
microbial factors such as LL-37, or through the secretion of immunomodulatory factors that
enhance immune cell-mediated killing 185.
MSCs secrete anti-apoptotic and trophic factors that can help reduce the tissue damage and
enhance the healing process. It is important to acknowledge that these molecular processes are
complex. However, researchers are actively working to unveil and elucidate these complex
biochemical interactions. Block et al. (2009) demonstrated that MSCs reduced apoptosis of UV-
irradiated skin fibroblasts by secreting stanniocalcin-1 (STC-1), a peptide hormone that controls
calcium metabolism and increases cell resistance to damage 190. Kwon et al (2016) found that
Wharton’s jelly-derived MSCs secreted XCL-1, an important anti-apoptotic factor, that
prevented stress-induced cell death in skeletal muscles both in vitro and in vivo Similarly,

41
Shologu et al (2018) showed that cells which were pre-treated with MSC conditioned media had
significantly preserved the cell viability when exposed to hypoxic stress 191.In addition to
decreasing cellular apoptosis, MSCs has shown to secrete various trophic factors. It has been
shown that in vitro MSCs induce proliferation of keratinocytes, dermal, fibroblasts, and
endothelial cells. Keratinocytes are the cells that will form new epithelium and restore barrier;
fibroblasts are considered as the workhorse for ECM reconstruction; endothelial cells are needed
to rebuild the vasculature and provide the access for the local tissue with nutrients and oxygen.
Kalinina et al (2011) suggested that MSCs can secrete neurotrophic growth factors such as basic
fibroblast growth factor (bFGF), hepatocyte growth factor (HGF), nerve growth factor (NGF),
brain-derived neurotrophic factor (BDNF), and glial cell line-derived neurotrophic factor
(GDNF) 192.
Finally, MSCs have been shown to induce blood vessel formation which can further enhance
wound repair and tissue regeneration. It is important to understand that blood vessel formation is
divided into three mechanisms: vasculogenesis (de novo blood formation); angiogenesis is the
sprouting of existing blood vessels which occurs under conditions of ischaemia and hypoxia; and
arteriogenesis is the growth of smaller collateral vessels which happens in response to larger
vessel blockage and sheer stress in endothelial cells of vascular wall 193. Numerous studies have
shown that MSCs enhance vasculature formation in each of described mechanisms 193. Pro-
angiogenic effects are attributed to the factors secreted by MSCs which include bFGF (FGF2),
VEGF, TGF-β, PDGF, angiopoitin-1, placental growth factor (PGF), IL-6, monocyte
chemotactic protein-1 (MCP-1), HGF, and stromal-cell-derived factor-1 (SDF-1) 194. VEGF
elicits its effects by binding to VEGF receptor, which then activates intracellular protein kinase
B to inhibit apoptosis, the mitogen-activated protein kinase (MAPK) pathway to induce

42
proliferation, src kinase, focal adhesion kinase, and p38 MAPK to cause cell migration 195. FGF2
bins to FGF receptor and results in the activation of many intracellular pathways such as Ras,
Src, PI3K and PLC 196. The main action by which FGF2 stimulates angiogenesis is through the
induction of VEGF expression in endothelial and stromal cells, and regulation of VEGF
signaling.
Given these immunomodulatory, bactericidal, anti-apoptotic, and pro-angiogenic
properties of MSCs, they could be used as a co-cellular therapy to improve islet transplantation.
1.4 Summary
T1DM is a multigenic autoimmune disorder caused by destruction of insulin producing β-cells
that reside in the islet of Langerhans of the pancreas. This leads to insulin insufficiency, impaired
blood glucose control, and body starvation, which can be fatal if not managed. Islet
transplantation is an attractive alternative to daily insulin monitoring and injections. However, at
this stage this procedure is reserved for small subsets of T1DM patients and requires some major
improvements for it to be widely available. Major limitations of islet transplantation are gradual
loss of a graft caused by hypoxic environment and IBMIR, limited islet supply, and the
requirement for life-long immunosuppression, which opens the door for opportunistic infections
and side-effects. MSCs are specialized and easily-obtained stem cells found in almost all body
tissues. They have the capacity to regulate immunity, promote angiogenesis and tissue
regeneration, and induce bactericidal effects. MSCs from different body tissues appear to behave
differently suggesting that cell ontology and cell microenvironment may play certain roles in
their characteristics and functions. We have previously demonstrated the cytoprotective effects

43
of human bone-marrow-derived and pancreatic-derived MSCs on human islets from pro-
inflammatory cytokines in vitro 135. Furthermore, our group have also showed that islets co-
cultured with bone-marrow-derived MSCs had greater intracellular insulin and glucose-
stimulated insulin secretion; co-transplantation of islets with bone-marrow-derived MSCs
resulted in significantly earlier correction of hyperglycemia than transplantation of islet alone in
mice 137.
Current research suggests that not all MSCs are the same and that there is source-dependent
differences in their cell yield per mass of tissue, transcriptome and secretome profiles, and
proliferative and mitotic capacities . We think that there are microenvironment-dependent
differences among different types of MSCs and that MSCs that are ontologically and
anatomically closer to the islets might be more beneficial to them. To-date there is no reported
study on visceral fat-derived MSCs specifically from peripancreatic region. Therefore, aim of
this thesis was to isolate and examine MSCs derived from human peripancreatic adipose tissue.

42
Chapter 2: Isolation and Characterization
of Mesenchymal Stromal Cells from the
Visceral Adipose Tissue in Peripancreatic
Region

43
2.1 Introduction
Type 1 Diabetes Mellitus (T1DM) is a multigenic autoimmune disorder that leads to the
destruction of insulin producing β-cells of the pancreas by the host immune system 8. This can
lead to chronic hyperglycemia, diabetic ketoacidosis (DKA), retinopathy, nephropathy,
neuropathy, and serious cardiovascular complications 26,35,36. Edmonton protocol (EP) developed
by the Islet Transplant Group in Edmonton is a promising cure for T1DM; however, at its current
state it is reserved for specific subsets of T1DM patients that have unstable T1DM and
hypoglycemia unawareness, severe hypoglycemic episodes and glycemic lability that cannot be
controlled with intensive insulin therapies 197.
Some of the major limitations of EP that need to be overcome for it to be widely available are
chronic immunosuppression to prevent allograft rejection, limited islet supply, and graft loss
86,198. Chronic immunosuppression therapy caused mouth ulcers, diarrhea, anemia, and ovarian
cysts in females; it is also opens the door for opportunistic infections 198,199. Some of the factors
that can contribute to islet graft loss are instant blood-mediated inflammatory reaction (IBMR),
intrahepatic hypoxic environment, slow revascularization, detrimental effects of
immunosuppressive drugs, and chronic allograft rejection 200,201.
Mesenchymal Stromal Cells (MSCs) are multipotent stem cells found in the stroma of most of
the tissues in the body 202. These cells have self-renewal capacity and can be differentiate into
adipocytes, osteoblasts, and chondrocytes 143. Furthermore, MSCs can suppress the
inflammation, and promote tissue repair and regeneration through the secretion of cytokines,
anti-oxidants, pro-angiogenic factors, anti-apoptotic factors, antimicrobial factors, and trophic
molecules 187,189,190,193,203.

44
The International Society for Cellular Therapy (ISCT) formulated minimal criteria for defining
multipotent mesenchymal stromal cells (MSCs). First, they must adhere to the plastic 143.
Second, these cells must highly express (≥ 95%) positive cell surface markers such as CD105,
CD73, CD90, and minimally express (≤ 2%) negative cell surface markers such as CD45, CD34,
CD14 (or CD11b), CD79α (or CD19), and HLA-DR 143. Third, MSCs must differentiate into
adipocytes, osteoblasts, and chondrocytes 143.
We have previously demonstrated the cytoprotective effects of human bone-marrow-derived and
pancreatic-derived MSCs on human islets from pro-inflammatory cytokines in vitro 135.
Furthermore, our group have also showed that human islets co-cultured with bone-marrow-
derived MSCs had greater intracellular insulin and glucose-stimulated insulin secretion; co-
transplantation of new born pig islets (NPI) with human bone-marrow-derived MSCs resulted in
significantly earlier correction of hyperglycemia than transplantation of NPIs alone in mice 137.
Current research suggests that not all MSCs are the same and that there is source-dependent
differences in their cell yield per mass of tissue, transcriptome and secretome profiles, and
proliferative and mitotic capacities 172-174. We think that there are microenvironment-dependent
differences among different types of MSCs and that MSCs that are ontologically and
anatomically closer to the islets might be more beneficial to them. To-date there is no reported
study on visceral fat-derived MSCs specifically from peripancreatic region. Therefore, aim of
this study was to isolate and characterize MSCs derived from human peripancreatic adipose
tissue.

45
2.2 Material and Methods
2.2.1 Isolation of Peripancreatic Adipose Tissue-Derived MSCs
Peripancreatic adipose tissue was prepared from pancreata acquired by the Clinical Islet
Laboratory at Alberta Health Services or IsletCore University of Alberta. Four deceased multi-
organ donors were processed for either clinical or research islet isolation with appropriate ethical
approval and research consent obtained from next-of-kin of the donor (Table 2.1). This study
was approved by the Health Research Ethics Board (HREB; Pro00001416). Prior to
peripancreatic adipose and islet isolation processing, procured organs were stored in University
of Wisconsin (UW) solution on ice between 3-18 hours depending on the time and location
procurement. During pancreas processing from islet isolation, peripancreatic adipose tissue was
trimmed and utilized for ppaMSCs isolation.
Peripancreatic adipose tissue specimens with a wet weight of 11-14 grams were equally split into
two Falcon 50 ml conical centrifuge tubes (Thermo Fisher Scientific, Massachusetts, USA)
containing 20 ml of 0.15 w/v collagenase Type XI (>1200 CDU/mg; Sigma-Aldrich, Ontario,
Canada). Specimens were minced and incubated in a shaking water bath (37 0C, 40 rpm, 1 hour),
and filtered using 100-μm cell strainer (Fisher Scientific, Ontario, Canada). Filtrate was mixed
with 20 ml of supplemented Minimum Essential Media α (α-MEM; Thermo Fisher Scientific)
and centrifuged for 10 minutes at 1,200 rpm. Supplemented α-MEM contained 10% v/v FBS, 2.5
ng/ml basic fibroblast growth factor (FGF-2; EMD Millipore, Ontario, Canada), 1 mmol/L
sodium pyruvate (Thermo Fisher Scientific), 10 mmol/L HEPES (Thermo Fisher Scientific), 100
units of penicillin/1,000 units streptomycin (Thermo Fisher Scientific). Next, supernatant was
aspirated, and the pellet was washed 2 more times with the same parameters. Following last

46
aspiration, pellets from 2 tubes were combined and resuspended in 2-5 ml of α-MEM depending
on the pellet size for the subsequent cell counting.
Donor # Sex Age
(years)
BMI A1C
D1 F 74 35.8 5.9
D2 M 69 27.2 N/A
D3 M 66 30.1 5.4
D4 F 61 30.8 N/A
Average 67.5 31.0 5.6
S.E.M 2.7 1.8 0.2
Table 2.1 Table showing available donor information such as sex, age, BMI, and A1C. Average donor
age was 67.5 years of age; average BMI was 31.0; and average A1C was 5.6.
2.2.2 Cell counting using Crystal Violet and Initial Seeding
To count mononucleated cells, 20 μL of cell suspension obtained from the previous collagenase
digestion step was mixed with 20 μL of 1:50 Crystal Violet (CV; Sigma-Aldrich) and incubated
for 5 minutes at room temperature. Next, 12 μL of the cell suspension mixture was pipetted onto
hemocytometer and the cells at 4 corner squares of the hemocytometer were counted. Total
mononucleated cell number was calculated using the Formula 2.1. Once the cells have been
counted, they were seeded into T175 flasks at a density 2,600-29,048 cells/cm2 (Sigma-Aldrich).
The flasks were incubated 1-3 weeks depending on confluency and the media was changed
during the second week post-isolation.
𝑇𝑜𝑡𝑎𝑙 𝑐𝑒𝑙𝑙𝑠 = (𝑇𝑜𝑡𝑎𝑙 𝑐𝑒𝑙𝑙 𝑐𝑜𝑢𝑛𝑡)
4 𝑥 (𝑑𝑖𝑙𝑢𝑡𝑖𝑜𝑛 𝑓𝑎𝑐𝑡𝑜𝑟) 𝑥 (𝑟𝑒𝑠𝑢𝑠𝑝𝑒𝑛𝑠𝑖𝑜𝑛 𝑣𝑜𝑙𝑢𝑚𝑒) 𝑥 10,000

47
Formula 2.1 Formula for calculating total cells from hemocytometer counts.
2.2.3 Passaging ppaMSCs
Once the cells reached confluency, they were detached from the plastic with 0.25% Trypsin-
EDTA (Corning, Massachusetts, USA). To stop the enzymatic digestion, mixture was diluted
with warm supplemented α-MEM and transferred into 50 ml conical tubes (1 tube per 1 flask).
Tubes were spun at 1,200 rpm for 5 minutes and supernatant was removed. Next, the cells from
all tubes were combined and resuspended in 10-40 ml of supplemented α-MEM, depending on
the pellet size. Counting was performed as described previously but CV was replaced with 0.4%
w/v trypan blue (Sigma-Aldrich). Cells were re-seeded into T175 flasks at a density 11,429-
27,500 cells/cm2 and incubated at 370C/ 5% CO2 till the cells became confluent again. Media
was refreshed every 3-4 days. Cells were passaged 3 times in total (Figure 2.1).
Figure 2.1 ppaMSCs were isolated and passaged 3 times in total. Cells were designated as P0 cells at
the initial seeding, as P1 cells at the end of initial incubation period and after first passaging (Passage
1), as P2 cells at the end of second incubation period and after second passage (Passage 2), as P3 cells

48
at the end of third incubation period and after third passage (Passage 3), as P4 cells at the end of fourth
incubation period.
2.2.4 Colony Forming Unit (CFU) assay and Population Doublings (PD)
CFU assay was performed for D1 and D4 to estimate the fraction ppaMSCs in the isolated cell
mixture of mononucleated cells following ppaMSCs isolation. Predefined number of cells (500
or 320 cells) were seeded in three 100 mm culture treated plates (Sigma-Aldrich) at the same
time of initial ppaMSCs seeding in T175 flasks. They received the same treatment and
conditions as the flasks used for initial seeding. When the cells were passaged the first time
(Passage 1), CFU plates were stopped and analyzed for the number of colonies formed. Briefly,
the media was aspirated, the plates were washed twice with PBS (Thermo Fisher Scientific),
fixed with Z-fix (Thermo Fisher Scientific) for 5 minutes, Z-fix was aspirated, and the plates
were washed with PBS. To stain the cells, plates were incubated with 5 ml of CV for 10 minutes;
then, the CV was removed, and the plates were washed with PBS. After, the plates dried the
number of colonies formed in each plate was counted and using the Formula 2.2 ppaMSCs
fraction was calculated.
𝑝𝑝𝑎𝑀𝑆𝐶𝑠 𝑓𝑟𝑎𝑐𝑡𝑖𝑜𝑛 = 𝐴𝑣𝑒𝑟𝑎𝑔𝑒 𝑛𝑢𝑚𝑏𝑒𝑟 𝑜𝑓 𝑐𝑜𝑙𝑜𝑛𝑖𝑒𝑠 𝑓𝑟𝑜𝑚 3 𝑟𝑒𝑝𝑙𝑖𝑐𝑎𝑡𝑒𝑠
𝑁𝑢𝑚𝑏𝑒𝑟 𝑜𝑓 𝑚𝑜𝑛𝑜𝑛𝑢𝑐𝑙𝑒𝑎𝑡𝑒𝑑 𝑐𝑒𝑙𝑙𝑠 𝑠𝑒𝑒𝑑𝑒𝑑 𝑖𝑛 𝑒𝑎𝑐ℎ 𝑝𝑙𝑎𝑡𝑒
Formula 2.2 Formula used to calculate the fraction of ppaMSCs from total number of mononucleated
cells.
49
Results from the CFU assay were used to estimate the number of cells seeded into the flasks at
initial seeding. Using this data and cell counts during passaging Population Doublings (PD) and
Cumulative Population Doublings (CPD) were calculated for D1 and D4. PDs were calculated
using formula described by Solchaga et al. (2010). For D2 and D3 CFU was not performed.
Therefore, for these two donors PDs at P0 and CPDs were not possible to calculate. However, to
provide two possible PDs at P0 and CPDs for D2 and D3 we used ppaMSCs fraction values from
D1 and D4.
2.2.5 Flow Cytometry for Cell Surface Markers Expression
To assess the cell surface markers expression and cellular phenotypes, P4 ppaMSCs (n=4) were
spun at 500g for 5 minutes to pellet the cells. Supernatant was removed and the pellet was
resuspended in 5 ml of cold PBS. Sample was spun again at 500g for 5 minutes. Supernatant was
removed and the pellet was resuspended in cold flow buffer (1%FBS in PBS; 100 μL/1x106
cells). 100 μL of cell suspension was added per test tube and mixed with 2.5 μg human Fc
blocker (BD Biosciences, Ontario, Canada). Next, 10 μL/tube of CD73-PE, 20 μL/tube of CD90-
FITC, 5 μL/tube CD105-PC7, 5 μL/tube of CD14-APC750, 10 μL/tube CD45-KO, and 10
μL/tube CD34-APC (all from Beckman Coulter, Ontario, Canada) were added to the appropriate
tubes. Test tubes were kept in the fridge for 30 minutes. Cells were washed with 500 μL of cold
flow buffer 3 times by centrifugation at 500 g for 5 minutes at 2-8 0C. Finally, cells were
resuspended in 500 μL of cold flow buffer and analyzed on the CytoFlex Flow Cytometer
(Beckman Coulter).

50
2.2.6 Trilineage Differentiation Assay
2.2.6.1 Adipogenesis
P4 ppaMSCs (n=4) were induced to become adipocytes. Procedure have been described
previously by Bornes et al. (2015). Cells were seeded in a 6-well plate (Thermal Scientific,
Texas, USA) at a density 5 x 10³ cells/cm2 and cultured in 3 ml of supplemented DMEM high
glucose (sDMEM) 2-3 days until confluent. sDMEM was DMEM high glucose (Sigma-Aldrich)
with 10% v/v Inactivated FBS (Sigma-Aldrich), 100 mM HEPES (Sigma-Aldrich), 100 U/mL
penicillin/100 μg/mL streptomycin/029 mg/mL L-glutamine (PSG; Thermo Fisher Scientific).
Next, the experimental group wells (n=4) were cultured in of Adipogenic Induction Medium
(AIM) and control group wells (n=2) in of sDMEM EM for 72 hours. AIM was sDMEM with
additional 1 μM dexamethasone (Sigma-Aldrich), 100 μM indomethacin (Sigma-Aldrich), 0.5 ml
insulin-transferrin-selenium+1 (ITS+1; VWR), 500 μM isobutyl-1-methylxanthine (IBMX;
Sigma-Aldrich). After 72-hour induction period, experimental group was cultured in Adipogenic
Culture Medium (ACM) and control group in sDMEM for 24 hours. ACM was sDMEM
supplemented with 0.5 ml ITS+1. Induction and culture cycle were repeated 3 more times. Then,
cells were cultured in sDMEM for another week and at the end of culture period 2 experimental
wells and 1 control well were stained; the wells were used for RNA extraction. To stain, the cells
were fixed with Z-fix for 10 minute and washed with distilled water (DW). Then, cells were
incubated with 0.3% w/v of Oil Red-O (Sigma-Aldrich) for 60 minutes at room temperature on a
plate shaker. After, Oil Red-O was aspirated and the wells were washed with DW to remove
residual stain. Images were taken using with Nikon Eclipse Ts2 diascopic illumination mode
with 4X objective (Nikon Instruments Inc., NY, USA).

51
2.2.6.2 Osteogenesis
P4 ppaMSCs were induced to become osteoblasts. Procedure have been described previously by
Bornes et al. (2015). Cells were seeded in a 6-well plate at a density 5 x 10³ cells/cm2 and
cultured in sDMEM 2-3 days until confluent. Next, experimental group wells (n=4) were
cultured in Basic Osteogenic Media (BOM) and control group wells (n=2) were cultured in
sDMEM for 21 days with media refreshed twice a week. BOM was sDMEM with 0.1 mM L-
ascorbic acid 2-phosphate sesquimagnesium salt hydrate (Sigma-Aldrich), 10 nM β-
glycerophosphate (Sigma-Aldrich), 10 nM dexamethasone (Sigma-Aldrich). At the end of
culture period, 2 experimental group wells and 1 control group well were stained with 1%
Alizarin Red S (Sigma-Aldrich); the rest were used for RNA extraction. To stain, the cells were
fixed with Z-fix for 10 minutes and subsequently washed with DW. Then, the cells were
incubated with 1% Alizarin Red S solution for 60 minutes at room temperature on a plate shaker.
Finally, stain was removed, and the wells were washed with DW. Images were taken using with
Nikon Eclipse Ts2 diascopic illumination mode with 4X objective (Nikon Instruments Inc.).
2.2.6.3 Chondrogenesis
P4 ppaMSCs were induced to become chondrocytes. Procedure have been described previously
by Bornes et al. (2015). Briefly, cells were resuspended in Chondrogenic Medium (CM) and
transferred into 1.65 ml conical tubes (n=6; 5 x 10⁵ cells/tube). CM was DMEM High Glucose
supplemented with 100 mM HEPES, 1 mM sodium pyruvate, 100 U/ml penicillin, 100 μg/mL
streptomycin, 0.29 mg/mL L-glutamine, 0.1 mM ascorbic acid 2-phosphate, 0.1 μM
dexamethasone, 1x ITS+1, and 10 ng/mL transforming growth factor (TGF)-β3 (Neuromics
Inc.). To form a pellet, cells were spun at 1,500 rpm for 5 minutes. Cells were incubated at 37

52
0C/5% CO2 for 3 weeks in total with media changes twice a week. Following the culture period,
cells were used for histological analysis, glycosaminoglycan (GAG)/DNA assay, and RNA
extraction. To stain the cells, pellets were fixed with Z-fix at least overnight and subsequently
embedded into 2% agarose. Next, pellets were embedded into paraffin and sectioned at 5 μm
thickness. Slides were stained with Safranin O (company). Images were taken using with Nikon
Eclipse Ts2 diascopic illumination model with 4X objective (Nikon Instruments Inc.).
2.2.7 RNA Extraction and Reverse Transcription-Quantitative Real-Time
Polymerase Chain Reaction (RT-qPCR) Analysis of Differentiation Samples
Total RNA was extracted with 1 ml of Trizol (Thermo Fisher Scientific) and purified with
RNease Mini Kit (Qiagen, Ontario, Canada). Briefly, extracted RNA was washed with 200 μL of
chloroform (Sigma-Aldrich). Chondrogenic pellets were grinded with a pestle after adding the
Trizol to facilitate the extraction. Total Aqueous phase was collected, mixed with equal volume
of 75% EtOH (Thermo Fisher Scientific), and transferred into RNEase column (Qiagen). Then,
the tube was spun at 12,000 rpm for 30 seconds. Flow-through was removed and the procedure
was repeated for any remaining RNA-containing EtOH solution. Column was washed with 700
μL of RW1 and RPE (Qiagen). RNA was eluted off the column with RNase free water and
quantified using the NanoDrop 2000c Spectrophotometer (Thermo Fisher Scientific).
Total RNA (500 ng) was reverse transcribed to cDNA using the High-Capacity cDNA Reverse
Transcription Kit (Thermo Fisher Scientific). qPCR analysis was performed as described in
Bornes et. al (2015). To assess adipogenesis the gene expressions of lipoprotein lipase (LPL) and
peroxisome proliferator activated receptor gamma (PPARγ) were studied; gene expression levels
53
were normalized to the mean expression of β-actin, YWHAZ, and SHDA. To assess osteogenesis
the gene expressions of alkaline phosphatase (ALPL), runt-related transcription factor 2
(RUNX2), and osteopontin (OPN) were studies; gene expression levels were normalized to the
mean expression of B2M, HMBS, and SDHA. Finally, to assess chondrogenesis the gene
expressions of aggrecan (ACAN), collagen type 1 alpha 2 chain (COL1A2), collagen type 2
alpha 1 chain (COL2A1), collagen type 10 alpha 1 chain (COL10A1), and SRY-Box 9 (SOX9)
were studied; gene expression levels were normalized to the mean expression of RPL13A,
YWHAZ, and B2M.
2.2.8 Glycosaminoglycan (GAG) and DNA Quantification of Chondrogenic
Pellets
In vitro cultured chondrogenic pellets were assessed for GAG and DNA amount present.
Procedure have been described previously by our group (Bornes et al 2015). Briefly, pellets were
washed in PBS and digested in proteinase K (1 mg/mL in 50 mM Tris supplemented with 1 mM
EDTA, 1 mM iodoacetamide, and 10 mg/mL pepstatin A; Sigma-Aldrich) for the duration of 16
hours at 56 0C. GAG levels were measured with 1-9-dimethylmehtlene blue stain (Sigma-
Aldrich); chondroitin sulfate (Sigma-Aldrich) was used as a standard. DNA levels were
measured with CyQUANT Cell Proliferation Assay Kit (Life Technologies); supplied
bacteriophage λ DNA was used as a standard.
2.2.9 Statistical Analysis
Both descriptive and inferential statistical analyses were performed using GraphPad Prism 8 (San
Diego, CA, USA). Unpaired two-tailed t test or one-way ANOVA multiple comparisons with

54
Tukey’s correction were performed, and statistical significance was tested at P < 0.05. Data are
represented as mean ± standard error of mean (s.e.m.); range.

55
2.3 Results
2.3.1 Morphological Analysis of ppaMSCs
Qualitative morphological analysis of the flasks following the initial seeding revealed that our
collagenase-facilitated digestion of peripancreatic adipose tissue yielded highly populated cell
suspension at 0 hours and the confluency was 0% (Figure 2.2). At 48 hours post-initial seeding it
became apparent some cells adhered to the plastic and display spindle-shaped morphology. Cells
reached ~1% confluency at this point. At 72 hours post-initial seeding cells reached ~5%
confluency and displayed long protrusions from the cell body. At 8 days post-initial seeding cells
reached ~25% confluency and the cells appeared to be increased in size.
Figure 2.2 Qualitative analysis for morphological changes ppaMSCs using phase-contrast microscopy
throughout 9 days reveals gradual adherence of the cells to the plastic and appearance of spindle-
shaped morphology. (A) At 0 hours post-initial seeding highly populated cell-mixture contains floating
but no attached cells. (B) At 48 hours post-initial seeding most of the cells are still floating while only

56
few have attached to the plastic. (C) At 72 hours post-initial seeding more cells attach to the plastic and
display spindle-shaped morphology. (D) At 8 days post-initial seeding there are very few floating cells
and adherent cells occupy greater area. Scale bar represents 100 μm.
2.3.2 Clonogenicity of ppaMSCs
To assess the fraction of mononucleated (MNCs) that were ppaMSCs, colony-forming unit assay
was performed. From 500 D1 MNCs seeded on average 34.33 of those cells formed colonies
(6.9%) (Figure 2.3 A). From 320 D4 MNCs seeded on average 3.33 of those cells formed
colonies (1.0%) (Figure 2.3 B).
Figure 2.3 Images of representative CFU plates showing formed colonies that were stained with
crystal violet (CV; blue). Seeded 500 D1 MNCs yielded on average 34.33 colonies (or 6.9%) as
indicated (A). Seeded 320 D4 MNCs yielded on average 3.33 colonies (or 1.0%) (B).
2.3.3 Growth Kinetics
At each of 3 passages harvested cells were counted and known number of cells were seeded
(n=4). P2 cells had 1.9 ± 0.6; 0.9-3.2 population doublings (PDs), P3 cells 1.1 ± 0.1; 0.8-1.4 PDs,
P4 cells 1.15 ± 0.3; 0.5-1.7 PDs. PDs for D1 P1 and for D4 P1 cells were 6.9 and 10.0,
respectively. PDs for D2 P1 and D3 P1 cells were estimated using CFU results from D1 (6.9%

57
ppaMSCs of total MNCs) and D4 (1.0% ppaMSCs of total MNCs) (Figure 2.4). If 1.0% was
assumed, then PDs for D2 P1 and D3 P1 cells were 10.4 and 10.0, respectively. If 6.9% was
assumed, then PDs for D2 P1 and D3 P1 cell were 7.6 and 7.2, respectively. CPDs for D1 cells
were 9.5 at P2, 10.8 at P3, and 11.3 at P4. CPDs for D4 cells were 10.9 at P2, 12.3 at P3, and
14.0 at P4. CPDs for D2 and D3 varied depending on which PDs for P0 cells were used; both
possibilities were displayed in Figure 2.4. If 1.0% was assumed, then CPDs for D2 were 11.2 at
P2, 12.1 at P3, and 12.9 at P4. Similarly, if 1.0% was assumed then CPDs for D3 were 13.2 at
P2, 14.1 at P3, and 15.8 at P4. If 6.9% was assumed, then CPDs for D2 were 8.5 at P2, 9.3 at P3,
and 10.1 at P4. If 6.9 was assumed, then CPDs for D3 were 10.4 at P2, 11.4 at P3, and 13.0 at
P4.
Figure 2.4 Growth Kinetics in terms of population doublings (PD) and cumulative population
doublings (CPD) of ppaMSCs (n=4). Cells were isolated and seeded into flasks, and after that cells

58
were passaged 3 times. Using the data from CFU assay and cell counts during each passage, PDs (A,
C) and CPDs (B, D) were calculated for D1 and D4; for D2 and D3 CFU assay was not performed; for
these cells two possible PDs (A, C) and CPDs (B, D) outcomes are presented using CFU results from
D1 (6.9%) and D4 (1.0%) (*).
2.3.4 Cell Surface Marker Expression
Flow cytometry analysis revealed P3 cells from four different donors (n=4) expressed
comparable cell surface markers (Figure 2.5). On average, 99.6 ± 0.3%; 98.8-99.9% of the cell
population expressed CD73. On average, 96.2 ± 1.2%; 92.9-98.4% of the cell population
expressed CD90. Similarly, 98.6 ± 0.6%; 96.9-99.2% expressed CD105. Contrary, only 0.3 ±
0.2%; 0.1-1.0% of the cell population expressed CD14. Next, 1.2 ± 0.6%; 0.1-2.2% of the cell
population expressed CD45. Finally, 0.3 ± 0.1%; 0.1-0.5% of the cell population expressed
CD34.
Figure 2.5 Cell surface expression of MSC-characterizing markers in ppaMSCs (n=4). Cells were
analyzed for the MSC surface markers such as CD73, CD90, CD105, CD14, CD45, and CD34.
ppaMSCs after third passage consistently expressed high levels of positive cell surface markers for

59
MSCs (CD73, CD90, CD105) and expressed very low levels of negative markers (CD14, CD45,
CD34). Data are represented as bar graphs with the mean percentage ± standard error of the mean.
2.3.5 Mesoderm Differentiation Potential
P4 ppaMSCs (n=4) were assessed for their mesoderm differentiation potential. Specifically, cells
were cultured in adipocyte-, obsteoblast-, and chondrocyte-induction conditions. Qualitative
assessment showed that ppaMSCs differentiated into adipocytes but not osteoblasts and
chondrocytes (Figure 2.6).
Quantitative gene expression analysis showed that LPL mRNA expression in adipocyte
induction samples from D3 (n=2) and D4 (n=2) were higher than in their control samples D3
(n=1) and D4 (n=1) (Figure 2.7 A). Expression of LPL in D4 induction was significantly higher
than in D3 induction, 0.31±0 and 0.05±0 (p= 0.0009; unpaired t test), respectively. Similarly,
induction samples from D1 (0.02; n=2), D2 (0.02; n=2), D3 (0.04; n=2), and D4 (0.14; n=2)
expressed higher PPARg mRNA than their respective control samples (Figure 2.7 B). Induction
group from D4 expressed PPARg significantly higher than from D1 (p=0.0003; one-way
ANOVA with multiple comparisons and Tukey’s correction), D2 (p=0.0002; one-way ANOVA
with multiple comparisons and Tukey’s correction), and D3 (p=0.0005; one-way ANOVA with
multiple comparisons and Tukey’s correction). This complements qualitative studies where D4
induction samples had more lipids depositions compared to other samples.
Interestingly, in control groups the gene expression related to osteogenesis such as OPN, Runx2,
and ALPL had higher or similar expression levels than in induction groups (Figure 2.7 C-E).
Statistical analysis was not performed between induction and control groups as control samples
had only one replicate.

60
Cells that underwent chondrogenesis induction expressed higher collagen type I (5.72 ± 0.9)
relative to collagen type II (0.006 ± 0.003) and collagen type X (0.06 ± 0.01). D2 cells expressed
significantly higher collagen type II (0.03 ± 0.004 versus 0.007 ± 0.001), collagen type X (0.123
± 0.01 versus 0.06 ± 0.0005), and ACAN (0.002 versus 0.0005) compared to D1 cells. However,
the relative expressions of ACAN, COL2A1, COL10A1, and SOX9 were very low compared to
BM-MSC differentiated chondrocytes 204. Even though Safranin O staining did not detect any
proteoglycans, our pellets produced 9.7 ± 0.5 μg of GAG. Analyzed cells had 5.1 ± 0.5
GAG/DNA ratio. D1 had significantly higher GAG/DNA ratio compared to D4, 7.0 ± 0.7
compared to 4.2 ± 0.2, respectively.
Figure 2.6 P4 ppaMSCs differentiated into adipocytes but not chondrocytes and osteoblasts. P4
ppaMSCs from each donor (n=4) were cultured in adipogenic, osteogenic, and chondrogenic
induction conditions. (A) Cells consistently differentiated into Adipocytes as evidenced by Oil Red-
O (red). (B) Cells did not differentiate into osteoblasts as evidenced by the lack of Alizarin Red S

61
staining. (C, D) Cells formed a pellet similar to chondrogenic pellet; however, these pellets did not
stain for Safranin O (green is fast green). Scale bar in (A-C) represents 100 μm.
Figure 2.7 Reverse Transcription-Quantitative Real-Time Polymerase Chain Reaction (RT-
qPCR) analysis of differentiation samples. Top box (A,B) shows the results for
adipogenesis: LPL (n=2) and PPARg (n=4). Middle box (C-E) shows the results for
osteogenesis: OPN (n=3), RUNX2 (n=3), and ALPL (n=3). Bottom box (F-J) shows the
results for chondrogenesis: COL1A2 (=4), COL2A1 (n=4), COL10A1 (n=2), ACAN (n=4),
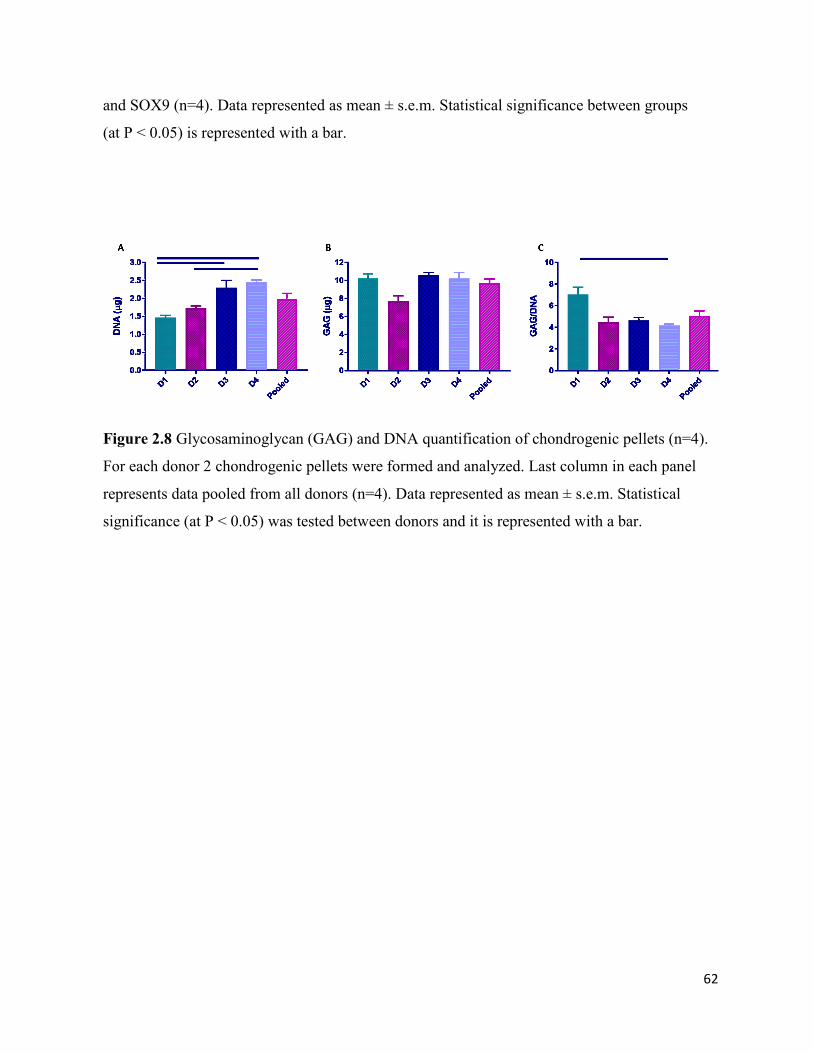
62
and SOX9 (n=4). Data represented as mean ± s.e.m. Statistical significance between groups
(at P < 0.05) is represented with a bar.
Figure 2.8 Glycosaminoglycan (GAG) and DNA quantification of chondrogenic pellets (n=4).
For each donor 2 chondrogenic pellets were formed and analyzed. Last column in each panel
represents data pooled from all donors (n=4). Data represented as mean ± s.e.m. Statistical
significance (at P < 0.05) was tested between donors and it is represented with a bar.

63
2.4 Discussion
In this study we characterized the cells isolated from the visceral fat in the peripancreatic region.
Based on morphological analyses, growth kinetics, cell surface marker expressions, and
differentiation data these cells satisfied plastic-adherence and cell surface marker expression
criteria but not fully differentiation criterion set by ISCT. Therefore, these cells were denoted as
peripancreatic adipose-derived mesenchymal stromal cells (ppaMSCs). Current literature on
visceral fat-derived MSCs is scarce and we believe that our study is first to isolate and
characterize MSCs from visceral adipose tissue specifically in peripancreatic region.
In accordance with The International Society for Cellular Therapy (ISCT), our cells attached to
the plastic, formed colonies, and displayed characteristic spindle-shaped morphology 143. To
estimate the fraction of ppaMSCs in a given population of ppaMNCs, we performed CFU assay
which suggested that the yield was 1.0% for D4 and 6.9% for D1. In comparison, it is suggested
that 1% of adipose tissue cells and 0.001%- 0.002% of BM aspirate cells are MSCs 205. For D2
(Male; 69 y.o.) and D3 (Male; 66 y.o.) ppaMSCs that did not undergo CFU assay, we provided
two possibilities using the ppaMSC fractions obtained from D1 (Female; 74 y.o.; 6.9%) and D4
(Female; 61 y.o.; 1.0%). Previous literature, suggest that age is inversely related to MSC
frequency, colony-forming efficiency, functionality, and proliferation abilities possibly due to
progressive telomere shortening, DNA damage, free radicals, and epigenetic alterations 206,207. In
vitro aging of MSCs is another very import factor that affects MSCs function and potential 144,207.
Furthermore, MSCs cannot expand indefinitely; it was suggested that MSCs can undergo 15-30
PDs at maximum 207. Our cells expanded after each of 3 passages. The expansion potential
rapidly declined and plateaued after passage 1. P1 cells from D1 and D3 had already undergone
6.9 PDs and 10 PDs, probably reaching their growth plateau. This could partly explain why PDs

64
of our cells at P2 and thereafter were so low. Jin et al. (2013) expanded their bone marrow-
derived MSCs and adipose-derived MSCs up to P14 and their PDs for P1 cells were around 2.5
and 1.2, respectively 208.
In our study, CFU analysis showed that the older donor with higher BMI had higher ppaMSCs
yield per mass of adipose tissue than younger donor with lower BMI. It is proposed that age is
negatively correlated with cell yield 206,207. This suggests that there might have been other donor
characteristics that could have affected ppaMSCs yield; or one or both donors could have been
the outliers. However, ppaMSCs from younger donor (D4) had higher population doublings at
P1 and cumulative population doublings throughout P2, P3, and P4 than older donor (D1) which
is in accordance with general theory of age and proliferation capacities of cells 206. Our
propositions with other donors did not yield any correlation. Therefore, more investigation with
more donors is required to further elucidate the relationship between age and proliferation
capacities in ppaMSCs.
There is no established one single cell surface marker that exclusively identifies MSCs from
other types of cells and MSCs differ in the panel of cell surface markers expression depending on
their origin and culture conditions 209. However, ISCT suggested a minimal panel of positive and
negative cell surface markers for identifying MSCs 143. In accordance with ISCT, on average,
ppaMSCs expressed more than 95% of positive cell surface markers such as CD73, CD90,
CD105 and less than 2% of negative cell surface markers such as CD14, CD45, and CD34. This
clearly satisfied the ISCT’s second criterion.
Plastic adherence criterion for MSCs came from early studies of Friedenstein where he plated
bone marrow aspirates onto plastic culture dishes and removed non-adherent cells after about 4
hours of seeding 138-140. He observed that attached cells rapidly proliferated and some colonies

65
resembled small deposits of bone or cartilage 138. Later studies discovered the ability of these
cells to differentiate into osteoblasts, chondroblasts, and adipocytes, and they were named as
MSCs 138. However, fibroblasts which are specialized cells that secrete extracellular molecules to
form stroma also attach to the plastic and are phenotypically are indistinguishable from MSCs
145. Furthermore, similar to MSCs, fibroblasts can be expanded in vitro 210,211. Fibroblasts
expressed “MSC-defining” positive cell surface markers such as CD73, CD90, and CD105 and
lacked the expression of negative cell surface markers such as CD14, CD45, and CD34 145,212,213.
Future studies could screen for further cell surface markers such as CD106, CD146, ITGA11,
SSEA-4, and GD-2 that are suggested to be MSC-specific 144.
Schneider et al. (2017) reported that were able to isolate MSCs from adipose tissue from
liposuction (subcutaneous fat) and resected fat during implantation of a hip endoprosthesis 214.
Their morphological analysis results and flow cytometry results are very comparable to ours and
they concluded that their cells were MSCs. It should be noted that abdominal subcutaneous fat
and intra-abdominal visceral fat are two different distinct fat depots. Schneider et al. (2017)
designated their cells as MSCs without differentiation studies endoprosthesis 214. However,
unlike them we did further differentiation studies to assess differentiation capacity of our newly
isolated cells. A group from Singapore reported that they were able to isolate adipose-derived
stem/stromal cells (ASCs) from visceral fat (VS) mainly based on their flow cytometry data and
adipogenic differentiation capacity of their cells; both of these analyses were comparable to ours
215. They reported that ASCs derived from VS had poor or very poor adipogenic potential; and
these VS-ASCs had lower adipogenic potential than SC-ASCs 215. Similarly, Potdar et al. (2019)
reported that they were able to isolate MSCs from visceral fat mainly based on the expression of
specific positive (CD105, CD13, SOX2, OCT4, NONG, LIF) and negative (CD45, CD34)

66
molecular markers 216. However, they did not perform differentiation studies to show that the
cells they were working with were truly “MSCs”.
To satisfy ISCT’s third criterion newly isolated cells underwent differentiation protocols for
adipocytes, osteoblasts, and chondroblasts. As expected, ppaMSCs readily differentiated into
adipocytes as confirmed by hydrophobic Oil Red-O (ORO) staining which stains for lipid
droplets in cells. Youngest donor (D4; 61 y.o.) expressed highest levels of adipogenesis related
genes and had the most lipid droplets. This is in accordance with general theory of the
relationship between the MSCs age and their functional potential 144,207. To our surprise, the cells
from all donors did not differentiate into osteoblasts when they underwent our osteogenic
differentiation protocol and chondroblasts under chondrogenesis differentiation protocol as
evidenced by qualitative and quantitative analyses. Articular cartilage is composed of
chondrocytes and extracellular matrix (ECM), which is predominantly composed of collagen
type 2, aggrecan, and hyaluronic acid 217. Gene expression analysis of chondrogenic pellets
showed that our pellets expressed very low aggrecan, collagen type II and collagen type X,
which is a marker of late stage chondrocyte hypertrophy associated with endochondral
ossification 218,219. Sox9 is known to be expressed in all chondroprogenitors and differentiated
chondrocytes but not in hypertrophic chondrocytes; it is important regulator of chondrocyte
differentiation 220. Sox9 was very minimally expressed in our cells, which suggests that
ppaMSCs did not undergo chondrogenesis. However, these cells expressed relatively high levels
of type I collagen, which is found in skin, tendon, bone, ligaments, dentin, interstitial tissues 221.
In bones, type I collage is the most abundant protein, accounting for up to 90% of the organic
matrix 222,223. Furthermore, GAG/DNA ratio found in our study with ppaMSCs was higher than
that previously described with BM-MSCs 204. This discrepancy between absence of proteoglycan

67
staining by Safranin O and the presence of GAG detected by RT-qPCR could be explained by
fact that samples where monoclonal antibodies detected chondroitin sulphate and keratan
sulphate Safranin O staining was not detectable 169. This could mean that our cells produced
chondroitin sulphate or keratan sulphate which are found in bones too 224,225. Then one
possibility arises where our cells started forming bone ECM instead of cartilage ECM.
Baglioni et al. (2009) reported that they were able to successful induce osteogenesis and
chondrogenesis in MSCs from the visceral fat as evidenced by Alizarin Red S and Toluidine
Blue staining, respectively 226. It should be noted that donor populations in our study and
Baglioni et al. (2009) differed with respect to their BMI; their donors had normal weights with
BMI ~23.4, whereas our donors were obese with BMI ~31.0 226,227. Visceral adipose tissue is
hormonally active tissue that secretes different bioactive molecules and hormones such as
adiponectin, leptin, tumor necrosis factor, resistin, and interleukin 6 (IL-6) 228. Furthermore,
abdominal obesity has been linked to pathological conditions such as impaired glucose and lipid
metabolism, insulin resistance, increased predisposition to cancers of the colon, breast, and
prostate 228. It was reported that even gold-standard bone-marrow-derived MSCs from high BMI
donors had impaired osteogenic and diminished adipogenic differentiation capacity 229. In
addition it was shown that MSCs from older patients have compromised chondrogenic and
osteogenic but not adipogenic differentiation potentials 207. Our results may confirm those
findings as our donors were elderly patients (mean age was 67.5) and had high BMI (mean BMI
was 31.0). Furthermore, the cells that we used for differentiation studies have undergone 11.3
PDs (D1) and 14 PDs (D4). As mentioned, it was suggested that human MSCs can undergo
approximately 15-30 PDs 207. Therefore, impaired osteogenic and chondrogenic ability of our
cells may be explained by these cumulative factors such as in vivo age, in vitro age, and donor

68
BMI. On the other hand, since the visceral fat is a big tissue and we specifically isolated
ppaMSCs from the adipose tissue adjacent to the pancreas, the difference in differentiation
capacities observed in our study and by Baglioni et al. (2009) might confirm the acknowledged
effect of microenvironment on MSCs 170,172-174.
If more vigorous examination of these cells show that they are not MSCs then another possibility
is that our cells are adipocyte progenitor cells (APCs) since the cells from all donors where of
adipose origin and readily differentiated into adipocytes. Phenotypically APCs are characterized
by the expression of CD29, CD34, Sca-1, PdgfRα, and CD24, and the lack of expression of
CD45 and CD31 230. Therefore, our cells could be screened for APC markers to assess whether
the cells are APCs or MSCs.
Future studies could examine the effects of age and BMI on ppaMSCs. For example, ppaMSCs
from younger versus older donors, and from high BMI versus low BMI donors could be
compared with regards to their yield, proliferation, secretome profiles, and differentiation
capacities. Furthermore, ppaMSCs from different donor categories could be compared with
respect to their effects on islets in vitro and in vivo. If the age- and BMI-related differences exist,
then testing ppaMSCs from the best donor group and comparing their effects on islets compared
with MSCs from different sources from matched donors could elucidate the effect of ontology
and microenvironment of the cell on its function and potential. This could support or reject the
hypothesis that MSCs that are ontologically and anatomically closer to the pancreas could
enhance the islet function better than MSCs that are further away.
In conclusion, we isolated and characterized ppaMSCs from peripancreatic adipose tissue. To
our knowledge this is the first documented study to examine MSCs from visceral adipose tissue
in the area specifically adjacent to the pancreas. Our cells expressed MSC markers and showed

69
the ability to differentiate into adipocytes but not osteoblasts and chondroblasts. Our group have
previously shown that MSCs from bone-marrow and pancreas protect islets from harmful effects
of inflammatory cytokines in vitro 135. Furthermore, we also showed that bone-marrow derived
MSCs improved islet function in vivo 137. Literature indicates that microenvironment effects the
potential of MSCs. This motivated to study newly characterized MSCs that are similar in the
microenvironment to the pancreatic islets. Characterizing and establishing ppaMSCs will help to
transition studies involving the effects of ppaMSCs on islet function.

Chapter 3: Conclusion and Discussion

70
3.1 General Discussion and Future Direction
Multipotent Mesenchymal Stromal Cells (MSCs) could potentially address some of the
limitations of islet transplantation. MSCs are multipotent stem cells that are found in the stroma
of most tissues in human body; these cells have self-renewal, differentiation, angiogenic,
antimicrobial, and immunomodulatory capacities 134,170,171,193. When the tissue gets damaged,
MSCs can minimize this damage by suppressing inflammation, promoting regeneration and
angiogenesis, enhancing cell survival 187-190,193.
Our group have previously demonstrated that human bone marrow-derived MSCs (BM-MSCs)
protected human islets from the detrimental effects of cytokines by preserving glucose-
stimulated insulin secretion in the islets and preventing β-cell apoptosis 135. Encouraged by
results in vitro, our group have moved on to test MSCs in vivo. Diabetic immunocompromised
mice were transplanted with porcine islets or islets with human BM-MSCs under the kidney
capsule, and were observed for over 30 weeks 137. The group of mice that received co-transplants
reached normoglycemia significantly earlier than islet-alone group and were more tolerant
during oral glucose tolerance test 137. Furthermore, analysis of extracted grafts revealed that BM-
MSC/islet grafts had significantly more vasculature marker and more insulin content than islet-
alone grafts 137.
Even though MSCs have been isolated from many different body tissues, current literature
indicates that there is significant source-dependent and donor-dependent differences in MSC
yield per mass of tissue, transcriptome and secretome profiles, and proliferative and mitotic
capacities 170,172-174. For instance, it has been suggested than only 0.001-0.002% of BM aspirate
cells are MSCs; but, in adipose tissue 1% of digested cells are MSCs 205. Xu et al. (2017) showed
that BM-MSCs possessed stronger osteogenic and lower adipogenic differentiation potentials

71
compared to adipose tissue-derived MSCs and DNA methylation status of transcription factors
controlling MSC fate was responsible for the differences 181. Furthermore, adipose tissue is
distributed throughout the body and they can be broadly divided into white versus brown fat, and
subcutaneous versus intra-abdominal fat depots 182. Depending on their type and depot location,
fat tissues have differences in function and characteristics 182. This led us to hypothesize that
there might be microenvironment-dependent differences among different types of MSCs and that
MSCs that are ontologically and anatomically closer to the islets might be more beneficial to
them.
In chapter 2, we isolated and characterized cells from visceral adipose tissue specifically in peri-
pancreatic adipose (ppa) region and given the results we denoted them as ppaMSCs.
International Society for Cellular Therapy (ISCT) in their 2006 statements, proposed minimal
criteria for defining MSCs 143. First, they must adhere to the plastic; second, these cells must
highly express (≥ 95%) positive cell surface markers such as CD105, CD73, CD90, and
minimally express (≤ 2%) negative cell surface markers such as CD45, CD34, CD14 (or
CD11b), CD79α (or CD19), and HLA-DR; and third, MSCs must differentiate into adipocytes,
osteoblasts, and chondrocytes 143. Our cells adhered to the plastic and displayed spindle shaped
morphology and expanded after each passage. Next, our cells highly expressed panel of positive
markers and very minimally expressed negative markers. Other labs denoted their cells as MSCs
based on plastic adherence and cell surface markers that were comparable to ours 214,215. To
characterize further, we performed differentiation studies with our newly isolated cells. Our cells
readily differentiated into adipocytes but not osteoblasts and chondroblasts. Our donors were
elderly donors (mean age was 67.5 y.o.) and had high BMI (31.0). These results could be partly

72
explained by the fact that age and BMI is negatively correlated with MSC yield, function, and
potential 206,207,229.
In the future we could study the effects of age and BMI on ppaMSCs. For example, ppaMSCs
from younger versus older donors, and from high BMI versus low BMI donors could be
compared with regards to their proliferation and differentiation capacities. Furthermore,
ppaMSCs from different donor categories could be compared with respect to their effects on
islets in vitro and in vivo. If the age- and BMI-related differences exist, then testing ppaMSCs
from the best donor group and comparing their effects on islets compared with MSCs from
different sources could be performed. This could support or reject the hypothesis that MSCs that
are ontologically and anatomically closer to the pancreas could enhance the islet function better
than MSCs that are further away.
Diabetes mellitus (DM) is serious metabolic disorder that results in impaired blood glucose
homeostasis. Etiologically DM is subdivided into several subgroups such as type 1 diabetes
mellitus (T1DM), type 2 diabetes mellitus (T2DM), gestational diabetes (GD), neonatal diabetes
mellitus (NDM), and maturity-onset diabetes of the young (MODY). T1DM is multigenic
autoimmune disorder, often precipitated by an exogenous factor, and which culminates in the
destruction of insulin producing β-cells 8. T2DM is a complex metabolic disorder that results in
peripheral insulin resistance and relative insulin insufficiency; it is associated with physical
inactivity, sedentary lifestyle, and obesity 45,231. GD is disorder during pregnancy accompanied
with a shift in hormone balance resulting in insulin resistance and impaired glucose regulation 47.
MODY is a group monogenic dominantly inherited disorders that are dissimilar to other types of
diabetes 50.

73
Diabetes is associated with devastating conditions such as diabetic ketoacidosis (DKA), retinal
damage (retinopathy), kidney damage (nephropathy), neural damage (neuropathy), coronary
heart disease, cerebrovascular disease, peripheral artery disease 16,26,28,35,37
Diabetes is on the rise: in 1964 an estimated 30 million people had DM, in 2000 this number
went up to 151 million had DM, in 2015 there are estimated 415 million people with DM, and in
it is predicted that by 2040 there will be 642 million people suffering DM 52. Current estimates
suggest that in high-income countries 87-91% of all diabetes cases in are T2DM, 7-12% are
T1DM, and only 1-3% are other forms of diabetes 52.
Even though T2DM accounts for majority of DM cases, intensive lifestyle and pharmacological
interventions have been shown to be effective in preventing or delaying the onset of diabetes,
and in improving diabetes symptoms and complications 232-234. On the other hand, since there is
no endogenous insulin production in T1DM patients, they require life-long blood glucose
monitoring and exogenous insulin injections. Medical expenditures are very costly to a patient
with T1DM. Estimated discounted lifetime medical spending of a DM patient was $124,600
USD, $91,200 USD, $53,800 USD, and $35,900 USD diagnosed at ages 40, 50, 60, and 65
years, respectively 235. In U.S.A, total yearly medical expenditure attributable to T1DM was
estimated to be $6.9 billion USD 236. Clearly, T1DM presents major economic burden in addition
to decreasing quality of life of a patient. Strict blood glucose control with intensive insulin
therapy showed to reduce the risk of developing retinopathy, microalbuminuria, neuropathy,
atherosclerosis 39,65. However, insulin therapy is a management and not a cure and the major
severe side-effect of a therapy is hypoglycemia, which can be potentially fatal 63. Furthermore,
within the population of T1DM patients there is a subgroup of patients who have so-called brittle
diabetes. These patients continue experiencing severe hypoglycemia, impaired awareness of

74
hypoglycemia, and excessive glycemic variability regardless of effective education and intensive
insulin therapy 68. These patients require attention the most.
Islet transplantation is a potential treatment option for T1DM. In 2000, the Islet Transplant
Group in Edmonton infused islets isolated from deceased donors into the portal vein of 7 patients
at 4,000 islet equivalents per kg of a patient with a combination steroid-free immunosuppressive
therapy and achieved 1-year insulin-independence in all of them 83. This was major milestone in
islet transplantation and gave good grounds for expecting possible cure of T1DM in a future.
However, 2017 reports from Collaborative Islet Transplant Registry (CITR) showed that insulin-
independence rate in patients with common favorable factors was ~70% at 1 year, and ~40% at 5
years following last infusion 237. Some of the factors that may contribute to islet damage and
subsequent graft loss are islet damage during isolation and processing, acute and chronic
rejection in the recipient, metabolic stress, hypoxic environment of the liver, and potential
detrimental effects of immunosuppressive drugs on islets 86,238. Since recipients require life-long
immunosuppression, which opens the door for opportunistic infections and graft gradually fails
the islet transplantation in its current form is reserved for brittle diabetic patients 197. For it to be
widely-available the procedure needs some major improvements to address graft failure, life-
long immunosuppression, and potential limited islet supply.

75
References
1. Chen LH, Leung PS. Inhibition of the sodium glucose co-transporter-2: Its beneficial action
and potential combination therapy for type 2 diabetes mellitus. Diabetes, Obesity and
Metabolism. 2013;15(5):392-402.
2. Röder PV, Geillinger KE, Zietek TS, Thorens B, Koepsell H, Daniel H. The role of SGLT1
and GLUT2 in intestinal glucose transport and sensing. PLoS ONE. 2014;9(2):e89977.
3. Da Silva Xavier G. The cells of the islets of langerhans. J Clin Med. 2018;7(3).
https://www.ncbi.nlm.nih.gov/pmc/articles/PMC5867580/. doi: 10.3390/jcm7030054.
4. Diabetes Canada 2018 Clinical Practice Guidelines for the Prevention and Management of
Diabetes in Canada. Diabetes canada clinical practice guidelines expert committee. Can J
Diabetes. 2018;42:S325.
5. Aronoff SL, Berkowitz K, Shreiner B, Want L. Glucose metabolism and regulation: Beyond
insulin and glucagon. Diabetes Spectrum. 2004;17(3):183-190.
https://search.proquest.com/docview/228660703. doi: 10.2337/diaspect.17.3.183.
6. Gromada J, Franklin I, Wollheim CB. Alpha-cells of the endocrine pancreas: 35 years of
research but the enigma remains. Endocr Rev. 2007;28(1):84-116. doi: 10.1210/er.2006-0007.
7. Rui L. Energy metabolism in the liver. In: Comprehensive physiology. Vol 4. Hoboken, NJ,
USA: John Wiley & Sons, Inc.; 2014:177-197. http://www.ncbi.nlm.nih.gov/pubmed/24692138.
10.1002/cphy.c130024.

76
8. Atkinson MA. The pathogenesis and natural history of type 1 diabetes. Cold Spring Harbor
perspectives in medicine. 2012;2(11). https://www.ncbi.nlm.nih.gov/pubmed/23125199. doi:
10.1101/cshperspect.a007641.
9. Noble JA, Erlich HA. Genetics of type 1 diabetes. Cold Spring Harbor Perspectives in
Medicine. 2012;2(1):a007732.
10. Concannon P, Rich SS, Nepom GT. Genetics of type 1A diabetes. New England Journal of
Medicine. 2009;360(16):1646-1654.
11. Oh JH, MacLean LD. Diseases associated with specific HL-A antigens. Canadian Medical
Association journal. 1975;112(11):1315-8.
12. Owen JA, Punt J, Stranford SA, Jones PP, Kuby J. Kuby immunology. Seventh International
ed. New York: W.H. Freeman and Company; 2013.
http://catdir.loc.gov/catdir/enhancements/fy1502/2012950797-d.html
13. van Belle TL, Coppieters KT, von Herrath MG. Type 1 diabetes: Etiology, immunology, and
therapeutic strategies. Physiol Rev. 2011;91(1):79-118. doi: 10.1152/physrev.00003.2010.
14. Paschou SA, Papadopoulou-Marketou N, Chrousos GP, Kanaka-Gantenbein C. On type 1
diabetes mellitus pathogenesis. Endocrine connections. 2018;7(1):R46.
https://www.ncbi.nlm.nih.gov/pubmed/29191919. doi: 10.1530/EC-17-0347.
15. Knip M, Veijola R, Virtanen SM, Hyöty H, Vaarala O, Akerblom HK. Environmental
triggers and determinants of type 1 diabetes. Diabetes. 2005;54 Suppl 2:125.

77
16. Maletkovic J, Drexler A. Diabetic ketoacidosis and hyperglycemic hyperosmolar state.
Endocrinology and Metabolism Clinics of North America. 2013;42(4):677-695.
17. Paoli A. Ketogenic diet for obesity: Friend or foe? International journal of environmental
research and public health. 2014;11(2):2092-2107.
https://www.ncbi.nlm.nih.gov/pubmed/24557522. doi: 10.3390/ijerph110202092.
18. Kitabchi AE, Umpierrez GE, Miles JM, et al. Hyperglycemic crises in adult patients with
diabetes. Diabetes care. 2009;32(7):1335-43.
19. Martín-Timón I, Del Cañizo-Gómez FJ. Mechanisms of hypoglycemia unawareness and
implications in diabetic patients. World Journal of Diabetes. 2015;6(7):912.
20. Tanenberg R, Newton C, Drake A. Confirmation of hypoglycemia in the "dead-in-
bed" syndrome, as captured by a retrospective continuous glucose monitoring system.
Endocrine Practice. 2010;16(2):244-248.
21. Saleh J. Glycated hemoglobin and its spinoffs: Cardiovascular disease markers or risk
factors? World J Cardiol. 2015;7(8):449-453.
https://www.ncbi.nlm.nih.gov/pmc/articles/PMC4549778/. doi: 10.4330/wjc.v7.i8.449.
22. Sherwani SI, Khan HA, Ekhzaimy A, Masood A, Sakharkar MK. Significance of HbA1c test
in diagnosis and prognosis of diabetic patients. Biomark Insights. 2016;11:95-104.
https://www.ncbi.nlm.nih.gov/pmc/articles/PMC4933534/. doi: 10.4137/BMI.S38440.
23. Florkowski C. HbA1c as a diagnostic test for diabetes mellitus – reviewing the evidence.
Clin Biochem Rev. 2013;34(2):75-83. https://www.ncbi.nlm.nih.gov/pmc/articles/PMC3799221/.

78
24. Information, National Center for Biotechnology, Pike, U. S. National Library of Medicine
8600 Rockville, MD B, Usa 2. Glycated haemoglobin (HbA1c) for the diagnosis of diabetes.
World Health Organization; 2011. https://www.ncbi.nlm.nih.gov/books/NBK304271/.
25. Brownlee M. The pathobiology of diabetic complications: A unifying mechanism. Diabetes.
2005;54(6):1615-25.
26. Fowler MJ. Microvascular and macrovascular complications of diabetes. Clinical Diabetes.
2008;26(2):77-82.
27. Geraldes P, King GL. Activation of protein kinase C isoforms and its impact on diabetic
complications. Circulation research. 2010;106(8):1319-31.
28. Ejaz S, Chekarova I, Ejaz A, Sohail A, Lim CW. Importance of pericytes and mechanisms of
pericyte loss during diabetes retinopathy. Diabetes, Obesity and Metabolism. 2007;0(0).
29. Lim AK. Diabetic nephropathy - complications and treatment. International journal of
nephrology and renovascular disease. 2014;7:361-81.
30. Cao Z, Cooper ME. Pathogenesis of diabetic nephropathy. Journal of Diabetes Investigation.
2011;2(4):243-247.
31. Dabla PK. Renal function in diabetic nephropathy. World Journal of Diabetes. 2010;1(2):48.
32. Yagihashi S, Mizukami H, Sugimoto K. Mechanism of diabetic neuropathy: Where are we
now and where to go? Journal of Diabetes Investigation. 2011;2(1):18-32.

79
33. Bansal V, Kalita J, Misra UK. Diabetic neuropathy. Postgraduate medical journal.
2006;82(964):95-100.
34. Vinik AI, Nevoret M, Casellini C, Parson H. Diabetic neuropathy. Endocrinology and
Metabolism Clinics of North America. 2013;42(4):747-787.
35. de Ferranti SD, de Boer IH, Fonseca V, et al. Type 1 diabetes mellitus and cardiovascular
disease: A scientific statement from the american heart association and american diabetes
association. Circulation. 2014;130(13):1110-1130. doi: 10.1161/CIR.0000000000000034.
36. Lee SI, Patel M, Jones CM, Narendran P. Cardiovascular disease and type 1 diabetes:
Prevalence, prediction and management in an ageing population. Ther Adv Chronic Dis.
2015;6(6):347-374. https://www.ncbi.nlm.nih.gov/pmc/articles/PMC4622313/. doi:
10.1177/2040622315598502.
37. Feingold KR, Grunfeld C. Diabetes and dyslipidemia. ; 2000.
http://www.ncbi.nlm.nih.gov/pubmed/26247092.
38. Olin JW, Sealove BA. Peripheral artery disease: Current insight into the disease and its
diagnosis and management. Mayo Clinic proceedings. 2010;85(7):678-92.
39. Nathan DM, DCCT/EDIC Research Group, for the DCCT/EDIC Research. The diabetes
control and complications trial/epidemiology of diabetes interventions and complications study
at 30 years: Overview. Diabetes care. 2014;37(1):9-16.
40. Brown A, Reynolds LR, Bruemmer D. Intensive glycemic control and cardiovascular
disease: An update. Nature Reviews Cardiology. 2010;7(7):369-375.

80
41. Mazzone T. Intensive glucose lowering and cardiovascular disease prevention in diabetes:
Reconciling the recent clinical trial data. Circulation. 2010;122(21):2201-11.
42. Cade WT. Diabetes-related microvascular and macrovascular diseases in the physical therapy
setting. Physical Therapy. 2008;88(11):1322-1335.
43. Paneni F, Beckman JA, Creager MA, Cosentino F. Diabetes and vascular disease:
Pathophysiology, clinical consequences, and medical therapy: Part I. European Heart Journal.
2013;34(31):2436-2443.
44. Ali O. Genetics of type 2 diabetes. World J Diabetes. 2013;4(4):114-123.
https://www.ncbi.nlm.nih.gov/pmc/articles/PMC3746083/. doi: 10.4239/wjd.v4.i4.114.
45. Obateru OA, Olokoba LB, Olokoba AB. Type 2 diabetes mellitus : A review of current
trends. Oman Medical Journal. 2012;27(4):269-273.
http://platform.almanhal.com/Summon/Preview/?id=2-19234. doi: 10.5001/omj.2012.68.
46. Cersosimo E, Triplitt C, Solis-Herrera C, Mandarino LJ, DeFronzo RA. Pathogenesis of type
2 diabetes mellitus. In: Feingold KR, Anawalt B, Boyce A, et al, eds. Endotext. South Dartmouth
(MA): MDText.com, Inc.; 2000. http://www.ncbi.nlm.nih.gov/books/NBK279115/.
47. Alfadhli EM. Gestational diabetes mellitus. Saudi medical journal. 2015;36(4):399-406.
https://www.ncbi.nlm.nih.gov/pubmed/25828275. doi: 10.15537/smj.2015.4.10307.
48. Garcia-Vargas L, Addison SS, Nistala R, Kurukulasuriya D, Sowers JR. Gestational diabetes
and the offspring: Implications in the development of the cardiorenal metabolic syndrome in

81
offspring. Cardiorenal Med. 2012;2(2):134-142.
https://www.ncbi.nlm.nih.gov/pmc/articles/PMC3376343/. doi: 10.1159/000337734.
49. Kim C. Gestational diabetes: Risks, management, and treatment options. Int J Womens
Health. 2010;2:339-351. https://www.ncbi.nlm.nih.gov/pmc/articles/PMC2990903/. doi:
10.2147/IJWH.S13333.
50. Anık A, Çatlı G, Abacı A, Böber E. Maturity-onset diabetes of the young (MODY): An
update. J Pediatr Endocrinol Metab. 2015;28(3-4):251-263. doi: 10.1515/jpem-2014-0384.
51. Gardner DS, Tai ES. Clinical features and treatment of maturity onset diabetes of the young
(MODY). Diabetes, metabolic syndrome and obesity : targets and therapy. 2012;5:101-108.
https://www.ncbi.nlm.nih.gov/pubmed/22654519. doi: 10.2147/DMSO.S23353.
52. Ogurtsova K, da Rocha Fernandes JD, Huang Y, et al. IDF diabetes atlas: Global estimates
for the prevalence of diabetes for 2015 and 2040. Diabetes Research and Clinical Practice.
2017;128:40-50.
53. World health organization. (2016). global report on diabetes. working papers.
54. Sakula A. Paul langerhans (1847-1888): A centenary tribute. Journal of the Royal Society of
Medicine. 1988;81(7):414-5.
55. Luft R. Oskar minkowski: Discovery of the pancreatic origin of diabetes, 1889.
Diabetologia. 1989;32(7):399-401.

82
56. Ceranowicz P, Cieszkowski J, Warzecha Z, Kuśnierz-Cabala B, Dembiński A. The
beginnings of pancreatology as a field of experimental and clinical medicine. BioMed research
international. 2015;2015:128095.
57. Karamanou M, Protogerou A, Tsoucalas G, Androutsos G, Poulakou-Rebelakou E.
Milestones in the history of diabetes mellitus: The main contributors. World journal of diabetes.
2016;7(1):1. https://www.ncbi.nlm.nih.gov/pubmed/26788261. doi: 10.4239/wjd.v7.i1.1.
58. Banting FG, Best CH, Collip JB, Campbell WR, Fletcher AA. Pancreatic extracts in the
treatment of diabetes mellitus. Canadian Medical Association journal. 1922;12(3):141-6.
59. Ghazavi MK, Johnston GA. Insulin allergy. Clinics in Dermatology. 2011;29(3):300-305.
60. Stretton AOW. The first sequence. fred sanger and insulin. Genetics. 2002;162(2):527-32.
61. Johnson IS. Human insulin from recombinant DNA technology. Science (New York, N.Y.).
1983;219(4585):632-7.
62. Mehta SN, Wolfsdorf JI. Contemporary management of patients with type 1 diabetes.
Endocrinology and Metabolism Clinics of North America. 2010;39(3):573-593.
63. Canadian Diabetes Association Clinical Practice Guidelines Expert Committee. Canadian
diabetes association 2013 clinical practice guidelines for the prevention and management of
diabetes in Canada. 2013;37(suppl 1):S1-S212.
64. Effect of intensive diabetes treatment on the development and progression of long-term
complications in adolescents with insulin-dependent diabetes mellitus: Diabetes control and

83
complications trial. diabetes control and complications trial research group. The Journal of
pediatrics. 1994;125(2):177-88.
65. Nathan DM, Genuth S, Lachin J, et al. The effect of intensive treatment of diabetes on the
development and progression of long-term complications in insulin-dependent diabetes mellitus.
N Engl J Med. 1993;329(14):977-986. doi: 10.1056/NEJM199309303291401.
66. Heinzerling L, Raile K, Rochlitz H, Zuberbier T, Worm M. Insulin allergy: Clinical
manifestations and management strategies. Allergy. 2008;63(2):148-155.
67. Sarbacker GB, Urteaga EM. Adherence to insulin therapy: TABLE 1. Diabetes Spectrum.
2016;29(3):166-170.
68. Choudhary P, Rickels MR, Senior PA, et al. Evidence-informed clinical practice
recommendations for treatment of type 1 diabetes complicated by problematic hypoglycemia.
Diabetes care. 2015;38(6):1016-1029. https://www.ncbi.nlm.nih.gov/pubmed/25998294. doi:
10.2337/dc15-0090.
69. Shapiro J. Eighty years after insulin: Parallels with modern islet transplantation. CMAJ :
Canadian Medical Association journal = journal de l'Association medicale canadienne.
2002;167(12):1398-1400. https://www.ncbi.nlm.nih.gov/pubmed/12473643.
70. Squifflet J-, Gruessner RWG, Sutherland DER. The history of pancreas transplantation: Past,
present and future. Acta Chirurgica Belgica. 2008;108(3):367-378.
71. Han DJ, Sutherland DE. Pancreas transplantation. Gut Liver. 2010;4(4):450-465. doi:
10.5009/gnl.2010.4.4.450.

84
72. Kandaswamy R, Sutherland DER. Pancreas versus islet transplantation in diabetes mellitus:
How to allocate deceased donor pancreata? Transplantation Proceedings. 2006;38(2):365-367.
73. Paty BW, Koh A, Senior P. Pancreas and islet transplantation. Canadian Journal of Diabetes.
2013;37:S96.
74. Vardanyan M, Parkin E, Gruessner C, Rodriguez Rilo HL. Pancreas vs. islet transplantation:
A call on the future. Curr Opin Organ Transplant. 2010;15(1):124-130. doi:
10.1097/MOT.0b013e32833553f8.
75. Stratta RJ, Fridell JA, Gruessner AC, Odorico JS, Gruessner RWG. Pancreas transplantation:
A decade of decline. Curr Opin Organ Transplant. 2016;21(4):386-392. doi:
10.1097/MOT.0000000000000319.
76. Srinivasan P, Huang GC, Amiel SA, Heaton ND. Islet cell transplantation. Postgraduate
Medical Journal. 2007;83(978):224-229. http://dx.doi.org/10.1136/pgmj.2006.053447. doi:
10.1136/pgmj.2006.053447.
77. Ballinger WF, Lacy PE. Transplantation of intact pancreatic islets in rats. Surgery.
1972;72(2):175-186.
78. Kemp CB, Knight MJ, Scharp DW, Ballinger WF, Lacy PE. Effect of transplantation site on
the results of pancreatic islet isografts in diabetic rats. Diabetologia. 1973;9(6):486-491.
79. Karl RC, Scharp DW, Ballinger WF, Lacy PE. Transplantation of insulin-secreting tissues.
Gut. 1977;18(12):1062-72.

85
80. McCall M, Shapiro AMJ. Update on islet transplantation. Cold Spring Harbor perspectives
in medicine. 2012;2(7):a007823. https://www.ncbi.nlm.nih.gov/pubmed/22762022. doi:
10.1101/cshperspect.a007823.
81. Ricordi C, Lacy PE, Finke EH, Olack BJ, Scharp DW. Automated method for isolation of
human pancreatic islets. Diabetes. 1988;37(4):413-420. doi: 10.2337/diab.37.4.413.
82. Brendel MD, Hering BJ, Schultz AO, Bretzel RG. International islet transplant registry
report. Third Medical Department Center of Internal Medicine Justus-Liebig-University of
Giessen. 1999:1-20.
83. Shapiro AMJ, Lakey JRT, Ryan EA, et al. Islet transplantation in seven patients with type 1
diabetes mellitus using a glucocorticoid-free immunosuppressive regimen. New England Journal
of Medicine. 2000;343(4):230-238.
84. The CITR Coordinating Center and Investigators. The collaborative islet transplant registry
(CITR) 2016 ninth annual report. 2016.
85. Senior PA, Kin T, Shapiro J, Koh A. Islet transplantation at the university of Alberta: Status
update and review of progress over the last decade. Canadian Journal of Diabetes.
2012;36(1):32-37.
86. Shapiro AMJ. Islet transplantation in type 1 diabetes: Ongoing challenges, refined
procedures, and long-term outcome. Rev Diabet Stud. 2013;9(4):385-406. doi:
10.1900/RDS.2012.9.385.

86
87. Bennet W, Sundberg B, Groth CG, et al. Incompatibility between human blood and isolated
islets of langerhans: A finding with implications for clinical intraportal islet transplantation?
Diabetes. 1999;48(10):1907-1914. doi: 10.2337/diabetes.48.10.1907.
88. Kanak MA, Takita M, Kunnathodi F, Lawrence MC, Levy MF, Naziruddin B. Inflammatory
response in islet transplantation. Int J Endocrinol. 2014;2014:451035. doi:
10.1155/2014/451035.
89. Li X, Meng Q, Zhang L. The fate of allogeneic pancreatic islets following intraportal
transplantation: Challenges and solutions. J Immunol Res. 2018;2018.
https://www.ncbi.nlm.nih.gov/pmc/articles/PMC6174795/. doi: 10.1155/2018/2424586.
90. Bruni A, Gala-Lopez B, Pepper AR, Abualhassan NS, Shapiro AJ. Islet cell transplantation
for the treatment of type 1 diabetes: Recent advances and future challenges. Diabetes, metabolic
syndrome and obesity : targets and therapy. 2014;7:211-23.
91. Moore SJ, Gala-Lopez BL, Pepper AR, Pawlick RL, Shapiro AJ. Bioengineered stem cells as
an alternative for islet cell transplantation. World Journal of Transplantation. 2015;5(1):1.
92. Shapiro AMJ, Pokrywczynska M, Ricordi C. Clinical pancreatic islet transplantation. Nat
Rev Endocrinol. 2017;13(5):268-277. doi: 10.1038/nrendo.2016.178.
93. Fung J, Rao A, Starzl T. Clinical trials and the projected future of liver xenotransplantation.
World J Surg. 1997;21(9):956-961.
https://www.openaire.eu/search/publication?articleId=od_______267::8cdd07c490bb8e9de5b8b
1fd2a6730d1.

87
94. Lee J, Sung Y, Baek I. Generation of genetically-engineered animals using engineered
endonucleases. Arch Pharm Res. 2018;41(9):885-897.
https://www.ncbi.nlm.nih.gov/pubmed/29777358. doi: 10.1007/s12272-018-1037-z.
95. Fineberg SE, Kawabata TT, Finco-Kent D, Fountaine RJ, Finch GL, Krasner AS.
Immunological responses to exogenous insulin. Endocr Rev. 2007;28(6):625-652.
https://academic.oup.com/edrv/article/28/6/625/2355076. doi: 10.1210/er.2007-0002.
96. Yang Y, Wang K, Wu H, et al. Genetically humanized pigs exclusively expressing human
insulin are generated through custom endonuclease-mediated seamless engineering. J Mol Cell
Biol. 2016;8(2):174-177. doi: 10.1093/jmcb/mjw008.
97. Korbutt GS, Elliott JF, Ao Z, Smith DK, Warnock GL, Rajotte RV. Large scale isolation,
growth, and function of porcine neonatal islet cells. The Journal of clinical investigation.
1996;97(9):2119-29.
98. Zhu H, Yu L, Lyu Y, Wang B. Optimal pig donor selection in islet xenotransplantation:
Current status and future perspectives. J Zhejiang Univ Sci B. 2014;15(8):681-691.
https://www.ncbi.nlm.nih.gov/pubmed/25091986. doi: 10.1631/jzus.B1400120.
99. Park C, Bottino R, Hawthorne WJ. Current status of islet xenotransplantation. International
Journal of Surgery. 2015;23:261-266. doi: 10.1016/j.ijsu.2015.07.703.
100. Bloch K, Assa S, Lazard D, et al. Neonatal pig islets induce a lower T-cell response than
adult pig islets in IDDM patients. Transplantation. 1999;67(5):748-752.

88
101. Rajotte RV. Isolation and assessment of islet quality. Xenotransplantation. 2008;15(2):93-
95. doi: 10.1111/j.1399-3089.2008.00459.x.
102. Dhanasekaran M, George JJ, Loganathan G, et al. Pig islet xenotransplantation. Curr Opin
Organ Transplant. 2017;22(5):452-462. doi: 10.1097/MOT.0000000000000455.
103. Ellis C, Lyon JG, Korbutt GS. Optimization and scale-up isolation and culture of neonatal
porcine islets: Potential for clinical application. Cell Transplantation. 2016;25(3):539-547.
104. Cooper, David K.C.|Ekser, Burcin|Tector, A. Joseph. Immunobiological barriers to
xenotransplantation. International Journal of Surgery. 2015;23(Pt B):211-216.
https://www.clinicalkey.es/playcontent/1-s2.0-S1743919115003519. doi:
10.1016/j.ijsu.2015.06.068.
105. Dufrane D, Gianello P. Macro- or microencapsulation of pig islets to cure type 1 diabetes.
World J Gastroenterol. 2012;18(47):6885-6893.
https://www.ncbi.nlm.nih.gov/pmc/articles/PMC3531671/. doi: 10.3748/wjg.v18.i47.6885.
106. Cooper DKC, Matsumoto S, Abalovich A, et al. Progress in clinical encapsulated islet
xenotransplantation. Transplantation. 2016;100(11):2301-2308.
https://www.ncbi.nlm.nih.gov/pmc/articles/PMC5077652/. doi: 10.1097/TP.0000000000001371.
107. Denner J, Tönjes RR, Takeuchi Y, Fishman J, Scobie L. First update of the international
xenotransplantation association consensus statement on conditions for undertaking clinical trials
of porcine islet products in type 1 diabetes—Chapter 5: Recipient monitoring and response plan

89
for preventing disease transmission. Xenotransplantation. 2016;23(1):53-59.
https://onlinelibrary.wiley.com/doi/abs/10.1111/xen.12227. doi: 10.1111/xen.12227.
108. Chen S, Yu X, Guo D. CRISPR-cas targeting of host genes as an antiviral strategy. Viruses.
2018;10(1). https://www.ncbi.nlm.nih.gov/pmc/articles/PMC5795453/. doi: 10.3390/v10010040.
109. Chen Y, Sheng J, Trang P, Liu F. Potential application of the CRISPR/Cas9 system against
herpesvirus infections. Viruses. 2018;10(6):291.
https://www.ncbi.nlm.nih.gov/pubmed/29844277. doi: 10.3390/v10060291.
110. Wray J, Kalkan T, Smith A. The ground state of pluripotency. Biochemical Society
Transactions. 2010;38(4):1027-1032.
111. Moreau M, Leclerc C. The choice between epidermal and neural fate: A matter of calcium.
The International journal of developmental biology. 2004;48(2-3):75-84.
112. Koh PW, Sinha R, Barkal AA, et al. An atlas of transcriptional, chromatin accessibility, and
surface marker changes in human mesoderm development. Scientific Data. 2016;3:160109.
113. Zorn AM, Wells JM. Vertebrate endoderm development and organ formation. Annual
Review of Cell and Developmental Biology. 2009;25(1):221-251.
114. Mora C, Serzanti M, Consiglio A, Memo M, Dell'Era P. Clinical potentials of human
pluripotent stem cells. Cell Biol Toxicol. 2017;33(4):351-360. doi: 10.1007/s10565-017-9384-y.
115. Thomson JA, Itskovitz-Eldor J, Shapiro SS, et al. Embryonic stem cell lines derived from
human blastocysts. Science. 1998;282(5391):1145-1147.

90
116. Assady S, Maor G, Amit M, Itskovitz-Eldor J, Skorecki KL, Tzukerman M. Insulin
production by human embryonic stem cells. Diabetes. 2001;50(8):1691-1697.
117. Segev H, Fishman B, Ziskind A, Shulman M, Itskovitz-Eldor J. Differentiation of human
embryonic stem cells into insulin-producing clusters. Stem Cells. 2004;22(3):265-274. doi:
10.1634/stemcells.22-3-265.
118. D'Amour KA, Agulnick AD, Eliazer S, Kelly OG, Kroon E, Baetge EE. Efficient
differentiation of human embryonic stem cells to definitive endoderm. Nat Biotechnol.
2005;23(12):1534-1541. doi: 10.1038/nbt1163.
119. Kroon E, Martinson LA, Kadoya K, et al. Pancreatic endoderm derived from human
embryonic stem cells generates glucose-responsive insulin-secreting cells in vivo. Nat
Biotechnol. 2008;26(4):443-452. doi: 10.1038/nbt1393.
120. Tateishi K, He J, Taranova O, Liang G, D'Alessio AC, Zhang Y. Generation of insulin-
secreting islet-like clusters from human skin fibroblasts. J Biol Chem. 2008;283(46):31601-
31607. doi: 10.1074/jbc.M806597200.
121. Chen S, Borowiak M, Fox JL, et al. A small molecule that directs differentiation of human
ESCs into the pancreatic lineage. Nat Chem Biol. 2009;5(4):258-265. doi:
10.1038/nchembio.154.
122. Rezania A, Bruin JE, Arora P, et al. Reversal of diabetes with insulin-producing cells
derived in vitro from human pluripotent stem cells. Nat Biotechnol. 2014;32(11):1121-1133. doi:
10.1038/nbt.3033.

91
123. Pagliuca FW, Millman JR, Gürtler M, et al. Generation of functional human pancreatic β
cells in vitro. Cell. 2014;159(2):428-439. doi: 10.1016/j.cell.2014.09.040.
124. Blum B, Benvenisty N. The tumorigenicity of human embryonic stem cells. In: Advances in
cancer research. Vol 100. Academic Press; 2008:133-158.
http://www.sciencedirect.com/science/article/pii/S0065230X08000055.
125. Goldring CP, Duffy P, Benvenisty N, et al. Assessing the safety of stem cell therapeutics.
Cell Stem Cell. 2011;8(6):618-628.
https://www.sciencedirect.com/science/article/pii/S1934590911002347. doi:
10.1016/j.stem.2011.05.012.
126. Agulnick AD, Ambruzs DM, Moorman MA, et al. Insulin‐Producing endocrine cells
differentiated in vitro from human embryonic stem cells function in macroencapsulation devices
in vivo. STEM CELLS Translational Medicine. 2015;4(10):1214-1222.
https://onlinelibrary.wiley.com/doi/abs/10.5966/sctm.2015-0079. doi: 10.5966/sctm.2015-0079.
127. Lo B, Parham L. Ethical issues in stem cell research. Endocr Rev. 2009;30(3):204-213.
https://www.ncbi.nlm.nih.gov/pmc/articles/PMC2726839/. doi: 10.1210/er.2008-0031.
128. Takahashi K, Yamanaka S. Induction of pluripotent stem cells from mouse embryonic and
adult fibroblast cultures by defined factors. Cell. 2006;126(4):663-676.
https://www.sciencedirect.com/science/article/pii/S0092867406009767. doi:
10.1016/j.cell.2006.07.024.

92
129. Elie Dolgin. Encapsulate this. Nature Medicine. 2014;20(1):9-11.
https://www.ncbi.nlm.nih.gov/pubmed/24398953. doi: 10.1038/nm0114-9.
130. Maehr R, Chen S, Snitow M, et al. Generation of pluripotent stem cells from patients with
type 1 diabetes. Proceedings of the National Academy of Sciences of the United States of
America. 2009;106(37):15768. doi: 10.1073/pnas.0906894106.
131. Thatava T, Kudva YC, Edukulla R, et al. Intrapatient variations in type 1 diabetes-specific
iPS cell differentiation into insulin-producing cells. Molecular Therapy. 2013;21(1):228.
https://www-ncbi-nlm-nih-gov.login.ezproxy.library.ualberta.ca/pmc/articles/PMC3538320/.
doi: 10.1038/mt.2012.245.
132. Jeon K, Lim H, Kim J, et al. Differentiation and transplantation of functional pancreatic
beta cells generated from induced pluripotent stem cells derived from a type 1 diabetes mouse
model. Stem Cells Dev. 2012;21(14):2642-2655. doi: 10.1089/scd.2011.0665.
133. Scudellari M. How iPS cells changed the world. Nature News. 2016;534(7607):310.
http://www.nature.com/news/how-ips-cells-changed-the-world-1.20079. doi: 10.1038/534310a.
134. Krasnodembskaya A, Song Y, Fang X, et al. Antibacterial effect of human mesenchymal
stem cells is mediated in part from secretion of the antimicrobial peptide LL-37. Stem Cells.
2010;28(12):2229-2238. https://www.ncbi.nlm.nih.gov/pmc/articles/PMC3293245/. doi:
10.1002/stem.544.

93
135. Telford Y Yeung, Karen L Seeberger, Tatsuya Kin, et al. Human mesenchymal stem cells
protect human islets from pro-inflammatory cytokines. PLoS One. 2012;7(5):e38189.
https://www.ncbi.nlm.nih.gov/pubmed/22666480. doi: 10.1371/journal.pone.0038189.
136. Yeung TY, Seeberger KL, Kin T, et al. Human mesenchymal stem cells protect human
islets from pro-inflammatory cytokines. PLoS ONE. 2012;7(5):e38189.
137. Hayward JA, Ellis CE, Seeberger K, et al. Cotransplantation of mesenchymal stem cells
with neonatal porcine islets improve graft function in diabetic mice. Diabetes. 2017;66(5):1312-
1321. doi: 10.2337/db16-1068.
138. Prockop DJ. Marrow stromal cells as stem cells for nonhematopoietic tissues. Science.
1997;276(5309):71-74.
139. Friedenstein AJ, Chailakhjan RK, Lalykina KS. The development of fibroblast colonies in
monolayer cultures of guinea-pig bone marrow and spleen cells. Cell Tissue Kinet.
1970;3(4):393-403.
140. Friedenstein AJ, Gorskaja JF, Kulagina NN. Fibroblast precursors in normal and irradiated
mouse hematopoietic organs. Exp Hematol. 1976;4(5):267-274.
http://europepmc.org/abstract/med/976387.
141. Amanda Mizukami, Kamilla Swiech. Mesenchymal stromal cells: From discovery to
manufacturing and commercialization. Stem Cells International. 2018;2018:4083921-13.
https://www.ncbi.nlm.nih.gov/pubmed/30057622. doi: 10.1155/2018/4083921.

94
142. Z L Zhang, J Tong, R N Lu, A M Scutt, D Goltzman, D S Miao. Therapeutic potential of
non-adherent BM-derived mesenchymal stem cells in tissue regeneration. Bone Marrow
Transplantation. 2009;43(1):69-81. http://dx.doi.org/10.1038/bmt.2008.260. doi:
10.1038/bmt.2008.260.
143. Dominici M, Le Blanc K, Mueller I, et al. Minimal criteria for defining multipotent
mesenchymal stromal cells. the international society for cellular therapy position statement.
Cytotherapy (Taylor & Francis Ltd). 2006;8(4):315-317. doi: 10.1080/14653240600855905.
144. Soundararajan M, Kannan S. Fibroblasts and mesenchymal stem cells: Two sides of the
same coin? Journal of Cellular Physiology. 2018;233(12):9099-9109.
https://onlinelibrary.wiley.com/doi/abs/10.1002/jcp.26860. doi: 10.1002/jcp.26860.
145. Denu RA, Nemcek S, Bloom DD, et al. Fibroblasts and mesenchymal stromal/stem cells are
phenotypically indistinguishable. Acta Haematologica. 2016;136(2):85-97.
https://www.karger.com/Article/Abstract/445096. doi: 10.1159/000445096.
146. Moraes DA, Sibov TT, Pavon LF, et al. A reduction in CD90 (THY-1) expression results in
increased differentiation of mesenchymal stromal cells. Stem Cell Res Ther. 2016;7(1):97.
Accessed March 27, 2019. doi: 10.1186/s13287-016-0359-3.
147. Antonioli, Luca|Pacher, Pál|Vizi, E. Sylvester|Haskó, György. CD39 and CD73 in immunity
and inflammation. Trends in Molecular Medicine. 2013;19(6):355-367.
https://www.clinicalkey.es/playcontent/1-s2.0-S1471491413000543. doi:
10.1016/j.molmed.2013.03.005.

95
148. Duff SE, Li C, Garland JM, Kumar S. CD105 is important for angiogenesis: Evidence and
potential applications. FASEB J. 2003;17(9):984-992.
149. Per Anderson, Ana Belén Carrillo-Gálvez, Angélica García-Pérez, Marién Cobo, Francisco
Martín. CD105 (endoglin)-negative murine mesenchymal stromal cells define a new multipotent
subpopulation with distinct differentiation and immunomodulatory capacities. PLoS One.
2013;8(10):e76979. https://www.ncbi.nlm.nih.gov/pubmed/24124603. doi:
10.1371/journal.pone.0076979.
150. Paul A Roche, Kazuyuki Furuta. The ins and outs of MHC class II-mediated antigen
processing and presentation. Nature Reviews. Immunology. 2015;15(4):203-216.
https://www.ncbi.nlm.nih.gov/pubmed/25720354. doi: 10.1038/nri3818.
151. Choo SY. The HLA system: Genetics, immunology, clinical testing, and clinical
implications. Yonsei Med J. 2007;48(1):11-23.
https://www.ncbi.nlm.nih.gov/pmc/articles/PMC2628004/. doi: 10.3349/ymj.2007.48.1.11.
152. Krause DS, Fackler MJ, Civin CI, May WS. CD34: Structure, biology, and clinical utility.
Blood. 1996;87(1):1-13. Accessed March 25, 2019.
153. KATAFUCHI T, GARBERS DL, ALBANESI JP. CNP/GC-B system: A new regulator of
adipogenesis. Peptides (New York, NY 1980). 2010(10):1906.
154. Wang Y, Kim K, Kim J, Sul HS. Pref-1, a preadipocyte secreted factor that inhibits
adipogenesis. J Nutr. 2006;136(12):2953-2956.
https://academic.oup.com/jn/article/136/12/2953/4663940. doi: 10.1093/jn/136.12.2953.

96
155. Scott MA, Nguyen VT, Levi B, James AW. Current methods of adipogenic differentiation
of mesenchymal stem cells. Stem Cells and Development. 2011;20(10):1793-1804.
https://www.liebertpub.com/doi/abs/10.1089/scd.2011.0040. doi: 10.1089/scd.2011.0040.
156. Lee M, Fried SK. Optimal protocol for the differentiation and metabolic analysis of human
adipose stromal cells. Methods Enzymol. 2014;538:49-65.
https://www.ncbi.nlm.nih.gov/pmc/articles/PMC4336794/. doi: 10.1016/B978-0-12-800280-
3.00004-9.
157. Mehlem A, Hagberg CE, Muhl L, Eriksson U, Falkevall A. Imaging of neutral lipids by oil
red O for analyzing the metabolic status in health and disease. Nat Protoc. 2013;8(6):1149-1154.
doi: 10.1038/nprot.2013.055.
158. Wang Y, Goulart RA, Pantanowitz L. Oil red O staining in cytopathology. Diagn
Cytopathol. 2011;39(4):272-273. doi: 10.1002/dc.21390.
159. Langenbach F, Handschel J. Effects of dexamethasone, ascorbic acid and β-
glycerophosphate on the osteogenic differentiation of stem cells in vitro. Stem Cell Res Ther.
2013;4(5):117. https://www.ncbi.nlm.nih.gov/pmc/articles/PMC3854789/. doi: 10.1186/scrt328.
160. Xiao G, Gopalakrishnan R, Jiang D, Reith E, Benson MD, Franceschi RT. Bone
morphogenetic proteins, extracellular matrix, and Mitogen‐Activated protein kinase signaling
pathways are required for Osteoblast‐Specific gene expression and differentiation in MC3T3‐E1
cells. Journal of Bone and Mineral Research. 2002;17(1):101-110.
https://onlinelibrary.wiley.com/doi/abs/10.1359/jbmr.2002.17.1.101. doi:
10.1359/jbmr.2002.17.1.101.
97
161. Puchtler H, Meloan SN, Terry MS. On the history and mechanism of alizarin and alizarin
red S stains for calcium. J Histochem Cytochem. 1969;17(2):110-124.
162. Boeuf S, Richter W. Chondrogenesis of mesenchymal stem cells: Role of tissue source and
inducing factors. Stem Cell Res Ther. 2010;1(4):31. doi: 10.1186/scrt31.
163. Cao B, Li Z, Peng R, Ding J. Effects of cell–cell contact and oxygen tension on
chondrogenic differentiation of stem cells. Biomaterials. 2015;64:21-32. doi:
10.1016/j.biomaterials.2015.06.018.
164. Wang W, Rigueur D, Lyons KM. TGFβ signaling in cartilage development and
maintenance. Birth Defects Research Part C: Embryo Today: Reviews. 2014;102(1):37-51.
https://onlinelibrary.wiley.com/doi/abs/10.1002/bdrc.21058. doi: 10.1002/bdrc.21058.
165. Tuli R, Tuli S, Nandi S, et al. Transforming growth factor-β-mediated chondrogenesis of
human mesenchymal progenitor cells involves N-cadherin and mitogen-activated protein kinase
and wnt signaling cross-talk. The Journal of biological chemistry. 2003;278(42):41227-41236.
https://www.ncbi.nlm.nih.gov/pubmed/12893825. doi: 10.1074/jbc.M305312200.
166. Derfoul A, Perkins GL, Hall DJ, Tuan RS. Glucocorticoids promote chondrogenic
differentiation of adult human mesenchymal stem cells by enhancing expression of cartilage
extracellular matrix genes. STEM CELLS. 2006;24(6):1487-1495.
https://onlinelibrary.wiley.com/doi/abs/10.1634/stemcells.2005-0415. doi:
10.1634/stemcells.2005-0415.

98
167. Temu TM, Wu K, Gruppuso PA, Phornphutkul C. The mechanism of ascorbic acid-induced
differentiation of ATDC5 chondrogenic cells. Am J Physiol Endocrinol Metab.
2010;299(2):E334. https://www.ncbi.nlm.nih.gov/pmc/articles/PMC2928517/. doi:
10.1152/ajpendo.00145.2010.
168. Frantz C, Stewart KM, Weaver VM. The extracellular matrix at a glance. J Cell Sci.
2010;123:4195-4200. doi: 10.1242/jcs.023820.
169. Camplejohn KL, Allard SA. Limitations of safranin 'O' staining in proteoglycan-depleted
cartilage demonstrated with monoclonal antibodies. Histochemistry. 1988;89(2):185-188.
170. Hass R, Kasper C, Böhm S, Jacobs R. Different populations and sources of human
mesenchymal stem cells (MSC): A comparison of adult and neonatal tissue-derived MSC. Cell
Commun Signal. 2011;9:12. https://www.ncbi.nlm.nih.gov/pmc/articles/PMC3117820/. doi:
10.1186/1478-811X-9-12.
171. Ullah I, Subbarao RB, Rho GJ. Human mesenchymal stem cells - current trends and future
prospective. Bioscience reports. 2015;35(2):1-18.
https://www.ncbi.nlm.nih.gov/pubmed/25797907. doi: 10.1042/BSR20150025.
172. Klingemann H, Matzilevich D, Marchand J. Mesenchymal stem cells – sources and clinical
applications. Transfusion Medicine and Hemotherapy. 2008;35(4):272-277.
https://www.karger.com/Article/Abstract/142333. doi: 10.1159/000142333.

99
173. Kusuma GD, Carthew J, Lim R, Frith JE. Effect of the microenvironment on mesenchymal
stem cell paracrine signaling: Opportunities to engineer the therapeutic effect. Stem Cells Dev.
2017;26(9):617-631. doi: 10.1089/scd.2016.0349.
174. Kourosch C. Elahi, Gerd Klein, Meltem Avci-Adali, Karl D. Sievert, Sheila MacNeil,
Wilhelm K. Aicher. Human mesenchymal stromal cells from different sources diverge in their
expression of cell surface proteins and display distinct differentiation patterns. Stem Cells
International. 2016;2016:5646384-9. http://dx.doi.org/10.1155/2016/5646384. doi:
10.1155/2016/5646384.
175. Hjortholm N, Jaddini E, Hałaburda K, Snarski E. Strategies of pain reduction during the
bone marrow biopsy. Ann Hematol. 2013;92(2):145-149.
https://www.ncbi.nlm.nih.gov/pubmed/23224244. doi: 10.1007/s00277-012-1641-9.
176. Secunda R, Vennila R, Mohanashankar AM, Rajasundari M, Jeswanth S, Surendran R.
Isolation, expansion and characterisation of mesenchymal stem cells from human bone marrow,
adipose tissue, umbilical cord blood and matrix: A comparative study. Cytotechnology.
2015;67(5):793-807. https://www.ncbi.nlm.nih.gov/pmc/articles/PMC4545441/. doi:
10.1007/s10616-014-9718-z.
177. Baghaei K, Hashemi SM, Tokhanbigli S, et al. Isolation, differentiation, and
characterization of mesenchymal stem cells from human bone marrow. Gastroenterology and
Hepatology From Bed to Bench. 2017;10(3):208-213.
https://www.openaire.eu/search/publication?articleId=od_______267::a38a7519192f45c49ada8c
3059061c8d.

100
178. Brown PT, Squire MW, Li W. Characterization and evaluation of mesenchymal stem cells
derived from human embryonic stem cells and bone marrow. Cell Tissue Res. 2014;358(1):149-
164. https://www.ncbi.nlm.nih.gov/pmc/articles/PMC4329984/. doi: 10.1007/s00441-014-1926-
5.
179. Chen J, Mou X, Du X, Xiang C. Comparative analysis of biological characteristics of adult
mesenchymal stem cells with different tissue origins. Asian Pacific Journal of Tropical
Medicine. 2015;8(9):739-746.
http://www.sciencedirect.com/science/article/pii/S1995764515000991. doi:
10.1016/j.apjtm.2015.07.022.
180. Mohamed-Ahmed S, Fristad I, Lie SA, et al. Adipose-derived and bone marrow
mesenchymal stem cells: A donor-matched comparison. Stem Cell Res Ther. 2018;9.
https://www.ncbi.nlm.nih.gov/pmc/articles/PMC6008936/. doi: 10.1186/s13287-018-0914-1.
181. Xu L, Liu Y, Sun Y, et al. Tissue source determines the differentiation potentials of
mesenchymal stem cells: A comparative study of human mesenchymal stem cells from bone
marrow and adipose tissue. Stem cell research & therapy. 2017;8(1):275-11.
https://www.ncbi.nlm.nih.gov/pubmed/29208029. doi: 10.1186/s13287-017-0716-x.
182. Cook A, Cowan C. Adipose. In: Cartographic perspectives. Cambridge (MA): Harvard
Stem Cell Institute; 2017:1. https://www.ncbi.nlm.nih.gov/books/NBK27053/figure/adipose.F1/.
10.14714/CP88.1466.
183. El-Badawy A, Amer M, Abdelbaset R, et al. Adipose stem cells display higher regenerative
capacities and more adaptable electro-kinetic properties compared to bone marrow-derived

101
mesenchymal stromal cells. Scientific Reports. 2016;6:37801.
https://www.nature.com/articles/srep37801. doi: 10.1038/srep37801.
184. Dmitrieva RI, Minullina IR, Bilibina AA, Tarasova OV, Anisimov SV, Zaritskey AY. Bone
marrow- and subcutaneous adipose tissue-derived mesenchymal stem cells: Differences and
similarities. Cell Cycle. 2012;11(2):377-383.
http://www.tandfonline.com/doi/abs/10.4161/cc.11.2.18858. doi: 10.4161/cc.11.2.18858.
185. Maxson S, Lopez EA, Yoo D, Danilkovitch-Miagkova A, LeRoux MA. Concise review:
Role of mesenchymal stem cells in wound repair. STEM CELLS Translational Medicine.
2012;1(2):142-149. https://onlinelibrary.wiley.com/doi/abs/10.5966/sctm.2011-0018. doi:
10.5966/sctm.2011-0018.
186. Chen L, Deng H, Cui H, et al. Inflammatory responses and inflammation-associated
diseases in organs. Oncotarget. 2018;9(6):7204-7218.
https://www.ncbi.nlm.nih.gov/pubmed/29467962. doi: 10.18632/oncotarget.23208.
187. Prockop DJ. Repair of tissues by adult stem/progenitor cells (MSCs): Controversies, myths,
and changing paradigms. Molecular Therapy. 2009;17(6):939-946.
https://www.sciencedirect.com/science/article/pii/S1525001616317993. doi:
10.1038/mt.2009.62.
188. He Z, Hua J, Song Z. Concise review: Mesenchymal stem cells ameliorate tissue injury via
secretion of tumor necrosis factor-α stimulated protein/gene 6. Stem Cells Int. 2014;2014.
https://www.ncbi.nlm.nih.gov/pmc/articles/PMC4279254/. doi: 10.1155/2014/761091.

102
189. Dimarino AM, Caplan AI, Bonfield TL. Mesenchymal stem cells in tissue repair. Frontiers
in immunology. 2013;4:201. https://www.ncbi.nlm.nih.gov/pubmed/24027567. doi:
10.3389/fimmu.2013.00201.
190. Block GJ, Ohkouchi S, Fung F, et al. Multipotent stromal cells are activated to reduce
apoptosis in part by upregulation and secretion of stanniocalcin-1. Stem cells (Dayton, Ohio).
2009;27(3):670-681. https://www.ncbi.nlm.nih.gov/pubmed/19267325. doi:
10.1002/stem.20080742.
191. Shologu N, Scully M, Laffey JG, O'Toole D. Human mesenchymal stem cell secretome
from bone marrow or adipose-derived tissue sources for treatment of hypoxia-induced
pulmonary epithelial injury. International journal of molecular sciences. 2018;19(10):2996.
https://www.ncbi.nlm.nih.gov/pubmed/30274394. doi: 10.3390/ijms19102996.
192. Kalinina NI, Sysoeva VY, Rubina KA, Parfenova YV, Tkachuk VA. Mesenchymal stem
cells in tissue growth and repair. Acta naturae. 2011;3(4):30-37.
https://www.ncbi.nlm.nih.gov/pubmed/22649702.
193. Suzanne M. W, Francesca G, Mark vdG, et al. The angiogenic properties of mesenchymal
stem/stromal cells and their therapeutic potential. Br Med Bull. 2013(1):25. doi:
10.1093/bmb/ldt031.
194. Hongyan Tao, Zhibo Han, Zhong Chao Han, Zongjin Li. Proangiogenic features of
mesenchymal stem cells and their therapeutic applications. Stem Cells International.
2016;2016:1314709-11. https://www.ncbi.nlm.nih.gov/pubmed/26880933. doi:
10.1155/2016/1314709.

103
195. Johnson KE, Wilgus TA. Vascular endothelial growth factor and angiogenesis in the
regulation of cutaneous wound repair. Advances in Wound Care. 2014;3(10):647-661.
https://www.liebertpub.com/doi/abs/10.1089/wound.2013.0517. doi: 10.1089/wound.2013.0517.
196. Cross MJ, Claesson-Welsh L. FGF and VEGF function in angiogenesis: Signalling
pathways, biological responses and therapeutic inhibition. Trends in Pharmacological Sciences.
2001;22(4):201-207. https://www-sciencedirect-
com.login.ezproxy.library.ualberta.ca/science/article/pii/S016561470001676X. doi:
10.1016/S0165-6147(00)01676-X.
197. Shapiro AMJ, Pokrywczynska M, Ricordi C. Clinical pancreatic islet transplantation. Nat
Rev Endocrinol. 2017;13(5):268-277. doi: 10.1038/nrendo.2016.178.
198. Ryan EA, Paty BW, Senior PA, et al. Five-year follow-up after clinical islet transplantation.
Diabetes. 2005;54(7):2060-2069.
199. Bunch C, Crook DWM. Opportunistic infections. In: Delves PJ, ed. Encyclopedia of
immunology (second edition). Oxford: Elsevier; 1998:1881-1884.
http://www.sciencedirect.com/science/article/pii/B0122267656004886.
200. Naziruddin B, Iwahashi S, Kanak MA, Takita M, Itoh T, Levy MF. Evidence for instant
blood-mediated inflammatory reaction in clinical autologous islet transplantation. Am J
Transplant. 2014;14(2):428-437. doi: 10.1111/ajt.12558.

104
201. Kanak MA, Takita M, Kunnathodi F, Lawrence MC, Levy MF, Naziruddin B.
Inflammatory response in islet transplantation. Int J Endocrinol. 2014;2014:451035. doi:
10.1155/2014/451035.
202. Eggenhofer E, Luk F, Dahlke MH, Hoogduijn MJ. The life and fate of mesenchymal stem
cells. Front Immunol. 2014;5. https://www.ncbi.nlm.nih.gov/pmc/articles/PMC4032901/. doi:
10.3389/fimmu.2014.00148.
203. Alcayaga-Miranda F, Cuenca J, Khoury M. Antimicrobial activity of mesenchymal stem
cells: Current status and new perspectives of antimicrobial peptide-based therapies. Frontiers in
immunology. 2017;8:339. https://www.ncbi.nlm.nih.gov/pubmed/28424688. doi:
10.3389/fimmu.2017.00339.
204. Bornes TD, Jomha NM, Mulet-Sierra A, Adesida AB. Hypoxic culture of bone marrow-
derived mesenchymal stromal stem cells differentially enhances in vitro chondrogenesis within
cell-seeded collagen and hyaluronic acid porous scaffolds. Stem cell research & therapy.
2015;6(1):84. https://www.ncbi.nlm.nih.gov/pubmed/25900045. doi: 10.1186/s13287-015-0075-
4.
205. Fraser JK, Wulur I, Alfonso Z, Hedrick MH. Fat tissue: An underappreciated source of stem
cells for biotechnology. Trends Biotechnol. 2006;24(4):150-154. doi:
10.1016/j.tibtech.2006.01.010.
206. Ganguly P, El-Jawhari JJ, Giannoudis PV, Burska AN, Ponchel F, Jones EA. Age-related
changes in bone marrow mesenchymal stromal cells. Cell Transplantation. 2017;26(9):1520-

105
1529. https://journals.sagepub.com/doi/full/10.1177/0963689717721201. doi:
10.1177/0963689717721201.
207. Yang YK. Aging of mesenchymal stem cells: Implication in regenerative medicine.
Regenerative Therapy. 2018;9:120-122.
https://www.sciencedirect.com/science/article/pii/S235232041830035X. doi:
10.1016/j.reth.2018.09.002.
208. Jin HJ, Bae YK, Kim M, et al. Comparative analysis of human mesenchymal stem cells
from bone marrow, adipose tissue, and umbilical cord blood as sources of cell therapy. Int J Mol
Sci. 2013;14(9):17986-18001. https://www.ncbi.nlm.nih.gov/pmc/articles/PMC3794764/. doi:
10.3390/ijms140917986.
209. Lv F, Tuan RS, Cheung KMC, Leung VYL. Concise review: The surface markers and
identity of human mesenchymal stem cells. Stem Cells. 2014;32(6):1408-1419. doi:
10.1002/stem.1681.
210. Phillips BW, Lim RYM, Tan TT, Rust WL, Crook JM. Efficient expansion of clinical-grade
human fibroblasts on microcarriers: Cells suitable for ex vivo expansion of clinical-grade hESCs.
J Biotechnol. 2008;134(1-2):79-87. doi: 10.1016/j.jbiotec.2007.12.007.
211. Mariggiò MA, Cassano A, Vinella A, et al. Enhancement of fibroblast proliferation,
collagen biosynthesis and production of growth factors as a result of combining sodium
hyaluronate and aminoacids. Int J Immunopathol Pharmacol. 2009;22(2):485-492. doi:
10.1177/039463200902200225.

106
212. Alt E, Yan Y, Gehmert S, et al. Fibroblasts share mesenchymal phenotypes with stem cells,
but lack their differentiation and colony-forming potential. Biol Cell. 2011;103(4):197-208. doi:
10.1042/BC20100117.
213. Lorenz K, Sicker M, Schmelzer E, et al. Multilineage differentiation potential of human
dermal skin-derived fibroblasts. Exp Dermatol. 2008;17(11):925-932. doi: 10.1111/j.1600-
0625.2008.00724.x.
214. Schneider S, Unger M, Martijn vG, Balmayor ER. Adipose-derived mesenchymal stem
cells from liposuction and resected fat are feasible sources for regenerative medicine. European
Journal of Medical Research, Vol 22, Iss 1, Pp 1-11 (2017). 2017(1):1. doi: 10.1186/s40001-
017-0258-9.
215. Ong W, Tan C, Chan E, et al. Identification of specific cell-surface markers of adipose-
derived stem cells from subcutaneous and visceral fat depots. Stem Cell Reports. 2014;2(2):171-
179. https://www.sciencedirect.com/science/article/pii/S2213671114000034. doi:
10.1016/j.stemcr.2014.01.002.
216. Dr. Pravin D. Potdar., Head, Department of Molecular Medicine, et al. Original article. J
Stem Cells Regen Med. 2010;6(1):26-35.
https://www.ncbi.nlm.nih.gov/pmc/articles/PMC3908252/.
217. Bosnakovski D, Mizuno M, Kim G, Takagi S, Okumura M, Fujinaga T. Chondrogenic
differentiation of bovine bone marrow mesenchymal stem cells (MSCs) in different hydrogels:
Influence of collagen type II extracellular matrix on MSC chondrogenesis. Biotechnol Bioeng.
2006;93(6):1152-1163. doi: 10.1002/bit.20828.

107
218. Nelea V, Luo L, Demers CN, et al. Selective inhibition of type X collagen expression in
human mesenchymal stem cell differentiation on polymer substrates surface-modified by glow
discharge plasma. J Biomed Mater Res A. 2005;75(1):216-223. doi: 10.1002/jbm.a.30402.
219. Eyre D. Collagen of articular cartilage. Arthritis research. 2002;4(1):30.
https://www.ncbi.nlm.nih.gov/pubmed/11879535.
220. Hino K, Saito A, Kido M, et al. Master regulator for chondrogenesis, Sox9, regulates
transcriptional activation of the endoplasmic reticulum stress transducer BBF2H7/CREB3L2 in
chondrocytes. J Biol Chem. 2014;289(20):13810-13820. doi: 10.1074/jbc.M113.543322.
221. Lodish H, Berk A, Zipursky SL, Matsudaira P, Baltimore D, Darnell J. Collagen: The
fibrous proteins of the matrix. Molecular Cell Biology. 4th edition. 2000.
https://www.ncbi.nlm.nih.gov/books/NBK21582/.
222. Fedarko NS. Osteoblast/osteoclast development and function in osteogenesis imperfecta.
Osteogenesis Imperfecta : A Translational Approach to Brittle Bone Disease. 2014:45.
223. Correlo VM, Oliveira JM, Mano JF, Neves NM, Reis RL. CHAPTER 32 - natural origin
materials for bone tissue engineering – properties, processing, and performance. Principles of
Regenerative Medicine. 2011:557-586. doi: 10.1016/B978-0-12-381422-7.10032-X.
224. Caterson B, Melrose J. Keratan sulfate, a complex glycosaminoglycan with unique
functional capability. Glycobiology. 2018;28(4):182-206. doi: 10.1093/glycob/cwy003.

108
225. Schneiders W, Reinstorf A, Ruhnow M, et al. Effect of chondroitin sulphate on material
properties and bone remodelling around hydroxyapatite/collagen composites. J Biomed Mater
Res A. 2008;85(3):638-645. doi: 10.1002/jbm.a.31611.
226. Baglioni S, Francalanci M, Squecco R, et al. Characterization of human adult stem-cell
populations isolated from visceral and subcutaneous adipose tissue. FASEB J. 2009;23(10):3494-
3505. doi: 10.1096/fj.08-126946.
227. Nuttall FQ. Body mass index. Nutr Today. 2015;50(3):117-128.
https://www.ncbi.nlm.nih.gov/pmc/articles/PMC4890841/. doi: 10.1097/NT.0000000000000092.
228. Shuster A, Patlas M, Pinthus JH, Mourtzakis M. The clinical importance of visceral
adiposity: A critical review of methods for visceral adipose tissue analysis. Br J Radiol.
2012;85(1009):1-10. https://www.ncbi.nlm.nih.gov/pmc/articles/PMC3473928/. doi:
10.1259/bjr/38447238.
229. Ulum B, Teker HT, Sarikaya A, et al. Bone marrow mesenchymal stem cell donors with a
high body mass index display elevated endoplasmic reticulum stress and are functionally
impaired. J Cell Physiol. 2018;233(11):8429-8436. doi: 10.1002/jcp.26804.
230. Berry R, Rodeheffer MS, Rosen CJ, Horowitz MC. Adipose tissue residing progenitors
(adipocyte lineage progenitors and adipose derived stem cells (ADSC). Curr Mol Biol Rep.
2015;1(3):101-109. doi: 10.1007/s40610-015-0018-y.
231. Kahn SE, Cooper ME, Del Prato S. Pathophysiology and treatment of type 2 diabetes:
Perspectives on the past, present and future. Lancet. 2014;383(9922):1068-1083.

109
https://www.ncbi.nlm.nih.gov/pmc/articles/PMC4226760/. doi: 10.1016/S0140-6736(13)62154-
6.
232. Asif M. The prevention and control the type-2 diabetes by changing lifestyle and dietary
pattern. J Educ Health Promot. 2014;3.
https://www.ncbi.nlm.nih.gov/pmc/articles/PMC3977406/. doi: 10.4103/2277-9531.127541.
233. Colberg SR, Sigal RJ, Fernhall B, et al. Exercise and type 2 diabetes. Diabetes Care.
2010;33(12):e167. https://www.ncbi.nlm.nih.gov/pmc/articles/PMC2992225/. doi:
10.2337/dc10-9990.
234. Diabetes Prevention Program Research Group. 10-year follow-up of diabetes incidence and
weight loss in the diabetes prevention program outcomes study. Lancet. 2009;374(9702):1677-
1686. https://www.ncbi.nlm.nih.gov/pmc/articles/PMC3135022/. doi: 10.1016/S0140-
6736(09)61457-4.
235. Zhuo X, Zhang P, Barker L, Albright A, Thompson TJ, Gregg E. The lifetime cost of
diabetes and its implications for diabetes prevention. Diabetes Care. 2014;37(9):2557-2564. doi:
10.2337/dc13-2484.
236. Tao B, Pietropaolo M, Atkinson M, Schatz D, Taylor D. Estimating the cost of type 1
diabetes in the U.S.: A propensity score matching method. PLoS One. 2010;5(7).
https://www.ncbi.nlm.nih.gov/pmc/articles/PMC2901386/. doi: 10.1371/journal.pone.0011501.
237. CITR Coordinating Center. Scientific summary of the collaborative islet transplant registry
(CITR) 2015 (tenth) annual report. 2017.

110
238. Mandrup-Poulsen T, Helqvist S, Wogensen LD, et al. Cytokine and free radicals as effector
molecules in the destruction of pancreatic beta cells. Curr Top Microbiol Immunol.
1990;164:169-193.