isolation and fine mapping of rps6: an intermediate host resistance
TRANSCRIPT

1 3
Theor Appl Genet (2016) 129:831–843DOI 10.1007/s00122-015-2659-x
ORIGINAL ARTICLE
Isolation and fine mapping of Rps6: an intermediate host resistance gene in barley to wheat stripe rust
Andrew M. Dawson1 · John N. Ferguson1,2 · Matthew Gardiner1 · Phon Green1 · Amelia Hubbard3 · Matthew J. Moscou1
Received: 10 August 2015 / Accepted: 14 December 2015 / Published online: 11 January 2016 © The Author(s) 2016. This article is published with open access at Springerlink.com
F2:3 families to isolate Rps6 and fine mapped the locus to a 0.1 cM region. Anchoring of the Rps6 locus to the bar-ley physical map placed the region on a single fingerprinted contig spanning a physical region of 267 kb. Efforts are now underway to sequence the minimal tiling path and to delimit the physical region harboring Rps6. This will facili-tate additional marker development and permit identifica-tion of candidate genes in the region.
Introduction
Nonhost resistance is often described as the complete resistance of an entire plant species to a specific pathogen (Heath 2000; Mysore and Ryu 2004; Nürnberger and Lipka 2005). In the majority of cases, this definition will hold true, as generally, most plants remain healthy, despite the ubiquity of potentially pathogenic microbes in the environ-ment. However, it is clear that some plant pathogen interac-tions do not prescribe to the qualitative separation of host and nonhost. Instead, they appear to exist in a transitional phase between the two states, where radial coevolution with microbial species leads to the erosion, or reinforce-ment, of host status to pathogenic microbes (Niks and Mar-cel 2009; Schulze-Lefert and Panstruga 2011). This ‘coevo-lution’ can be considered a short-term interaction relative to the evolutionary time of plant speciation. Under long-term timescales, the preponderance of evidence supports host-shift speciation rather than cospeciation in the evolution of plant and microbial species (de Vienne et al. 2013). In con-trast, our understanding of the short-term dynamics of host specialization remains poorly understood.
Host specialization is often observed in the interaction of mildew and rust fungi with grasses, particularly the for-mae speciales divide of cereal rusts (Bushnell and Roelfs
Abstract Key message We uncouple host and nonhost resistance in barley to Puccinia striiformis ff. spp. hordei and trit-ici. We isolate, fine map, and physically anchor Rps6 to chromosome 7H in barley.Abstract A plant may be considered a nonhost of a patho-gen if all known genotypes of a plant species are resistant to all known isolates of a pathogen species. However, if a small number of genotypes are susceptible to some known isolates of a pathogen species this plant may be consid-ered an intermediate host. Barley (Hordeum vulgare) is an intermediate host for Puccinia striiformis f. sp. tritici (Pst), the causal agent of wheat stripe rust. We wanted to under-stand the genetic architecture underlying resistance to Pst and to determine whether any overlap exists with resist-ance to the host pathogen, Puccinia striiformis f. sp. hordei (Psh). We mapped Pst resistance to chromosome 7H and show that host and intermediate host resistance is geneti-cally uncoupled. Therefore, we designate this resistance locus Rps6. We used phenotypic and genotypic selection on
Communicated by K. Smith.
Electronic supplementary material The online version of this article (doi:10.1007/s00122-015-2659-x) contains supplementary material, which is available to authorized users.
* Matthew J. Moscou [email protected]
1 The Sainsbury Laboratory, Norwich Research Park, Norwich NR4 7UH, UK
2 Present Address: School of Biological Sciences, University of Essex, Colchester CO4 3SQ, UK
3 National Institute of Agricultural Botany, Huntingdon Road, Cambridge CB3 0LE, UK
832 Theor Appl Genet (2016) 129:831–843
1 3
1984; Eriksson 1894; Niks and Marcel 2009). Eriksson (1894) first proposed the formae speciales to differentiate forms of cereal rusts that were pathogenically specialized to given host genera but were otherwise morphologically indistinguishable. However, it was found that the formae speciales were not exclusively restricted to their host gen-era (Straib 1937) and the application to plant species out-side of the host genera can result in varying degrees of compatibility: ranging from haustoria formation and hyphal colonization continuing through to lifecycle completion and pustule formation (Bettgenhaeuser et al. 2014). Despite the observation of non-exclusivity, the formae speciales division has been maintained. Bettgenhaeuser et al. (2014) proposed that interactions involving inappropriate formae speciales and nonhost plant genera are intermediate host systems that exist in the evolutionary transition between host and nonhost.
To date, a number of studies have reported on the genetic architecture of intermediate host systems with the majority reporting evidence for the role of major loci underlying resistance to nonhost formae speciales (Jafary et al. 2006, 2008; Pahalawatta and Chen 2005; Sui et al. 2010; Tosa 1989, 1992). So far, no major locus condition-ing intermediate host resistance has been cloned within the Triticeae tribe. However, numerous major loci have been cloned for host pathosystems with the majority coding for intracellular, nucleotide-binding, leucine-rich repeat pro-teins (NLRs) (Krattinger et al. 2009). Whether the same observations will be made for major loci in intermediate systems is unclear. However, the proposed contribution of NLRs to nonhost immunity is now widely accepted despite the relatively few well-characterized examples (Mysore and Ryu 2004; Schulze-Lefert and Panstruga 2011; Thordal-Christensen 2003). Molecular characteriza-tion of two tandemly arranged NLRs, RGA4 (Resistance gene analogue 4) and RGA5 (Resistance gene analogue 5), have been shown to condition Pi-CO39(t) mediated resist-ance to a nonhost Magnaporthe oryzae (rice blast) isolate in rice (Cesari et al. 2013). Similarly, WRR4 conditions nonhost resistance to Albugo candida, the causal agent of white blister rust, in Arabidopsis thaliana (Borhan et al. 2008). These observations support the molecular evolu-tionary model proposed by Schulze-Lefert and Panstruga (2011) that implicates NLRs in nonhost resistance. In the model, the authors assert that the contribution of NLR trig-gered immunity will decrease as a function of evolution-ary divergence time from the host. Given the presumed evolutionary infancy of the formae speciales divide, one may hypothesize that major loci governing nonhost resist-ance in intermediate host systems may be underpinned by NLRs analogous to host systems. However, very little evi-dence exists to support this notion due to a lack of well-resourced, model pathosystems, with robust phenotypes,
that permit the elucidation of the underlying molecular mechanisms of resistance.
Barley (Hordeum vulgare L.) has many traits that make it an appealing model organism. It is an inbreeding crop, a true diploid, and has a rich pedigree of genetic research that spans more than a century (Ullrich 2010). Despite its large genome of 5.1 Gbp that is largely composed of repetitive DNA, barley has been proposed as a model for genomic research within the Triticeae tribe (IBGSC 2012; Schulte et al. 2009) and to date, there have been >20 genes isolated via map-based cloning approaches (Ariyadasa et al. 2014; Krattinger et al. 2009). Recently, significant advances have been made with regards to the genetic and genomic resources available in barley and these hold sig-nificant promise to assist gene isolation studies (Mayer et al. 2011; Muñoz-Amatriaín et al. 2011). The first major step towards a draft genome sequence was made when the International Barley Genome Sequencing Consortium pub-lished a 4.98 Gbp BAC-based physical map anchored to a high-resolution genetic map (IBGSC 2012). In this study, sequencing of 6278 BAC clones and 304,523 BAC end sequences (BES) allowed 112,989 whole genome shotgun (WGS) contiguous sequences (contigs) to be anchored to the physical map. Additionally, an estimation of the gene space was made by aligning full-length barley cDNAs and over 1.5 billion RNAseq reads to the WGS assembly resulting in the identification of over 26,000 high confi-dence genes (IBGSC 2012). Shortly after the publication of the anchored physical map, Mascher et al. (2013) used low read depth sequencing of progeny from a recombi-nant inbred line (RIL) population (POPSEQ) to geneti-cally bin approximately 1.2 Gbp of sequence information. Subsequently, the integration of these two datasets and the anchoring of additional sequence information via multiple genetic maps led to the publication of a barley genomic resource, spanning ~98 % of the barley genome, geneti-cally anchored by two million single nucleotide polymor-phisms (SNPs) (Ariyadasa et al. 2014). This resource will provide an invaluable tool for future gene isolation studies, as it provides physical sequence information that can be used for marker development, candidate gene analysis, and the generation of high confidence gene models.
In this study, we test whether there is an overlap between resistance to the host pathogen, Puccinia striiformis West-end. f. sp. hordei Erikss. (Psh) and the intermediate host pathogen, Puccinia striiformis f. sp. tritici Erikss. (Pst). We use the barley accession Abed Binder 12 that contains the Psh resistance gene rps2 (Nover and Scholz 1969), which is also highly resistant to Pst. After mapping Pst resistance to chromosome 7H, we determine that host and intermediate host resistance are uncoupled and designate the Pst resist-ance locus Rps6. Subsequently, we isolate and fine map Rps6 to a 0.1 cM region and anchor the region to a single
833Theor Appl Genet (2016) 129:831–843
1 3
fingerprinted contig (FPC) in barley. Future work on the cloning of Rps6 will establish the genetic basis for resist-ance and its contribution to host and nonhost resistance.
Materials and methods
Plant materials
Seed for Abed Binder 12 (PI 327961) and Russell (PI 483127) were obtained from the United States Department of Agriculture, Agricultural Research Service (USDA-ARS). A cross was made using Abed Binder 12 as the maternal parent and Russell as the paternal pollen donor. A single F1 plant was used to generate three independent F2 populations used for inoculation with Psh and Pst, and for the development of a F2:3 population.
Pathogen materials and assays
Pathogen assays were carried out using either Pst isolates 08/501 or 08/21, or Psh isolate B01/2. The Psh and Pst isolates were collected by The National Institute for Agri-cultural Botany in 2001 and 2008, respectively. Pst isolates 08/21 and 08/501 urediniospores were bulked, and main-tained, on the susceptible wheat cvs. Solstice and Victo, respectively. Psh isolate B01/2 urediniospores were bulked, and maintained, on the susceptible barley cv. Cassata. For plant inoculations, four groups of eight seeds were sown in a 1 L pot using a peat-based compost. Plants were grown in a controlled environment chamber at 18 °C day and 11 °C night using a 16 h light and 8 h dark cycle with lighting provided by metal halide bulbs (Philips MASTER HPI-T Plus 400 W/645 E40). Inoculations were performed on 14-day-old seedlings when the first leaf was fully emerged and prior to the emergence of the second leaf. Inoculum was prepared by mixing fresh spores with talcum powder at a weight ratio of 1:16. A compressed air pump was used to disseminate inoculum onto seedlings positioned on a spin-ning platform. After inoculation, seedling pots were sealed in plastic bags and stored in the dark at 6 °C to achieve the high humidity required for successful germination. Seed-lings were returned to the controlled environment growth chamber after 48–72 h post inoculation. Disease symptoms were scored 14 days post inoculation.
Macroscopic phenotyping
Plants inoculated with Psh were phenotyped macroscopi-cally using the McNeal scale: a scale designed for host sys-tems that ranges from 0 (immune; no visible symptoms) to 9 (very susceptible; abundant pustule formation, without chlorosis) (McNeal et al. 1971). For plants inoculated with
Pst, we used an alternate phenotyping scale to measure the macroscopic phenotypes of chlorosis (leaf yellowing) and infection (pustule formation). They were individually scored on a continuous nine-point scale ranging from 0 to 4, with increments of 0.5. Scores reflected the percentage of the inoculated leaf surface expressing the disease symp-tom. A score of 0 indicated no expression of the phenotype (0 % coverage), whereas a score of 4 indicated extensive expression of the phenotype (100 % coverage).
Microscopic phenotyping
First leaves of inoculated seedlings were harvested with scissors and placed in 15 mL centrifuge tubes filled with 1.0 M KOH and a droplet of surfactant (Silwet L-77, Love-land Industries Ltd.). Tubes were incubated at 37 °C for 12–16 h. The KOH solution was decanted and leaves were washed three times using 15 mL of 50 mM Tris HCL-pH 7.5. Leaf samples were then incubated overnight at 4 °C in a 2.0 % w/v staining solution containing wheat germ agglu-tinin conjugated to fluorescein isothiocyanate (WGA-FITC; Sigma Aldrich; L4895-10MG) dissolved in 50 mM Tris HCL. Leaves were washed with sterile water and mounted on microscope slides. Mounts were visualized under blue light excitation using a fluorescence microscope with GFP filter under a 5× objective. Each field of view (FOV) was 2.72 mm × 2.04 mm. Data was collected by estimating the amount of colonization and pustule formation in non-over-lapping FOVs covering the length and breadth of the leaf. Disease symptoms were estimated to be less than 15 %, between 15 and 50 %, or greater than 50 % by assigning the values 0, 0.5 and 1 to each FOV. Percent colonization (pCOL) and pustule formation (pPUST) scores, ranging from 0 to 100 %, were calculated by averaging the values relative to the number of FOVs in each leaf.
DNA extraction
DNA from all populations was extracted from leaf tissue following a CTAB-based protocol adapted for 96-well based format modified from (Stewart and Via 1993) that provides PCR-grade genomic DNA (Nick Lauter, personal communication).
Marker development for genetic map construction
The concentration of gDNA was estimated using the Pico-Green dsDNA quantification assay (Life Technologies; P11496) and was normalized to 60 ng/μL. Oligonucleotide assay (OPA) genotyping using the barley BOPA1 design that includes 1536 SNP-based markers was performed at the University of California, Los Angeles Southern Cali-fornia Genotyping Consortium (Los Angeles, CA, USA)
834 Theor Appl Genet (2016) 129:831–843
1 3
(Close et al. 2009). Additional markers were developed as either cleaved amplified polymorphic sequence (CAPS) or Sequenom MassARRAY markers to bridge gaps between unlinked chromosome arms and increase marker den-sity. For CAPS marker development, we identified type II restriction enzymes that digest at polymorphic positions using CAPS Designer (http://solgenomics.net/tools/caps_designer/caps_input.pl). CAPS marker PCR reactions were prepared by mixing 2 μL buffer (10×), 0.4 μL dNTPs, 0.4 μL forward primer, 0.4 μL reverse primer, 0.2 μL Taq polymerase, 2 μL gDNA at 10 ng/μL, and 14.6 μL H2O. The PCR cycling started with an initial denaturation step at 94 °C for 5 min and then proceeded through a cycle of 94 °C for 20 s, annealing at 56 °C for 30 s and primer exten-sion at 72 °C for 1 min for a total of 35 cycles. The proce-dure ended with a final extension at 72 °C for 5 min before being held at 16 °C. Digestions were performed according to the manufacturer’s instructions for individual enzymes. Electrophoresis was used to resolve restriction fragments using 2.0 % TBE agarose gels stained with ethidium bro-mide. Gel images were taken using a Bio-Rad ChemDoc XRS + imaging system and markers were scored manually. GBS CAPS markers are described in (Kota et al. 2008). All primers and restriction enzymes for CAPS markers are detailed in ESM 1. For Sequenom marker develop-ment, SNP sequences were extracted in IUPAC format with 40–60 bp flanking sequence. This sequence was used as a template for primer design using MassARRAY soft-ware v3.1 for the multiplexing up to 32 SNP assays. Seque-nom genotyping was carried out at the Iowa State Univer-sity Genomic Technologies Facility (Ames, IA, USA). All SNPs and WGS contig source information for Sequenom markers are detailed in ESM 2.
Genetic map construction
A genetic map was constructed using 589 markers includ-ing 535 barley OPA (Close et al. 2009), 26 CAPS mark-ers, and 28 Sequenom markers. JoinMap v4 was used using default parameters and an independence LOD threshold of 4.0 (van Ooijen 2006). Genetic distances were esti-mated using the Kosambi mapping function. Integrity of the genetic map was evaluated through comparison with the current OPA consensus genetic map of barley (Muñoz-Amatriaín et al. 2011) and with two-point linkage tests using R/qtl (v1.33-7).
QTL and ANOVA analyses
Composite interval mapping was performed with QTL Cartographer (v1.17j) using model 6, the selection of five background markers, a step size of 2 cM, and a window size of 10 cM (Basten et al. 1994). Significant QTLs were
extracted using the Eqtl module under the H0:H3 model using experiment-wide thresholds (EWT) that were calcu-lated using 1000 permutations with the reselection of back-ground markers using a threshold of α < 0.05 (Doerge and Churchill 1996; Lauter et al. 2008). ANOVA analyses for testing the linkage of individual markers were performed with R/qtl.
Transcriptome sequencing and assembly
Leaf tissue was harvested from first and second leaves 18 days after sowing for Abed Binder 12 and Russell. Samples were flash frozen in liquid nitrogen, and stored at −80 °C. Samples were homogenized in liquid nitrogen-chilled pestle and mortars. RNA was extracted from sam-ples using TRI-reagent (Sigma-Aldrich; T9424) accord-ing to the manufacturer’s protocol. DNA was removed by treating samples with RQ1 RNase free DNase (Promega; M6101). Samples were purified using RNeasy mini spin columns following the RNA Cleanup protocol (Qiagen; product No. 74104). The quality and integrity of the RNA samples were assessed using RNA Nano Chips (Agilent Technologies; product no. 5067-1511) on an Agilent 2100 Bioanalyzer. Abed Binder 12 and Russell RNA librar-ies were constructed using Illumina TruSeq RNA library preparation (Illumina; RS-122-2001). Final library insert sizes were predicted to be 411 and 339 bp for Abed Binder 12 and Russell, respectively. Barcoded libraries were sequenced using 100 bp paired-end reads on one lane of a Hiseq 2000/2500. This generated 32.0 and 59.3 million paired end reads for Abed Binder 12 and Russell, respec-tively. All library preparation and sequencing was per-formed at The Genome Analysis Centre (Norwich, UK). RNAseq data quality was assessed with FastQC and reads were removed using Trimmomatic (v0.32) with parameters set at ILLUMINACLIP:TruSeq 3-PE.fa:2:30:10, LEAD-ING:3, TRAILING:3, SLIDINGWINDOW:4:15, and MIN-LEN:100. These parameters will remove all reads with adapter sequence, ambiguous bases, or a substantial reduc-tion in read quality. Transcriptome assembly was performed using Trinity (v2013-11-10) using default parameters. Raw reads have been submitted to NCBI Short Read Archive under the BioProject ID PRJNA292371 and SRA accession SRR2153288 (cv. Abed Binder 12) and SRR2153285 (cv. Russell).
Marker development for saturation at the Rps6 locus
Initial marker development was guided by two approaches to identify sequences anchored to the Rps6 region. This included the identification of anchored unigenes based on marker colinearity with existing genetic maps (Moscou et al. 2011; Muñoz-Amatriaín et al. 2011; Potokina et al.
835Theor Appl Genet (2016) 129:831–843
1 3
2008) and orthologous rice genes based on the barley genome zipper (Mayer et al. 2011). A region on rice chro-mosome 6 was selected including 38 genes (Os06g43140 to Os06g43900). Best BLASTn hits returned from the cv. Morex WGS assembly (IBGSC 2012) were used as tem-plate for PCR primer design using Primer3 (libprimer3 release 2.3.6). All BLASTn queries were performed using blastall (v2.2.23). Abed Binder 12 and Russell gDNA was used as template for PCR amplification and Sanger sequencing. SNPs were identified by aligning sequence files using Seqman software (DNAstar Lasergene v11). SNPs were then used to develop markers using Cleaved Amplified Polymorphic Sequences or Sequenom MassAR-RAY iPLEX platform as described above.
Subsequent marker development involved either (1) the comparison of genomic contigs derived from cvs. Barke, Bowman, and Morex or (2) the comparison of Abed Binder 12 and Russell RNAseq aligned reads to WGS contigs anchored to the Rps6 region (IBGSC 2012; Mascher et al. 2013). Geneious (v8.1.6) was used for read alignment using Geneious mapping function with default parameters and data visualization (Kearse et al. 2012). SNPs were converted into Kompetitive Allele Specific PCR (KASP) markers using a similar approach as described in (Ramirez-Gonzalez et al. 2015). All WGS contig source information, SNPs, KASP marker template, and primers are detailed in ESM 3. KASP assays were performed at the John Innes Centre Genotyping Facility (Norwich, UK).
Recombination screen and phenotyping
A recombination screen was carried out using seed bulked from F3 plants selected from a single F2:3 family that were heterozygous for Rps6. Sequenom markers were converted into KASP markers and used as flanking markers to iden-tify recombinant chromosomes. Two independent progeny tests were performed using individuals with recombinant chromosomes. A total of 16 individuals per family per rep-licate were scored for macroscopic observation of chlorosis and infection.
Results
Our initial hypothesis was that resistance to host pathogens would overlap with resistance to intermediate host patho-gens. To test this hypothesis, we focused our attention on the unmapped Psh resistance gene rps2 that is present in the barley cultivar Abed Binder 12 (Nover and Scholz 1969). Screening of Abed Binder 12 found it was highly resistant (McNeal score 1) to Psh isolate B01/2, whereas cultivar Russell was highly susceptible (McNeal score of 8). Similar differential phenotypes were observed after
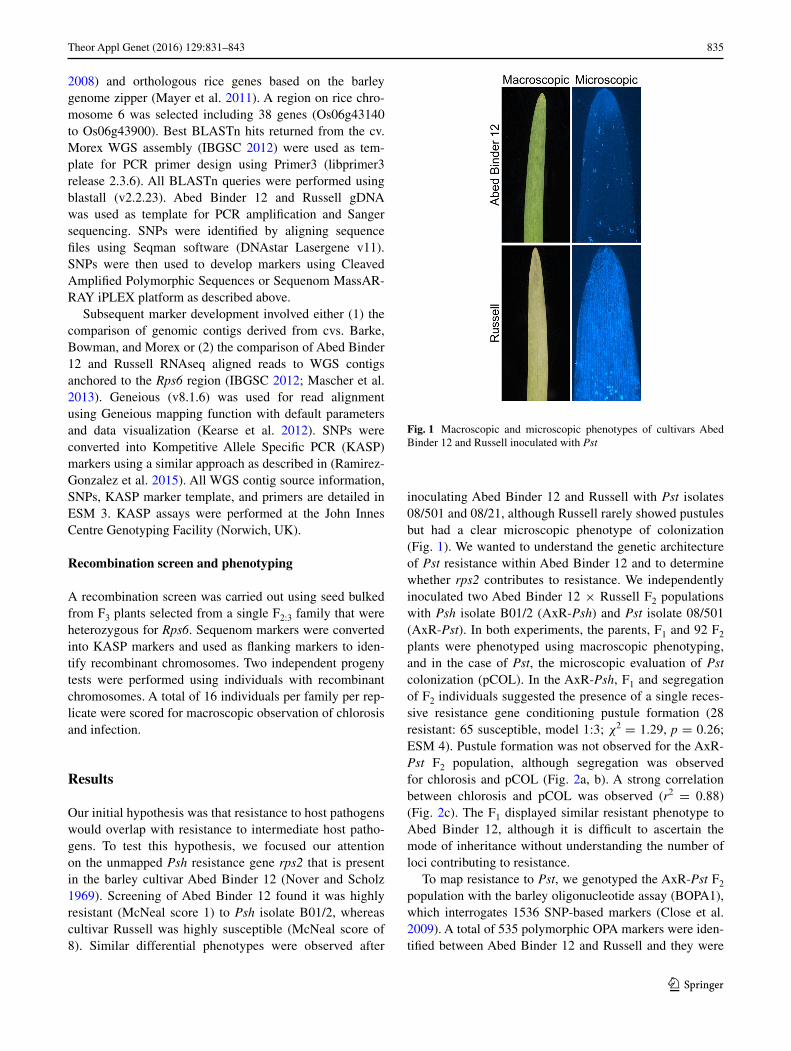
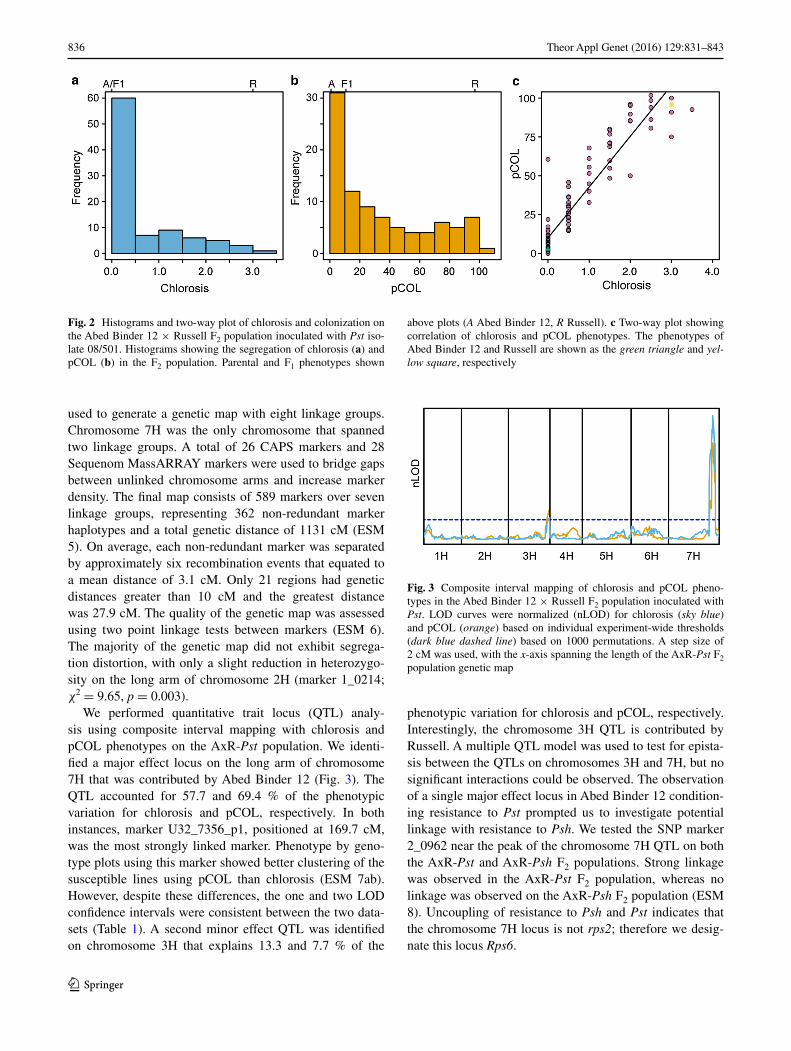
inoculating Abed Binder 12 and Russell with Pst isolates 08/501 and 08/21, although Russell rarely showed pustules but had a clear microscopic phenotype of colonization (Fig. 1). We wanted to understand the genetic architecture of Pst resistance within Abed Binder 12 and to determine whether rps2 contributes to resistance. We independently inoculated two Abed Binder 12 × Russell F2 populations with Psh isolate B01/2 (AxR-Psh) and Pst isolate 08/501 (AxR-Pst). In both experiments, the parents, F1 and 92 F2 plants were phenotyped using macroscopic phenotyping, and in the case of Pst, the microscopic evaluation of Pst colonization (pCOL). In the AxR-Psh, F1 and segregation of F2 individuals suggested the presence of a single reces-sive resistance gene conditioning pustule formation (28 resistant: 65 susceptible, model 1:3; χ2 = 1.29, p = 0.26; ESM 4). Pustule formation was not observed for the AxR-Pst F2 population, although segregation was observed for chlorosis and pCOL (Fig. 2a, b). A strong correlation between chlorosis and pCOL was observed (r2 = 0.88) (Fig. 2c). The F1 displayed similar resistant phenotype to Abed Binder 12, although it is difficult to ascertain the mode of inheritance without understanding the number of loci contributing to resistance.
To map resistance to Pst, we genotyped the AxR-Pst F2 population with the barley oligonucleotide assay (BOPA1), which interrogates 1536 SNP-based markers (Close et al. 2009). A total of 535 polymorphic OPA markers were iden-tified between Abed Binder 12 and Russell and they were
Fig. 1 Macroscopic and microscopic phenotypes of cultivars Abed Binder 12 and Russell inoculated with Pst
836 Theor Appl Genet (2016) 129:831–843
1 3
used to generate a genetic map with eight linkage groups. Chromosome 7H was the only chromosome that spanned two linkage groups. A total of 26 CAPS markers and 28 Sequenom MassARRAY markers were used to bridge gaps between unlinked chromosome arms and increase marker density. The final map consists of 589 markers over seven linkage groups, representing 362 non-redundant marker haplotypes and a total genetic distance of 1131 cM (ESM 5). On average, each non-redundant marker was separated by approximately six recombination events that equated to a mean distance of 3.1 cM. Only 21 regions had genetic distances greater than 10 cM and the greatest distance was 27.9 cM. The quality of the genetic map was assessed using two point linkage tests between markers (ESM 6). The majority of the genetic map did not exhibit segrega-tion distortion, with only a slight reduction in heterozygo-sity on the long arm of chromosome 2H (marker 1_0214; χ2 = 9.65, p = 0.003).
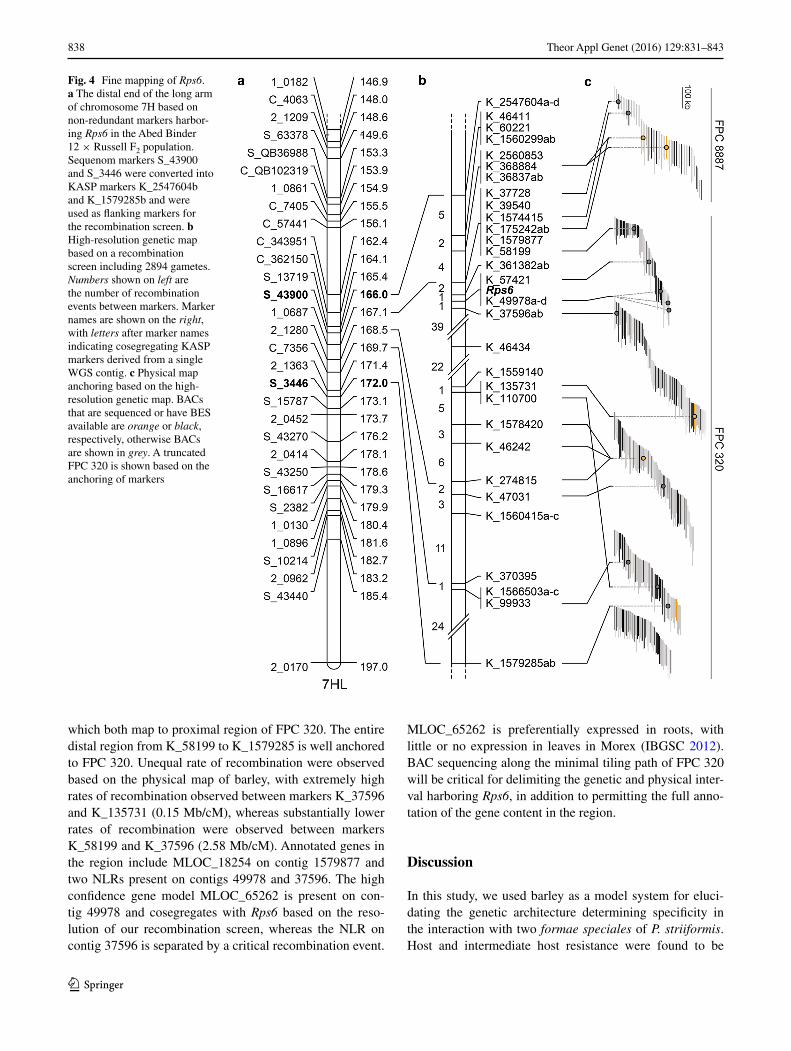
We performed quantitative trait locus (QTL) analy-sis using composite interval mapping with chlorosis and pCOL phenotypes on the AxR-Pst population. We identi-fied a major effect locus on the long arm of chromosome 7H that was contributed by Abed Binder 12 (Fig. 3). The QTL accounted for 57.7 and 69.4 % of the phenotypic variation for chlorosis and pCOL, respectively. In both instances, marker U32_7356_p1, positioned at 169.7 cM, was the most strongly linked marker. Phenotype by geno-type plots using this marker showed better clustering of the susceptible lines using pCOL than chlorosis (ESM 7ab). However, despite these differences, the one and two LOD confidence intervals were consistent between the two data-sets (Table 1). A second minor effect QTL was identified on chromosome 3H that explains 13.3 and 7.7 % of the
phenotypic variation for chlorosis and pCOL, respectively. Interestingly, the chromosome 3H QTL is contributed by Russell. A multiple QTL model was used to test for epista-sis between the QTLs on chromosomes 3H and 7H, but no significant interactions could be observed. The observation of a single major effect locus in Abed Binder 12 condition-ing resistance to Pst prompted us to investigate potential linkage with resistance to Psh. We tested the SNP marker 2_0962 near the peak of the chromosome 7H QTL on both the AxR-Pst and AxR-Psh F2 populations. Strong linkage was observed in the AxR-Pst F2 population, whereas no linkage was observed on the AxR-Psh F2 population (ESM 8). Uncoupling of resistance to Psh and Pst indicates that the chromosome 7H locus is not rps2; therefore we desig-nate this locus Rps6.
Fig. 2 Histograms and two-way plot of chlorosis and colonization on the Abed Binder 12 × Russell F2 population inoculated with Pst iso-late 08/501. Histograms showing the segregation of chlorosis (a) and pCOL (b) in the F2 population. Parental and F1 phenotypes shown
above plots (A Abed Binder 12, R Russell). c Two-way plot showing correlation of chlorosis and pCOL phenotypes. The phenotypes of Abed Binder 12 and Russell are shown as the green triangle and yel-low square, respectively
Fig. 3 Composite interval mapping of chlorosis and pCOL pheno-types in the Abed Binder 12 × Russell F2 population inoculated with Pst. LOD curves were normalized (nLOD) for chlorosis (sky blue) and pCOL (orange) based on individual experiment-wide thresholds (dark blue dashed line) based on 1000 permutations. A step size of 2 cM was used, with the x-axis spanning the length of the AxR-Pst F2 population genetic map

837Theor Appl Genet (2016) 129:831–843
1 3
The presence of a minor effect QTL in the AxR-Pst F2 population necessitated additional selection to isolate Rps6. We used a combination of phenotypic and genotypic selec-tion on a second AxR F2 population. The F2 population (N = 96) was genotyped using markers flanking Rps6 and the minor effect QTL on chromosome 3H. Subsequently, eight plants from every F2:3 family were macroscopically phenotyped using Pst isolate 08/21. Similar significance and effect sizes were observed for Rps6 and the chromo-some 3H QTL (ESM 9). A single F2:3 family was selected that was heterozygous for Rps6, absent for the chromo-some 3H QTL, and showed clear macroscopic segregation for resistance. In an initial screen, 96 F2:3 plants derived from this family were inoculated with Pst isolate 08/21, genotyped with markers flanking Rps6, and phenotyped for chlorosis and pCOL. Distinct clustering was observed for Rps6 with the marker U32_4671_p1 in contrast to the over-lapping clustering within the original AxR-Pst F2 popula-tion (ESM 7). Rps6 is additive in its contribution to chlo-rosis and pCOL, however, transgressive segregation was found within this selected F2:3 family for pustule formation. Rps6 is dominant for conditioning resistance to pustule for-mation, suggesting that in a fully susceptible background it would be considered dominant.
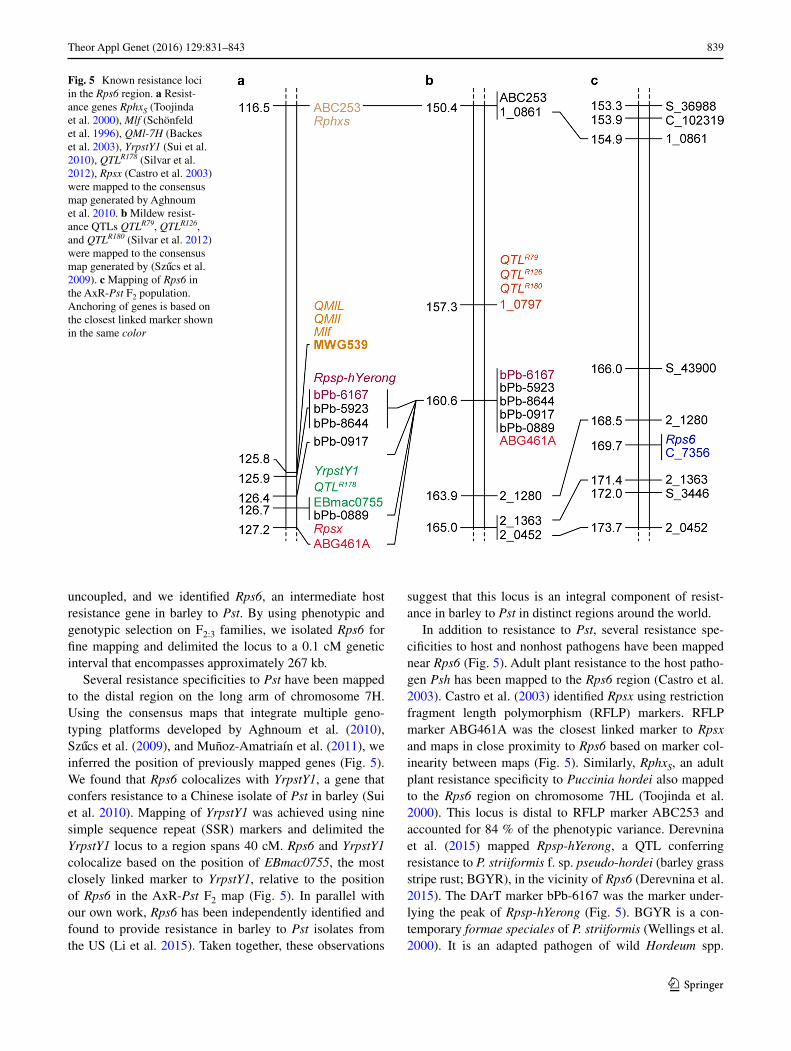
To fine map Rps6, we carried out a recombination screen and saturated the locus with markers based on the genomic resources available in barley. The recombination screen was carried out using seed bulked from F3 plants that were heterozygous for Rps6 in the previously characterized F2:3 family. The KASP markers K_2547604b and K_1579285b were generated from Sequenom markers S_43900 and S_3446, respectively, and used as flanking markers that span a 6.0 cM region encompassing Rps6 (Fig. 4a). In total, 2894 gametes were characterized, identifying 135 recom-bination events between the flanking markers (Fig. 4b). Progeny tests were performed using individuals with recombinant chromosomes and scored homozygous or seg-regating for resistance, or homozygous susceptible. Addi-tional marker saturation was required to resolve Rps6, so
we adopted two strategies for the development of markers. In the first instance, we compared genomic contigs derived from cultivars Barke, Bowman, and Morex to identify SNPs. In parallel, we performed RNAseq on Abed Binder 12 and Russell and aligned reads to whole genome shot-gun (WGS) contigs anchored to the Rps6 region (IBGSC 2012; Mascher et al. 2013) (Fig. 4b). These analyses were performed twice; initially using the anchored contigs from the IBGSC reference anchoring that included 78 contigs between 127.12 and 129.21 cM (IBGSC 2012). Later, a larger interval was investigated including 1345 con-tigs between 126.20 and 131.44 cM based on an updated anchoring (Mascher et al. 2013). RNAseq data was aligned to WGS contigs and manually curated to identify SNPs polymorphic between Abed Binder 12 and Russell. A total of 102 SNPs were successfully converted into Kom-petitive Allele Specific PCR (KASP) markers and surveyed on recombinant individuals in the Rps6 region. In total, 49 KASP markers representing 30 WGS contigs mapped between the Rps6 flanking markers (Fig. 5b). At a fine scale, contigs mapped in a different order relative to their current anchoring in the barley POPSEQ anchored contigs, although at the rough scale the general order was preserved. The markers collapsed into 18 marker bins and positioned Rps6 in a 0.1 cM region, flanked by K_361382 (proximal) and K_37596 (distal) (Fig. 4b). Rps6 has been resolved with maximum resolution in this recombination screen, as the gene is flanked by single recombination events with proximal and distal markers.
To anchor the Rps6 locus to the barley physical map, we used the available BES and shotgun sequenced BACs in the Rps6 region (IBGSC 2012). In the proximal region, sev-eral KASP markers map to the physical map on FPC 8887 based on BES and sequenced BACs. Using currently avail-able information it is unclear if FPC 8887 is correctly orien-tated based on our marker order. Marker K_58199 defines a boundary on FPC 320, indicating that K_361382 is located on the physical sequence between K_58199 and K_57421. Rps6 cosegregates with markers K_57421 and K_49978,
Table 1 Significant QTLs from composite interval mapping of chlorosis and pCOL phenotypes in the Abed Binder 12 × Russell F2 population inoculated with Pst isolate 08/501
a Chromosomeb Experimental-wide thresholdc Additive effect estimate, positive values indicate the contribution of resistance from Abed Binder 12d Dominance effect estimatee Estimate of dominance to additivity ratiof Percent of the phenotypic variation explained
Trait Chra cM Peak marker EWTb LOD AEEc DEEd D/Ae PVEf
Chlorosis 3H 155.7 1_0893 4.38 6.52 −0.47 −0.07 0.15 0.13
Chlorosis 7H 169.7 U32_7356_p1 4.38 21.57 0.99 −0.51 −0.52 0.58
pCOL 3H 158.3 1_0694 4.20 4.60 −0.12 0.03 −0.21 0.08
pCOL 7H 169.7 U32_7356_p1 4.20 26.59 0.40 −0.15 −0.39 0.69
838 Theor Appl Genet (2016) 129:831–843
1 3
which both map to proximal region of FPC 320. The entire distal region from K_58199 to K_1579285 is well anchored to FPC 320. Unequal rate of recombination were observed based on the physical map of barley, with extremely high rates of recombination observed between markers K_37596 and K_135731 (0.15 Mb/cM), whereas substantially lower rates of recombination were observed between markers K_58199 and K_37596 (2.58 Mb/cM). Annotated genes in the region include MLOC_18254 on contig 1579877 and two NLRs present on contigs 49978 and 37596. The high confidence gene model MLOC_65262 is present on con-tig 49978 and cosegregates with Rps6 based on the reso-lution of our recombination screen, whereas the NLR on contig 37596 is separated by a critical recombination event.
MLOC_65262 is preferentially expressed in roots, with little or no expression in leaves in Morex (IBGSC 2012). BAC sequencing along the minimal tiling path of FPC 320 will be critical for delimiting the genetic and physical inter-val harboring Rps6, in addition to permitting the full anno-tation of the gene content in the region.
Discussion
In this study, we used barley as a model system for eluci-dating the genetic architecture determining specificity in the interaction with two formae speciales of P. striiformis. Host and intermediate host resistance were found to be
Fig. 4 Fine mapping of Rps6. a The distal end of the long arm of chromosome 7H based on non-redundant markers harbor-ing Rps6 in the Abed Binder 12 × Russell F2 population. Sequenom markers S_43900 and S_3446 were converted into KASP markers K_2547604b and K_1579285b and were used as flanking markers for the recombination screen. b High-resolution genetic map based on a recombination screen including 2894 gametes. Numbers shown on left are the number of recombination events between markers. Marker names are shown on the right, with letters after marker names indicating cosegregating KASP markers derived from a single WGS contig. c Physical map anchoring based on the high-resolution genetic map. BACs that are sequenced or have BES available are orange or black, respectively, otherwise BACs are shown in grey. A truncated FPC 320 is shown based on the anchoring of markers
839Theor Appl Genet (2016) 129:831–843
1 3
uncoupled, and we identified Rps6, an intermediate host resistance gene in barley to Pst. By using phenotypic and genotypic selection on F2:3 families, we isolated Rps6 for fine mapping and delimited the locus to a 0.1 cM genetic interval that encompasses approximately 267 kb.
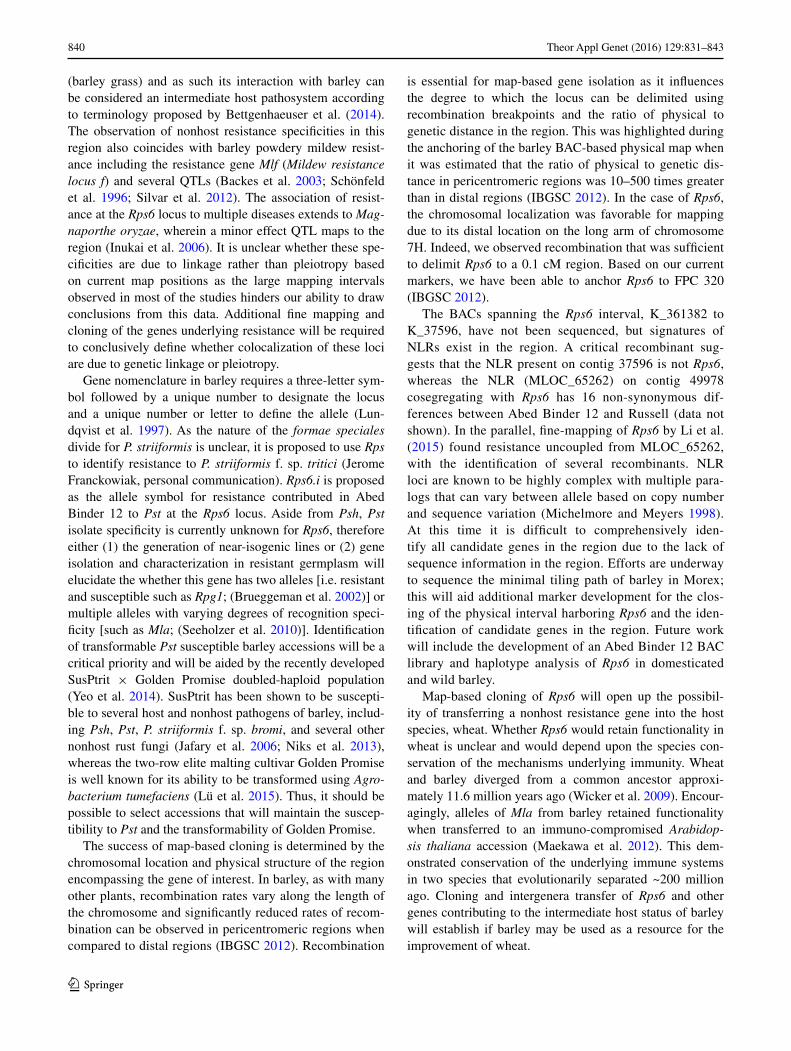
Several resistance specificities to Pst have been mapped to the distal region on the long arm of chromosome 7H. Using the consensus maps that integrate multiple geno-typing platforms developed by Aghnoum et al. (2010), Szucs et al. (2009), and Muñoz-Amatriaín et al. (2011), we inferred the position of previously mapped genes (Fig. 5). We found that Rps6 colocalizes with YrpstY1, a gene that confers resistance to a Chinese isolate of Pst in barley (Sui et al. 2010). Mapping of YrpstY1 was achieved using nine simple sequence repeat (SSR) markers and delimited the YrpstY1 locus to a region spans 40 cM. Rps6 and YrpstY1 colocalize based on the position of EBmac0755, the most closely linked marker to YrpstY1, relative to the position of Rps6 in the AxR-Pst F2 map (Fig. 5). In parallel with our own work, Rps6 has been independently identified and found to provide resistance in barley to Pst isolates from the US (Li et al. 2015). Taken together, these observations
suggest that this locus is an integral component of resist-ance in barley to Pst in distinct regions around the world.
In addition to resistance to Pst, several resistance spe-cificities to host and nonhost pathogens have been mapped near Rps6 (Fig. 5). Adult plant resistance to the host patho-gen Psh has been mapped to the Rps6 region (Castro et al. 2003). Castro et al. (2003) identified Rpsx using restriction fragment length polymorphism (RFLP) markers. RFLP marker ABG461A was the closest linked marker to Rpsx and maps in close proximity to Rps6 based on marker col-inearity between maps (Fig. 5). Similarly, RphxS, an adult plant resistance specificity to Puccinia hordei also mapped to the Rps6 region on chromosome 7HL (Toojinda et al. 2000). This locus is distal to RFLP marker ABC253 and accounted for 84 % of the phenotypic variance. Derevnina et al. (2015) mapped Rpsp-hYerong, a QTL conferring resistance to P. striiformis f. sp. pseudo-hordei (barley grass stripe rust; BGYR), in the vicinity of Rps6 (Derevnina et al. 2015). The DArT marker bPb-6167 was the marker under-lying the peak of Rpsp-hYerong (Fig. 5). BGYR is a con-temporary formae speciales of P. striiformis (Wellings et al. 2000). It is an adapted pathogen of wild Hordeum spp.
Fig. 5 Known resistance loci in the Rps6 region. a Resist-ance genes RphxS (Toojinda et al. 2000), Mlf (Schönfeld et al. 1996), QMl-7H (Backes et al. 2003), YrpstY1 (Sui et al. 2010), QTLR178 (Silvar et al. 2012), Rpsx (Castro et al. 2003) were mapped to the consensus map generated by Aghnoum et al. 2010. b Mildew resist-ance QTLs QTLR79, QTLR126, and QTLR180 (Silvar et al. 2012) were mapped to the consensus map generated by (Szucs et al. 2009). c Mapping of Rps6 in the AxR-Pst F2 population. Anchoring of genes is based on the closest linked marker shown in the same color
840 Theor Appl Genet (2016) 129:831–843
1 3
(barley grass) and as such its interaction with barley can be considered an intermediate host pathosystem according to terminology proposed by Bettgenhaeuser et al. (2014). The observation of nonhost resistance specificities in this region also coincides with barley powdery mildew resist-ance including the resistance gene Mlf (Mildew resistance locus f) and several QTLs (Backes et al. 2003; Schönfeld et al. 1996; Silvar et al. 2012). The association of resist-ance at the Rps6 locus to multiple diseases extends to Mag-naporthe oryzae, wherein a minor effect QTL maps to the region (Inukai et al. 2006). It is unclear whether these spe-cificities are due to linkage rather than pleiotropy based on current map positions as the large mapping intervals observed in most of the studies hinders our ability to draw conclusions from this data. Additional fine mapping and cloning of the genes underlying resistance will be required to conclusively define whether colocalization of these loci are due to genetic linkage or pleiotropy.
Gene nomenclature in barley requires a three-letter sym-bol followed by a unique number to designate the locus and a unique number or letter to define the allele (Lun-dqvist et al. 1997). As the nature of the formae speciales divide for P. striiformis is unclear, it is proposed to use Rps to identify resistance to P. striiformis f. sp. tritici (Jerome Franckowiak, personal communication). Rps6.i is proposed as the allele symbol for resistance contributed in Abed Binder 12 to Pst at the Rps6 locus. Aside from Psh, Pst isolate specificity is currently unknown for Rps6, therefore either (1) the generation of near-isogenic lines or (2) gene isolation and characterization in resistant germplasm will elucidate the whether this gene has two alleles [i.e. resistant and susceptible such as Rpg1; (Brueggeman et al. 2002)] or multiple alleles with varying degrees of recognition speci-ficity [such as Mla; (Seeholzer et al. 2010)]. Identification of transformable Pst susceptible barley accessions will be a critical priority and will be aided by the recently developed SusPtrit × Golden Promise doubled-haploid population (Yeo et al. 2014). SusPtrit has been shown to be suscepti-ble to several host and nonhost pathogens of barley, includ-ing Psh, Pst, P. striiformis f. sp. bromi, and several other nonhost rust fungi (Jafary et al. 2006; Niks et al. 2013), whereas the two-row elite malting cultivar Golden Promise is well known for its ability to be transformed using Agro-bacterium tumefaciens (Lü et al. 2015). Thus, it should be possible to select accessions that will maintain the suscep-tibility to Pst and the transformability of Golden Promise.
The success of map-based cloning is determined by the chromosomal location and physical structure of the region encompassing the gene of interest. In barley, as with many other plants, recombination rates vary along the length of the chromosome and significantly reduced rates of recom-bination can be observed in pericentromeric regions when compared to distal regions (IBGSC 2012). Recombination
is essential for map-based gene isolation as it influences the degree to which the locus can be delimited using recombination breakpoints and the ratio of physical to genetic distance in the region. This was highlighted during the anchoring of the barley BAC-based physical map when it was estimated that the ratio of physical to genetic dis-tance in pericentromeric regions was 10–500 times greater than in distal regions (IBGSC 2012). In the case of Rps6, the chromosomal localization was favorable for mapping due to its distal location on the long arm of chromosome 7H. Indeed, we observed recombination that was sufficient to delimit Rps6 to a 0.1 cM region. Based on our current markers, we have been able to anchor Rps6 to FPC 320 (IBGSC 2012).
The BACs spanning the Rps6 interval, K_361382 to K_37596, have not been sequenced, but signatures of NLRs exist in the region. A critical recombinant sug-gests that the NLR present on contig 37596 is not Rps6, whereas the NLR (MLOC_65262) on contig 49978 cosegregating with Rps6 has 16 non-synonymous dif-ferences between Abed Binder 12 and Russell (data not shown). In the parallel, fine-mapping of Rps6 by Li et al. (2015) found resistance uncoupled from MLOC_65262, with the identification of several recombinants. NLR loci are known to be highly complex with multiple para-logs that can vary between allele based on copy number and sequence variation (Michelmore and Meyers 1998). At this time it is difficult to comprehensively iden-tify all candidate genes in the region due to the lack of sequence information in the region. Efforts are underway to sequence the minimal tiling path of barley in Morex; this will aid additional marker development for the clos-ing of the physical interval harboring Rps6 and the iden-tification of candidate genes in the region. Future work will include the development of an Abed Binder 12 BAC library and haplotype analysis of Rps6 in domesticated and wild barley.
Map-based cloning of Rps6 will open up the possibil-ity of transferring a nonhost resistance gene into the host species, wheat. Whether Rps6 would retain functionality in wheat is unclear and would depend upon the species con-servation of the mechanisms underlying immunity. Wheat and barley diverged from a common ancestor approxi-mately 11.6 million years ago (Wicker et al. 2009). Encour-agingly, alleles of Mla from barley retained functionality when transferred to an immuno-compromised Arabidop-sis thaliana accession (Maekawa et al. 2012). This dem-onstrated conservation of the underlying immune systems in two species that evolutionarily separated ~200 million ago. Cloning and intergenera transfer of Rps6 and other genes contributing to the intermediate host status of barley will establish if barley may be used as a resource for the improvement of wheat.

841Theor Appl Genet (2016) 129:831–843
1 3
Author contribution statement Conceived and designed the experiments: AMD JNF MJM. Performed the experi-ments: AMD JNF MG PG AH MJM. Analyzed the data: AMD JNF MJM. Wrote the paper: AMD MJM.
Acknowledgments The authors enjoyed the collegial interactions with Jorge Dubcovsky, Daolin Fu, and their team on the parallel fine mapping of Rps6. We greatly appreciated the maintenance and laboratory oversight provided by Inmaculada Hernández-Pinzón. We are indebted to Brande Wulff, Eric Ward, Rosemary Bayles, Jona-than Jones, and Cristobal Uauy for useful discussions and advice. We appreciate the translations performed by Jan Bettgenaeuser of the seminal work of Straib. In addition, we greatly appreciated the technical advice from Nick Bird and Nikolai Adamski on KASP genotyping. Genotyping using the barley oligonucleotide assay was performed by the University of California, Los Angeles Southern Cal-ifornia Genotyping Consortium, KASP genotyping performed by the John Innes Genotyping Facility, and Sequenom genotyping performed by the Iowa State University Genomics Technologies Facility.
Compliance with ethical standards
Funding This work was funded by a long-term fellowship to MJM through the Human Frontiers Science Program Fellowship (LT000218/2011), core funding from the Gatsby Foundation, and additional support from the 2Blades Foundation.
Conflict of interest The authors declare that they have no conflict of interest.
Open Access This article is distributed under the terms of the Creative Commons Attribution 4.0 International License (http://crea-tivecommons.org/licenses/by/4.0/), which permits unrestricted use, distribution, and reproduction in any medium, provided you give appropriate credit to the original author(s) and the source, provide a link to the Creative Commons license, and indicate if changes were made.
References
Aghnoum R, Marcel TC, Johrde A, Pecchioni N, Schweizer P, Niks RE (2010) Basal host resistance of barley to powdery mildew: connecting quantitative trait Loci and candidate genes. Mol Plant Microbe Interact 23:91–102
Ariyadasa R, Mascher M, Nussbaumer T, Schulte D, Frenkel Z, Pour-sarebani N, Zhou R, Steuernagel B, Gundlach H, Taudien S, Felder M, Platzer M, Himmelbach A, Schmutzer T, Hedley PE, Muehlbauer GJ, Scholz U, Korol A, Mayer KF, Waugh R, Lan-gridge P, Graner A, Stein N (2014) A sequence-ready physical map of barley anchored genetically by two million single-nucle-otide polymorphisms. Plant Physiol 164:412–423
Backes G, Madsen LH, Jaiser H, Stougaard J, Herz M, Mohler V, Jahoor A (2003) Localisation of genes for resistance against Blumeria graminis f.sp. hordei and Puccinia graminis in a cross between a barley cultivar and a wild barley (Hordeum vulgare ssp. spontaneum) line. Theor Appl Genet 106:353–362
Basten CJ, Weir BS, Zeng Z-B (1994) Zmap–a QTL cartographer. In: Smith C, Gavora JS, Benkel B, Chesnais J, Fairfull W, Gib-son JP, Kennedy BW, Burnside EB (eds) Proceedings of the 5th World Congress on Genetics Applied to Livestock Production: Computing Strategies and Software, Guelph, Ontario, Canada
Bettgenhaeuser J, Gilbert B, Ayliffe M, Moscou MJ (2014) Nonhost resistance to rust pathogens—a continuation of continua. Front Plant Sci 5:664
Borhan MH, Gunn N, Cooper A, Gulden S, Tor M, Rimmer SR, Holub EB (2008) WRR4 encodes a TIR-NB-LRR protein that confers broad-spectrum white rust resistance in Arabidopsis thaliana to four physiological races of Albugo candida. Mol Plant Microbe Interact 21:757–768
Brueggeman R, Rostoks N, Kudrna D, Kilian A, Han F, Chen J, Druka A, Steffenson B, Kleinhofs A (2002) The barley stem rust-resist-ance gene Rpg1 is a novel disease-resistance gene with homol-ogy to receptor kinases. Proc Natl Acad Sci USA 99:9328–9333
Bushnell WR, Roelfs AP (1984) The cereal rusts: origins, specificity, structure, and physiology. Academic Press, New York
Castro AJ, Capettini F, Corey AE, Filichkina T, Hayes PM, Kleinhofs A, Kudrna D, Richardson K, Sandoval-Islas S, Rossi C, Vivar H (2003) Mapping and pyramiding of qualitative and quantitative resistance to stripe rust in barley. Theor Appl Genet 107:922–930
Cesari S, Thilliez G, Ribot C, Chalvon V, Michel C, Jauneau A, Rivas S, Alaux L, Kanzaki H, Okuyama Y, Morel JB, Fournier E, Thar-reau D, Terauchi R, Kroj T (2013) The rice resistance protein pair RGA4/RGA5 recognizes the Magnaporthe oryzae effec-tors AVR-Pia and AVR1-CO39 by direct binding. Plant Cell 25:1463–1481
Close TJ, Bhat PR, Lonardi S, Wu Y, Rostoks N, Ramsay L, Druka A, Stein N, Svensson JT, Wanamaker S, Bozdag S, Roose ML, Moscou MJ, Chao S, Varshney RK, Szucs P, Sato K, Hayes PM, Matthews DE, Kleinhofs A, Muehlbauer GJ, DeYoung J, Marshall DF, Madishetty K, Fenton RD, Condamine P, Graner A, Waugh R (2009) Development and implementation of high-throughput SNP genotyping in barley. BMC Genom 10:582
de Vienne DM, Refregier G, Lopez-Villavicencio M, Tellier A, Hood ME, Giraud T (2013) Cospeciation vs host-shift speciation: methods for testing, evidence from natural associations and rela-tion to coevolution. New Phytol 198:347–385
Derevnina L, Zhou M, Singh D, Wellings CR, Park RF (2015) The genetic basis of resistance to barley grass yellow rust (Puccinia striiformis f. sp. pseudo-hordei) in Australian barley cultivars. Theor Appl Genet 128:187–197
Doerge RW, Churchill GA (1996) Permutation tests for multiple loci affecting a quantitative character. Genetics 142:285–294
Eriksson J (1894) Ueber die Specialisirung des Parasitismus bei den Getreiderostpilzen. Berichte der Deutschen Botanischen Gesells-chaft 12:292–331
Heath MC (2000) Nonhost resistance and nonspecific plant defenses. Curr Opin Plant Biol 3:315–319
IBGSC (2012) A physical, genetic and functional sequence assembly of the barley genome. Nature 491:711–716
Inukai T, Vales MI, Hori K, Sato K, Hayes PM (2006) RMo1 confers blast resistance in barley and is located within the complex of resistance genes containing Mla, a powdery mildew resistance gene. Mol Plant Microbe Interact 19:1034–1041
Jafary H, Szabo LJ, Niks RE (2006) Innate nonhost immunity in bar-ley to different heterologous rust fungi is controlled by sets of resistance genes with different and overlapping specificities. Mol Plant Microbe Interact 19:1207–1279
Jafary H, Albertazzi G, Marcel TC, Niks RE (2008) High diversity of genes for nonhost resistance of barley to heterologous rust fungi. Genetics 178:2327–2339
Kearse M, Moir R, Wilson A, Stones-Havas S, Cheung M, Stur-rock S, Buxton S, Cooper A, Markowitz S, Duran C, Thierer T, Ashton B, Meintjes P, Drummond A (2012) Geneious Basic: an integrated and extendable desktop software platform for the organization and analysis of sequence data. Bioinformatics 28:1647–1649
842 Theor Appl Genet (2016) 129:831–843
1 3
Kota R, Varshney RK, Prasad M, Zhang H, Stein N, Graner A (2008) EST-derived single nucleotide polymorphism markers for assem-bling genetic and physical maps of the barley genome. Funct Integr Genom 8:223–233
Krattinger S, Wicker T, Keller B (2009) Map-based cloning of genes in Triticeae (wheat and barley). In: Muehlbauer GJ, Feuillet C (eds) Genetics and Genomics of the Triticeae. Springer, US, pp 337–357
Lauter N, Moscou MJ, Habiger J, Moose SP (2008) Quantitative genetic dissection of shoot architecture traits in maize: towards a functional genomics approach. Plant Genome 1:99–110
Li K, Hegarty J, Zhang C, Wan A, Wu J, Guedira GLB, Chen X, Muñoz-Amatriaín M, Fu D, Dubcovsky J (2015) Fine mapping of barley locus Rps6 conferring resistance to wheat stripe rust. Theor Appl Genet (Submitted)
Lü B, Wu J, Fu D (2015) Constructing the barley model for genetic transformation in Triticeae. J Integr Agric 14:453–468
Lundqvist U, Franckowiak JD, Konishi T (1997) New and revised names for barley genes. Barley Genet Newsl 26:4–8
Maekawa T, Kracher B, Vernaldi S, Loren Ver, van Themaat E, Schulze-Lefert P (2012) Conservation of NLR-triggered immunity across plant lineages. Proc Natl Acad Sci USA 109:20119–20123
Mascher M, Muehlbauer GJ, Rokhsar DS, Chapman J, Schmutz J, Barry K, Muñoz-Amatriaín M, Close TJ, Wise RP, Schulman AH, Himmelbach A, Mayer KF, Scholz U, Poland JA, Stein N, Waugh R (2013) Anchoring and ordering NGS contig assemblies by population sequencing (POPSEQ). Plant J 76:718–727
Mayer KF, Martis M, Hedley PE, Šimková H, Liu H, Morris JA, Steu-ernagel B, Taudien S, Roessner S, Gundlach H, Kubaláková M, Suchánková P, Murat F, Felder M, Nussbaumer T, Graner A, Salse J, Endo T, Sakai H, Tanaka T, Itoh T, Sato K, Platzer M, Matsumoto T, Scholz U, Doležel J, Waugh R, Stein N (2011) Unlocking the barley genome by chromosomal and comparative genomics. Plant Cell 23:1249–1263
McNeal FH, Smith EP, Konzak CF, Tate WS, Russell TS (1971) A uniform code and data processing system for cereal grains. US Dep Agric ARS 34:42
Michelmore RW, Meyers BC (1998) Clusters of resistance genes in plants evolve by divergent selection and a birth-and-death pro-cess. Genome Res 8:1113–1130
Moscou MJ, Lauter N, Steffenson B, Wise RP (2011) Quantitative and qualitative stem rust resistance factors in barley are associ-ated with transcriptional suppression of defense regulons. PLoS Genet 7:e1002208
Muñoz-Amatriaín M, Moscou MJ, Bhat PR, Svensson JT, Bartoš J, Suchánková P, Šimková H, Endo TR, Fenton RD, Lonardi S, Castillo AM, Chao S, Cistué L, Cuesta-Marcos A, Forrest KL, Hayden MJ, Hayes PM, Horsley RD, Makoto K, Moody D, Sato K, Vallés MP, Wulff BHH, Muehlbauer GJ, Doležel J, Close TJ (2011) An improved consensus linkage map of barley based on flow-sorted chromosomes and single nucleotide polymorphism markers. Plant Genome 4:238–249
Mysore KS, Ryu CM (2004) Nonhost resistance: how much do we know? Trends Plant Sci 9:97–104
Niks RE, Marcel TC (2009) Nonhost and basal resistance: how to explain specificity? New Phytol 182:817–828
Niks RE, van Heyzen S, Szabo LJ, Alemu SK (2013) Host status of barley to Puccinia coronata from couch grass and P. striiformis from wheat and brome. Eur J Plant Pathol 136:393–405
Nover I, Scholz F (1969) Genetische Untersuchungen zur Resistenz der Gerste gegen Gelbrost (Puccinia striiformis West.). Theor Appl Genet 39:150–155
Nürnberger T, Lipka V (2005) Non-host resistance in plants: new insights into an old phenomenon. Mol Plant Pathol 6:335–345
Pahalawatta V, Chen X (2005) Inheritance and molecular mapping of barley genes conferring resistance to wheat stripe rust. Phytopa-thology 95:884–889
Potokina E, Druka A, Luo Z, Wise R, Waugh R, Kearsey M (2008) Gene expression quantitative trait locus analysis of 16,000 barley genes reveals a complex pattern of genome-wide transcriptional regulation. Plant J 53:90–101
Ramirez-Gonzalez RH, Uauy C, Caccamo M (2015) PolyMarker: a fast polyploid primer design pipeline. Bioinformatics 31:2038–2039
Schönfeld M, Ragni A, Fischbeck G, Jahoor A (1996) RFLP mapping of three new loci for resistance genes to powdery mildew (Ery-siphe graminis f. sp. hordei) in barley. Theor Appl Genet 93:48–56
Schulte D, Close TJ, Graner A, Langridge P, Matsumoto T, Mue-hlbauer G, Sato K, Schulman AH, Waugh R, Wise RP, Stein N (2009) The international barley sequencing consortium—at the threshold of efficient access to the barley genome. Plant Physiol 149:142–147
Schulze-Lefert P, Panstruga R (2011) A molecular evolutionary con-cept connecting nonhost resistance, pathogen host range, and pathogen speciation. Trends Plant Sci 16:117–125
Seeholzer S, Tsuchimatsu T, Jordan T, Bieri S, Pajonk S, Yang W, Jahoor A, Shimizu KK, Keller B, Schulze-Lefert P (2010) Diver-sity at the Mla powdery mildew resistance locus from cultivated barley reveals sites of positive selection. Mol Plant Microbe Interact 23:497–509
Silvar C, Perovic D, Scholz U, Casas AM, Igartua E, Ordon F (2012) Fine mapping and comparative genomics integration of two quantitative trait loci controlling resistance to powdery mildew in a Spanish barley landrace. Theor Appl Genet 124:49–62
Stewart CN Jr, Via LE (1993) A rapid CTAB DNA isolation technique useful for RAPD fingerprinting and other PCR applications. Bio-techniques 14:748–750
Straib W (1937) Untersuchungen über das Vorkommen physiologis-cher Rassen des Gelbrostes (Puccinia glumarum) in den Jahren 1935/36 und über die Aggressivität einiger neuer Formen auf Getreide und Gräsern. Arb Biol Reichsanst 22:91–119
Sui X, He Z, Lu Y, Wang Z, Xia X (2010) Molecular mapping of a non-host resistance gene YrpstY1 in barley (Hordeum vulgare L.) for resistance to wheat stripe rust. Hereditas 147:176–182
Szucs P, Blake V, Bhat PR, Chao S, Close TJ, Cuesta-Marcos A, Mue-hlbauer G, Ramsay L, Waugh R, Hayes PM (2009) An integrated resource for barley linkage map and malting quality QTL align-ment. Plant Genome 2:134–140
Thordal-Christensen H (2003) Fresh insights into processes of non-host resistance. Curr Opin Plant Biol 6:351–357
Toojinda T, Broers LH, Chen XM, Hayes PM, Kleinhofs A, Korte J, Kudrna D, Leung H, Line RF, Powell W, Ramsay L, Vivar H, Waugh R (2000) Mapping quantitative and qualitative disease resistance genes in a doubled haploid population of barley (Hor-deum vulgare). Theor Appl Genet 101:580–589
Tosa Y (1989) Evidence on wheat for gene-for-gene relationship between formae speciales of Eryisphe graminis and genera of gramineous plants. Genome 32:918–924
Tosa Y (1992) A model for the evolution of formae speciales and races. Phytopathology 82:728–730
Ullrich SE (2010) Significance, adaptation, production, and trade of Barley. Wiley-Blackwell, pp 3–13
van Ooijen JW (2006) JoinMap® 4, software for the calculation of genetic linkage maps in experimental populations. Kyazma B V, Wageningen
Wellings CR, Burdon JJ, McIntosh RA, Wallwork H, Raman H, Murray GM (2000) A new variant of Puccinia striiformis caus-ing stripe rust on barley and wild Hordeum species in Australia. Plant Pathol 49:803
843Theor Appl Genet (2016) 129:831–843
1 3
Wicker T, Krattinger SG, Lagudah ES, Komatsuda T, Pourkheiran-dish M, Matsumoto T, Cloutier S, Reiser L, Kanamori H, Sato K, Perovic D, Stein N, Keller B (2009) Analysis of intraspecies diversity in wheat and barley genomes identifies breakpoints of ancient haplotypes and provides insight into the structure of diploid and hexaploid triticeae gene pools. Plant Physiol 149:258–270
Yeo FK, Hensel G, Vozábová T, Martin-Sanz A, Marcel TC, Kumlehn J, Niks RE (2014) Golden SusPtrit: a genetically well transform-able barley line for studies on the resistance to rust fungi. Theor Appl Genet 127:325–337