isolation, sensitivity patterns and molecular
TRANSCRIPT

ISOLATION, SENSITIVITY PATTERNS AND MOLECULAR CHARACTERISATION
OF BACTERIAL ISOLATES FROM INFECTED DIABETIC FOOT ULCERS IN
PATIENTS AT KENYATTA NATIONAL HOSPITAL.
DR. DANIEL MUNYAMBU MUTONGA
W64/81850/2015
A DISSERTATION PROPOSAL SUBMITTED IN PARTIAL FULFILLMENT FOR
MASTER OF SCIENCE DEGREE – TROPICAL AND INFECTIOUS DISEASES AT
THE UNIVERSITY OF NAIROBI, INSTITUTE OF TROPICAL AND INFECTIOUS
DISEASES.
UNIVERSITY OF NAIROBI 2018

ii
DECLARATION
I declare that this is my original work and has not, to the best of my knowledge, been presented
anywhere else.
This thesis is submitted in partial fulfillment for the award of Master of Science Degree in
Tropical and Infectious Diseases at the University of Nairobi.
Dr. Daniel Munyambu Mutonga, BSc (Med Physio), MBChB
W64/81850/2015
Signed …………………………………………………………….Date…………………..
SUPERVISORS
1. Dr. Marianne Mureithi
KAVI- Institute of Clinical Research,
Department of Medical Microbiology, University of Nairobi.
Signed …………………………………………………………Date………………….
2. Prof. Fredrick C. F. Otieno
Associate Professor of Internal Medicine/Endocrinologist Specialist Diabetologist,
Department of Clinical Medicine and Therapeutics, University of Nairobi
Signed………………………………………………………Date…………………..
3. Dr. Nancy Ngugi
Consultant Physician & Endocrinologist,
Kenyatta National Hospital.
Signed………………………………………………………Date…………………..
FUNDING
This study received partial funding from KNH Research and Programs Department (KNH Study
Registration Number: P769/10/2016)

iii
DEDICATION
To Hellen and Richard, my parents, Jack and Peninah, my siblings, and Jane, my best friend.

iv
ACKNOWLEDGEMENTS
I would like to acknowledge my supervisors Dr. Marianne Mureithi, Prof. C. F. Otieno and Dr.
Nancy Ngugi for their invaluable guidance throughout this project. Their leadership, mentorship,
candor and accessibility, has made this one of my proudest moments in my career.
My sincere appreciation goes to Beatrice, Winnie and Francis for their technical assistance in the
KNH Microbiology Laboratory. Kayaire and Warui of Biozeq Kenya Laboratories deserve
recognition for taking time to understand my work and assist me at the Molecular Laboratory
housed at KAVI-ICR.
I am grateful to the nurses and matrons in the Medical Wards and the Diabetes and Endocrinology
Outpatient Clinic at KNH for their warmth and concern on my successful completion of this
project. Mr. Idaka spent time tutoring me on proper foot examination, pathology of wound
infection and wound healing, and proper techniques of wound debridement. Sister Muroki
regularly called me whenever a new client who fit our inclusion criteria was admitted to her ward.
In the same breath, special recognition goes to all the patients and their relatives for their time and
patience during the whole process. This work is for you!
I am thankful to Mwenda, Wahinya and other staff of the KNH Research and Programs Department
for making sure the project logistics ran smoothly. I am also grateful to Wycliffe Ayieko from the
School of Public Health (UoN) for his technical assistance in Statistical Analysis.
I am highly indebted to the staff at the Institute of Tropical and Infectious Diseases (UoN). Dr.
David Odongo in particular was not only my Course Coordinator but he also took time out of class
to find out on my progress. Dr. Julius Oyugi and Prof. Machoki offered direction from the proposal
stage, grant application process and throughout the entire process.
And to God, for his strength, wisdom and favor.
v
TABLE OF CONTENTS
DEDICATION ............................................................................................................................... iii
ACKNOWLEDGEMENTS ........................................................................................................... iv
TABLE OF CONTENTS ................................................................................................................ v
LIST OF TABLES ....................................................................................................................... viii
LIST OF CHARTS ......................................................................................................................... x
LIST OF FIGURES ........................................................................................................................ x
ABBREVIATIONS ....................................................................................................................... xi
DEFINITION OF TERMS .......................................................................................................... xiii
ABSTRACT .................................................................................................................................. xv
1. Chapter One: Introduction .................................................................................................. 1
1.1. Background ......................................................................................................................... 1
2. Chapter Two: Literature Review ........................................................................................ 4
2.1. Epidemiology .............................................................................................................4
2.2. Risk factors for developing DFUs and DFIs ..............................................................4
2.3. Clinical features and diagnosis of DFUs ...................................................................5
2.4. Causative bacteria in DFIs .........................................................................................7
2.5. Antimicrobial Management and Resistance ..............................................................8
2.6. MRSA ........................................................................................................................9
2.7. Molecular Tests ........................................................................................................10
2.8. Surgical Management ..............................................................................................11
2.9. Supportive Management and new Therapies ...........................................................13
2.10. Prevention ................................................................................................................14
3. Chapter Three: Research Definition ................................................................................. 16
3.1. Study justification ....................................................................................................16
3.2. Study Questions .......................................................................................................17
3.3. Objectives ................................................................................................................17
3.3.1. Broad Objectives ..........................................................................................17
3.3.2. Specific Objectives ......................................................................................17
3.4. Research Methodology ............................................................................................17
3.4.1. Study site ......................................................................................................17

vi
3.4.2 Study design ................................................................................................18
3.4.3 Sampling method .........................................................................................18
3.4.4 Study population ...........................................................................................18
3.4.5 Inclusion criteria ..........................................................................................18
3.4.6 Exclusion criteria .........................................................................................18
3.4.7 Sample size determination ...........................................................................19
3.4.8 Enrollment....................................................................................................19
3.4.9 Patient characteristics...................................................................................19
3.4.10 Clinical Outcomes ........................................................................................20
4. Chapter Four: Materials and Methods .............................................................................. 21
4.1. List of Materials and Equipment.................................................................................21
4.2. Wound site preparation and sample collection ...........................................................22
4.3. Standards of care clinical tests ....................................................................................22
4.4 Microbiological Procedures .........................................................................................24
4.5 Identification and Antimicrobial Sensitivity Tests using the VITEK ® 2 Machine ....25
4.6 Molecular tests .............................................................................................................26
4.6.1 Procedure of DNA extraction & RT-PCR Amplification ................................26
4.6.2 Interpreting the RT-PCR results .....................................................................28
4.7 Data collection procedures ...........................................................................................28
4.8 Data management and analysis ....................................................................................29
4.9 Ethical consideration ....................................................................................................29
4.10 Study limitations ........................................................................................................30
4.11 Dissemination plans ...................................................................................................30
4.12 Study Risks ................................................................................................................30
5. Chapter Five: Results ........................................................................................................ 31
5.1 Flow Chart ...................................................................................................................31
5.2 Patients’ socio-demographic characteristics ................................................................32
5.3 Clinico-Laboratory Findings ........................................................................................33
5.4 Antimicrobial tests .......................................................................................................37
5.4.1 Distribution of bacterial pathogens isolated from DFUs ................................37
5.4.2 Antibiotic Resistance Patterns ........................................................................37
5.4.2.1 Resistance patterns for Gram-positive bacteria ..........................................37
vii
5.4.2.2 Resistance patterns for Gram-negative bacteria .........................................37
5.4.2.3 Distribution of Multiple-Drug Resistant organisms isolated ......................40
5.5 Molecular Tests ............................................................................................................41
5.6 Clinical Outcomes of DFUs .........................................................................................47
6. Chapter Six: Discussion .................................................................................................... 49
6.1 Prevalence and socio-demographic factors ..................................................................49
6.2 Clinical characteristics and Patient Outcomes .............................................................50
6.3 Microbiology results ....................................................................................................52
6.4 Molecular .....................................................................................................................54
6.5 Wound Healing ............................................................................................................55
6.6 STUDY LIMITATIONS ............................................................................................ 55
6.7 CONCLUSION ........................................................................................................... 56
6.8 RECOMMENDATIONS ............................................................................................ 57
7. Chapter Seven: References/Bibliography ......................................................................... 58
8. Chapter Eight: Appendix .................................................................................................. 68
8.1 Informed Consent Form (English Version) ................................................................ 68
8.2 Informed Consent form (Swahili version) ...................................................................71
8.3 Data Collection Form ...................................................................................................73
8.4 Time Plan .....................................................................................................................80
8.5 Flow Chart ...................................................................................................................81
8.6 Budget ..........................................................................................................................82
8.6.1 BUDGET FORM ............................................................................................82
8.6.2 BUDGET JUSTIFICATION ..........................................................................83
8.7 Additional Antimicrobial Sensitivity Results ..............................................................84
8.8 Images of Diabetic Foot ...............................................................................................91
8.9 Ethical Approvals.........................................................................................................93

viii
LIST OF TABLES
Table 1: Wagner Stages ...................................................................................................................2
Table 2: Prevalence of resistant bacteria isolated from DFUs ......................................................9
Table 4.1: Table of list of materials and equipment used for laboratory tests ..............................21
Table 4.2: Summary of Laboratory principles tests ......................................................................23
Table 4.3: Nucleotide sequence of Probes, Forward and Reverse Primers for S. aureus ............27
Table 4.4: Formula for the calculation of DNA concentration ....................................................28
Table 5.1: Sociodemographic characteristics of study participants ............................................32
Table 5.2: Clinical characteristics and laboratory parameters of study patients ........................33
Table 5.3: Clinical characteristics of diabetic foot ulcers of the study patients ..........................36
Table 5.4: Resistance patterns for Gram-positive organisms ......................................................39
Table 5.5: Resistance patterns for Gram-negative organisms .....................................................40
Table 5.6: PCR Results for S. aureus and MRSA DNA compared with culture results for Gram-
positive bacteria ............................................................................................................................43
Table 5.7: PCR Results for S. aureus and MRSA DNA compared with culture results for culture-
negative growths ...........................................................................................................................43
Table 5.8: PCR Results for S. aureus and MRSA DNA compared with culture results for Gram-
negative bacteria ...........................................................................................................................44
Table 5.9: Frequency and proportion of organisms based on culture and RT-PCR results for S.
aureus ............................................................................................................................................45
Table 5.10: Frequency and proportion of organisms based on culture and RT-PCR results for
MRSA .............................................................................................................................................45
Table 5.11: 2X2 Table for comparison of culture versus RT-PCR for S. aureus .........................46
Table 5.12: 2X2 Table for comparison of culture versus RT-PCR for MRSA ..............................46
Table 5.13 Intervals between 1st interview and 2nd Interview ........................................................47
Table 5.14: Clinical Outcomes of DFUs for the study patients .....................................................47
Table 6.1: Frequency of Bacteria Isolated from DFUs .................................................................84
Table 6.2: Gram Positive Antibiotic Sensitivity Results ................................................................85
Table 6.3: Gram Negative Antibiotic Sensitivity Results ...............................................................86
Table 6.4: Comparing means for MDROs and none-MDROs ......................................................87
Table 6.5: Comparing means across Outcome Groups .................................................................87

ix
Table 6.6: Comparing Proportions across Outcome Groups ........................................................88
Table 6.7: Wagner Staging Type RIGHT FOOT and selected parameters ..................................88
Table 6.8: Wagner Staging Type LEFT FOOT and selected parameters .....................................89
Table 6.9: RIGHT FOOT – Location of Foot Ulcer Groups .........................................................89
Table 6.10: LEFT FOOT – Location of Foot Ulcer Groups .........................................................90

x
LIST OF CHARTS
Chart 1: Flow chart of the Study ...................................................................................................31
Chart 2: Distribution of Gram-positive and Gram-negative isolated ..........................................38
Chart 3: Distribution of MDROs among Gram-positive and Gram-negative Organisms ............41
Chart 4: Quantitation data for Cycling A ......................................................................................42
Chart 5: Distribution of clinical outcomes of DFUs for the study patients .................................48
LIST OF FIGURES
Figure 1: VITEK ® Machine ........................................................................................................26
Figure 2: DNA Extraction and PCR amplification Equipment ....................................................27
Figure 3: Neuropathic Ulcer .........................................................................................................91
Figure 4: Forefoot Superficial Ulcer ............................................................................................91
Figure 5: Stage 1 diabetic foot ulcer .............................................................................................91
Figure 6: Advanced Stage 5 diabetic foot ulcer ...........................................................................91
Figure 7: Ischaemic superficial diabetic foot ulcer .......................................................................91
Figure 8: Advanced Stage 4 diabetic foot ulcer ...........................................................................92
Figure 9: Stage 2 diabetic foot ulcer .............................................................................................92
Figure 10: Stage 2 diabetic foot ulcer ..........................................................................................92
xi
ABBREVIATIONS
ABI – Ankle-Brachial Index
ALT – Alanine Aminotransferase
AST – Aspartate Aminotransferase
BMI – Body Mass Index
CFU/g – Colony Forming Units Per Gram
CLED – Cysteine-, Lactose- And Electrolyte-Deficient
CLSI – Clinical and Laboratory Standards Institute
CONS – Coagulase-Negative Staphylococci
D. Bil – Direct Bilirubin
DFI – Diabetic Foot Infection
DFU – Diabetic Foot Ulcer
DM – Diabetes Mellitus
DNA – Deoxyribonucleic Acid
ERC – Ethics and Review Committee
HbA1c – Glycated Hemoglobin
HDL-C – High-Density Lipoprotein Cholesterol
Hz – Hertz
IDF – International Diabetes Federation
IFCC – International Federation of Clinical Chemistry Principles
IQR – Interquartile Range
KAVI-ICR – Kenya AIDS Vaccine Initiative Institute of Clinical Research
KNH - Kenyatta National Hospital
LDL-C – Low-Density Lipoprotein Cholesterol
LFTs – Liver Function Tests
MDROs – Multidrug-Resistant Organisms
MIC – Minimum Inhibitory Concentration
MRSA – Methicillin Resistant Staphylococcus Aureus
NCDs – Non-communicable Diseases
NDS – Neurological Disability Score
NFGNB – Non-Lactose Fermenting Gram-Negative Bacteria

xii
OHA – Oral Anti-Hyperglycaemic Agents
PCR – Polymerase Chain Reaction
RBS – Random Blood Sugar
RNA – Ribonucleic Acid
rRNA – ribosomal RNA
RT-PCR – Real Time PCR
SD – Standard Deviation
sp. – species
T. Bil – Total Bilirubin
T. Chol – Total Cholesterol
T1DM – Type 1 Diabetes Mellitus
T2DM – Type 2 Diabetes Mellitus
TGs – Triglycerides
TMPSMX – Trimethoprim-Sulphamethoxazole (Co-trimoxazole)
UECs – Urea, electrolytes and creatinine
UNITID- University of Nairobi Institute of Tropical and Infectious Diseases
UoN – University of Nairobi
USD - United States Dollar

xiii
DEFINITION OF TERMS
Aerobe - a microbe that requires the presence of oxygen for life and growth
Anaerobe - a microbe that is able to live and grow in the absence of free oxygen
Antibiotic - a substance produced by or derived from a living microorganism or artificially
synthesized that destroys or inhibits the growth of other microorganism
Bacteria - microorganisms that lack distinct nuclear membrane and have a cell wall of unique
composition
Clean wound – A sterile wound, with no bacteria and no inflammation
Colonized wound – A wound where bacteria are present, attached to the surface and replicating.
Contaminated wound – A wound with bacteria or foreign material but the bacteria are not
attached or replicating.
Cross-sectional design – Cross- sectional studies are simple in design and are aimed at finding
out the prevalence of a phenomenon, problem, attitude or issue by taking a snap-shot or cross-
section of the population.
Culture - population of microorganism usually bacteria grown in solid or liquid laboratory
medium
Diabetes mellitus - a group of metabolic diseases characterized by hyperglycemia resulting from
defects in insulin secretion, insulin action, or both
Diabetic foot infection - an infection occurring below the ankle in diabetic patients
Diabetic foot ulcer - breach on the normal skin occurring as induration, ulceration or change of
colour on the foot for duration equal to or more than two weeks. It is associated with neuropathy
and/or peripheral arterial disease of the lower limb in a patient with diabetes
Etiology - the cause of a specific disease
Gram-negative organism - bacteria lose the crystal violet stain (and take the color of the red
counterstain) in Gram's method of staining. This is characteristic of bacteria that have a cell wall
composed of a thin layer of a particular substance called peptidoglycan.
Gram-positive organism - retain the color of the crystal violet stain in the Gram stain. This is
characteristic of bacteria that have a cell wall composed of a thick layer of peptidologlycan.
Incidence - is a measurement of the number of new individuals who contract a disease during a
particular period of time.

xiv
Infected wound – In an infected wound, the bacteria are invasive and they interfere with healing.
The body also mounts an immune response.
Pathogen - a microorganism such as bacterium that infects an animal or man and produces disease
Prevalence - a measurement of all individuals affected by the disease at a particular time
Sample - a representative portion of the target population
Sensitivity test disc – a disc infiltrated with antibiotic which is placed in a plate inoculated with
bacteria to test the zone of inhibition of growth
Target population - collection of all subjects of interest
Type 1 diabetes mellitus - the cause is an absolute deficiency of insulin secretion
Type 2 diabetes mellitus - the cause is a combination of resistance to insulin action and an
inadequate compensatory insulin secretory response.

xv
ABSTRACT
BACKGROUND: The burden of diabetes mellitus is increasing in resource-poor settings and this
is associated with a rise in diabetic complications. Diabetic foot ulcers (DFUs) often lead to
hospital admissions, amputations and deaths among diabetic patients. In Kenya, there is a lack of
up-to-date information on microbial isolates from diabetic foot ulcers and no mention of utilization
of molecular techniques.
Significance: Identifying bacteria and their sensitivity patterns in infected diabetic foot ulcers
could lead to appropriate antibiotic prescriptions, curb antimicrobial drug resistance, and better
clinical outcomes thereby reducing health expenditure.
OBJECTIVE: To isolate bacteria and determine their antibiotic sensitivity patterns in patients
with infected diabetic foot ulcers in a clinical setting using culture-based and molecular techniques
while also investigating their risk factors and clinical outcomes.
METHODS
The study had a cross-sectional design and recruited 84 adult inpatients and outpatients at Kenyatta
National Hospital over 12 months with any type of diabetes mellitus and having active foot ulcers.
Consecutive sampling was used to enroll participants and informed consent taken. History and
physical examinations findings were recorded through a structured questionnaire. The most recent
blood tests were also recorded. Samples were collected from the centre of the wound and taken to
the laboratory. One part of the sample was used for microbiological tests, and the other for RT-
PCR was stored at −80 °C. On Day 1, specimens were inoculated on culture media and incubated
in aerobic conditions. On Day 2, the most predominant colony was isolated and identified using
standard biochemical tests and then VITEK ® 2 machine was utilized for further identification and
antibiotic sensitivity. For 51 samples, DNA extraction was performed using kits from Qiagen
Hilden, Germany. Staphylococcus aureus DNA, Methicillin-resistant S. aureus (MRSA) DNA and
positive control were identified through real-time PCR. Thereafter, clinical outcomes for patients
with foot ulcers were retrieved from the patients’ medical records.
RESULTS: Majority (68%) were inpatients. The mean age was 60.30 + 12.88 years with 68%
living in urban areas and 60% having minimal or no formal education. Eight percent (8%) were
newly-diagnosed with diabetes mellitus (DM). The median (IQR) duration of DM was 6.5 (1.25,
12.5) years. A majority (96%) had type II DM. Forty-five percent (45%) were on insulin only,

xvi
18% on oral drugs only and 32% on a combination of both. The median (IQR) random blood sugar
was 9.60 (5.32, 15.45) mmol/L and glycated haemoglobin was 8.80 (7.17 to 9.92)%. A majority
of the patients had good lipid profile, 85% with desirable total cholesterol and 70% having ideal
low-density lipoproteins. Eighty-three percent (83%) had one or multiple comorbidities. The
median duration of the DFU was 8 (4, 16) weeks. Eighty swabs (94%) were culture-positive; 29%
were Gram-positive and 65% were Gram-negative. The organisms isolated were Staphylococcus
aureus (16%), Escherichia coli (15%), Proteus mirabilis (11%), Klebsiella pneumonia (7%) and
Pseudomonas aeruginosa (7%). The bacterial isolates showed resistance to commonly used
antibiotics such as ampicillin, amoxicillin, cefazolin, cefepime, ceftazidime, cefotaxime,
cefuroxime, clindamycin, co-trimoxazole (TMPSMX), erythromycin, piperacillin-tazobactam,
and tetracycline. More than half (62%) of the S. aureus isolated and 40% of the Gram-negative
bacteria were MDROs. MRSA were not identified using culture methods but were identified using
PCR. PCR was also more sensitive than culture-based methods to identify S. aureus. There was a
high mortality rate (11%) among patients with DFUs.
CONCLUSION: There are poor outcomes for patients with DFUs in this setting such as poor
wound healing, high recurrence rates, increased lower limb amputations and mortality compared
to previous studies. Almost all DFUs were infected, with Gram-negative bacteria being the most
common. In order of frequency, S. aureus, E. coli, P. mirabilis, K. pneumonia, P. aeruginosa were
the most common isolated species. There was a high prevalence of nosocomial bacteria. In this
study, the bacteria isolated showed high resistance to commonly used antibiotics with Gram-
negative bacteria showing higher resistance patterns.
Recommendations: Patients with DFUs should have microbial swabs for culture and sensitivity
performed routinely for correct management and antibiotic stewardship. PCR is an effective way
of species identification, and in particular, RT-PCR for S. aureus and MRSA should be considered
for patients with adequate healthcare resources. The high prevalence of poor outcomes for patients
with DFUs warrants the need to investigate bio-psychosocial risk factors.

1
1. Chapter One: Introduction
1.1. Background
The global prevalence of diabetes mellitus (DM) is 8.8% among people aged 20 - 79 years
and is expected to rise to 10.4% by 2030 1. By 2030, diabetes will have affected 188 million adults
in their fourth and fifth decades and four-fifths of these patients will come from resource-poor
countries 2. Within the African region, it is estimated that 3.2% of the adult population (14.2
million) have diabetes 1,2. This is expected to rise to 3.7% adults (34.2 million) by 2040 1,2 . In
addition, at least 1 to 3 out of every 20 deaths globally of adults between 20 and 79 years results
from diabetes in the years 2010 and 2015 respectively 1,2.
Like most resource-poor countries, Kenya is in the transition from communicable to non-
communicable diseases (NCDs) or what you might call a ‘double burden of disease’ where both
infectious and NCDs are prevalent 3–5. This arises from globalization and urbanization. Currently,
the prevalence of diabetes in Kenya is 2.8% within the 20 - 79 years' age group 2. The Ministry of
Public Health in Kenya reports that over 50% of all hospital admissions and over 55% of all deaths
are due to NCDs 6. In Isiolo, northern Kenya, the prevalence of diabetes was 16% over a two-day
free medical screening 6. Therefore, the burden of diabetes in resource-poor countries is increasing
and it is often associated with diabetic complications such as heart disease, stroke, nephropathy,
retinopathy, peripheral neuropathy and foot complications.
Foot complications result in 25 - 50% of all hospital admissions in patients with diabetes
7–10. Foot ulcers are one of the most common diabetic complications and often lead to amputations
11. In the United Kingdom, a fifth of all admissions of patients with DM were due to diabetic foot
ulcers 12,13. Despite significant improvements in healthcare among patients with diabetes mellitus
in the UK, there are more pronounced emergency admission rates among poorer communities in
the UK 14. In a recent hospital-based study in the UK, 14 out of 98 admissions were diabetes-
related but only one was due to infected foot ulcer 15.
According to Alexidou and Doupis, Diabetic Foot Ulcer (DFU) is any foot with ulceration
and linked to neuropathy and/or peripheral vascular disease in a patient with DM 16. Other
publications define a DFU as an induration, ulceration or change of colour on the skin on a diabetic
patients’ foot for two weeks or more 17,18. There are three clinical forms of DFUs: neuropathic,
neuro-ischaemic and ischaemic ulcers. Foot ulcers are considered ischaemic when there is
peripheral arterial disease without neuropathy, neuropathic when there is neurological disability

2
but no obvious peripheral vascular disease and neuro-ischaemic if both neuropathy and peripheral
vascular disease are present 17,18. Wagner and colleagues classified foot ulcers into six stages 19
(Refer to Table 1 below).
Wagner Stage Definition
0 foot at risk; intact skin
1 superficial ulcer
2 deep ulcer with no bone involvement or abscess
3 deep ulcer with abscess or osteomyelitis (bone involvement visible on Xray)
4 localised gangrene e.g. toe, heel
5 gangrene of the entire foot
Table 1: Wagner staging. Staging based on physical examination of foot ulcer and other
investigations
Diabetic Foot Infection (DFI) refers to infection occurring below the ankle in diabetic
patients 20. Patients with DFU are often under frequent antibiotic treatment without any
investigations to confirm infection. This practice can lead to development of resistance. Treating
an uninfected wound with antibiotics has no value in infection prevention or improved wound
healing 21. There are limited antibiotic options for treating diabetic foot ulcers and thus, antibiotics
ought to be administered judiciously and only when necessary. This is because antibiotic resistance
is a key public health threat of the twenty-first century 22,23.
Patients with advanced foot ulcers often require minor or major surgery. The risk of
amputation is 15 – 46% higher in patients with DM compared to those without DM 24–26. In fact,
diabetic foot ulcer is the leading cause of lower limb amputations 26,27. More recently, reports state
that DFUs precede 84% of all lower limb amputations 28.
Global healthcare expenditure to treat and prevent diabetes and its complications is
estimated to add up to at least US Dollar (USD) 376 billion in 2010 and 673 billion in 2015 1,2.
Some studies estimate that diabetes takes up 11% of world’s total health expenditure 29. The
estimated costs of treating a DFU, whether a patient requires an amputation or not, range from
USD 18,000 to USD 34,000 in resource-rich countries 30. Recent estimates are much higher, with
the mean global health care cost being twice the cost of any other ulcer at USD 44,200 31. In
Tanzania, the costs are quite low and stand at USD 3,060 32. In Nigeria, the average costs of
successfully treating patients with DFU is USD 1,808 for Stage 4 ulcers, USD 1,104 for Stage 3

3
ulcers and 556 for Stage 2 ulcers 33. As noted from these costs, resource-poor settings that have an
increasing burden of diabetes partly due to the high number of cases and low resources available
for healthcare 18. Patients with diabetic foot ulcers require prolonged treatment, hospitalization and
home-based nursing care and they spend a significant amount of the family resources. Indirect
costs also arise from loss of work, loss of income, and premature death 7. This economic burden
is enormous considering the fact that type 2 diabetes (T2DM) affects the age group that is most
productive (34 to 64 years) 34. In Sudan, the total annual medical expenditure for people with
diabetes was USD 579 almost 4 times that of non-diabetic patients 29. In this study, diabetic
patients had more adverse social effects such as being away from work or school.
Understanding the profile of microbes in DFUs in Kenya will be helpful in prescribing the
right antibiotics, curbing antibiotic resistance, reducing hospital stay, preventing major surgical
interventions, and thereby saving resources.
4
2. Chapter Two: Literature Review
2.1. Epidemiology
The annual prevalence of diabetic foot problems among diabetic patients is approximately
2.5% 35. It is estimated that 10% - 15% of diabetic patients will develop diabetic foot ulcer at some
point in their life 10,36. The prevalence of foot ulcers varies from 4% - 10% in patients with diabetes
mellitus in the United States and this translates to an annual population-based incidence of 1.0% -
4.1%, and a lifetime incidence of 24.3% - 25% 30,37. The prevalence of active foot ulceration
therefore ranges from approximately 1% in Western countries to more than 11% in African
countries 36. In the United Kingdom, the prevalence of DFU ranges from 7.0% - 7.4% 13,38. In
Denmark, the estimated prevalence of foot ulcers in the region of Southern Denmark is 7% 39. In
Netherlands, the prevalence of DFU is much higher at 20.4% 40 while in Iran the prevalence is
20% 41.
In a recent, meta-analysis of 55 studies from 19 African countries, the overall prevalence
of DFU was 13% 42. In Africa's most populous country, Nigeria, the prevalence of DFU is 11.7%
- 19.1% 43,44. In South Africa, the prevalence of DFU is 5.4% while in Malawi it is 4.5% 45,46.
Within East Africa, the prevalence of DFUs among diabetic patients in Tanzania is 3.2% - 15%
whilst in Ethiopia, the prevalence is 13.6% – 14.8% 18,47–49. In Sudan, the prevalence of DFI is
12.7% 50. At Kikuyu Mission Hospital in Kenya, 29.2% of diabetic patients had foot complications
51. Nyamu and colleagues found the overall prevalence of DFUs among diabetic patients to be
4.6% at Kenyatta National Hospital (KNH) 17. The prevalence of DFUs among inpatients in this
study was higher (11.4%).
2.2. Risk factors for developing DFUs and DFIs
The risk factors of developing DFUs in Kenya are well known and have already been
reported. In Kenya, Karugu listed the following to be risk factors for developing DFUs: limited
awareness among patients and clinicians on foot care, few podiatrists in the public sector, walking
bare footed, wrong footwear, poor foot care and alternative medicine practices 34. In a randomized
control study in Nyeri, Central Kenya, the risk factors for diabetic foot ulcers included poor
glycemic control, blood pressure higher than 130/80 mmHg, poor drug adherence, poor nail care
and calluses 52. From this study, protective factors included wearing appropriate shoes, examining
feet regularly and following a prescribed diet and exercise plan. In males, no fungal infections
were protective while in females, having appropriate foot care education was helpful. In a cross-

5
sectional study at KNH, poor glucose control, elevated diastolic blood pressure, poor lipid profile,
infection and poor self-care were identified as risk factors for DFUs 17.
In Ethiopia, DFU was associated with rural residence, T2DM, increased weight, poor foot
self-care, and neuropathy 49. In Sudan, longer duration of DM and urban residence were significant
risk factors 50. In another study using a new screening tool, 35.5% of participants had at least one
risk factor for developing DFU 53. In Tanzania, polyneuropathy and insulin treatment were risk
factors for DFU48. In the US, kidney disease has been associated with more incidences of DFU. In
a cohort study comparing patients on dialysis and those with just DFU, there were more foot-
related admissions in patients with renal failure compared to just having foot ulcers alone 37. In
addition, previous DFU, previous amputation and poor vision are high risk factors for DFU 30.
2.3. Clinical features and diagnosis of DFUs
DFU is often undiagnosed because patients fail to examine their feet. Secondly, patients
may have already developed peripheral neuropathy and even if they notice the ulcer, they do not
feel any pain and do not tell their doctors about this 54. Lastly, clinicians may omit to ask or
examine for the diabetic foot due to the pressure of the large number of patients they see in the
clinic. Patients therefore present late with DFUs. For instance, in Chad, there was a one-month
delay in presentation after onset of the ulcer 55. In Western Sudan, 74% of patients presented with
Wagner stage 4 ulcers 56. In Libya, Wagner's stage 3 ulcers were the most prevalent (31%),
followed by stage 2 (25%) 57. In a recent study in Tanzania, the average duration of ulcer at
presentation was 18.34 weeks 18. For those patients with DFUs, the average duration of DM was
8.2 years but a sizeable proportion (27.9%) were newly-diagnosed with DM. In this Tanzanian
study, 10.3% had a previous ulcer while 4.4% had a previous amputation. According to Chalya
and colleagues, the forefoot was the most affected anatomical site (60.3%) 18. In Nigeria, over 50%
of patients presented with DFUs after 3 weeks of onset 58.
In Kenya, the major type of DFUs are neuropathic ulcers (47.5%) followed by neuro-
ischaemic (30.5%) and then ischaemic ulcers (18%) 17. Neuropathic ulcers were common in those
with poorer glycaemic control while ischaemic ulcers were common in those with elevated total
cholesterol and elevated diastolic blood pressures. In this study, Wagner stage 2 was the most
common presentation (49.4%) while Wagner stage 4 had the highest neuropathic score (7.8/10)
and the longest duration (23.3 weeks). The mean duration of DM in this study was 7.98 years and
the duration of ulcers was 16.36 weeks at presentation 17. In this study, 8.5% of patients with DFUs

6
were newly diagnosed diabetic patients. In another Kenyan study, the duration of diabetes in
patients with foot ulcers was slightly lower at 5 years 59. In another study of diabetic patients
without foot ulcers at KNH, neuropathy was present in 42% of the participants 60. It is clear from
the above studies that there are country-to-country variations in the presentation of DFUs.
Full assessment of diabetic foot includes the skin, blood vessels, nerves, and
musculoskeletal system. The examination of the skin involves visual inspection of the legs and
feet and each toenail 16. Skin temperature should be cool and not elevated. Peripheral neuropathy
is assessed clinically using four tests: sensation to pain, vibration, pressure and deep tendon reflex
17. Vibration is tested by examining for vibration sense at the medial and lateral malleoli using a
128Hz tuning fork. Pressure sensation is tested using a monofilament that buckles at 10g on several
areas of the foot. Deep tendon reflexes are examined using a patella hammer on the Achilles tendon
and noted whether present, absent or present only after enhancement. Pain sensation is tested using
a pinprick on various sites of the foot. A neurological disability score (NDS) is then used to grade
the range of neuropathy by summing up the scores of the above tests. The prevalence of diabetic
polyneuropathy was 29.4% in Mulago Hospital, Uganda and was associated with a history of DFU
61. In a screening study in Nigeria, 37% of patients with diabetes had symptoms for diabetic
neuropathy 43. In Tanzania, 44% had peripheral neuropathy 48.
It is necessary to assess pulsation in the following vessels to rule out peripheral vascular
disease: dorsalis pedis, posterior tibial, popliteal, and superficial femoral arteries 16. Poor
circulation may result in poor wound healing and infection. The ankle–brachial index (ABI) is a
ratio of systolic blood pressures in the brachial arteries and posterior tibial or dorsalis pedis arteries
using a Doppler probe 16. Normal ABI values range from 1.0 to 1.3, since the pressure is higher
in the ankle than in the arm 16. In a screening study, 40% of patients with diabetes had symptoms
for peripheral arterial disease in Nigeria 43. In a study of patients with peripheral arterial disease
in South Africa, diabetics presented with more occlusive arterial disease in the tibioperineal
segment 62.
At presentation, about half of DFUs are clinically infected 63. DFIs are sometimes difficult
to define. Some specialists define infection in wounds as ≥ 105 colony forming units per gram
(CFU/g) 21,63,64. This threshold differentiates colonization from infection. Other authorities
recommend the use of clinical signs and symptoms of inflammation such redness, swelling, pain,
and warmth 21,63. However, due to the presence of peripheral neuropathy and ischaemia, these

7
cardinal signs of inflammation may be delayed or absent. In certain cases, infection in wounds
may be detected from ‘secondary’ findings such as a friable, poorly granulated, foul smelling or
slow healing wound 21,63. Waiting for systemic signs such as fever, chills, low blood pressure,
tachycardia, confusion, leukocytosis, elevated erythrocyte sedimentation rate, elevated C-reactive
protein or positive blood cultures may be too late 21,63. It is thought that in the diabetic patient,
inflammatory responses do not appear in time 65. Therefore, neither local nor systemic
inflammatory signs or symptoms, or even biological markers should be regarded as reliable for
diagnosing foot infection in diabetic individuals 63. Although not the least invasive, performing a
culture and sensitive test using a wound swab is the most reliable test to confirm infection in a
DFU. Imaging by X-rays is useful for deep ulcers to confirm osteomyelitis. Wound biopsies should
also be performed on non-healing chronic ulcers. Kaposi Sarcoma was once missed out in a HIV-
infected patient who was on treatment for diabetic foot ulcer 66.
2.4. Causative bacteria in DFIs
Staphylococcus aureus and beta-hemolytic Streptococci, both Gram-positive bacteria, are
the most common causes of skin infections 20,21,64,65,67–69. Some studies however show, that in
resource-poor countries, Gram-negative bacteria like Pseudomonas aeruginosa to be more
prevalent than S. aureus 21,65. In Brazil, Staphylococcus aureus, Staphylococcus saprophyticus,
Proteus sp., Staphylococcus epidermidis, Streptococcus agalactiae, Pseudomonas sp., Escherichia
coli, Streptococcus pneumoniae and Citrobacter sp. were the most common aerobic bacteria in
decreasing order 70. Other aerobic bacteria isolated from DFIs include Enterococcus sp., Coliform
bacteria and Acinetobacter baumannii 71. In India, S. aureus, E.coli, P. aeruginosa, coagulase-
negative Staphylococcus (CoNS), No growth and Klebsiella sp were the most common organisms
isolated in decreasing order 72. In another study in India, P. aeruginosa, Citrobacter sp., K. oxytoca
and Proteus sp. were the most common species isolated after S. aureus 69. In patients with chronic
wounds and previous antibiotic treatment, DFIs are usually polymicrobial and include both aerobic
Gram-negative bacilli and obligate anaerobic bacteria 65.
A study in Tanzania revealed that S. aureus was the most frequently isolated organism in
DFUs 18. In Nigeria, Staphylococcus and Pseudomonas species were found in diabetic foot ulcers
10. In one of the few Kenyan studies, S. aureus and E. coli was found to be the most common
organisms in 88% of the DFIs 59. Taken together, there is a gap in the current level of knowledge
on the types of microbes associated with DFIs in Kenya with the last published study on microbial

8
isolates in DFUs in Kenya, published more than 15 years ago. In this study, 73.2% of the DFUs
were infected while 26.8% were culture-negative under aerobic conditions 17. Although
unconfirmed, culture-negative ulcers in this study that were also in advanced Wagner stages could
possibly have had anaerobic pathogens. In Morocco, Gram-negative bacilli were isolated from
43% DFIs 73. The most commonly isolated bacteria in this recent study were Enterobacteriaceae,
S. aureus, Streptococcus sp., non-fermenting gram-negative bacilli (NFGNB), and Enterococcus
sp. Fungal infection have been implicated as a cause of DFIs in Kenya 74.
Biofilms, present in chronic wounds, are a defensive mechanism for bacteria against the
effects of antibiotics. Biofilms have been fronted to be one of the evidences of evolution in our
present times. The biofilm has many layers of bacteria surrounded by an envelope of proteins,
DNA, and polysaccharides 69. The bacteria communicate and work together to hinder entry of
antibiotics into this environment 65. It is thought that there is direct transfer of plasmids with
resistant genes from one cell to another. Bacteria in biofilm are slow-growing, encased around a
polysaccharide matrix and have altered extracellular milieu (pH and osmosis) preventing drug
action and adequate immune response (phagocytosis, complement system and antibody reaction).
Using Congo-red agar, biofilms were isolated in 46.3% DFUs which was almost half the
prevalence from previous studies 69. The bacteria that form biofilms in patients with DFUs are the
same bacteria that infect DFUs without biofilms. In order of decreasing frequency, S. aureus, P.
aeruginosa, Citrobacter sp., E. coli, Proteus sp. and K. oxytoca have been isolated in biofilms in
patients with DFUs 69. Management of biofilms include sharp debridement and application of anti-
biofilm substances such as xylitol, Ethylenediaminetetraacetic acid (EDTA), surfactants, and
Cadexomer Iodine (CI) 31.
Anaerobes rarely cause DFUs on their own but are present in deep-seated and chronic
infections 64. Samples for anaerobic culture must be collected in special conditions where a syringe
devoid of air and the sample and the specimen inoculated on culture medium and placed in the
anaerobic Gas cylinder immediately while at the bedside.
2.5. Antimicrobial Management and Resistance
DFUs are often treated with broad-spectrum oral antibiotics while severe infections require
parenteral treatment. Antibiotic resistance is an emerging problem globally. In Tanzania, antibiotic
sensitivity tests of bacterial isolates from DFUs revealed a high resistance of commonly used

9
antibiotics such as ampicillin, Augmentin, co-trimoxazole, tetracycline, penicillin, gentamycin,
erythromycin and oxacillin 18.
Moxifloxacin
resistance
B-
lactamases
producing
Carbapenemase
producing
Piperacillin-
tazobactam
resistance
Imipenem
resistance
Ciprofloxacin
resistance
Enterobacteriaceae
14.1 3.8 7.5 4.7 25.5
NFGNB
5.1 38.5 35.9 30.7 35.9
Streptococcus
4.9 4.9
Table 2: Prevalence of resistant bacteria. Proportion (%) isolated from DFUs and their antibiotic
resistance patterns (Adapted from literature) 73.
Previously, S. aureus was sensitive to Augmentin, amikacin, clindamycin and novobiocin
while Gram-negative bacilli were sensitive to amikacin, Augmentin, cefotaxime and piperacillin
59. In this earlier study, anaerobes were partly resistant to chloramphenicol, clindamycin and
lincomycin. Repeat bacterial cultures and sensitivity tests after a month of treatment were largely
positive; S. aureus persisted in 63 ulcers despite therapy, while E. coli persisted in 35 DFUs 59.
Although no new organisms were isolated from repeat cultures, no ulcer was completely sterile 59.
In Nigeria, Staphylococcus sp. and Pseudomonas sp. found in diabetic foot ulcers were
susceptible to quinolones 10. A hospital-based study in Benin, Nigeria showed that
fluoroquinolones such as ciprofloxacin and ofloxacin are more sensitive than chloramphenicol in
treating wounds colonized by Proteus sp. 75. In this study conducted among patients with burns
and not patients with DM, Proteus sp. was more common than Klebsiella sp. contrary to previous
literature. Proteus sp. and Klebsiella sp. have also been isolated in DFUs 18,70.
2.6. MRSA
Methicillin-resistant S. aureus (MRSA) was first observed in the early 1960s and has been
associated with increased hospital stay, healthcare costs and mortality 76. MRSA is often thought
to colonize the nose, rectum and even wounds. As an infection control measure, nasal swabs are
therefore collected from healthcare workers and inpatients in resource-rich countries for screening
of MRSA 77. Apart from hospitals, MRSA is also prevalent in the community. Once a patient is
identified to be having MRSA, the patient undergoes isolation, treatment and follow-up 76. Contacts

10
of the patient are also traced and tested. In Kenya, MRSA screening has been implemented as a
standard procedure in some private hospitals.
MRSA is common in DFUs 78. MRSA represented 4.7% of S. aureus isolated in a study
in Morocco 73. Studies have shown that MRSA are sensitive to amoxicillin-clavulanic acid,
cephalexin, cefuroxime, ciprofloxacin, clindamycin, doxycycline, levofloxacin, ofloxacin and
sparfloxacin 71. Among 41 patients in Brazil, nine cases of MRSA were resistant to cefoxitin, and
among 3 of these were vancomycin-resistant 70. Other resistant bacteria include glycopeptide-
intermediate S. aureus (GISA), vancomycin-resistant Enterococci (VRE), extended-spectrum β-
lactamase- (ESBL) or carbapenamase–producing Gram-negative bacilli and highly resistant
strains of P. aeruginosa 65.
2.7. Molecular Tests
Polymerase chain reaction (PCR) is a molecular method used to amplify a genomic region
of interest. The 16S ribosomal RNA (rRNA) gene is a highly conserved gene present in
prokaryotes and contains hypervariable regions that can be used for identifying specific bacterial
species 63,65. PCR amplifies a few pieces of DNA, of a specific sequence, into thousands or
millions of copies 79. The steps undertaken during PCR include denaturation, annealing, and
extension 80. Gel electrophoresis is performed after DNA amplification to estimate the size of the
amplified PCR product. It involves separation of DNA or RNA based on their molecular sizes
using an electric field. The gel is then visualised by trans-illumination under ultraviolet radiation.
Real-time PCR (RT-PCR) on the other hand, allows detection of the DNA or RNA as the
PCR is ongoing through production of fluorescence light during the reaction. DNA sequencing of
the 16S rRNA gene denote methods used to determine the order of nucleotides bases in DNA;
adenine, guanine, cytosine and thymine 81. Common methods of gene sequencing include Sanger
sequencing, pyrosequencing, nano sequencing and sequencing by synthesis. Other molecular
techniques for determining biodiversity include full ribosomal amplification, cloning and Sanger
sequencing (FRACS), partial ribosomal amplification with a gel band identification and Sanger
sequencing (PRADS), temperature gradient gel electrophoresis (TGGE), pyrosequencing, multi-
target PCRs and density gradient gel electrophoresis (DGGE) 63,65.
Compared to molecular techniques, culture methods underestimate the presence of S.
aureus when it is in low quantities. PCR also reveals more obligate anaerobes in wounds than
standard cultures. In a study on biopsies from 128 DFIs, RT-PCR resulted in a higher detection of

11
S. aureus, S. pyogenes, S. agalactiae, S. dysgalactiae subspecies equisimilis, and S. anginosus
group, compared to culture-methods 20.
In India, 4 out of 22 strains isolated were multidrug-resistant organisms (MDROs) 71. The
4 strains identified were S. aureus, Morganella morganii, A. baumannii and other Acinetobacter
sp. following PCR amplification of the 16S rRNA gene. A phylogenetic tree was later constructed
to analyze the evolutionary relationship between the isolates and closely related species. In a
genetic study in France, virulence in MRSA was associated with the absence of a ROSA-like gene,
which was otherwise found located in CC8- and CC5-Methicillin sensitive S. aureus (MSSA) 68.
MRSA is coded by the staphylococcal chromosome mec (SCCmec) which contains the mecA gene
76. This gene codes for the penicillin-binding protein (PBP) resulting in methicillin resistance 82.
In Africa, the only available study in literature to our knowledge, on utilization of
molecular techniques in DFIs is from Algeria 83. The study showed a high prevalence of MDROs
(58.5%) among DFIs in Algeria. There was 1.51 strains isolated per sample from 183 samples in
128 patients. A majority (54.9%) were aerobic Gram-negative bacilli. MDROs included 85.9% of
the S. aureus (MRSA), 83.8% of the K. pneumonia and 60% of the E. coli. ST239, the most
common MRSA strain globally was isolated from 82.2% of MRSA while PVL+ ST80 strain , the
cause of more than a third infections in Algeria, was found in 13.7% of the MRSA 83
However, PCR technology amplifies not only the living but also the dormant or dead
bacteria in a sample 63. Another disadvantage is that the 16S rRNA primers may neglect some
microbial populations such as viruses and fungi in chronic wounds 63. Lastly, due to high costs,
these techniques may not be applicable in the clinical setting. MRSA screening has mainly been
performed using nasal swabs in resource-rich countries. In a laboratory assessment, out of 88
wound swabs, 93.18% had similar culture and PCR results while 6.82% had differing PCR and
culture results 77. On use of enrichment media, 2 wound samples that were culture positive and
PCR negative were confirmed to be truly positive. Compared to culture-based methods using
VITEK ® 2 machine, Multiplex PCR had a sensitivity of 100% and a specificity of 94% in a
samples from 6 hospitals in Denmark 76.
2.8. Surgical Management
DFUs may require surgical management such as wound debridement or amputations. The
prevalence of diabetic amputations in Sub Saharan Africa varies but was generally thought to be
low especially in the rural areas 84,85. However, in a study in Cameroon, 78% of diabetic patients

12
had amputations while 22% had surgical debridement 86. In Ivory Coast, 46.9% below knee
amputations and 11.2% below elbow amputations were due to diabetes 87. In Nigeria, 21% of
amputations were secondary to diabetes foot gangrene and diabetes complications were the leading
cause of amputations in North-East of the country 88,89. In Tanzania, the proportion that required
surgery was 72.1% 18. Lower limb amputations in this Tanzanian study occurred in 56.7% of
diabetic patients with DFUs. This was similar to Pakistan where a majority of patients with DFUs
(81%) required surgery 90. In Sudan, diabetic foot is a major cause of hospitalization and lower
limb amputation (19.2%) 91. In Zimbabwe, the prevalence rate of diabetes related amputations
was 9% 92. Diabetic foot complications are the leading cause of lower limb amputation in Trinidad
and Caribbean islands where diabetes is common 93. In a recent meta-analysis of studies from 19
African countries, 15% of patients with DFU underwent major amputations 42.
Vascular amputations in Kenya range from 25% to 56% 94. In a Kenyan provincial hospital,
25% of all lower limb amputations were due to DFUs 94.Among the elderly at KNH, diabetes
accounted for 50% of all lower limb amputations 95. Of the total vascular amputations in this centre,
majority were however not related to diabetes. The prevalence of diabetic amputations was 17.5%
95. At Kikuyu Mission Hospital, a Level 4 referral centre in Kenya, 11.4% of amputations were
due to diabetic vasculopathy 96. Among 150 patients who underwent amputations at Tenwek
hospital, a rural referral health facility in Kenya, 48 (32%) had diabetes gangrene while 5.3% had
other dysvascular disease 97. Following surgery, 87.5% complicated with infection.
There are complications to surgery; in Tanzania for instance, 33.5% of diabetic foot surgery
resulted in complications with 18.8% being surgical site infections 18. In Benin, there was a
mortality rate of 14.3% following surgical management of diabetic foot 58. Even without
considering post-operative complications, DFUs are still a major cause of mortality among patients
with DM. In Cameroon, diabetic foot is the fifth leading cause of mortality in diabetic patients at
an outpatient centre 98. In Mombasa Kenya, the mortality rate as 13% among inpatients with DFU
and 28% for those who had amputations 99. In Sudan, mortality rate due to diabetic foot was 6.7%
91. In comparison, the overall mortality rate of patients with T2DM in Nigeria was 30.2 per 100 000
population, with a case fatality rate of 22.0% 100. In Libya, 34% of patients underwent amputations
(10% major and 24.2% minor) and the mortality rate was 2% 57. A pooled prevalence of mortality
from a review of studies of DFU in Africa was 14.2% 42. The mortality due to diabetic related
complications in Africa occurs in a much younger age-group than in other parts of the world 42.

13
Moreover, patients with diabetic foot complications have a much higher mortality rate than the
general population or even diabetic patients without foot complications 101.
2.9. Supportive Management and new Therapies
The following instructions should be given to the diabetic patients with or without a foot
ulcer 26:
Stop smoking
Regularly inspect the legs/feet for scratch marks, blisters et cetera
Wash the feet with warm water daily followed by careful drying between the toes
Apply emollients on dry skin
Cut toe nails regularly; however, see your doctor for calluses and ingrown toe nails
Inspect shoes regularly
Wear properly fitting shoes
See a chiropodist regularly
Avoid sandals and pointed shoes which may lead to foot trauma
Never walk bare footed
See your doctor immediately if there is any injury
Other than antibiotic treatment and surgical wound debridement, the following
management options for DFUs have been studied and are in current use:
Hyperbaric Oxygen – The affected leg is covered by a disposable polythene bag through
which oxygen is flowed (15Litres/min, six hours/day, four days/week). Pressure is
monitored and kept at 25 – 30mmHg (3.3 – 4.0kPa), using a Y tube connected to a
sphygmomanometer 26. Interspersed periods of tissue hypoxia help to stimulate formation
of granulation tissue, so that continuous oxygen therapy is not desirable.
Offloading pressure – Total contact casts (TCCs) are the gold standard for neuropathic
ulcers 102. A cheaper option is the Samadhan System which can be made using just one
foam sheet (4’ x 10’) and an adhesive applied until the foam is rolled into a cylindrical
shape.
Vacuum assisted negative pressure therapy – The technique entails placing an open cell
foam into the wound, sealing the site with an adhesive drape, and applying sub-atmospheric

14
pressure (125mmHg (16.7kPa) below ambient) that is transmitted to the wound in a
controlled manner 26. Blood flow levels increased about fourfold when 125mmHg sub-
atmospheric pressure is applied.
Antiseptic dressings – In one study, topical antimicrobial peptide (pexiganan) and
gentamicin-collagen sponge were comparable to systemic antibiotics 21. However,
antiseptic dressings were not shown to add any benefit.
Ghee and Honey – Twenty-nine cases of diabetic foot ulcers were treated using honey with
good outcomes 103. Ulcers healed on an average of 21 days and healthy granulation tissue
seen in 16 days.
Phototherapy – Animal and human studies have shown improved healing of wounds after
irradiation with light of different wavelengths 104. A pilot study in South Africa among
diabetic patients revealed positive outcomes of combining podiatry services with
phototherapy in a number of DFU cases 105.
Maggot therapy – The larvae of Chrysomya megacephala were used for over 40 days on
an elderly patient with a DM for 30 years and an advanced foot ulcer. The treatment led to
reduction in necrotic tissue, wound size and elimination of MDROs. Maggot therapy is
thought to reduce necrotic tissue due to the activity of the larvae’ mandibles and secretion
of lytic enzymes 106.
2.10. Prevention
DFU is a major problem that is associated with illiteracy, lack of health education and
dominance of wrong beliefs 107. Interestingly, 40% - 50% of DFUs can be prevented by education
and foot care 108. The impact of DFU is heaviest in resource poor settings due to lack of efficient
diagnosis, treatment and rehabilitation tools 18. Patients usually present late for instance in Chad,
Sudan, Nigeria and Tanzania as earlier mentioned. In Sudan, the awareness of diabetes
management is very low among adults 107. In this study, few patients were aware of prior screening
or could explain why they had diabetic complications such as retinopathy or nephropathy. Most
Kenyans are ignorant about diabetes mellitus and its prevention. In a local Kenyan study conducted
in 4 provinces with the highest rate of DM, only 27.2% were aware of DM and 41% undertook
preventive measures 109. In another study, 10% of the patients did not realize they had a DFU
meaning they did not regularly inspect their feet 17. In South Africa, only 22.2% of study
15
participants examined their feet but only when they experienced a problem 110. In Ghana, 51.5%
of patients rightly mentioned DFU as a complication of diabetes 111. In this study, gender, marital
status, education level, duration of DM and residence were significant factors to the level of
awareness. Despite a long hospital stay and a high amputation and mortality rate secondary to
diabetes foot, 60% of patients at a Teaching Hospital in Enugu state, Nigeria had no knowledge of
foot care despite having been educated on dietary control 112. In a study in Tanzania, 48% of
patients had received foot care education while 27.5% had ever had a foot examination by a doctor
48. There is therefore need for comprehensive education on foot care among DM patients.
Education of diabetic patients and their healthcare workers has been shown to improve
foot-care, leading to earlier detection of foot lesions and prevention of serious foot complications
113. Technology can bridge gaps where human resource is limited. However, patient monitoring of
DFUs in Denmark using telemedicine fared much worse than standard care 39. Although outcomes
such as healing and amputation did not differ in this study, there was a higher mortality rate among
those who were monitored using telemedicine compared to regular care. Therefore, the best way
of monitoring DFUs is by physician reviews at the outpatient department as often as is deemed
necessary. In developing countries, with limited number of doctors, there is a crucial role for
podiatrists and nurses specialized in foot ulcers. Community health workers can also be trained
on foot care and they increased the level of diabetic foot screening in a study in South Africa 114.

16
3. Chapter Three: Research Definition
3.1. Study justification
DFU is a chronic issue that contributes significantly to morbidity and mortality. From local
studies, DFUs last from 2 weeks to 6 years, with a mean duration of 6 months. DFUs can lead to
lower limb amputation which can be prevented by proper wound care.
Patients with DFUs are commonly treated with broad-spectrum antibiotics even when there
is no evidence of bacterial colonization through microbiological tests. When providers look at
necrotic, non-healing ulcers, they are usually prompted to use antibiotics. The chronicity of the
ulcers puts pressure on healthcare providers and patients to consume antibiotics. However, not all
DFUs are infected. Furthermore, if the wounds are actually colonized and drug sensitivity tests are
not performed, then the patient is subjected to inadequate or ineffective treatment.
There is a changing pattern in antibiotic use, susceptibility and resistance patterns.
Prolonged use of antibiotics, appropriate or inappropriate, for several months confers the
development of resistance patterns. Common pathogens are now resistant to old and new
antibiotics. Unfortunately, the development of resistance is not keeping up with the discovery of
new antibiotics. This calls for rational decision-making and antibiotic stewardship.
Pathogens in DFU are often poly-microbial in nature 57,70. Understanding the current
microbial profile in DFU and their sensitivity patterns will save scarce resources and prevent
antimicrobial resistance. There is a gap in this setting in up-to-date information on the current
antimicrobial isolates in DFUs and their sensitivities in Kenya. A previous study in KNH on
bacterial isolates in DFUs and the drug sensitivities was conducted in 1991 but a lot could have
changed since then 59. KNH is Kenya’s national, regional referral and teaching hospital. Based on
more recent studies on DFUs conducted elsewhere like in Tanzania, a neighbouring country, drug
resistance is an increasing problem 18. It is also important to understand the current risk factors for
DFUs in an effort to prevent their occurrence and for early detection.
No molecular characterisation of bacterial isolates in DFUs has been previously reported
in Sub-Saharan Africa. The only other study conducted in Africa was in Algeria 83. It showed a
high number of MDROs including MRSA species. Molecular studies are useful since they have
better sensitivities compared to culture-based methods. Furthermore, it is possible to detect
resistant genes as a marker of drug resistance using PCR. MRSA is predominant in DFUs and
could perhaps be the most likely resistant bacteria isolated from our Kenyan population 78.

17
3.2. Study Questions
1. What are the sociodemographic and clinical characteristics of patients with diabetic
foot ulcers?
2. What are the microbial pathogens in diabetic foot ulcers in Kenya and what are their
sensitivity patterns to commonly used antibiotics?
3. What is the molecular characterisation of drug-resistant Staphylococcus aureus
species found in diabetic foot ulcers in Kenya?
4. What is the outcome of diabetic foot ulcers; complete healing, non-healing, surgery
(minor or amputation), death or loss to follow-up?
3.3. Objectives
3.3.1. Broad Objectives
The aim of this study is to describe the microbial profile of pathogens in diabetic
foot ulcers and their antibiotic sensitivity patterns in patients with diabetes in KNH and to
describe their predisposing risk factors and clinical outcomes.
3.3.2. Specific Objectives
1. To describe the sociodemographic characteristics of diabetic patients with
diabetic foot ulcers at KNH.
2. To determine the microbial pathogens isolated from diabetic foot ulcers and
the bacterial drug sensitivity patterns in patients with diabetes at KNH using culture-based
methods
3. To determine the presence of Staphylococcus aureus DNA and drug-
resistant S. aureus (MRSA) DNA in diabetic foot ulcers in patients with diabetes at KNH
using RT-PCR.
4. To determine the clinical outcomes of diabetic foot ulcers of patients at
KNH and associate this with the antimicrobial sensitivity patterns.
3.4. Research Methodology
3.4.1. Study site
The study was conducted at KNH within the following departments:
● Medical Wards (7A, 7B, 7D, 8A, 8B, 8D)
● Diabetes and Endocrinology Outpatient Clinic
18
KNH is located in Nairobi, the politico-administrative and economic capital of
Kenya, approximately 2 km to the west of the city Centre. KNH is one of two Kenya’s
national referral hospitals and is also a teaching hospital for the University of Nairobi’s
College of Health Sciences. The Hospital has a bed capacity of 1800 and has 4800 members
of staff. It caters for over 80,000 in-patients and over 500,000 out-patients annually. About
75% of the patients treated as outpatients and inpatients are residents of Nairobi through
self-referral or referral from the public and private health facilities. KNH runs specialized
diabetes clinics managed by a team of specialist, endocrinologists, physicians, graduate
resident doctors, nutritionists, diabetic educators, medical assistants, and nurses.
Approximately 400 clients with DM are seen per week at the clinics which run daily
excluding weekends 115.
3.4.2 Study design
Cross-sectional study
3.4.3 Sampling method
Consecutive sampling
3.4.4 Study population
Adult diabetic patients with diabetic foot ulcers from medical inpatient departments
and diabetes outpatient clinic.
3.4.5 Inclusion criteria
i. Diabetic patients older than 18 years.
ii. Diabetic patients with active diabetic foot ulcers.
iii. Diabetes patients willing to provide written consent.
3.4.6 Exclusion criteria
i. Patients less than 18 years.
ii. Patients with HIV/AIDS, cancer patients and other known immunosuppressive states such
as steroid medication.
iii. Patients with superficial ulcers (to eliminate the possibility of isolating colonizing
bacteria).
iv. Patients not willing to give consent.

19
3.4.7 Sample size determination
Sample size was calculated using the (Daniel, 1999) formula;
𝑛 =𝑍2𝑥 𝑃(1 − 𝑃)
𝑑2
Where
𝑛 = Desired sample size
𝑍 = value from standard normal distribution corresponding to desired confidence
level (Z=1.96 for 95% CI)
𝑃 = expected true proportion (estimated at 0.046 according to a study at KNH 17..
𝑑 = desired precision (0.05)
𝑛 =1.962𝑥 0.046(1 − 0.0.046)
0.052= 67
Adjusting for a 10% non-response or drop-out rate,
𝑛 =67
1 − 0.1= 74
Although the target minimum sample size was 74 patients, we however enrolled 84
participants with DFUs.
3.4.8 Enrollment
Subjects were enrolled consecutively for a period of 12 months (5th September,
2017 to 15th August, 2018). Patient enrollment took place on Monday to Thursday and no
enrollment took place during weekends or Public Holidays.
3.4.9 Patient characteristics
Basic patient and clinical characteristics were collected as part of the routine history
taking and usual physical examinations. Patients’ basic characteristics included age, sex,
area of residence, and level of education. Clinical characteristics including presence of
comorbidities, smoking history, alcohol use, duration of diabetes, type of diabetes, duration
20
of DFU, diabetes medications used, previous history of healed foot ulcers, type of DFUs,
Wagner’s classification, and location of the lesion were recorded for each patient.
Peripheral neuropathy and peripheral vascular disease was also assessed. Height, weight
and blood pressure with the adult cuff standard technique was also measured. An X-ray
was ordered for patients with advanced ulcers to rule out osteomyelitis.
Equipment used for Patient Characteristics
Digital Blood pressure machine
Digital Thermometer
128Hz Tuning fork
Patella hammer
5.07 Semmes Weinstein Mono-filament 10g
Glucometer
X-ray machine
3.4.10 Clinical Outcomes
It was difficult to follow-up patients every four weeks due to the protracted nature of the
study and interruptions by doctors’ strikes. The outcomes of the diabetic foot ulcer were collected
for patients at the end of the study by reviewing through their medical records. Patients’ medicals
records were reviewed to retrieve the latest doctors’ notes from the diabetic clinic or the discharge
notes from the medical wards. The 1st interview was conducted on the day the patient was enrolled
into the study. The 2nd interview was based on the dated of the last clinical notes.
The interval between 1st enrollment and 2nd follow-up interview (in days) was calculated
and outcome of the DFU [complete healing, non-healing, surgical intervention (minor or
amputation) or mortality]. Permission was obtained from the KNH Medical Records department
to extract data from the hospital registries.

21
4. Chapter Four: Materials and Methods
4.1. List of Materials and Equipment
MATERIALS EQUIPMENT
Microbiology Tests
Sterile cotton swabs
Culture media (Sheep Blood Agar & CLED)
Glass slides and pencil
Reagents for Grams’ Stains and Biochemical tests (Lactose
Fermentation Catalase, Indole, Citrate test)
Normal saline in dispenser
Pipette and Test tubes
Turbidometer/turbidity check
ID cards and AST cards (P580 & GN83)
Safety cabinet
VITEK ® 2 machine (bioMe´rieux, Durham,
United States)
Bunsen burner
Wire loop
Microscope
Laboratory Tests
Blood collecting bottles (EDTA and serum)
Reagents by Dirui ®, Changchun, China for HbA1c, LFTs
(AST, ALT, T. Bil, D. Bil, Albumin ), Kidney function
tests ( electrolyte tests, Urea) and Lipid profile (TGs,
HDL-C, LDL-C)
Reagents by StanBio ® Laboratory, Texas, United States
for creatinine
DIRUI ® CS 4000 automated Clinical
Chemistry Analyzer (Istanbul, Turkey)
DNA extraction and PCR amplification
Dulbecco’s phosphate buffered solution (Sigma ® -
Aldrich, Steinheim, Germany)
Proteinase K
Wash (Buffer AW1) & Wash (Buffer AW2)
• DNA extraction kits (QIAamp DNA Blood Minikit
(250)/QIASymphony Kit (Qiagen Hilden, Germany)
Disposable powder-free gloves and laboratory coat
Disposable tips with aerosol barriers (100 or 200 μl) in
tube racks
Disposable polypropylene microtubes for PCR or PCR-
plate
•
• Safety cabinet for DNA extraction
• Water bath at 56oC
Automatic adjustable pipettes (from 5 to 20 μl
and from 20 to 200 μl).
Tube racks
Vortex mixer/desktop centrifuge
Refrigerator for 2–8 °C.
Deep Freezer (– 20°C to – 80°C)
PCR box/hood
Real Time PCR instrument (Rotor-Gene Q
(Hilden, Qiagen)
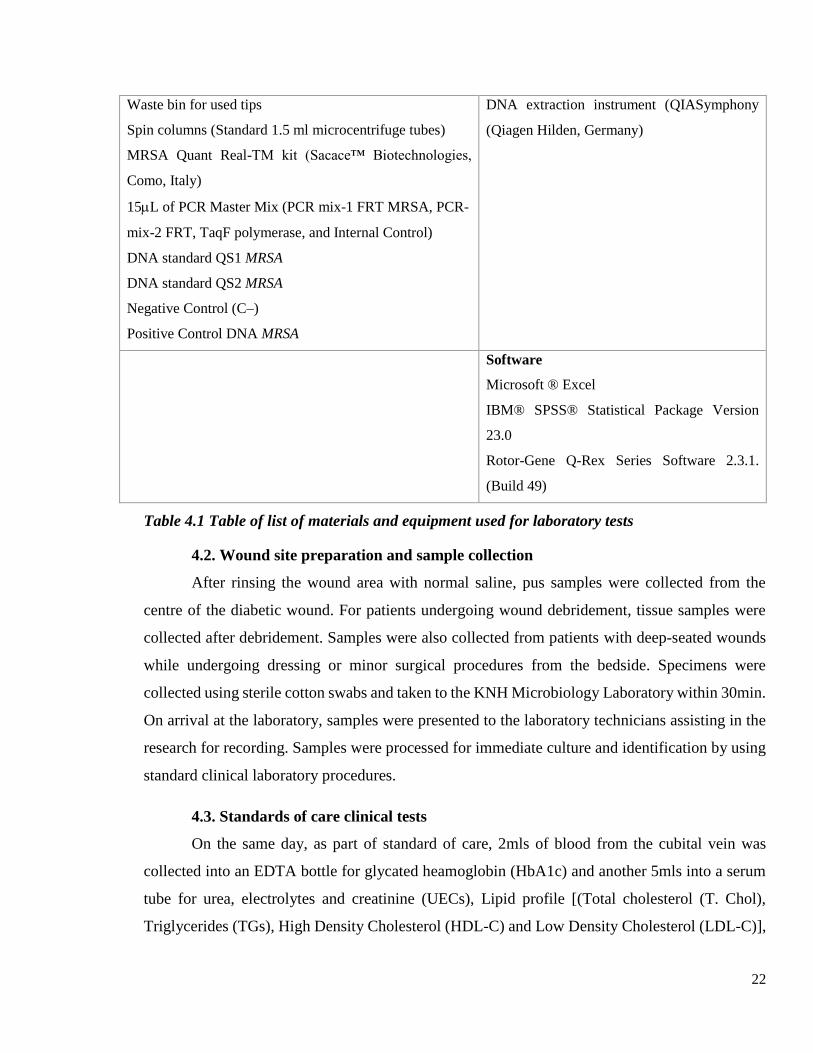
22
Waste bin for used tips
Spin columns (Standard 1.5 ml microcentrifuge tubes)
• MRSA Quant Real-TM kit (Sacace™ Biotechnologies,
Como, Italy)
15L of PCR Master Mix (PCR mix-1 FRT MRSA, PCR-
mix-2 FRT, TaqF polymerase, and Internal Control)
DNA standard QS1 MRSA
DNA standard QS2 MRSA
Negative Control (C–)
Positive Control DNA MRSA
• DNA extraction instrument (QIASymphony
(Qiagen Hilden, Germany)
•
Software
• Microsoft ® Excel
• IBM® SPSS® Statistical Package Version
23.0
• Rotor-Gene Q-Rex Series Software 2.3.1.
(Build 49)
Table 4.1 Table of list of materials and equipment used for laboratory tests
4.2. Wound site preparation and sample collection
After rinsing the wound area with normal saline, pus samples were collected from the
centre of the diabetic wound. For patients undergoing wound debridement, tissue samples were
collected after debridement. Samples were also collected from patients with deep-seated wounds
while undergoing dressing or minor surgical procedures from the bedside. Specimens were
collected using sterile cotton swabs and taken to the KNH Microbiology Laboratory within 30min.
On arrival at the laboratory, samples were presented to the laboratory technicians assisting in the
research for recording. Samples were processed for immediate culture and identification by using
standard clinical laboratory procedures.
4.3. Standards of care clinical tests
On the same day, as part of standard of care, 2mls of blood from the cubital vein was
collected into an EDTA bottle for glycated heamoglobin (HbA1c) and another 5mls into a serum
tube for urea, electrolytes and creatinine (UECs), Lipid profile [(Total cholesterol (T. Chol),
Triglycerides (TGs), High Density Cholesterol (HDL-C) and Low Density Cholesterol (LDL-C)],

23
and Liver function tests [(Alanine aminotransferase (ALT), Aspartate aminotransferase (AST),
Total Bilirubin (T. Bil), Direct Bilirubin (D. Bil) and Albumin (Alb)]. All these parameters were
analysed using a DIRUI ® CS 4000 automated Clinical Chemistry Analyzer (Istanbul, Turkey).
Laboratory Test Method Reference Range
HbA1c a Latex agglutination method
(antigen-antibody reaction)
Normal: < 7.0%
Elevated: >7.0%
Kidney Function Tests
Sodium ion selective method 135 – 145mmol/L
Potassium 3.5 – 5.1mmol/L
Chloride 96 – 106mmol/L
Urea enzyme Method 2.5 – 10.7mmol/L
Creatinine b modification of earlier method 116 62 – 106mmol/L
Lipid profile c
T. Chol enzyme method Desirable: < 5.2mmol/L
Borderline high: 5.2 – 6.2mmol/L
High > 6.2mmol/L
TGs oxidase method Desirable: <1.7mmol/L
Borderline High: 1.7 – 2.2
High: 2.3 – 5.6
Very High: >5.6
HDL-C direct method Poor: <1mmol/L
Better :1-1.5mmol/L
Best: > 1.5mmol/L
LDL-C Best for patients DM
<1.8mmol/L
High 1.8 – 4.9mmol/L
Very high > 4.9mmol/L
HDL/LDL Ratio calculation Bad >5
Not bad 3.5 – 5
Ideal < 3

24
Liver Function Tests
AST (U/L) IFCC d method
7 – 40U/L
ALT (U/L) 5 – 35U/L
T. Bil Diazo Salt Method e
3 – 22mol/L
D. Bil 0 – 5mol/L
Albumin (g/L)
dye-binding lysine (DBL) with
Bromocresol Green Method
35 – 50g/L
Table 4.2: Summary of principles and methods of Laboratory tests according to manufacturer’s
instructions. a, c, d, e=Reagents by Dirui ®, Changchun, China; a=Sample collected in anti-
coagulation bottle; b=Reagents by StanBio ® Laboratory, Texas, United States; c= The product
measured is quinone imine pigments; d= International Federation of Clinical Chemistry
Principles; e= The product measured is azo-bilirubin pigment.
The patients’ primary physician received a copy of the patients’ results for further
management. Results for these tests within the last 6 months were also considered relevant.
4.4 Microbiological Procedures
On Day 1, specimens were inoculated on Sheep Blood Agar and CLED Media under
aerobic conditions for the isolation of aerobic bacteria. Inoculation on culture media was
performed through the streak method after Cheesbrough 117. The plates were streaked aseptically
with a sterile wire-loop to form discrete colonies. The media plates were then incubated at 35°C –
37°C for 24- 48 hours under aerobic conditions. On Day 2, positive growth was noted as colonies
on the culture media. The most predominant colony was isolated using a sterile swab and specific
tests such as Gram stain, motility, oxidase test, catalase test, carbohydrate utilization tests, indole
formation and citrate tests were performed for preliminary identification. The VITEK ® 2 machine
(bioMe´rieux, Durham, United States) was then utilized for further identification (ID) and
antibiotic sensitivity tests (AST). The patients’ primary physician also received a copy of the
patients’ results for further management. The specimen swab was then stored at –20oC to −80 °C
for subsequent DNA isolation and PCR analysis.

25
4.5 Identification and Antimicrobial Sensitivity Tests using the VITEK ® 2 Machine
On Day 2, the most predominant colony from the culture plate was again isolated for further
tests. Pairs of ID and AST cards were set on the VITEK ® 2 cassete and scanned on the barcode
reader so that the patient details (study ID number, name, hospital number and medical
department) could be entered into the computer. The straws on the ID and AST cards were kept
facing away from the technician to avoid contamination.
For the ID cards, 3ml of normal saline was drawn from the dispenser onto plastic test tubes.
The most predominant colony was again picked from the culture plate and diluted with the saline.
Using a pipette, the solution was mixed up by draining in and out water. The test tube was then
placed onto a turbidometer/turbidity check and the machine turned on. The test tube was rotated
360o and the reading taken. The target MacFarland’s turbidity was 0.5 to 1.0 standards. If the
solution was of lower turbidity than 0.5 standards, more bacterial isolates were picked from the
culture plate and added into the solution. On the other hand, if the turbidity was higher than 1.0
standards, more saline was added to further dilute the solution while taking care not to contaminate
the dispenser.
For the AST cards, 3ml of normal saline was drawn from the dispenser. One millimetre (1
ml) of dissolved bacteria was transferred from the ID test tubes and added to the 3ml of the AST
test tubes to further dilute the mixture. The straws of the ID and AST cards were then dipped into
their respective test tubes and the cassette placed into the filling chamber of the VITEK ® 2
machine and the machine turned on. Once the filling of the cards was complete, the cassette was
moved from filling chamber VITEK ® 2 machine to the incubation chamber. The cards took
roughly 8hrs in the incubation chamber at a temperature of 35 - 37oC. Quality control was assured
through the use of positive controls of previous specimens stored in the laboratory.
Antimicrobial sensitivity tests were performed using a set 20 different types of antibiotics
for each sample. The types of antibiotics included beta-lactamase, cefoxitin screen, oxacillin,
benzylpenicillin, gentamicin, tobramycin, levofloxacin, moxifloxacin, inducible clindamycin
resistance, erythromycin, clindamycin, linezolid, teicoplanin, vancomycin, tetracycline,
trimethoprim/sulfamethoxazole, ampicillin, amoxicillin/clavulanic acid, ampicillin/sulbactam,
piperacillin/tazobactam, cefazolin, cefuroxime, cefuroxime axetil, cefotaxime, ceftazidime,
ceftriaxone, cefepime, aztreonam, meropenem, amikacin, ciprofoxacin, nitrofurantoin, cefoxitin,
tigecycline, fosfomycin, fusidic acid, mupirocin, and rifampicin.

26
The ID and AST results were delivered to the patients’ primary physician for further
management and another copy for the Research records. MDROs are bacteria that are resistant to
more than one or all classes of antibiotics. To be classified as MDROs, S. aureus was resistant to
methicillin, oxacillin or other penicillin and Gram-negative bacilli resistant to third generation
cephalosporins 83. All samples positive for were stored for further molecular testing.
Figure 1: VITEK ® 2 (a) Image of machine (b) Dilution of cultured pathogens (c) ID and AST
cassettes
4.6 Molecular tests
4.6.1 Procedure of DNA extraction & RT-PCR Amplification
Wound swabs were stored at – 70oC and transported to KAVI-ICR Molecular Laboratory
(located within KNH) at the end of the study. Dulbecco’s phosphate buffered solution (Sigma ® -
Aldrich, Steinheim, Germany) in quantities of 200L to 500L was added to the wound swabs to
dissolve the specimen. Both manual and automated methods were employed for DNA extraction.
Manual DNA extraction was performed using QIAMP DNA Blood Minikit (250), Qiagen Hilden,
Germany according to manufacturer’s instructions. Automated extraction was performed using
QIASymphony Kit (Qiagen, Hilden, Germany) according to manufacturer’s instructions.
Identification of resistant Staphylococccus sp was confirmed by screening for presence of mecA
gene using real-time PCR as previously described 118. PCR-amplification and real-time
hybridization was carried out using the MRSA Quant Real-TM kit (Sacace™ Biotechnologies,
Como, Italy). S. aureus DNA was detected in the FAM/Green channel, MRSA DNA (amplification
a c
b

27
of mecA fragment) was detected in the JOE/HEX/Yellow channel, and Internal Control (IC) DNA
was detected in the ROX/Orange channel using RotorGene Q (Hilden, Qiagen). Amplification was
set up in a 1.0µl PCR tubes containing 15L of PCR Master Mix (PCR mix-1 FRT MRSA, PCR-
mix-2 FRT, TaqF polymerase, and Internal Control). The sequences for actual primers and probes
used from the commercial from Sacace™ Biotechnologies, Como, Italy were proprietary
information and not revealed to the general public.and not revealed. However, the table below
shows a sample sequence of probles and primers for S. aureus used in a previous study 119.
S. aureus
FORWARD PRIMER 5’-ACGA CTARATAA ACGCTCAT TCG-3’
PROBE 5’-HEX-TGAAAT CTCATTACGT TGCATCGGA- BHQ1-3’
REVERSE PRIMER 5’-GACGGC TTTTACAT ACAGAA CACA-3’
Table 4.3: Nucleotide sequence of primers and probes for S. aureus from a Universal kit.
Adapted from Hopman and colleagues 119.
Quality control of the RT-PCR tests was further assured by running 4 additional samples
alongside the 51 specimen: Positive control, Negative control, DNA Quality Standard (QS) 1
MRSA and DNA QS2 MRSA. The reaction tubes were subjected to Thermal cycling reactions on
a Rotor-Gene Q machine (Qiagen, Hilden, Germany) comprising of 15 min at 95°C followed by 5
cycles of 15sec at 95°C, 30 sec at 60°C, and 15 sec at 72°C, and finally 40 cycles of 15 sec at
95°C, 30 sec at 55°C and 15 sec at 72°C for measuring fluorescent signal.
Figure 2: DNA extraction and PCR amplification Equipment. (a) QIASymphony for automatic
DNA extraction (b) Rotor-Gene Q (Qiagen, Germany)
a b

28
4.6.2 Interpreting the RT-PCR results
The PCR reports were generated using Rotor-Gene Q-Rex Series Software 2.3.1. (Build
49). The RT-PCR reports included sigmoid curves of the 3 channels: Green (S. aureus DNA),
Yellow (MRSA DNA) and Orange (Internal Control). The PCR cycle threshold (Ct) used was 20
since that was where the exponential curve of the Internal Control (Orange channel) begun.
Samples > 20 were considered positive for the DNA tested. However, comparisons between the
DNA concentrations in copies/ml of the Green and Yellow channel were used to definitely
determine if the RT-PCR test was truly positive. The Ct values and the Calculated concentration
(copies) reported by the software were used to calculate the concentration of DNA in copies/ml
using formulas in the manufacturer’s kit (Refer to Table 4.4 below). Finding the values of the DNA
concentrations of the QS1 and QS2 standards to be within the expected ranges 100,000 copies/ml
and 100 copies/ml respectively verified that the calculations of the DNA copies was accurate.
FAM (S.aureus) JOE ( mec A gene) ROX (IC) Result (copies/ml)
+ - +/- MSSA (= (А/С)*IC coefficient*N)
- + +/- MRCoNS (= (B/С)* IC coefficient*N)
+ + +/- MRSA (= (B/С)* IC coefficient *N)
A – concentration in FAM/Green channel
B – concentration in JOE/HEX/Yellow channel
C – concentration in ROX/Orange channel
N=100 / extraction volume, ml
IC coefficient is specific as provided in the kits manual
Table 4.4: Formula for the calculation of DNA concentration in copies/ml using
manufacturer’s instructions
4.7 Data collection procedures
Data was collected using a structured questionnaire designed by the investigators. The
questionnaire was pretested to a small sample of 10 diabetic patients to determine whether
respondents had any difficulty in understanding the questions or if any questions were ambiguous
or biased. A data collection form was used to collect results of the laboratory procedures. A UoN
Research Notebook was also used to record data collection processes, laboratory record keeping
and meetings with supervisors in line with good laboratory practices and university protocols.

29
4.8 Data management and analysis
Data was entered into a template Microsoft ® Excel spreadsheet designed by the study
statistician. Scalar variables were explored to check for normality. A null hypothesis that data was
not normally distributed was tested using Shapiro-Wilk normality test. When the p>0.05 the null
hypothesis for normality was rejected and the data shown to be normally distributed. Mean and
Standard deviation (SD) were used as measures for central tendencies for normally distributed data
while median and interquartile range (IQR) for data not normally distributed. Variables such as
age, time and, blood tests were classified using cut-off points by transforming the data and
recoding it into a nominal values. Nominal variables were analyzed as frequencies and
percentages. Data was also presented in the form of diagrams, tables, cross-tabulations, stem and
leaf plots, box plots, pie charts, bar charts and histograms where appropriate. Independent 2-tailed
t-test was used to compare means of continuous variables across gender with the Levene’s test
being used to determine equality of variances. Chi-square test was used to verify association of
categorical variables across gender with Pearson’s Chi-square test being used when 0 cells had
expected count less than 5 and Fischer’s Exact test when at least one cell had expected count less
than 5. Comparison across multiple groups (e.g. Clinical Outcomes) was performed using one-
way ANOVA. The results were considered statistically significant at p < 0.05. All analyses were
performed using IBM® SPSS® Statistical Package Version 23.0.
4.9 Ethical consideration
Approval was sought from the KNH-UoN Ethics and Research Committee; Approval
Number P769/10/2016. Permission to carry out the study was also sought from the Head of
Medical Department, KNH. For confidentiality the patient's, laboratory records and medical files
were confined to the KNH Wards, Laboratories and the Hospital’s Registries department. The
patients’ full name was not included in the data collection form. Instead, the patients’ initials and
a unique identifier number were recorded. Only the investigator had access to both the laboratory
records and medical files for the purposes of the study. Raw data in form of filled forms was filed
in a secure cabinet only accessible to the investigator. Soft copy data was stored in a password
protected computer.

30
4.10 Study limitations
We only enrolled patients in the medical wards and diabetic clinic into the study. This was
a limitation to the study because patients with diabetes are also routinely treated and admitted to
other departments of the hospital. However, patients with DFU are mostly found in the medical
units.
We recruited fewer patients per day than expected. This was due to the seasonality of cases
in the clinic. Similar patients are usually seen at the clinic for a couple of months before they are
discharged following wound healing or closure and then another batch of new patients is recruited
to the clinic. There was also a strike of healthcare workers at KNH and other hospitals leading to
fewer patients seeking care at the study site. KNH is mainly a referral hospital and patient flow
was affected by this disruption. The stud lasted 12 months; requiring the investigators to seek an
extension of the Ethical approval from KNH-UoN ERC.
4.11 Dissemination plans
The results of the study were disseminated to the Medical department of KNH, KNH
Microbiology Laboratory and will be shared with the UoN library and UNITID library. Since the
study was partly funded by public resources, systematic reviews and original articles will be
submitted to high-quality, peer-reviewed openly accessible journals and online repositories
including the UoN Library Digital Repository.
4.12 Study Risks
We performed an observational cross-sectional study design. The procedures performed
were part of standard care and present minimal risks. Outpatients were interviewed while awaiting
to see their primary physician. Inpatients were interviewed at a convenient time during the day.
The interview lasted 10 minutes and was restricted to questions on DM, and DFUs. There was
minimum discomfort during wound site preparation and drawing of blood samples. A qualified
clinician performed these procedures ensuring that the patient did not undergo unnecessary stress
and pain. Although no monetary compensation was given, patients benefitted by receiving the
culture and sensitivity results of their DFUs within 3-4 days at no fee. We were also not testing for
any therapeutic intervention and so the patients were at no risk of developing side effects or adverse
effects. Any new diagnosis made during the study was reported to the patients’ primary physician.

31
5. Chapter Five: Results
5.1 Flow Chart
Chart 1: Flow chart of the study. It depicts recruitment of patients into the study and study
directed activities; *C/S = Culture and Sensitivity; **One patient had 2 swabs collected from 2
separate ulcers from both feet; *** One other patient had 2 different organisms isolated from the
same ulcer. For all other patients, 1 organism, the most predominant and more likely pathogenic
was isolated.
n=1
C/S not done
Loss to
follow-up
n=47
n=51
PCR for presence of S. aureus
DNA, MRSA DNA
(18 Gram-positive, 32 Gram-
negative isolates, 1 no growth)
Gram-positive
n=25
Gram-negative
n=55
No Growth
n=5
n=83
C/S*
(85 bacteria
isolated from 84
swabs** in
83patients***)
1st Interviews
n=84 patients
Enrollment
n=84 patients
2nd
Interviews
(Follow-up)
n=36

32
5.2 Patients’ socio-demographic characteristics
Population n (%)
Sex Male 39 (45.9)
Female 46 (54.1)
Age Group < 30 1 (1.2)
31-50 15 (18.1)
51-65 42 (50.6)
66-80 20 (24.1)
> 81 5 (6.0)
Population Male Female p value
Age (years) Mean (SD) 60.30 (12.88) 58.62 (11.38) 61.65 (13.95) 0.29
Education level n (%) None 12 (15.6) 2 (5.9) 10 (23.3) 0.001
Primary 34 (44.2) 12 (35.3) 22(51.2)
Secondary 24 (31.2) 13 (38.2) 11(25.6)
Tertiary 7 (9.1) 7 (20.6) 0 (0.0)
Residence n (%) Urban 56 (68.3) 29 (78.4) 27 (60.0) 0.097
Rural 26(31.7) 8 (21.6) 18 (40.0)
Table 5.1: Sociodemographic characteristics of study. The table shows sociodemographic
characteristics of the study patients. Ages were classified into 5 groups. The lower part of the table
shows differences in variables across gender that were analysed using Chi-square test and
considered statistically significant at p < 0.005
We enrolled 84 patients into the study. Most of the study patients were inpatients (68.4%).
The patients underwent a questionnaire-based interview at the start of the study to determine
sociodemographic and clinical findings. The mean age was 60.30 + 12.88 years. Most patients
were in their fifth and sixth decades; 50.6% were 51-65 years while 24.1% were 66-80 years. The
youngest patient was 25 years while the oldest was108 years. The females were 54.1%. Most of
the patients (68.3%) lived in urban areas while 31.7% lived in rural areas. A majority (44.2%) had
primary education and 15.6% did not have any formal education. The difference in education levels
across gender was statistically significant (p = 0.001) with males being more educated.

33
5.3 Clinico-Laboratory Findings
Population n (%)
Type of Diabetes Mellitus n (%) Type 1 DM 2 (2.4)
Type 2 DM 81 (96.4)
Gestational DM 1 (1.2)
History of Diabetes Mellitus n (%) Yes (Previously diagnosed) 75 (91.5)
No (Newly diagnosed) 7 (8.5)
Duration of DM (years) median (IQR) 6.5 (11.25*)
Duration of DM (years) n (%)
<5 36 (46.2)
6 - 10 18 (23.1)
10 - 20 19 (24.4)
>21 5 (6.4)
Type of Treatment n (%) None 2 (2.4)
Diet 1 (1.2)
OHA 15 (17.6)
Insulin 38 (44.7)
Both Diet and OHA 2 (2.4)
Both OHA and Insulin 27 (31.8)
Risk factors
Total n (%)
Male n
(%)
Female n
(%)
p
value
Smoking habits
Yes 13 (17.3) 11 (31.4) 2 (5.0) 0.004
No 62 (82.7) 24 (68.6) 38 (95.0)
Alcohol intake
Yes 25 (33.3) 18 (51.4) 7 (17.5) 0.003
No 50 (66.7) 17 (48.6) 33 (82.5)
Number of
Comorbidities
None 14 (16.5) 7 (17.9) 7 (15.2) 0.509
1 33 (38.8) 15 (38.5) 18 (39.1)
2 19 (22.4) 7 (17.9) 12 (26.1)
3 13 (15.3) 5 (12.8) 8 (17.4)
4 5 (5.9) 4 (10.3) 1 (2.2)
5 1 (1.2) 1 (2.6) 0 (0.0)

34
Clinical
Parameters
Total Mean (SD) Male Female p
value
Systolic Blood
Pressure (mmHg)
136.05(34.51) 138.25
(34.72)
138.39
(24.77)
0.985
Diastolic Blood
Pressure (mmHg)
80.08 (18.74) 80.56
(19.47)
80.61
(12.41)
0.991
Laboratory
Parameters
n Total
Mean
(SD)
Total Median
(IQR)
Male Female p
value
RBS (mmol/L) 62 14.12
(11.03)
9.60 (8.95) 10.08
(4.96)
11.57 (7.28) 0.373
HbA1c (%) 31 8.40
(2.29)
8.80 (2.80) 9.59 (3.75) 8.51(1.74) 0.358
Urea (mmol/L) 61 12.05
(10.58)
7.1
(11.85)
19.36
(20.90)
9.67
(16.68)
0.049
Creat (mmol/L) 56 147.53
(74.06)
114.55
(111.2)
228.19
(156.38)
133.12
(100.72)
0.015
LDL-C (mmol/L) 27 1.40
(0.34)
1.51 (0.81) 1.65
(0.90)
1.82 (0.79) 0.627
Albumin (g/L) 44 29.97
(6.81)
28.5
(7.53)
30.66
(6.46)
0.333
Table 5.2: Clinical characteristics and laboratory parameters of study patients. Table represents
the frequency, percentages, means (SD) and median (IQR) of various clinico-laboratory
parameters. Mean (SD) was reported when data was normally distributed while median (IQR) was
reported when data was not normally distributed following normality tests. Where both mean and
median are reported, the data was not normally distributed but mean was calculated for
comparison with the difference in means across gender. Duration of DM classified into 4 groups.
Chi-square used to determine difference in proportions across gender. Statistically significant p <
0.005. n=sample size
The median (IQR) duration of DM was 6.5 (1.25, 12.5). A small proportion, (8.5%) of
patients were newly-diagnosed with diabetes, 17.3% had ever smoked cigarettes while 33.3% had
ever taken alcohol. Males were more likely to be smokers (p = 0.004). Fourteen patients (16.5%)
had no comorbidities, while the rest of the patients (83.5%) had one or more co-morbidities: fifty-
one patients (61.44%) had hypertension, 18 patients (21.69%) had kidney disease, 10 (12.05%)
had heart disease, 8 (9.64%) had anaemia, 7 (8.43%) had brain disease, 5 (6.02%) had cellulitis, 4
(4.82%) had sepsis and 1 (1.20%) had high cholesterol. Most of the study patients had T2DM and
were currently on medication; 44.7% were on insulin, 17.6% oral anti-hyperglycemic agents and

35
17.6% on a combination of both insulin and oral drugs. The maximum duration of DM was 30
years.
The mean blood pressures (BP) were within normal ranges but 39.7% had hypertension
and severe hypertension based on systolic BP whereas 23.3% had high blood pressure and severe
hypertension based on diastolic BP. The median RBS (IQR) was normal at 9.60 (5.32, 15.45)
mmol/L while the median (IQR) HbA1c was elevated at 8.80 (7.17, 9.92)%. Refer to Table 4.2 for
normal reference values (Chapter 4). Glycaemic control was poor in 31.8% of based on RBS and
83.9% of patients had elevated HbA1c levels. The median (IQR) urea levels were normal, 7.1
(11.85) mmol/L, while the mean and median (IQR) creatinine levels were markedly elevated,
114.55 (111.2) mmol/L. Females had better urea (p = 0.049) and creatinine levels (p= 0.015).
Thirty-nine percent (39.3%) of patients had high urea levels and 58.9% had elevated creatinine
levels. A majority of the patients had desirable T. Chol levels (84.6%), TGs levels (63%), LDL-C
levels (70%), while a small proportion had the best HDL-C levels (7.7%), and HDL/LDL ratio
(12.5%). Seventy percent (70.5%) of the patients had low albumin levels. A large number of
patients did not have recent laboratory results; 63.53% lacked HbA1c levels, 70% lacked lipid
profile tests, 47% lacked liver function tests and 30% lacked kidney function tests.
The median (IQR) duration of the DFU was 8 (4, 16) weeks with 37.5% having lasted for
less than 6 weeks and 52.8% between 7 and 26 weeks. The longest duration of DFU was 312
weeks. Half of the patients had a previous history of DFU and a third had a prior history
amputation. At the time of the study, 77.6% had recently used antibiotics to treat the ulcer. A
majority (88.10%) of the patients had ulcers on only one foot. We analysed results for 92 out of
94 ulcers in total. Forty-nine ulcers (53.26%) were located on the right foot and 43 ulcers (46.74%)
on the left. On the right side, DFUs were on the forefoot (51%) and hindfoot (22.4%).and were
mainly neuropathic (51%) or ischaemic (40.8%). On the left foot, DFUs were mainly located on
the forefoot (55.8%) and hindfoot (37.2%) of ischaemic (51.2%) or neuropathic (41.9%) type. The
majority of the ulcers on both feet were Wagner Stage 1 and 2.

36
Category n (%)
Duration of DFU (weeks) 8 (12*)
Duration of DFU (weeks) n (%) >6 27 (37.5)
7 to 26 38 (52.8)
27-52 7 (9.7)
>52 0 (0.0)
History of previous DFU n (%) Yes 40 (50)
No 40 (50)
History of Previous Amputation n (%) Yes 26 (33.3)
No 52 (66.7)
History of any recent antibiotic use n (%) Yes 45 (77.6)
No 13 (22.4)
RIGHT LEFT TOTAL
n (%) n (%) n (%)
Anatomic
Site of foot
ulcer
Forefoot 25 (51.0) 24 (55.8) 49 (53.3)
Midfoot 7 (14.3) 2 (4.7) 9 (9.8)
Hindfoot 11 (22.4) 16 (37.2) 27 (29.4)
Forefoot & Midfoot 4 (8.2) 0 (0.0) 4 (4.4)
Midfoot & Hindfoot 1 (2.0 0 (0.0) 1 (1.1)
Forefoot, Midfoot & Hindfoot 1 (2.0) 1 (2.3) 2 (2.2)
Type of Ulcer Ischaemic 20 (40.8) 22 (51.2) 42 (45.6)
Neuropathic 25 (51.0) 18 (41.9) 43 (46.7)
Neuro-Ischaemic 4 (8.2) 3 (7.0) 7 (7.6)
Wagner
Stage
0 1 (2.0) 0 (0.0) 1 (1.1)
1 11 (22.4) 16 (37.2) 27 (29.4)
2 16 (32.7) 12 (27.9) 28 (30.4)
3 10 (20.4) 9 (20.9) 19 (20.7)
4 10 (20.4) 4 (9.3) 14 (15.2)
5 1 (2.0) 2 (4.7) 3 (3.3)
Table 5.3 Clinical characteristics of diabetic foot ulcers of the study patients. Table represents
duration, types, location and other clinical characteristics of DFUs among the study patients.
Proportions and median (IQR) have been calculated and differences across gender determined
using Chi-square. *The interquartile range of Duration of DFU was from 4 to 16.

37
5.4 Antimicrobial tests
The results below describe the identification of the isolates and their sensitivity patterns to
commonly used antibiotics.
5.4.1 Distribution of bacterial pathogens isolated from DFUs
We isolated the most predominant growth on culture plate per specimen. Out of 85 culture
and sensitivity tests performed from 83 patients, 78 swabs had mono-microbial growth, 1 had poly-
microbial growth (2 isolates) and 5 had no growth. Most organisms, 55 (64.71%) were Gram-
negative and 25 (29.41%) organisms were Gram-positive. The most common organisms isolated
were S. aureus (16.47%), E. coli (15.29, P. mirabilis (10.59%), K. pneumonia (7.06%) and P.
aeruginosa (7.06%). Some of the other rare bacteria isolated from patients included
Staphylococcus lentus, Staphylococcus simulans, Staphylococcus xylosus, Acinetobacter
baumanni, Burholderia cepacia, Kocuria kristanae, Leuconostoc mesenteroides, Pantoea
agglomerans, Providencia stuartii and Raoultella ornithinolytica.
5.4.2 Antibiotic Resistance Patterns
5.4.2.1 Resistance patterns for Gram-positive bacteria
S. aureus was highly resistant to benzylpenicillin and TMPSMX but sensitive to cefoxitin,
oxacillin, nitrofurantoin, levofloxacin, linezolid, and vancomycin. There was no MRSA identified
using microbiology tests. Isolates of S. epidermidis, S. intermidius and S. simulans were either
100% resistant, 50% resistant or 100% sensitive to the antibiotics tested (Refer to Table 5.4).
5.4.2.2 Resistance patterns for Gram-negative bacteria
E. coli were highly resistant to ampicillin, aztreonam, cefuroxime and TMPSMX but
sensitive to amikacin and nitrofurantoin. P. mirabilis and K. pneumonia showed a similar
resistance to ampicillin but sensitive to amikacin. P. aeruginosa was sensitive to nitrofurantoin,
TMPSMX, ampicillin, amoxicillin-clavulanic acid, ciprofloxacin, ceftazidime and aztreonam. S.
fonticola species showed resistance to TMPSMX, ampicillin, amoxicillin, piperacillin-tazobactam,
cefazolin, ceftazidime, and cefepime. Refer to Table 6.3 (Appendix).

38
Chart 2: Distribution of Gram-positive and Gram-negative isolated. It shows the organisms
identified from the study patients and the distribution in counts and percentage in descending
order. Refer to Table 6.1 (Appendix) for the full list of organisms
3
5
6
6
9
11
13
14
18
3.53%
5.88%
7.06%
7.06%
10.59%
12.94%
15.29%
16.47%
21.18%
0 2 4 6 8 10 12 14 16 18 20
Serratia fonticola
No growth obtained
Klebsiella pneumoniae
Pseudomonas aeruginosa
Proteus mirabilis
Other Gram-posiive
Escherichia coli
Staphylococcus aureus
Other Gram-negative
Distribution of culture resultsB
act
eria
lis
ola
tes
Proportion, n (%)
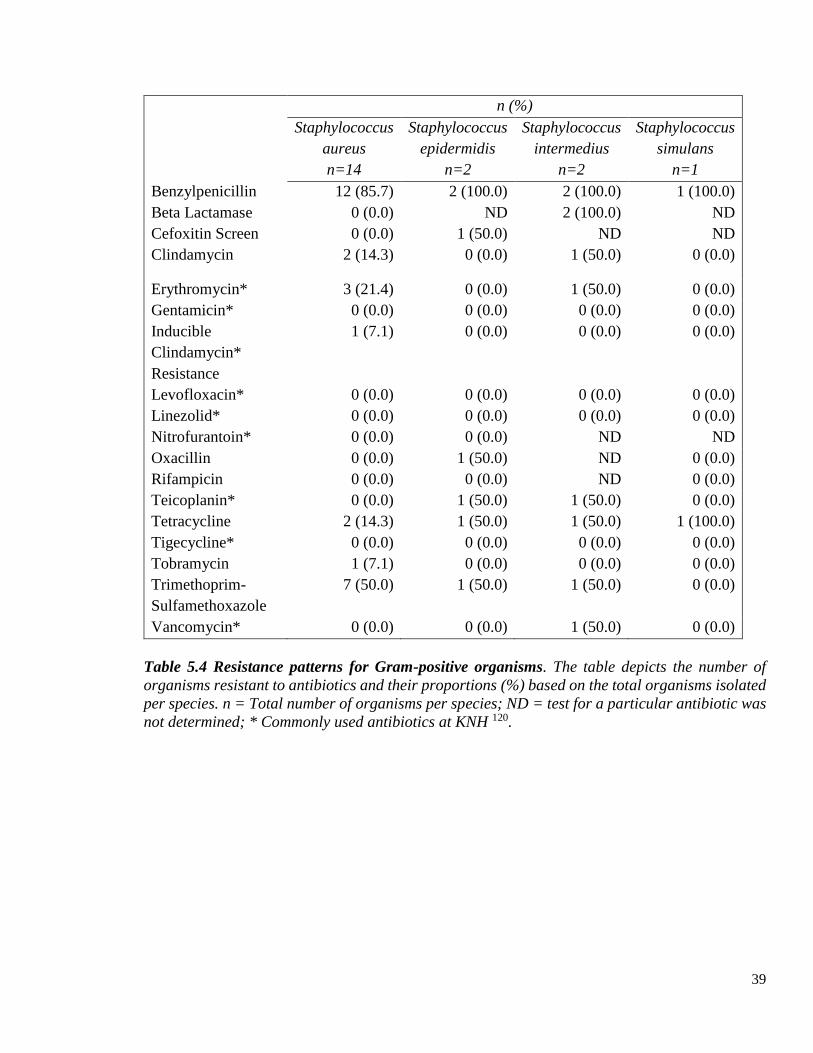
39
n (%)
Staphylococcus
aureus
n=14
Staphylococcus
epidermidis
n=2
Staphylococcus
intermedius
n=2
Staphylococcus
simulans
n=1
Benzylpenicillin 12 (85.7) 2 (100.0) 2 (100.0) 1 (100.0)
Beta Lactamase 0 (0.0) ND 2 (100.0) ND
Cefoxitin Screen 0 (0.0) 1 (50.0) ND ND
Clindamycin 2 (14.3) 0 (0.0) 1 (50.0) 0 (0.0)
Erythromycin* 3 (21.4) 0 (0.0) 1 (50.0) 0 (0.0)
Gentamicin* 0 (0.0) 0 (0.0) 0 (0.0) 0 (0.0)
Inducible
Clindamycin*
Resistance
1 (7.1) 0 (0.0) 0 (0.0) 0 (0.0)
Levofloxacin* 0 (0.0) 0 (0.0) 0 (0.0) 0 (0.0)
Linezolid* 0 (0.0) 0 (0.0) 0 (0.0) 0 (0.0)
Nitrofurantoin* 0 (0.0) 0 (0.0) ND ND
Oxacillin 0 (0.0) 1 (50.0) ND 0 (0.0)
Rifampicin 0 (0.0) 0 (0.0) ND 0 (0.0)
Teicoplanin* 0 (0.0) 1 (50.0) 1 (50.0) 0 (0.0)
Tetracycline 2 (14.3) 1 (50.0) 1 (50.0) 1 (100.0)
Tigecycline* 0 (0.0) 0 (0.0) 0 (0.0) 0 (0.0)
Tobramycin 1 (7.1) 0 (0.0) 0 (0.0) 0 (0.0)
Trimethoprim-
Sulfamethoxazole
7 (50.0) 1 (50.0) 1 (50.0) 0 (0.0)
Vancomycin* 0 (0.0) 0 (0.0) 1 (50.0) 0 (0.0)
Table 5.4 Resistance patterns for Gram-positive organisms. The table depicts the number of
organisms resistant to antibiotics and their proportions (%) based on the total organisms isolated
per species. n = Total number of organisms per species; ND = test for a particular antibiotic was
not determined; * Commonly used antibiotics at KNH 120.
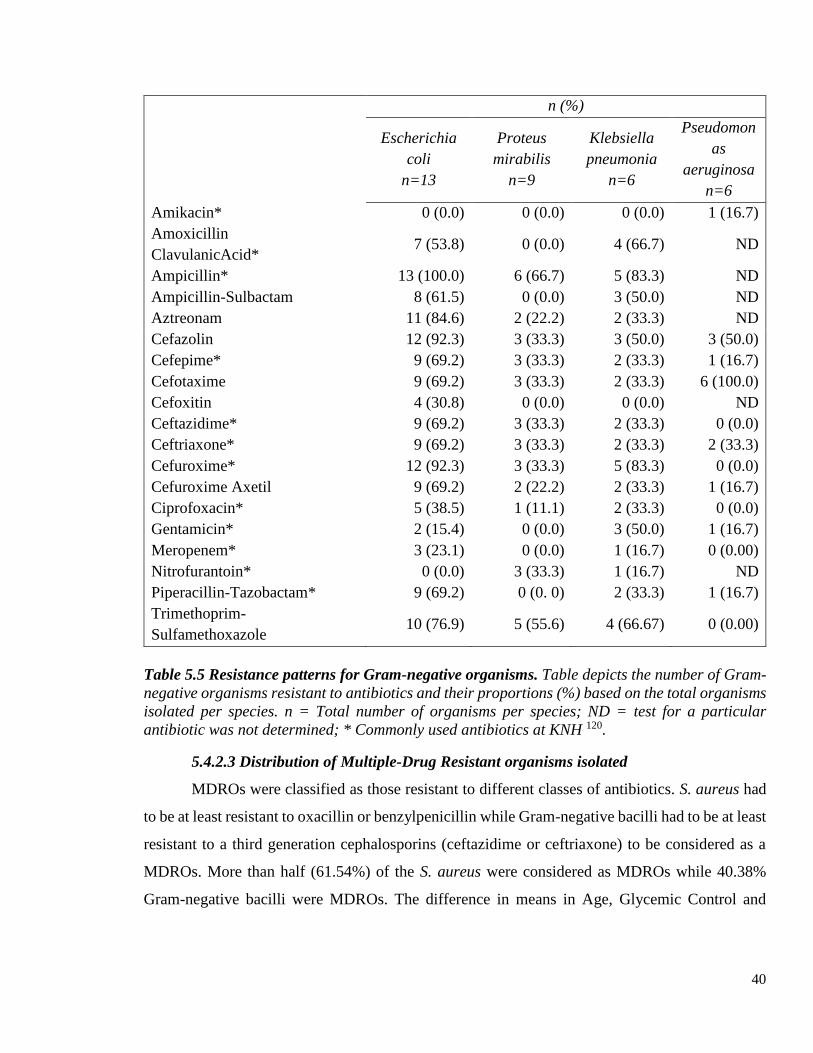
40
n (%)
Escherichia
coli
n=13
Proteus
mirabilis
n=9
Klebsiella
pneumonia
n=6
Pseudomon
as
aeruginosa
n=6
Amikacin* 0 (0.0) 0 (0.0) 0 (0.0) 1 (16.7)
Amoxicillin
ClavulanicAcid* 7 (53.8) 0 (0.0) 4 (66.7) ND
Ampicillin* 13 (100.0) 6 (66.7) 5 (83.3) ND
Ampicillin-Sulbactam 8 (61.5) 0 (0.0) 3 (50.0) ND
Aztreonam 11 (84.6) 2 (22.2) 2 (33.3) ND
Cefazolin 12 (92.3) 3 (33.3) 3 (50.0) 3 (50.0)
Cefepime* 9 (69.2) 3 (33.3) 2 (33.3) 1 (16.7)
Cefotaxime 9 (69.2) 3 (33.3) 2 (33.3) 6 (100.0)
Cefoxitin 4 (30.8) 0 (0.0) 0 (0.0) ND
Ceftazidime* 9 (69.2) 3 (33.3) 2 (33.3) 0 (0.0)
Ceftriaxone* 9 (69.2) 3 (33.3) 2 (33.3) 2 (33.3)
Cefuroxime* 12 (92.3) 3 (33.3) 5 (83.3) 0 (0.0)
Cefuroxime Axetil 9 (69.2) 2 (22.2) 2 (33.3) 1 (16.7)
Ciprofoxacin* 5 (38.5) 1 (11.1) 2 (33.3) 0 (0.0)
Gentamicin* 2 (15.4) 0 (0.0) 3 (50.0) 1 (16.7)
Meropenem* 3 (23.1) 0 (0.0) 1 (16.7) 0 (0.00)
Nitrofurantoin* 0 (0.0) 3 (33.3) 1 (16.7) ND
Piperacillin-Tazobactam* 9 (69.2) 0 (0. 0) 2 (33.3) 1 (16.7)
Trimethoprim-
Sulfamethoxazole 10 (76.9) 5 (55.6) 4 (66.67) 0 (0.00)
Table 5.5 Resistance patterns for Gram-negative organisms. Table depicts the number of Gram-
negative organisms resistant to antibiotics and their proportions (%) based on the total organisms
isolated per species. n = Total number of organisms per species; ND = test for a particular
antibiotic was not determined; * Commonly used antibiotics at KNH 120.
5.4.2.3 Distribution of Multiple-Drug Resistant organisms isolated
MDROs were classified as those resistant to different classes of antibiotics. S. aureus had
to be at least resistant to oxacillin or benzylpenicillin while Gram-negative bacilli had to be at least
resistant to a third generation cephalosporins (ceftazidime or ceftriaxone) to be considered as a
MDROs. More than half (61.54%) of the S. aureus were considered as MDROs while 40.38%
Gram-negative bacilli were MDROs. The difference in means in Age, Glycemic Control and

41
Kidney functions between patients who had MDROs and those who did not was not statistically
significant. Refer to Table 6.4 (Appendix).
Chart 3: Distribution of MDROs among Gram-positive and Gram-negative Organisms. The
table illustrates the distribution of MDROs among Gram-positive and Gram-negative bacteria. S.
aureus and other Gram-positive organisms are displayed on different rows. Antibiotic sensitivity
was not determined for tests that showed no growth, Kocuria kristinae, Leuconostoc
mesenteroides. MDROs = Multiple Drug Resistant Organisms; Non-MDRO=not resistant to
multiple classes of antibiotics; Unclassified= MDRO could not be defined because the organism
did not undergo test with definitive antimicrobials. According to Djahmi and colleagues, S. aureus
had to resistant to methicillin, oxacillin or other penicillin while Gram-negative bacilli resistant
to third generation cephalosporins 83.
5.5 Molecular Tests
Molecular tests were performed on 51 out of the total 85 samples tested. MRSA For the
Gram-positive pathogens, 11 were positive for S. aureus while 7 yielded other Staphylococcus sp.
PCR was considered to be the gold standard for species identification. RT-PCR on the 11 S. aureus
confirmed 9 of the culture results to be true-positives and 2 to be false-positives. Since no MRSA
were detected by culture-based methods, there were therefore 5 false-negatives on the culture
results for the 9 S. aureus species and 2 false negatives from the other Staphylococcus sp.
One sample with other Staphylococcus sp. and suspected to have skin contaminants based
on microbiological tests was subjected to RT-PCR. The culture result was confirmed to be a false-
negative after S. aureus DNA was detected by RT-PCR. No antibiotic sensitivity tests were
53
68
4
1
21
29
2
0
5
10
15
20
25
30
35
MDRO non-MDRO Unclassified
Other Gram-positive S. aurues Gram-negative
Fre
qu
ency
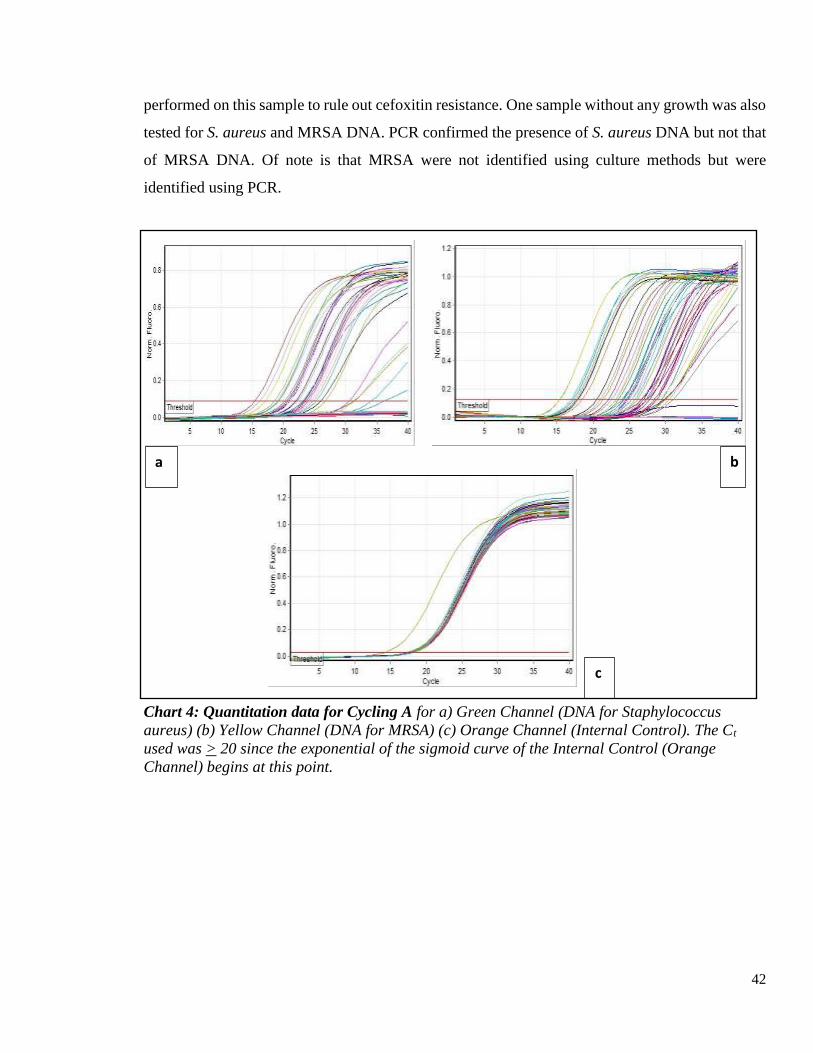
42
performed on this sample to rule out cefoxitin resistance. One sample without any growth was also
tested for S. aureus and MRSA DNA. PCR confirmed the presence of S. aureus DNA but not that
of MRSA DNA. Of note is that MRSA were not identified using culture methods but were
identified using PCR.
Chart 4: Quantitation data for Cycling A for a) Green Channel (DNA for Staphylococcus
aureus) (b) Yellow Channel (DNA for MRSA) (c) Orange Channel (Internal Control). The Ct
used was > 20 since the exponential of the sigmoid curve of the Internal Control (Orange
Channel) begins at this point.
a b
c

43
Gram-positive RT-PCR
Culture-positive S. aureus MRSA
1 Staphylococcus aureus Positive Positive
2 Staphylococcus aureus Positive Positive
3 Staphylococcus aureus Positive Negative
4 Staphylococcus aureus Positive Negative
5 Staphylococcus aureus Positive Negative
6 Staphylococcus aureus Negative Negative
7 Staphylococcus aureus Positive Positive
8 Staphylococcus aureus Negative Positive
9 Staphylococcus aureus Positive Negative
10 Staphylococcus aureus Positive Positive
11 Staphylococcus aureus Positive Negative
12 Staphylococcus epidermidis Negative Negative
13 Staphylococcus intermedius Positive Positive
14 Staphylococcus lentus Positive Positive
15 Staphylococcus pseudintermedius Positive Negative
16 Staphylococcus simulans Negative Negative
17 Staphylococcus xylosus Negative Negative
18 Suspected contaminants isolated Positive Positive
Table 5.6: RT-PCR results for S. aureus and MRSA DNA compared with positive culture
results for Gram-positive bacteria.
Culture-negative RT-PCR
S. aureus MRSA
1 No growth obtained Positive Negative
Table 5.7: RT-PCR results for S. aureus and MRSA DNA compared with culture-negative
results.

44
Gram-negative RT-PCR
Culture results S. aureus MRSA
1 Acinetobacter baumannii Negative Negative
2 Acinetobacter baumannii Negative Negative
3 Citrobacter freundii Positive Positive
4 Enterobacter aerogenes Negative Negative
5 Escherichia coli Negative Negative
6 Escherichia coli Negative Negative
7 Escherichia coli Negative Negative
8 Escherichia coli Positive Negative
9 Escherichia coli Negative Positive
10 Escherichia coli Negative Negative
11 Escherichia coli Positive Positive
12 Escherichia coli Negative Negative
13 Klebsiella oxytoca Negative Positive
14 Klebsiella pneumoniae Negative Negative
15 Klebsiella pneumoniae Negative Negative
16 Klebsiella pneumoniae Negative Negative
17 Pantoea agglomerans Negative Negative
18 Proteus mirabilis Negative Negative
19 Proteus mirabilis Negative Negative
20 Proteus mirabilis Negative Negative
21 Proteus mirabilis Negative Negative
22 Proteus mirabilis Negative Negative
23 Providencia stuartii Negative Negative
24 Pseudomonas aeruginosa Positive Negative
25 Pseudomonas aeruginosa Negative Negative
26 Pseudomonas aeruginosa Negative Negative
27 Pseudomonas aeruginosa Negative Negative
28 Raoultella ornithinolytica Negative Positive
29 Serratia fonticola Negative Negative
30 Serratia fonticola Negative Negative
31 Serratia fonticola Negative Negative
32 Serratia marcescens Negative Positive
Table 5.8: RT-PCR results for S. aureus and MRSA DNA compared with positive culture
results for Gram-negative bacteria.

45
Only 28 samples (87.5%) from the specimens that had Gram-negative bacteria were true-
negatives for S. aureus while, there were 6 false-negatives for MRSA from these samples. Table
5.9 and Table 5.10 below show the distribution of the organisms. Eighty organisms were
subjected to Culture-methods while only 51 underwent RT-PCR.
S. aureus Detection
Gram-positive Gram-negative No growth Total
Culture-positive 14 (56.0) 0 (0.0) 0 (0.0) 14 (17.5)
Culture-negative 11 (44.0) 55 (100.0) 5 (100.00 66 (82.5)
RT-PCR-positive 13 (72.2) 4 (12.5) 1 (100.0) 18 (35.3)
RT-PCR-negative 5 (27.8) 28 (87.5) 0(0.0) 33 (64.7)
Table 5.9: Frequency and proportion of organisms based on culture and RT-PCR results for
S. aureus. There were 80 culture-positive tests conducted and only 51 RT-PCR tests
MRSA Detection
Gram-positive Gram-negative No growth Total
Culture-positive 0 (0.0) 0 (0.0) 0 (0.0) 0 (0.0)
Culture-negative 25 (100.0) 55 (100.0) 5 (100.0) 80 (100.0)
PCR-positive 8 (44.4) 6 (18.8) 0 (0.0) 14 (27.5)
PCR-negative 10 (55.6) 26 981.3) 1 (100.0) 37 (72.5)
Table 5.10: Frequency and proportion of organisms based on culture and RT-PCR results for
MRSA. There were 80 culture-positive tests conducted and only 51 RT-PCR tests

46
We calculated the sensitivity and specificity of the culture tests for the 51 samples
compared to RT-PCR (gold standard). The sensitivity of the VITEK ® 2 machine to detect S.
aureus was 90.9% while the specificity was 82.5%. The positive predictive value (PPV) was
58.8% while the negative predictive value (NPV) was 2.9%. The sensitivity of the culture tests to
detect MRSA could not be calculated due to missing culture-positive results. However, its
specificity was 72.7%.
Table 5.11 2 X2 Table for comparison of culture versus RT-PCR results for S. aureus
MRSA
RT-PCR positive RT-PCR negative Total
Culture-positive 0 0 0
Culture-negative 3 8 11
Total 3 8 11
Table 5.12 2 X2 Table for comparison of culture versus RT-PCR results for MRSA
S. aureus
RT-PCR- positive RT-PCR- negative Total
Culture-positive 10 1 11
Culture-negative 7 33 40
Total 17 34 51

47
5.6 Clinical Outcomes of DFUs
The interval between these two dates was calculated and its median (IQR) was 98 (147)
days. A majority of the patients were reviewed within 1-3 months after the first interview (28.9%),
3-6 months (28.9%) and 6-12 months (21.1%).
Days n (%)
<30 7 (18.4)
31-90 11 (28.9)
91-180 11 (28.9)
181-365 8 (21.1)
>366 1 (2.6)
Table 5.13: Intervals between 1st interview and 2nd interview. Table indicates the distribution of
the intervals between the first interviews and the second interview.
We reviewed 36 patients (43.4%) while 47 patients (56.6%) were lost to follow-up. A
majority of the patients had good progress; 30.6% had ongoing healing whereas 19.4% had
complete healing. However, 25% of the patients on follow-up had non-healing DFUs. The
mortality rate was equally high at 11.1%.
Outcome Measure n
Complete Healing 7
Ongoing Healing 11
Non-Healing 9
Major Surgery 1
Minor Surgery 4
Mortality 4
Table 5.14: Distribution of clinical outcomes of DFUs for the study patients: The table displays
the frequency of study patients reviewed with a particular outcome of interest.

48
Chart 5: Distribution of clinical outcomes of DFUs for the study patients. The chart depicts
the proportion of study patients reviewed with a particular outcome of interest.
Complete Healing19%
Ongoing Healing31%
Non-Healing25%
Major Surgery3%
Minor Surgery11%
Mortality11%

49
6. Chapter Six: Discussion
6.1 Prevalence and socio-demographic factors
There is a common notion that the burden of DFUs is much higher in resource-poor
countries 18. The prevalence rate of DFUs among patients with DM varies widely, the highest rate
being about 30% in Kenya 17,51. This wide variation in prevalence is also reported in other African
countries, with some studies reporting a prevalence of 20% 18,42–44,47,49,50. In resource-rich
countries, there are country-country variations in the prevalence of DFUs, and to the best of our
knowledge, the highest rate is 20% 13,30,36,38–40. In a meta-analysis the prevalence of DFUs in
decreasing order was North America, Africa, Asia and then Europe 121.
In this current study, the prevalence of DFUs was not determined since all the 84 patients
enrolled into the study had active DFUs. Based on the rate of previous history of DFU among the
study patients, the prevalence of DFUs was 50%, which is higher than previous studies from South
Africa, Malawi, Tanzania, Sudan, Ethiopia and Kenya 18,42,45–47,49,50. This high rate can be
explained by the high recurrence rate of DFUs (70%) reported even in facilities that follow the
best practices 64. The high recurrence is disturbing and warrants further investigation to see if
patients who have had prior DFUs adhere to proper foot care. Depression, which is often associated
with DM, and worsening peripheral arterial disease could also be linked to this poor outcome.
Previous studies in Kenya have reviewed DFUs among both inpatients and outpatients
17,51,52. Similarly, study patients in this present study were enrolled from both the medical wards
and diabetic clinic, inpatients being the majority. This distribution can be accounted for by the fact
that DFUs are a major cause of hospitalization for patients with DM 7,8. The mean age of patients
in this study was slightly higher (60.30 years) than in earlier studies 17,18,52. Most of the study
patients were however in their fifth and sixth decades just like in other studies in East Africa
18,47,49,51,52. In this current study, we had 6% of the patients being older than 80 years. There were
more females than males enrolled in this present study similar to an earlier study in Kenya 51. This
was a contrast to a previous study in Kenya where the distribution of males and females was equal
and other studies in Sudan, Tanzania, and Ethiopia where males were more 17,18,47,107.
According to Karugu, lack of education on foot care is a significant risk factor for
developing DFUs in Kenya 34. In this present study, about 60% had minimal or no formal education
similar to studies in Sudan and Tanzania 18,107. In this present study, males were significantly more
educated than females. A majority of patients in this study were from urban areas similar to
50
publications from Sudan and Ethiopia 49,107. From a recent study in Sudan, urban residence was a
significant risk factor in the development of DFUs 50. In contrast, rural residence was a significant
factor to developing DFUs in Ethiopia 49. A study in Tanzania also enrolled patients mainly from
rural areas 18. According to Kibachio and colleagues, patients from rural areas, who are mainly
farmers, are more likely to walk bare-feet and have poor foot care habits 52. This could confer
increased risk of developing DFUs and infection by resistant Gram-negative bacteria. Obimbo and
colleagues conducted a study in a rural area within the outskirts of Nairobi and confirmed most
patients had not been educated on foot care and therefore had poor foot care habits 51. In this
current study, more patients were from urban areas possibly due to the location of KNH being in
Nairobi.
6.2 Clinical characteristics and Patient Outcomes
Mariam and colleagues reported that having T2DM is a significant risk factor for
developing a DFU 49. In this present study, almost all of the patients had T2DM. A small proportion
of the study patients were newly-diagnosed with DM comparable to an earlier study at the same
hospital 17 . The average duration of DM was 8 years, similar to earlier studies in Kenya 17,52 . The
median duration of DM, the measure of central tendency in this study, was however 6.5 years,
revealing that DFUs are developing much earlier than before. This could be an indicator of poor
foot care or inadequate foot care. In this present study, a smaller portion of patients had DM for
less than a year compared to previous findings 18. Having a longer duration of DM was a significant
risk factor for developing DFU in Sudan 50.
In this present study, only a small proportion of patients were not on medication. A majority
(77%) were on insulin therapy whether alone or in combination with oral drugs. The high number
of patients on insulin could result from the fact that inpatients often have deranged glucose levels
and require insulin for strict glucose control. According to Nyamu and colleagues, insulin therapy
among T2DM is associated with pancreatic beta cell failure and is also associated with sepsis
secondary to DFUs 17. However, less than half of the current study patients were on insulin only
which is comparable to earlier studies in Kenya and Ethiopia 17,49. Although poor drug adherence
and poor glycaemic control are known risk factors for DFUs in Kenya, insulin treatment is in itself
a significant risk factor for developing DFUs in Tanzania 17,48,52. The glycemic control based on
HbA1c level for patients in this present study was similar to an earlier study in KNH but much
worse than in a recent study in rural Kenya 17,52.

51
The prevalence of uncontrolled hypertension in this study was much lower than an earlier
study in Kenya where 60% of the patients had BPs higher than 130/80mmHg 52. In this present
study, although 61% of patients had co-morbid hypertension, on recording of BPs during physical
examination, only about 40% had systolic hypertension while 23% had diastolic hypertension.
Hypertension is a known risk factor for DFUs 17,47,52. In the current study, 22% had kidney disease
similar to a study in Ethiopia, while 12% had heart disease, which was higher than a study in Sudan
47,107. Males in this present study had significantly higher levels of urea and creatinine. The poor
kidney function may be attributable to lower health seeking behavior among men 122. In this present
study, the lipid profile was much better than that reported by Nyamu and colleagues and could be
a result of improved patient awareness or better management of dyslipidaemia by the clinicians 17.
Hypertension and dyslipidaemia have been previously associated with DFUs in Kenya 17,52.
A small proportion of patients reported a positive history of smoking cigarettes and
drinking alcohol, which could possibly reflect under-reporting as noted by Nyamu and colleagues
17. Smoking habits and alcohol use were much higher among surgical patients with DFUs in
Tanzania 18. Males were also more likely to smoke and take alcohol in this present study as
expected, a reflection of cultural norms across gender in resource-poor countries. Based on studies
comparing participants with different smoking rates, smoking cessation has been recommended as
an effective preventive measure to prevent DFUs and to avoid amputations 121. In Tanzania,
drinking alcohol was a protective factor against DFU but this association was not present after
multivariate analysis 48. Kibachio and colleagues similarly found different risk factors for DFUs
depending on gender 52.
The median duration of DFU was 8 weeks in this current study. This was shorter than in
earlier studies in Kenya and Tanzania and could perhaps indicate increased patient awareness,
increased foot care, and increased foot care assessment by the clinicians 17,18. Similar to this study,
the forefoot and the right leg were the most affected anatomical sites similar to studies in KNH,
Tanzania and Brazil 17,18,70. The causal pathway for DFUs among patients from two outpatient
settings in resource-rich countries was peripheral neuropathy, foot deformity and minor trauma
7,30. In Kenya, prior history of trauma was present in 50% of the patients with DFUs at KNH and
in 75% at Kikuyu Hospital 17,51. However, mild continuous trauma is the most likely cause of
DFU 64.

52
Neuropathy is a significant risk factor for developing DFUs 48,49. Peripheral neuropathy
usually begins with autonomic dysfunction, and then sensory and motor nerves are finally affected
64. Although the prevalence of neuropathy in this present study is much lower than in earlier
studies 17,51, diabetic polyneuropathy among the study patients was much higher than in Uganda
and Nigeria 43,61. This confirms a higher rate of neuropathy among Kenyan patients. A majority of
the DFUs in this present study were in Wagner Stage 1 and 2 in contrast to studies in Tanzania,
Sudan and Libya 18,56,57. This could indicate early presentation of the patients to this hospital. In
Brazil, 54% of DFUs were superficial ulcers similar to this present study 70. Neuropathy among
patients in Nigeria was associated with increasing age, male sex, longer duration of DM, poor
glycemic control and dyslipidaemia 43. In Kenya, neuropathy has also been associated with poor
glycemic control 17.
In this present study, a third of the study patients had a prior amputation, which was thrice
the rate of previous amputation in Tanzania 18. However, prospectively, only 14% of patients in
this study had a surgical procedure compared to 90% in Tanzania, mainly because the current study
was among medical patients while the other was among surgical patients 18. Half of the patients
followed-up in this present study had good clinical outcomes. The mortality rate in this present
study was also similar to the study in Tanzania and a literature review from 19 African countries
18,42. In Sudan, Adam and colleagues reported a much lower mortality rate (6.7%) following
diabetic foot 91, possibly because of a shorter duration of DM and less chronic complications 107.
Mortality in Tanzania was associated with diabetes complications and advanced DFUs 18.
6.3 Microbiology results
Wounds can be classified as clean, contaminated, infected or colonised 72. Infection is
determined by performing culture and sensitivity tests on wound swabs and a high CFU/g 21,63,64.
In this present study, over 90% of the DFUs were infected. This was higher than in an earlier study
in Kenya, Tanzania, and Libya where about 70% of DFUs had positive cultures 17,18,57. There is
therefore need to manage diabetes mellitus effectively which was identified as a risk factor for
infectious wounds in India 72. In this current study, Gram-negative bacteria were more predominant
than Gram-positive organisms similar to studies in Morocco and Brazil 70,73. The most common
species isolated in this study in order of frequency was S. aureus, E. coli, P. mirabilis, K.
pneumonia, P. aeruginosa and S. fonticola. Many other previous studies have also detected S.
aureus as the most predominant species in DFUs 10,18,20,21,57,59,65,67,68,70. Similar to the present

53
results, E. coli and P. aureginosa are common Gram-negative bacteria isolated from DFUs
21,57,59,65,70.
Although not all bacteria infecting a DFU were identified, in one patient, there were two
different bacteria colonizing one wound (E. coli and Raoultella ornithinolytica) and in another
patient, S. aureus and E. coli were identified from ulcers on different feet. Therefore, in this study,
most of the DFUs had mono-microbial growth. The identification of bacteria was limited to the
most predominant species and so poly-microbial infections were lower than expected. This mono-
microbial pattern could also be associated with the fact that most of the DFUs in this present study
were in early Wagner stages and most patients were already on antibiotic treatment 69,123. In this
present study, 77.6% of the patients were taking antibiotics at the time of the sample collection.
Poly-microbial growth, associated with advanced DFUs, was reported in Libya, Tanzania and
Brazil 18,57,70. However, in study at a tertiary referral facility in India, mono-microbial growth was
present in all 100 patients with chronic DFUs 69.
Citrobacter sp. isolated from DFUs in this current study has also been previously isolated
from DFUs in Brazil 70. Majority of the rare Gram-negative species isolated in this study such as
Acinectobacter baumanni, Burholderia cepacia and Providencia stuartii and cause nosocomial
infections. L. mesenteroides is utilized in milk processing while P. agglomerans is considered an
opportunistic infection 124.
Unjustified use of antibiotics is not only a precursor to antibiotic resistance, but leads to
inefficient use of scarce health resources and further burdens patients and their families 7,21,34. In
this present study, there was high resistance to antibiotics among the Gram-negative organisms
compared to the Gram-positive bacteria. S. aureus was resistant to benzyl-penicillin and TMPSMX
in this present study. MRSA is predominant in DFUs and sensitive to sparfloxacin, levofloxacin,
ofloxacin, ciprofloxacin, amoxicillin- clavulanic acid, cephalexin, cefuroxime, doxycycline and
clindamycin .71,78. In Brazil, 22% of DFUs were identified as having MRSA following cefoxitin
screen, and 33% of these were also resistant to vancomycin 70. In this present study, no MRSA
was identified by culture methods since cefoxitin screen for S. aureus was negative for all. S.
aureus was also sensitive to oxacillin, nitrofurantoin, gentamicin, levofloxacin, linezolid,
teicoplanin, tigecycline and vancomycin in this study.
S. aureus and E. coli isolated from DFUs by Perim and colleagues were resistant to multiple
classes of antibiotics 70. In this present study, antimicrobial sensitivity tests revealed that most E.

54
coli and K. pneumonia were resistant to ampicillin and cefuroxime. P. aeruginosa was resistant to
cefotaxime while S. fonticola was resistant to most antibiotics. From previous studies, antibiotics
that used to work before are now showing increasing resistance 18,59. For example, in Tanzania,
most pathogens isolated from DFUs had high resistance to commonly used antibiotics 18. Common
practice in Kenya is to empirically administer one of the following 6 antibiotics to treat chronic
wounds before a culture and sensitivity test is performed: Augmentin, ciprofloxacin, cefuroxime,
ceftriaxone, clindamycin, flagyl or floxapen.
Our results therefore offer guidance on recommendations for treating DFUs. From this
present study, amikacin is effective against most Gram-negative bacteria in this setting. The high
resistance to ampicillin should warrant careful consideration of this drug during empirical therapy.
It is also worth noting that although some E. coli isolates were resistant to meropenem (a third-
line antibiotic); all were sensitive to nitrofurantoin (a first-line antibiotic). On the other hand, in
this present study, C. freundii isolated had resistance to piperacillin-tazobactum and most
cephalosporins. From literature, C. freundii is associated with over-use of broad-spectrum
antibiotics and is also known to be resistant to piperacillin, piperacillin-tazobactam, vancomycin
and cephalosporins 124. There is therefore need to use antibiotics judiciously and be guided by
routine culture and sensitivity results which should be the standard practice. More sensitive
procedures should be employed to detect infection-causing bacteria. A study by Stappers and
colleagues reported high number of false-negatives from culture-based methods 20.
6.4 Molecular
Molecular methods include amplification of the hypervariable region in the 16S rRNA 67.
In the present study, molecular tests were more sensitive than culture-based methods. PCR
revealed pathogens that were not previously recognized by culture methods which included MRSA
species. The sensitivity of the culture tests was 90.9% while the specificity was 82.5% for detection
of S. aureus. The PPV and NPV were 58.8% and 2.9% respectively. Compared to RT-PCR, culture
tests had a specificity of 99%, sensitivity of 31%, PPV of 59% and NPV of 98% also found
significant discrepancies between culture and sequencing methods 20,67. Stappers and colleagues
reported that 81% of samples were RT-PCR-positive for S. aureus while only 41% were culture
positive for the same species 20. In the present study, 72% of the samples were RT-PCR-positive
for S. aureus while 56% were culture-positive. Weighing costs, PCR should be considered as a
microbiological procedure for diagnosing pathogens in DFUs.

55
6.5 Wound Healing
In this present study, there was a non-healing rate of 25% among the study patients who
were followed-up. Healing of wounds mainly occurs in three main stages: inflammation,
proliferation (re-epithelization, granulation, neo-angiogenesis) and extracellular matrix
remodeling 54,64. Mendes and Neves describe the process of wound healing 64. First, platelets
degranulate at the wound site and release transforming growth factor (TGF-1), platelet-derived
growth factor (PDGF) and fibroblast growth factor (-FGF) leading to blood vasoconstriction. A
clot then forms, producing vascular endothelial growth factor (VEGF) which attracts fibroblasts
around the wound area and later leukocytes (neutrophils) and monocytes infiltrate. Cells
(keratinocytes, fibroblasts, endothelial progenitor cells, macrophages and platelets), and normal
quantities of chemokines and cytokines are all important for proper wound healing. At the
molecular level, there are many pathological causes for poor wound healing. Delayed healing of
DFUs among patients with DM has been attributed to on one hand by reduced TGF, nerve growth
factor (NGF), insulin-like growth factor (IGF), epidermal growth factor receptor (EGFR), stromal
cell-derived factor 1 (SDF-1endothelial nitric oxide synthase (eNOS) leading to elevated NO,
imbalance of matrix metalloproteinases (MMPs); and on the other hand by increased c-myc, -
catenin, cathepsin-D, inflammatory markers (IL-6, IL-8, IL-19, IL-15, neurotrophin-3, substance
P, CGRP) and glucocorticoid pathways activity 28,54. Immunological and collagen cross-linking
disturbances have also been associated with poor healing of DFUs 30.
6.6 STUDY LIMITATIONS
1. The present study was a hospital-based study in a referral centre and the results cannot be
generalized to the entire population. There was a prolonged doctors and lecturers strike in the
beginning of the year, which slowed down patient enrollment. However, we surpassed the
minimal sample size expected based on previous prevalence studies in Kenya.
2. Although some of the samples showed mixed growth from preliminary tests, due to funding
limitations, this present study did not identify all the bacteria using both culture-based. The
study did also test for anaerobic bacteria which are commonly suspected in deep seated
infections. Identification of anaerobic bacteria requires immediate collection and streaking of
sample in the culture media and placing it into an anaerobic jar with packs at the bedside of
the patient. The ideal scenario requires a laboratory technician to collect the sample himself.

56
However, from personal experiences of technicians at the KNH Microbiology Laboratory, the
results from aerobic cultures are often similar with results from anaerobic procedures; mostly
because aerobic and facultative, which are the majority, can do well in presence of oxygen.
However, further research needs to confirm this notion.
3. Antimicrobial sensitivity did not test for all antibiotics. It would have been interesting to note
sensitivity of Gram-positive bacteria to Augmentin, ciprofloxacin, cephalosporins, and
flucloxacillin, antibiotics which are commonly used by clinicians. However, sensitivity of the
gram-positive organisms to clindamycin, another commonly used drug, was tested. Resistance
to metronidazole among gram-negative organisms was not tested.
4. Retrieval of records from patients’ files was not efficient enough to obtain full laboratory
results and patient outcomes on follow-up. With the necessary resources, it would have been
prudent to collect blood samples for relevant laboratory tests as we performed the wound
culture and sensitivity tests and to have a prospective arm for the follow-up results.
5. PCR was used to identify and quantify DNA of the target S. aureus and resistant mecA gene
for MRSA. Limited funding and time prevented the use of PCR to fully sequence part or the
entire genome with Universal primers. This would have not only helped to compare molecular
versus culture-based tests and also detect resistant strains. PCR tests are thought to have better
sensitivity and would be ideal in identifying bacteria in low populations. However, genotyping
is quite expensive, takes time and is beyond the scope of this study. It is also worth noting that
molecular tests may detect dead bacteria which could include contaminants.
6.7 CONCLUSION
There are poor outcomes for patients with DFUs in this setting such as poor wound healing,
high recurrence rates, increased lower limb amputations and mortality compared to previous
studies. The study patients were slightly older, more likely female, less educated but urbanised.
The study patients had better control of hypertension and dyslipidaemia, lower levels of
neuropathy and earlier presentation of DFUs reflecting increased patient awareness and better
management by clinicians. Majority of the patients in this study were on insulin and antibiotics.
Almost all DFUs were infected, with Gram-negative bacteria being the most common. In order of
frequency, S. aureus, E. coli, P. mirabilis, K. pneumonia, P. aeruginosa were the most common
isolated species. There was a high prevalence of bacteria which are nosocomial in nature. In this
study, the bacteria isolated showed high resistance to commonly used antibiotics with Gram-

57
negative bacteria showing higher resistance patterns. MRSA were not identified using culture
methods but were identified using PCR. PCR was also more sensitive than culture-based methods
to identify S. aureus.
6.8 RECOMMENDATIONS
1. Patients with DFUs should have microbial swabs for culture and sensitivity performed
routinely for correct management and antibiotic stewardship.
2. The presence of nosocomial infections should encourage infection control measures among
patients with DM.
3. Further studies should be performed to identify bacteria from mixed infections in DFUs and
anaerobic organisms.
4. PCR is an effective way of species identification, and in particular S. aureus and MRSA and
should be considered as an ideal test for patients who have resources.
5. The high prevalence of poor outcomes for patients with DFUs warrants the need to investigate
bio-psychosocial risk factors.
6. Screening and foot assessment should be encouraged during each clinical visit. Examination
focuses on peripheral neuropathy, peripheral arterial disease and plantar pressure 64.Certain
professional organisations recommend different prevention measures based ion the patients’
risk levels 30. Patients with DM should be educated to smoking cessation and foot-care.
7. Patients with DM should have laboratory tests such as UECs, LFTs, Lipid profile, and HbA1c
every 6 months to rule out and properly manage diabetic complications.

58
7. Chapter Seven: References/Bibliography
1. International Diabetes Federation. IDF Diabetes Atlas. 7th ed. Brussels, Belgium:
International Diabetes Federation; 2015.
2. International Diabetes Federation. IDF Diabetes Atlas. 4th ed. Brussels, Belgium:
International Diabetes Federation; 2009.
3. Laakso M, Ronnemaa T, Pyörälä K, et al. Atherosclerotic vascular disease and its risk
factors in non-insulin-dependent diabetic and non-diabetic subjects in Finland. Diabetes
Care 1988. 1988;11(6):449-463.
4. Correa-Rotter R, Naicker S, Katz IJ, et al. Demographic and epidemiologic transition in the
developing world: role of albuminuria in the early diagnosis and prevention of renal and
cardiovascular disease. Kidney Int Suppl. 2004;66(92):S32-S37.
5. Diabetes Cases on the Rise as Minister Calls for Change. Daily Nation. November 2012:n.
pag.
6. El-busaidy H, Dawood M, Kasay A, Mwamlole C, Koraya N, Parpia H. How Serious is the
Impact of Type II Diabetes in Rural Kenya? Open Diabetes J. 2014;7(1):1-4.
7. Reiber GE, Pecoraro RE, Koepsell TD. Risk factors for amputation in patients with diabetes
mellitus. A case-control study. Ann Intern Med. 1992;117(2):97-105.
8. Lavery LA, Ashry HR, Van Houtum W, Pugh JA, Harkless LB, Basu S. Variation in the
incidence and proportion of diabetes-related amputations in minorities. Diabetes Care.
1996;19(1):48-52.
9. Kumar P CM. Clinical Medicine. 7th ed. (Kumar, P. & Clark M, ed.). Edinburgh: Elsevier
Saunders; 2009.
10. Agwu E, Dafiewhare EO, Ekanem PE. Possible Diabetic-Foot Complications in Sub-
Saharan Africa. Glob Perspect Diabet Foot Ulcerations. 2010;(2007):3-15.
11. Wu SC, Driver VR, Wrobel JS, Armstrong DG. Foot ulcers in the diabetic patient,
prevention and treatment. Vasc Health Risk Manag. 2007;3(1):65-76.
12. Bessaman AN. Foot problems in the diabetic. Compr Ther. 1982;8(1):32-37.
13. Neil HAW, Thompson AV, Thorogood M, Fowler GH, Mann JI. Diabetes in the Elderly:
The Oxford Community Diabetes Study. Diabet Med. 1989;6(7):608-613.
14. Nishino Y, Gilmour S, Shibuya K. Inequality in diabetes-related hospital admissions in
England by socioeconomic deprivation and ethnicity: Facility-based cross-sectional

59
analysis. PLoS One. 2015;10(2):1-15.
15. Gillani SMR, Aziz U, Blundell D, Singh BM. Non elective re-admissions to an acute
hospital in people with diabetes: Causes and the potential for avoidance. the WICKED
project. Prim Care Diabetes. 2015;9(5):392-396.
16. Alexiadou K, Doupis J. Management of diabetic foot ulcers. Diabetes Ther. 2012;3(1):1-
15.
17. Nyamu PN, Otieno CF, Amayo EO, Mcligeyo SO. Risk Factors And Prevalence Of Diabetic
Foot Ulcers At Kenyatta National Hospital , Nairobi. East Africa Med J. 2003;80(1):36-43.
18. Chalya PL, Mabula JB, Dass RM, et al. Surgical Management of Diabetic Foot ulcers: A
Tanzanian University Teaching Hospital Experience. BMC Res Notes. 2011;4(365):1-7.
19. Wagner FWJ. The diabetic foot. Orthopaediatrics. 1987;10:163-172.
20. Stappers MHT, Hagen F, Reimnitz P, Mouton JW, Meis JF, Gyssens IC. Direct molecular
versus culture-based assessment of Gram-positive cocci in biopsies of patients with major
abscesses and diabetic foot infections. Eur J Clin Microbiol Infect Dis. 2015;34(9):1885-
1892.
21. Uckay I, Gariani I, Pataky Z et al. Diabetic foot infections: state-of-the-art. Diabetes,
Obesity and Metabolism. Diabetes Obes Metab. 2014;16(4):305-316.
22. Levesque C, Piche L LC et al. PCR mapping of integrons reveals several novel
combinations of resistance genes. Antimicrob Agents Chemother. 1995;39(1):185-191.
23. WHO. WHO Fact Sheets. http://www.who.int/news-room/fact-sheets/detail/antibiotic-
resistance. Published 2018. Accessed September 11, 2018.
24. Gibbons G EG. Infection of the Diabetic Foot. In Management of Diabetic Foot Problems.
(Kozak GP et al, ed.). Philadelphia: Saunders; 1984.
25. Armstrong DG, Lavery LA, Vela SA et al. Choosing a practical screening instrument to
identify patients at risk for diabetic foot ulceration. Arch Intern Med. 1998;158:289-02.
26. Sarkar PK BS. Management of leg ulcers. Postgr Med J. 2000;76:674-682.
27. Dang CN & Boulton AJ. Changing perspectives in diabetic foot ulcer management. Int J
Low Extrem Wounds. 2002;2:4-12.
28. Brem H, Tomic-Canic M. Cellular and molecular basis of wound healing in diabetes. J Clin
Invest. 2007;117(5):1219-1222.
29. Elrayah-Eliadarous HA, Östenson CG, Eltom M, Johansson P, Sparring V, Wahlström R.

60
Economic and social impact of diabetes mellitus in a low-income country: A case-control
study in Sudan. J Diabetes. 2017;9(12):1082-1090.
30. Singh N, Armstrong DG, Lipsky BA. Preventing foot ulcers. J Am Med Assoc.
2005;293(2):94-96.
31. Hurlow JJ, Humphreys GJ, Bowling FL, McBain AJ. Diabetic foot infection: A critical
complication. Int Wound J. 2018;15(5):814-821.
32. Kasiya MM, Mang’anda GD, Heyes S, et al. The challenge of diabetic foot care: Review of
the literature and experience at Queen Elizabeth Central Hospital in Blantyre, Malawi.
Malawi Med J. 2017;29(2):218-223.
33. Danmusa UM, Terhile I, Nasir IA, Ahmad AA, Muhammad HY. Prevalence and healthcare
costs associated with the management of diabetic foot ulcer in patients attending Ahmadu
Bello University Teaching Hospital, Nigeria. Int J Heal Sci Qassim Univ. 2016;10(2).
34. Karugu L. Mainstreaming Diabetic Foot Education In Kenya: Prevalence of Diabetes in
Kenya. In: World, I. D. F., & Congress D, ed. ; 2011.
35. Moss S, Klein R KB. The prevalence and incidence of lower extremity amputation in a
diabetic population. Arch Intern Med. 1992:510–616.
36. Boulton AJ. The diabetic foot: a global view. Diabetes Metab Res Rev. 2000;16(Suppl
1:):S2-5.
37. Lavery LA, Lavery DC, Hunt NA, La Fontaine J, Ndip A, Boulton AJ. Amputations and
foot-related hospitalisations disproportionately affect dialysis patients. Int Wound J.
2015;12(5):523-526.
38. Walters DP, Catling W, Mullee MA, Hill RD. The Distribution and Severity of Diabetic
Foot Disease: a Community Study with Comparison to a Non-diabetic Group. Diabet Med.
1992;9(4):354-358.
39. Rasmussen BSB, Froekjaer J, Bjerregaard MR, et al. A randomized controlled trial
comparing telemedical and standard outpatient monitoring of diabetic foot ulcers. Diabetes
Care. 2015;38(9):1723-1729.
40. Bouter KP, Storm AJ, de Grost RR, Uitslager R, Erkelena DW DR. The diabetic foot in
Dutch hospitals: epidemiological features and clinical outcome. Eur J Med. 1993;2:215-
221.
41. Fard AS, Esmaelzadeh M, Larijani B. Assessment and treatment of diabetic foot ulcer. Int

61
J Clin Pract. 2007;61(11):1931-1938.
42. Rigato M, Pizzol D, Tiago A, Putoto G, Avogaro A, Fadini GP. Characteristics, prevalence,
and outcomes of diabetic foot ulcers in Africa. A systemic review and meta-analysis.
Diabetes Res Clin Pract. 2018;142:63-73.
43. Ogbera AO, Adeleye O, Solagberu B, Azenabor A. Screening for peripheral neuropathy
and peripheral arterial disease in persons with diabetes mellitus in a Nigerian University
Teaching Hospital. BMC Res Notes. 2015;8(1):4-9.
44. Unachukwu C, Babatunde S, Ihekwaba AE. Diabetes, hand and/or foot ulcers: A cross-
sectional hospital-based study in Port Harcourt, Nigeria. Diabetes Res Clin Pract.
2007;75(2):148-152.
45. Levitt NS, Bradshaw D, Zwarenstein MF, Bawa AA MS. Audit of public sector primary
diabetes care in Cape Town, South Africa: high prevalence of complications, uncontrolled
hyperglycaemia, and hypertension. Diabet Med. 1997;59(14):1073–7.
46. Burgess P. Determinants of severity and progression of diabetic retinopathy in Southern
Malawi. 2016. The University of Liverpool, Foundation Building, Brownlow Hill,
Liverpool, L69 7ZX, UK
47. Deribe B, Woldemichael K, Nemera G. Prevalence and Factors Influencing Diabetic Foot
Ulcer among Diabetic Patients Attending Arbaminch Hospital, South Ethiopia. J Diabetes
Metab. 2014;5(1):1-6.
48. Chiwanga FS, Njelekela MA. Diabetic foot: prevalence, knowledge, and foot self-care
practices among diabetic patients in Dar es Salaam, Tanzania - a cross-sectional study. J
Foot Ankle Res. 2015;8:20.
49. Mariam TG, Alemayehu A, Tesfaye E, et al. Prevalence of Diabetic Foot Ulcer and
Associated Factors among Adult Diabetic Patients Who Attend the Diabetic Follow-Up
Clinic at the University of Gondar Referral Hospital, North West Ethiopia, 2016:
Institutional-Based Cross-Sectional Study. J Diabetes Res. 2017;2017.
50. Awadalla H, Noor SK, Elmadhoun WM et al. Diabetes complications in Sudanese
individuals with type 2 diabetes: Overlooked problems in sub-Saharan Africa? Diabetes
Metab Synd. 2017;11(Suppl 2):S1047-S1051.
51. Obimbo MM, Bundi PK, Collis F, Podmed D. Foot complications among diabetics
attending a district hospital in Kenya : Predisposing factors and possible intervention.
62
2008;2(June):3-8.
52. Kibachio J, Omolo J. Risk factors for diabetic foot ulcers in type 2 diabetes: A case control
study, Nyeri, Kenya. African J Diabetes Med. 2013;21(1).
53. Mamo T, Yifter H LT. Risk Factors Assessment Of Diabetic Foot Ulcer Using The Sixty
Seconds Screening Tool: A Hospital Based Cross-Sectional Study At Tikur Anbessa
Specialized Hospital. Ethiop Med J. 2015;Jul(Suppl 2):45-49.
54. Bruhn-Olszewska B, Korzon-Burakowska A, Gabig-Cimińska M, Olszewski P, Wegrzyn
A, Jakóbkiewicz-Banecka J. Molecular factors involved in the development of diabetic foot
syndrome. Acta Biochim Pol. 2012;59(4):507-513.
55. Sano D, Tieno H DY et al. Management of the diabetic foot. Dakar Med J. 1998;43:109-
113.
56. Bushra E, Doumi A. Diabetic Septic Foot Lesions in El Obeid, Western Sudan.
2007;2(June):119-122.
57. Benkhadoura M, Alswehly M, Elbarsha A. Clinical profile and surgical management of
diabetic foot in Benghazi, Libya. Foot Ankle Surg. 2016;22(1):55-58.
58. Edo AE, Edo GO & EI. Risk factors, ulcer grade and management outcome of diabetic foot
ulcers in a Tropical Tertiary Care Hospital. Niger Med J J Niger Med Assoc. 2013;54(1):59-
63.
59. McLigeyo, Otieno LS. Diabetic ulcers--a clinical and bacteriological study. East Afr Med
J. 1991;68(3):204-210.
60. Mugambi-Nturibi E, Otieno CF, Kwasa TO et al. Stratification of persons with diabetes
into risk categories for foot ulceration. East Afr Med J. 2009;86(5):233-239.
61. Kisozi T, Mutebi E, Kisekka M, et al. Prevalence, severity and factors associated with
peripheral neuropathy among newly diagnosed diabetic patients attending mulago hospital:
A cross-sectional study. Afr Health Sci. 2017;17(2):463-473.
62. Motsumi M & Naidoo N. Pattern and distribution of peripheral arterial disease in diabetic
patients with critical limb ischemia (rutherford clinical category 4-6). S Afr J Surg.
2017;55(3):48-54.
63. Sotto A, Lavigne J-P, Dunyach-remy C, Lipsky B a. New Molecular Techniques to Study
the Skin Microbiota of Diabetic Foot Ulcers. Adv Wound Care. 2015;4(1):38-49.
64. Mendes JJ, Neves J. Diabetic Foot Infections: Current Diagnosis and Treatment. J Diabet

63
Foot Complicat. 2012;4(2):26-45.
65. Spichler A, Hurwitz BL, Armstrong DG, Lipsky BA. Microbiology of diabetic foot
infections: from Louis Pasteur to “crime scene investigation”. BMC Med. 2015;13:2.
66. Sivaprakasam V, Chima-Okereke C. An interesting case of “diabetic foot ulcer” in an HIV-
positive patient. Int J STD AIDS. 2015;26(4):285-287.
67. Lipsky BA, Richard JL, Lavigne JP. Diabetic foot ulcer microbiome: One small step for
molecular microbiology one giant leap for understanding diabetic foot ulcers. Diabetes.
2013;62(3):679-681.
68. Messad N, Prajsnar TK, Lina G, et al. Existence of a colonizing Staphylococcus aureus
strain isolated in diabetic foot ulcers. Diabetes. 2015;64(August):2991-2995.
69. Banu A, Noorul Hassan MM, Rajkumar J, Srinivasa S. Spectrum of bacteria associated with
diabetic foot ulcer and biofilm formation: A prospective study. Australas Med J.
2015;8(9):280-285.
70. Perim MC, Borges J da C, Celeste SRC, et al. Aerobic bacterial profile and antibiotic
resistance in patients with diabetic foot infections. Rev Soc Bras Med Trop. 2015;48(5):546-
554.
71. Mathangi T, Prabhakaran P, Rayappan F, Tilton F. Isolation , molecular characterization
and antibiogram of bacteria isolated from diabetic foot ulcers. 2013;1(1):17-25.
72. Snigdha APN, Lal S, San S, Fousiya KS SP. Infectious Wounds : Assessing Risk Factors ,
Severity And Antimicrobial Sensitivity Patterns. World J Pharm Pharm Sci.
2016;5(7):1298-1316.
73. Belefquih B, Frikh M, Benlahlou Y et al. Diabetic Foot Infection in Morocco:
Microbiological Profile. Wounds. 2016;28(3):89-98.
74. Gitau AM, Ng’ang’a ZW, Sigilai W et al. Fungal infections among diabetic foot ulcer-
patients attending diabetic clinic in Kenyatta National Hospital, Kenya. East Afr Med J.
2011;88(1):9-17.
75. Mordi RM, Momoh MI. Incidence of Proteus species in wound infections and their
sensitivity pattern in the University of Benin Teaching Hospital. African J Biotechnol.
2009;8(5):725-730.
76. Ornskov D, Kolmos B, Horn PB, Nederby Nielsen J, Brandslund I, Schouenborg P.
Screening for methicillin-resistant Staphylococcus aureus in clinical swabs using a high-

64
throughput real-time PCR-based method. Clin Microbiol Infect. 2008;14(1):22-28.
77. Drews SJ, Willey BM, Kreiswirth N, et al. Verification of the IDI-MRSA assay for
detecting methicillin-resistant Staphylococcus aureus in diverse specimen types in a core
clinical laboratory setting. J Clin Microbiol. 2006;44(10):3794-3796.
78. Chhibber S, Kaur T KS. Co-Therapy Using Lytic Bacteriophage and Linezolid: Effective
Treatment in Eliminating Methicillin Resistant Staphylococcus aureus (MRSA) from
Diabetic Foot Infections. PLoS One. 2013;8(2).
79. Joshi M & Deshpande DJ. Polymerase Chain Reaction : Methods , Principles And
Application. Int J Biomed Res. 2010;1(5):81-97.
80. Mullis KB. Recombinant DNA Technology and molecular cloning. Scientific American.
1990; 262 (36).
81. Bisht SS, Panda AK. DNA Sequencing: Methods and Applications. (Anjana M, ed.) Rijeka,
Croatia: InTech; 2013
82. Hartman B TA. Altered Penicillin-Binding Proteins In Methicillin-Resistant Strains Of
Staphylococcus Aureus. Antimicrob Agents Chemother. 1981;19:726-735.
83. Djahmi N, Messad N, Nedjai S, et al. Molecular epidemiology of staphylococcus aureus
strains isolated from inpatients with infected diabetic foot ulcers in an Algerian University
Hospital. Clin Microbiol Infect. 2013;19(9):E398-E404.
84. Abbas ZG, Archibald LK. Epidemiology of the diabetic foot in Africa. Med Sci Monit.
2005;11(8):RA262-70.
85. Kengne AP, Choukem SP, Dehayem YM, Simo NL, Fezeu LL MJ. Diabetic foot ulcers in
Cameroon: can microflora prevalence inform probabilistic antibiotic treatment? J Wound
Car. 2006;15(8):363-366.
86. Verla TG. Diabetes Related Amputations in the North West Region of Cameroon. :1-11.
87. Essoh JBS, Kodo M, Djè VDB, Lambin. Limb amputations in adults in an Ivorian Teaching
Hospital. Niger J Clin Pract. 2009;12(3):245-247.
88. Nwosu C, Babalola MO, Ibrahim MH, Suleiman SI. Major limb amputations in a tertiary
hospital in North Western Nigeria. Afr Health Sci. 2017;17(2):508-512.
89. Dabkana TM, Nyaku FT, Bwala ST. Udeabor SE, Adisa AO, Orlowska A, Sader RA,
Ghanaati S. Tumor-associated macrophages, angiogenesis, and tumor cell migration in oral
squamous cell carcinoma. Annals of African medicine. 2017 Oct;16(4):181. 2018;17(1):22-

65
25.
90. Rooh Ul M, Ahmed M, Griffin S. Evaluation and management of diabetic foot according to
Wagner’s classification. A study of 100 cases. J Ayub Med Coll Abbottabad JAMC.
2003;15(3):39-42.
91. Adam MA, Hamza, AA, & Ibrahim A. Diabetic Septic Foot in Omdurman Teaching
Hospital. Sudan J Med Sci. 2009;4(2):129-132.
92. Sibanda M SE& JK. A prospective evaluation of lower extremity ulcers in a Zimbabwean
population. Int Wound J. 2009;6(5):361-366.
93. Naraynsingh V, Singh M, Raindass MJ et al. Major lower limb amputations in Trinidad; a
retrospective analysis (Amputations). Diabet Foot. 2002;5.
94. Muyembe VM, Muhinga MN. Major limb amputation at a Provincial General Hospital in
Kenya. East Afr Med J. 1999;76(3):163-166.
95. Awori KO, Atinga JEO. Lower limb amputations at the Kenyatta National Hospital,
Nairobi. East Afr Med J. 2007;84(3):121-126.
96. Ogeng’O JA, Obimbo MM, King’Ori J. Pattern of limb amputation in a Kenyan rural
hospital. Int Orthop. 2009;33(5):1449-1453.
97. Obimbo MM, Ogeng’o J A & NS. Diabetes Related Amputation in a Rural African
Population: Kenyan Experience. J Diabet Foot Complicat. 2010;2(1):6-11.
98. Foryoung JB, Ditah C, Nde Fon P, et al. Long-term mortality in outpatients with type 2
diabetes in a reference hospital in Cameroon: A retrospective cohort study. BMJ Open.
2018;8(2):1-7.
99. Muthuuri JM. Characteristics of patients with diabetic foot in Mombasa, Kenya. East Afr
Med J. 2007;84(6):251-258.
100. Adeloye D, Ige JO, Aderemi A V., et al. Estimating the prevalence, hospitalisation and
mortality from type 2 diabetes mellitus in Nigeria: A systematic review and meta-analysis.
BMJ Open. 2017;7(5):1-16.
101. Al-Rubeaan K, Almashouq MK, Youssef AM, et al. All-cause mortality among diabetic
foot patients and related risk factors in Saudi Arabia. PLoS One. 2017;12(11):1-15.
102. Shankhdhar K. A Case Report: Offloading the diabetic foot wound in the developing world.
J Diabet Foot Complicat. 2011:26-29.
103. Udwadia TE. Ghee and Honey Dressing for Infected Wounds. Indian J Surg.

66
2011;73(4):278-283.
104. Houreld NN. Healing of Diabetic Ulcers Using Photobiomodulation. Photomed Laser Surg.
2015;33(5):237-239.
105. Nteleki B, Abrahamse H, Houreld NN. Conventional podiatric intervention and
phototherapy in the treatment of diabetic ulcers. Semin Vasc Surg. 2015;28(3-4):172-183.
106. Costa FJMD, Neto VFA, Neto RM GR. Use Of Maggot Therapy For Treating A Diabetic
Foot Ulcer Colonized By Multidrug Resistant Bacteria In Brazil. Indian J Med Res.
2015;141(March):340-342.
107. Shigidi M, Abdelgafar H, Taha ES. Awareness regarding diabetes control and diabetic
nephropathy among Sudanese adults admitted with diabetic foot: A cross-sectional study.
Pan Afr Med J. 2013;16:1-6.
108. Edmonds ME, Blundel MP, Moris MS et al. Improved survival of diabetic foot ulcers;
impact of a foot clinic. QJ Med. 1986:763-771.
109. Kiberenge MW, Ndegwa ZM, Njenga EW, Muchemi EW. Knowledge, attitude and
practices related to diabetes among community members in four provinces in Kenya: a
cross-sectional study. Pan Afr Med J. 2010;7:2.
110. Goie TT & Naidoo M. Awareness of diabetic foot disease amongst patients with type 2
diabetes mellitus attending the chronic outpatients department at a regional hospital in
Durban, South Africa. Afr J Prim Heal Care Fam Med. 2016;8(1):e1-e8.
111. Obirikorang Y, Obirikorang C, Anto EO, et al. Knowledge of complications of diabetes
mellitus among patients visiting the diabetes clinic at Sampa Government Hospital, Ghana:
A descriptive study. BMC Public Health. 2016;16(1):1-8.
112. Isiguzo CM J-OC. Diabetic Foot Ulcers -12 Months Prospective Review Of Pattern Of
Presentation At Enugu State University Of Technology Teaching Hospital, Parklane,
Enugu: A Basis For Diabetic Foot Clinic? Niger J Med. 2015;24(2):125-130.
113. Litzelman DK. Reduction of Lower Extremity Clinical Abnormalities in Patients with Non-
Insulin-Dependent Diabetes Mellitus. Ann Intern Med. 1993;119(1):36.
114. Allen ML, Van der Does AMB, Gunst C. Improving diabetic foot screening at a primary
care clinic: A quality improvement project. African J Prim Heal care Fam Med.
2016;8(1):e1-e9.
115. Mwavua SM, Ndungu EK, Mutai KK et al. A comparative study of the quality of care and

67
glycemic control among ambulatory type 2 diabetes mellitus clients, at a Tertiary Referral
Hospital and a Regional Hospital in Central Kenya. BMC Res Notes. 2016;9:12.
116. Fabiny DL & Eringhausen G. No Title. Clin Chim. 1971;17:696.
117. Cheesbrough M. District Laboratory Practice Manual in Tropical Countries. Part 2.
Cambridge University Press; 2000.
118. Pereira EM, Schuenck RP, Malvar KL et al. Staphylococcus aureus, Staphylococcus
epidermidis and Staphylococcus haemolyticus: methicillin-resistant isolates are detected
directly in blood cultures by multiplex PCR. Microbiol res. 2010;165:243-249.
119. Hopman J, Peraza GT, Espinosa F, Klaassen CH, Velázquez DM, Meis JF VA. USA300
Methicillin-resistant Staphylococcus aureus in Cuba. Antimicrob Resist Infect Control.
2012;1(1):2.
120. Achieng L, Menge T OE. The KNH Guide To Empiric Antibiotic Therapy, Kenyatta
National Hospital. Second Edi. Nairobi, Kenya; 2018.
121. Zhang P, Lu J, Jing Y, Tang S, Zhu D, Bi Y. Global epidemiology of diabetic foot
ulceration: a systematic review and meta-analysis†. Ann Med. 2017;49(2):106-116.
122. Muriithi MK. The Determinants of Health-Seeking Behaviour in a Nairobi Slum, Kenya.
Eur Sci J. 2013;9(4 ISSN):1857-7881.
123. Rani V & Nithyalakshmi JA. Comparative Study Of Diabetic And Non-Diabetic Wound
Infections With Special Reference To MRSA And ESBL. Int J Curr Microbiol App Sci.
2014;3(12):546-554.
124. No Title. Microbe Wiki. https://microbewiki.kenyon.edu/index.php/Citrobacter_freundii.
Published 2011. Accessed September 1, 2018.

68
8. Chapter Eight: Appendix
8.1 Informed Consent Form (English Version)
PATIENT STUDY NUMBER _______________ PATIENT INITIALS____________
Introduction
My name is Dr. Daniel Munyambu Mutonga, a finalist student in Masters of Science in Tropical
and Infectious Diseases. I am conducting a study on:
Isolation, sensitivity patterns and molecular characterisation of bacterial isolates from
infected diabetic foot ulcers in patients at Kenyatta National Hospital.
I would like to invite you to participate in this study.
Type of Research Intervention
This study entails looking at the type of bacteria that infect diabetic foot ulcers in patients at
Kenyatta National Hospital and their sensitivity to commonly used antibiotics.
After enrollment of this study, information about your condition including age, gender, residence,
type of diabetes, current medications, and about the diabetic foot ulcers will be noted and filled up
in this questionnaire. Your height, weight and blood pressure readings will also be recorded.
With your permission, we will clean your diabetic wound and collect samples from the wound
which we shall send to the laboratory for identification of bacteria and antibiotic sensitivity tests.
We will also collect blood samples to check your blood sugar level, cholesterol levels and kidney
function. These tests will help your doctor manage your diabetic condition better.
Participation in this study
Participation in this study is voluntary and you can withdraw your participation at any time even
after signing the consent. Refusal to participate in this study will not result in any penalty or loss
of rights to good medical care. I assure you that the information collected will remain confidential.
You can ask any other questions appertaining to assessment and treatment and this will be availed
to you at any time.
Purpose of Study
We want to find out the types of bacteria that infect diabetic foot ulcers and their sensitivity to
commonly used antibiotics. The study will help us manage diabetic foot infections better. From
this study, we will also be able to make recommendations for better treatment of the diabetic foot
infection.

69
The results of this study will be published as a book (thesis) and in a Medical Journal. The results
will also serve as information for teaching purposes. Results will be made available to the
community for better understanding of this illness.
We will inform you on the results and make these available to the healthcare giver at Medical
Ward and the Diabetes Outpatient Clinic for better follow up. We assure you that we will NOT
use your name anywhere in the presentation of these results.
Cost
No added costs will be incurred to the patient other than those of routine laboratory tests.
Duration of participation
Every participant will be enrolled only once but the study will take place over a 4-month period at
the Diabetic Out-patient Clinic or in the Medical or Surgical Wards.
Risks and Benefits
While participating in this study, you will not be exposed to any risks and you will not incur any
losses. About 5mls of blood will be drawn from you for blood sugar levels, blood cholesterol
levels, kidney function and liver function tests only. A mildly unpleasant sensation may be felt
during collection of a blood sample (for a few seconds). Your wound will also be cleaned during
the collection of a wound sample and you may feel an unpleasant sensation.
Participants Declaration
Just as an indication that you have agreed to participate in this study, kindly sign below,
I, _____________________________________________ hereby agree to participate in this study
being carried out by DR DANIEL MUNYAMBU MUTONGA, the nature of which has been
explained to me. I have understood the purpose of this study and my questions have been answered
satisfactorily by Dr Daniel Munyambu Mutonga.
Signed (Patient): _______________________________________
Signed (PI): _______________________________________
Date: _____________________________
Whom to Contact:

70
If you have any queries about this study, please feel free to contact the persons underlisted
now or at any time.
Dr. Daniel Munyambu Mutonga 0711 899684
Dr. Marianne Mureithi 0703 704711
Prof. C. F. Otieno 0722 752558
Dr. Nancy Ngugi 0722 788533
The Secretary
KNH-UoN Ethics and Research Committee
Tel: 2726300, Ext 44102
Email: [email protected]

71
8.2 Informed Consent form (Swahili version)
PATIENT STUDY NUMBER _______________ PATIENT INITIALS____________
KUHUSU IDHINI
Mimi ni Daktari Danieli Munyambu Mutonga na mimi ni mkufunzi katika Chuo Kikuu cha
Nairobi. Ninatekeleza utafiti kuhusu:
Viambukizi katika vidonda vya nyayo kwa wale wenye ugongjwa wa kisukari (diabetes)
katika hospitali kuu ya Kenyatta
Ningependa kukusajilisha katika utafiti huu.
Sababu za Kufanya Utafiti
Utafiti huu utatusaidia kujua viambukizi vinavyopatikana katika vidonda vya nyayo za wale wenye
ugonjwa wa kisukari na madawa yanayofanya kazi kuua viini hivi.
Matokeo ya utafiti huu yatachapishwa katika kitabu ili kuwaelimisha wakufunzi wengine na wale
wanaopatiana huduma katika Kiliniki ya Wagonjwa wa Sukari. Tutakueleza matokeo ya utafiti
huu na pia kumueleza muuguzi wako ili akuhudumie vilivyo. Tunakuhakikishia ya kuwa
hatutatchapisha jina lako popote katika dodoso letu.
Mambo tutakayofanya
Baada ya kujisajilisha katika utafiti huu, tutachukua historia yako kuhusu umri, jinsia, kimo, urefu,
makao, aina ya ugonjwa wa kisukari, madawa unayotumia, na kuhusu kidonda cha nyayo.
Tutaaandika majibu yako katika dodoso hii. Kwa idhini yako, tutasafisha kidonda chako na
kuchukua sampuli ambayo tutapeleka kwenye maabara yetu ili kufanya vipimo. Tungependa pia
kuchukua sampuli ya damu ili kupima kiwango cha sukari na mafuta kweye damu, na pia hali ya
figo. Vipimo hivi vitamwezesha dakatari wako kukutibu vilivyo.
Manufaa Ya Kuhusika
Manufaa ya utafiti huu ni kuwaelezea madaktari kuhusu viambukizi vya vidonda katika nyayo za
wagognjwa wa kisukari na dawa zenye nguvu zaidi. Mapendekezo ya utafiti huu yatasaidia
kuboresha huduma wanazozipata wagonjwa wa kisukari.
Mbali na hayo, tutachukua kipimo cha damu, itakayotuonyesha kiwango cha sukari kwa miezi
mitatu iliopita, kipimo cha mafuta kwenye damu, na pia hali ya figo
Madhara Ya Kuhusika

72
Hakuna madhara yoyote yatakayotokana na kuhusika katika utafiti huo. Unaeza kuhisi uchungu
kidogo kutokana na sindano wakati wa kutolewa damu. Uchungu huu ni sawa na ule unaosikika
wakati unapotolewa damu kwa vipimo vingine. Kiwango cha damu ni mililita tatu pekee.
Gharama
Hakuna gharama yoyote ya ziada kwa wewe ambaye umekubali kupatiana idhini isipokua kwa
vipimo vya kawaida ambavyo daktari wako atakavyoagiza.
Idhini ya kuhusika
Kuhusika kwako katika utafiti huu ni kwa hiari yako, na unaeza kujiondoa wakati wowote hata
baada ya kupatiana idhini yako. Matibabu yanayostahili yatapewa kwa watu wote wahusika na
wanaokataa kujihusisha na utafiti huu hawatabaguliwa kwa njia yoyote ile.
Sahihi (Mhusika)________________ Sahihi (Mtafiti)_______________
Tarehe ________________________ Tarehe ________________
Mawasiliano:
Ijapo uko na maswali ama mapendekezo, kuwa huru na utuelezee kwa namba hizo zilizoandikwa.
Dr. Daniel Munyambu Mutonga 0711 899684
Dr. Marianne Mureithi 0703 704711
Prof. C. F. Otieno 0722 752558
Dr. Nancy Ngugi 0722 788533
The Secretary
KNH-UoN Ethics and Research Committee
Tel: 2726300, Ext 44102
Barua pepe: [email protected]

73
8.3 Data Collection Form

74

75

76

77

78

79

80
8.4 Time Plan
***Ethical Approval was obtained as planned in February, 2018. The Study started in September,
2017 as planned. However, due to ongoing strikes at the hospital and other disruptions, the study
was concluded in August, 2018. Data analysis, write-up of Results, Discussions and editing the
Thesis took place between August and September, 2018.
PROPOSAL
SUBMISSION
ETHICS
APPROVAL
STUDY
DATA
ANALYSIS
RESULTS &
DISCUSSION
WRITEUP
OCT
2016
NOV –
DEC 2016
FEB
2017
MARCH –
JUNE 2017
JULY
2017
PLANNING
AUG –
SEP
2017

81
8.5 Flow Chart
This is the flow-chart that was anticipated at the beginning of the study. We surpassed the
sample size. The actual Flow-chart can be reviewed on page.

82
8.6 Budget
8.6.1 BUDGET FORM
COMPONENTS UNIT OF
MEASURE
DURATION/
NUMBER
COST
(KSHS)
TOTAL
(KSHS)
Personnel
Research Assistant 1 13 1,500.00 19,500.00
Statistician 30,000.00
Transcribing Fees -
Subtotal 49,500.00
Printing
Consent Form 1 4 10.00 40.00
Assent Form -
Questionnaires 1 6 10.00 60.00
Interview Guide -
Final Report 1 100 10.00 1,000.00
Subtotal 1,100.00
Photocopying
Consent Form 85 4 3.00 1,020.00
Assent Form -
Questionnaires 85 6 3.00 1,530.00
Interview Guide
Final Report 5 100 3.00 1,500.00
Final Report Binding 6 1 500.00 3,000.00
Subtotal 7,050.00
Laboratory
Wound Swab Culture &
Sensitivity
74 1 1,200.00 88,800.00
PCR 50 1 3,000.00 150,000.00
Subtotal 238,800.00
-
Other Costs
ERC Fees 2,000.00

83
Records Access Fees 1,500.00
Box File 2 1 250.00 500.00
Pens 5 1 25.00 125.00
Subtotal 4,125.00
TOTAL 300,575.00
8.6.2 BUDGET JUSTIFICATION
We anticipated to enrol six participants per day. To attain the sample size of 74 participants, we
expected to therefore take 13 days. Daily allowance for the assistants was Ksh. 1500.00. However,
do to the prolonged nature of the study, we worked with the assistant for an additional 21 days at
the same rate and then the Principal investigator proceeded on his own.
We printed consent forms, questionnaires and final reports once and made photocopies as required.
We will made extra copies of the questionnaires and consent forms to take care of any damage or
loss to the forms.
Laboratory Wound swabs culture and sensitivity was conducted at KNH Microbiology laboratory
at the quoted price. Real-time PCR test for S.aureus DNA, and MRSA DNA (genes mecA) was
not available at the KNH Microbiology laboratory. Therefore, we procured services from Bio-zeq
Kenya Ltd., which runs the molecular laboratory at Kenya AIDS Vaccine Initiative-Institute for
Clinical Research (KAVI-ICR), University of Nairobi.
We obtained medical records of patients to obtain data on the progress of their wounds following
treatment and give back results of the microbiology tests done.
The principal investigator and research assistant used procured stationery for data entry and storage
of paper records.
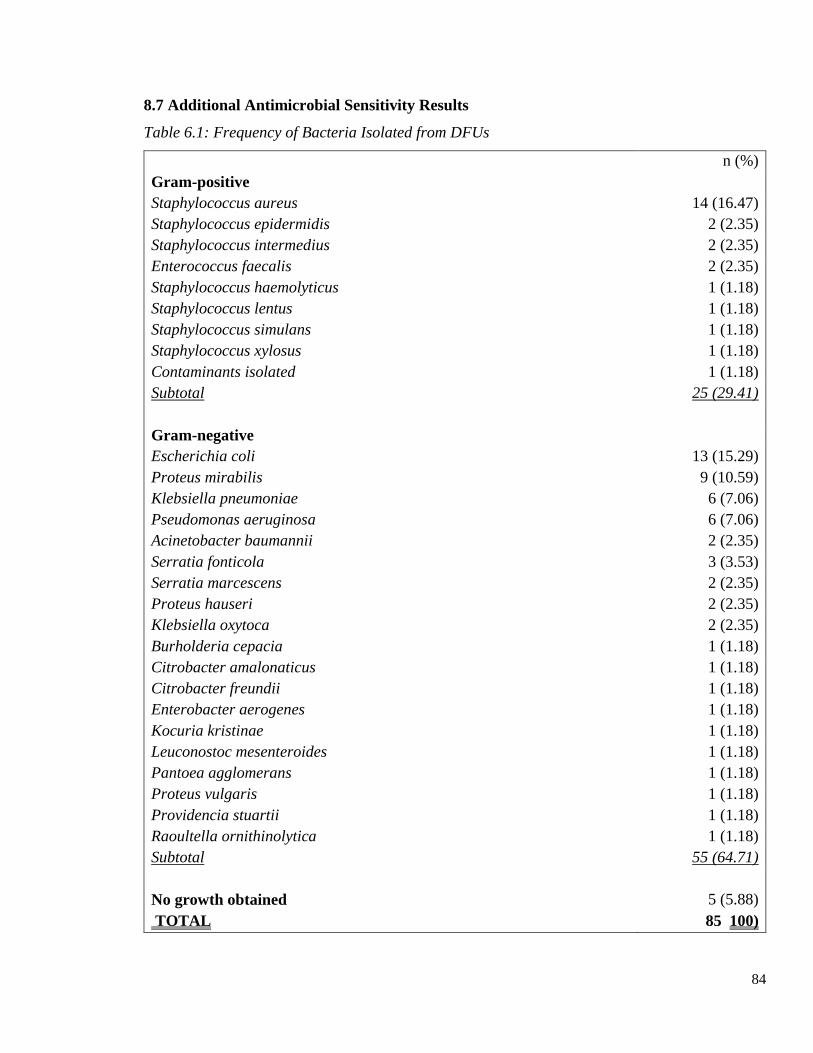
84
8.7 Additional Antimicrobial Sensitivity Results
Table 6.1: Frequency of Bacteria Isolated from DFUs
n (%)
Gram-positive
Staphylococcus aureus 14 (16.47)
Staphylococcus epidermidis 2 (2.35)
Staphylococcus intermedius 2 (2.35)
Enterococcus faecalis 2 (2.35)
Staphylococcus haemolyticus 1 (1.18)
Staphylococcus lentus 1 (1.18)
Staphylococcus simulans 1 (1.18)
Staphylococcus xylosus 1 (1.18)
Contaminants isolated 1 (1.18)
Subtotal 25 (29.41)
Gram-negative
Escherichia coli 13 (15.29)
Proteus mirabilis 9 (10.59)
Klebsiella pneumoniae 6 (7.06)
Pseudomonas aeruginosa 6 (7.06)
Acinetobacter baumannii 2 (2.35)
Serratia fonticola 3 (3.53)
Serratia marcescens 2 (2.35)
Proteus hauseri 2 (2.35)
Klebsiella oxytoca 2 (2.35)
Burholderia cepacia 1 (1.18)
Citrobacter amalonaticus 1 (1.18)
Citrobacter freundii 1 (1.18)
Enterobacter aerogenes 1 (1.18)
Kocuria kristinae 1 (1.18)
Leuconostoc mesenteroides 1 (1.18)
Pantoea agglomerans 1 (1.18)
Proteus vulgaris 1 (1.18)
Providencia stuartii 1 (1.18)
Raoultella ornithinolytica 1 (1.18)
Subtotal 55 (64.71)
No growth obtained 5 (5.88)
TOTAL 85 100)

85
Table 6.2: Gram-positive Antibiotic Sensitivity Results
Ent
eroc
occ
us
faec
alis
Staphylococcus
aureus
Staphyloco
ccus
epidermidis
Staphylo
coccus
intermed
ius
Staphyloc
occus
simulans
1 2 1 2 3 4 5 1 2 3 4 5 1 2 3 4 1 2 3 5
Benzylpenicillin 0 1
2 0 0 0 0 2 0 0 0 0 2 0 0 0 1 0 0
BetaLactamase 0 0 1 0 0 0 0 0 1 0 0 0 0
Cefoxitin 0 0 0 0 0 0 0 0 0 0 0 0 0 0 0 0 0 0
CefoxitinScreen 0 0 6 0 0 0 0 0 1 0 0 0 0 0
Clindamycin 0 1 9 2 0 0 1 2 0 0 0 0 1 1 0 0 1 0 0 0
Erythromycin 0 1 9 3 0 0 0 2 0 0 0 0 1 1 0 0 1 0 0 0
Fosfomycin 5 0 0 0 0 1 0 0 0 0
Fusidicacid 6 0 0 0 0 1 0 0 0 0 1 0 0 0
Gentamicin 12 0 0 0 0 2 0 0 0 0 2 0 0 0 1 0 0 0
InducibleClindamycinResistance 0 0
1
1 1 0 0 0 1 0 0 0 0 2 0 0 0 1 0
Levofloxacin 1 0 11 0 0 0 0 1 0 0 0 1 2 0 0 0 1 0 0 0
Linezolid 1 0 12 0 0 0 0 2 0 0 0 0 1 0 0 0 1 0 0 0
Moxifloxacin 10 0 0 0 0 1 0 0 0 0 1 0 0 0 1 0 0 0
Mupirocin 5 0 0 0 0 1 0 0 0 0
Nitrofurantoin 6 0 0 0 0 1 0 0 0 0
Oxacillin 6 0 0 0 0 0 1 0 0 0 1 0 0 0
Rifampicin 3 0 0 0 3 0 0 0 0 1 0 0 0 1
Teicoplanin 1 0 12 0 0 0 0 2 0 0 0 0 1 1 0 0 1 0 0 0
Tetracycline 0 1 8 2 0 0 0 1 1 0 0 0 1 1 0 0 0 1 0 0
Tigecycline 1 0 7 0 0 0 0 1 0 0 0 0 2 0 0 0 1 0 0 0
Tobramycin 10 1 0 0 0 1 0 0 0 0 1 0 0 0 1 0 0 0
TrimethoprimSulfamethoxazole 0 1 3 7 0 0 0 0 1 0 0 0 1 1 0 0 1 0 0 0
Vancomycin 1 0 12 0 0 0 0 2 0 0 0 0 1 1 0 0 1 0 0 0

86
Table 6.3: Gram-negative Antibiotic Sensitivity Results
Acinetobact
er
baumannii
Burholder
ia cepacia
Citrobacter
amalonatic
us
Citrobacter
freundii
Enterobact
er
aerogenes
Escherichia
coli
2 1 2 1 2 1 2 5 1 2 1
Amikacin 0 0 1 1 0 0 0 1 1 0 11
AmoxicillinClavulanicAcid 0 0 0 1 0 0 1 0 0 1 5
Ampicillin 0 0 0 0 0 0 1 0 0 0 0
AmpicillinSulbactam 1 0 0 0 0 0 0 0 0 0 3
Aztreonam 0 0 0 0 0 0 0 0 0 1 2
Cefazolin 1 0 0 0 0 0 1 0 0 1 0
Cefepime 1 0 1 1 0 0 1 0 0 1 2
Cefotaxime 1 0 1 1 0 0 1 0 0 1 2
Cefoxitin 0 0 0 0 0 0 0 0 0 0 3
Ceftazidime 1 0 1 1 0 0 0 1 0 1 2
Ceftriaxone 1 0 1 1 0 0 1 0 0 1 2
Cefuroxime 0 0 0 0 1 0 1 0 0 1 1
CefuroximeAxetil 0 0 0 0 0 0 0 0 0 1 0
Ciprofoxacin 1 1 0 1 0 0 1 0 1 0 8
Gentamicin 1 1 0 1 0 0 1 0 1 0 11
Meropenem 1 0 1 1 0 1 0 0 1 0 8
Nitrofurantoin 0 0 0 0 0 0 0 0 0 0 7
PiperacillinTazobactam 1 0 1 1 0 0 1 0 1 0 4
TrimethoprimSulfamethoxa
zole 1 0 0 1 0 0 1 0 0 1 0

87
Table 6.4: Comparing means for MDROs and none-MDROs
MDROs mean (SD) None MDROs mean (SD) p Value
Age (years)
60.30
(12.88) 61.25 (10.65) 59.22 (12.98) 0.481 NS
RBS (mmol/L)
14.12
(11.03) 10.65 (6.30) 11.06 (5.84) 0.813 NS
HbA1c (%)
8.40
(2.29) 8.69 (2.68) 9.97 (3.86) 0.322 NS
Urea (mmol/L)
12.05
(10.58) 18.425 (26.00) 9.355 (9.15) 0.101 NS
Creatinine (mmol/L)
147.53
(74.06) 172.76 (97.61) 155.12 (136.50) 0.623 NS
Table 6.5: Comparing means within and between Outcome Groups
p Value
Age (years) 0.105
RBS (mmol/L) 0.414
HbA1c (%) 0.757
Urea (mmol/L) 0.867
Creatinine (mmol/L) 0.613

88
Table 6.6: Comparing proportions across Outcome Groups
Total
Compl
ete
Healin
g
Ongoi
ng
healin
g
Non-
healin
g
Major
Surger
y
Minor
Surger
y
Mortali
ty
p
valu
e
Sex Male 16
(44.44)
4
(57.1)
5
(45.5)
5
(55.6) 0 (0.0)
2
(50.0) 0 (0.0)
0.45
3 Fema
le
20
(55.56)
3
(42.9)
6
(54.5)
4
(44.4)
1
(100.0)
2
(50.0)
4
(100.0)
Residence
Urba
n
19
(55.88)
4
(57.1)
7
(77.8)
3
(33.3) 0 (0.0)
3
(75.00
2
(50.0) 0.39
7
Rural
15
(44.12)
3
(42.9)
2
(22.2)
6
(66.7)
1
(100.0)
1
(25.0)
2
(50.0)
Smoking
habits
Yes
9
(29.03)
1
(16.7)
5
(50.0)
1
(16.7) 0 (0.0)
1
(25.0)
1
(25.0) 0.44
6
No
22
(70.97)
5
(83.3)
5
(50.0)
5
(83.3)
1
(100.0)
3
(75.0)
3
(75.0)
Alcohol
Intake
Yes
13
(41.94)
2
(33.3)
6
(60.0)
3
(50.0) 0 (0.0)
1
(25.0)
1
(25.0) 0.38
4
No
18
(58.06)
4
(66.7)
4
(40.0)
3
(50.0)
1
(100.0)
3
(75.0)
3
(75.0)
Table 6.7: Wagner Staging Type RIGHT FOOT and selected parameters
Wagner Stage 0 1 2 3 4 5
SBP (mmHg)
128.0
0
148.83
(37.12)
129.36
(28.19)
133.00
(23.152)
133.875
(24.76)
119.0
0
DBP (mmHg) 89.00
89.17
(23.25)
76.29
(16.14) 79.5 (11.40)
71.75
(15.30) 69.00
RBS (mmol/L)
11.10
00 12.96 (8.67) 9 (2.93) 9.97 (4.35) 13.31(8.27)
HbA1c (%) 8.8000 9.33 (3.58) 8.55 (1.91) 8.71 (0.96)
Urea
(mmol/L) 10.22 (7.88)
14.52
(12.14)
19.27
(35.57) 16.5 (29.54)
6.400
0
Creat
(mmol/L)
153.5
(79.54)
221.13
(159.08)
210.12
(196.49)
130.25
(51.95)
67.00
00
T. Chol
(mmol/L) 4.57 (1.19) 3.06 (0.81) 3.66(1.77) 4.60 (0.76)
TGs (mmol/L) 1.58 (0.71) 1.74 (0.80) 1.19 (0.31) 1.65 (0.13)
HDL-C
(mmol/L) 1.4 (0.84) 0.85 (0.47) 0.87 (0.25) 1.10(0.16)

89
LDL-C
(mmol/L) 2.48 (0.89) 1.43 (0.36) 1.34 (0.90) 1.96 (0.85)
Table 6.8: Wagner Staging Type LEFT FOOT and selected parameters
Wagner Stage 1 2 3 4 5
SBP (mmHg)
163.46
(36.41) 133.2 (24.09)
118.14
(18.00) 131 (32.91)
139.5
(28.99)
DBP (mmHg) 89.69 (17.85) 83.1 (9.68)
80.14
(14.42)
75.33
(26.50) 85.50
RBS (mmol/L) 10.63 (8.65) 9.12 (4.67) 14.33 (8.78) 8.9 (4.81) 14.4000
HbA1c (%) 8.47 (0.85) 10.58 (6.58) 8.5 (1.76)
Urea (mmol/L) 12.24 (10.03) 15.22 (14.71)
14.16
(18.51) 9.55 (5.89) 6.75 (0.50)
Creat (mmol/L)
204.92
(117.10)
235.63
(241.97)
125.72
(57.65)
157.53
(52.29) 79 (16.97)
T. Chol
(mmol/L) 4.12 (1.03) 4.18 (1.66) 3.045 (1.62) 2.5600
TGs (mmol/L) 1.788 (0.79) 1.84 (0.83) 1.45 (0.37) 2.5600
HDL-C
(mmol/L) 1.17 (0.19) 1.01 (0.37) 1.03 (0.318) .6200
LDL-C
(mmol/L) 2.13 (1.02) 1.77 (1.00) 1.54 (0.049) 0.9
Table 6.9: RIGHT FOOT – Location of Foot Ulcer
Site Male Female
Forefoot 10 (52.6) 15 (50.0)
Midfoot 0 (0.0) 7 (23.3)
Hindfoot 8 (42.1) 3 (10.0)
Forefoot and Midfoot 1 (5.3) 3 (10.0)
Forefoot and Hindfoot 0 (0.0) 0 (0.0)
Midfoot and Hindfoot 0 (0.0) 1 (3.3)
Whole Foot 0 (0.0) 1 (3.3)

90
Table 6.10: LEFT FOOT – Location of Foot Ulcer
Site Male Female
Forefoot 11 (50.0) 13 (61.9)
Midfoot 0 (0.0) 2 (9.5)
Hindfoot 11 (50.0) 5 (23.8)
Forefoot and Midfoot 0 (0.0) 0 (0.0)
Forefoot + Hindfoot 0 (0.0) 0 (0.0)
Midfoot +Hindfoot 0 (0.0) 0 (0.0)
Whole Foot 0 (0.0) 1 (4.8)

91
8.8 Images of Diabetic Foot
4 3 5
6 7

92
KEY:
3 – Neuropathic ulcer, midfoot Wagner Stage 1
4 – Forefoot ulcer Wagner Stage 0
5 – Healing Hindfoot Ulcer Stage 1
6 – Wagner Stage 5
7 - Ischaemic ulcer Wagner Stage 0
8 – Wagner Stage 4
9 – Midfoot ulcer Wagner Stage 2
10 – Midfoot ulcer Wagner Stage 2
9
10
00
8

93
8.9 Ethical Approvals

94

95