issn: 1683-1489 mekong river...
TRANSCRIPT

Mekong River Commission
Report on the 2006 biomonitoring survey of the lower Mekong River and
selected tributaries
MRC Technical Paper No. 22
July 2009
Meeting the Needs, Keeping the Balance
ISSN: 1683-1489

Mekong River Commission
Report on the 2006 biomonitoring survey of the lower Mekong River and
selected tributaries
MRC Technical Paper No. 22
July 2009

ii
Published in Vientiane, Lao PDR in July 2009 by the Mekong River Commission
Cite this document as:
Chanda VONGSOMBATH, PHAM Anh Duc, NGUYEN Thi Mai Linh, Tatporn KUNPRADID, Supatra Parnrong DAVISON, Yuwadee PEERAPORNPISAL, SOK Khom, MENG Monyrak (2009) Report on the 2006 biomonitoring survey of the lower Mekong River and selected tribu-taries, MRC Technical Paper No. 22. Mekong River Commission, Vientiane. 124 pp.
The opinions and interpretation expressed within are those of the authors and do not necessarily reflect the views of the Mekong River Commission.
Editors: B.C. Chessman, V.H. Resh and T.J. Burnhill
Graphic design: T.J. Burnhill
© Mekong River Commission 184 Fa Ngoum Road, Unit 18, Ban Sithane Neua, Sikhottabong District, Vientiane 01000, Lao PDR Telephone: (856-21) 263 263 Facsimile: (856-21) 263 264 E-mail: [email protected] Website: www.mrcmekong.org

iii
Table of contents
Summary .................................................................................................................................... xix
1. Introduction ...............................................................................................................................1
2. Sampling sites and programme .................................................................................................3
3. Calculation of tolerance scores and development of biological indices of stress ...................153.1 Introduction ..................................................................................................................153.2 Methods ........................................................................................................................15
4. Environmental variables .........................................................................................................194.1 Introduction ..................................................................................................................194.2 Study sites and sampling methods ................................................................................194.3 Results ..........................................................................................................................204.4 Discussion.....................................................................................................................23
5. Benthic diatoms .....................................................................................................................255.1 Introduction ..................................................................................................................255.2 Study sites and sampling methods ................................................................................255.3 Results .........................................................................................................................275.4 Discussion.....................................................................................................................31
6. Zooplankton ............................................................................................................................336.1 Introduction ..................................................................................................................336.2 Study sites and sampling methods ................................................................................336.3 Results ..........................................................................................................................356.4 Discussion.....................................................................................................................40
7. Littoral macroinvertebrates .....................................................................................................417.1 Introduction ..................................................................................................................417.2 Study sites and sampling methods ................................................................................417.3 Results ..........................................................................................................................437.4 Discussion.....................................................................................................................49
8. Benthic macroinvertebrates ....................................................................................................518.1 Introduction ..................................................................................................................518.2 Study sites and sampling methods ................................................................................518.3 Results .........................................................................................................................538.4 Discussion.....................................................................................................................58

iv
9. Overall results and discussion.................................................................................................619.1 Relationship between environmental parameters and ATSPT ......................................619.2 Tolerance values for the fauna ......................................................................................619.3 Variability of ATSPT values over the three sampling years .........................................629.4 Rating of sampling sites ...............................................................................................64
10. General conclusions ................................................................................................................67
11. References ...............................................................................................................................69
Appendix 1.1 Diatoms species list and abundance ...................................................................73
Appendix 1.2 Diatoms tolerance score .....................................................................................77
Appendix 1.3 Diatom metrics ...................................................................................................81
Appendix 2.1 Zooplankton species list and abundance ............................................................83
Appendix 2.2 Zooplankton tolerance score ..............................................................................89
Appendix 2.3 Zooplankton metrics ...........................................................................................95
Appendix 3.1 Littoral macroinvertebrates species list and abundance .....................................97
Appendix 3.2 Littoral macroinvertebrates tolerance scores ...................................................103
Appendix 3.3 Littoral macroinvertebrates metrics .................................................................111
Appendix 4.1 Benthic macroinvertebrates species list and abundance ..................................113
Appendix 4.2 Benthic macroinvertebrates tolerance scores ...................................................121
Appendix 4.3 Benthic macroinvertebrates metrics .................................................................125

v
Table of Figures
Figure 2.1. Location of the sites sampled during the 2004, 2005, and 2006 biomonitoring surveys. ......................................................................................................................5
Figure 2.2. Location of the sites sampled during the 2004 biomonitoring survey. .....................6
Figure 2.3. Location of the sites sampled during the 2005 biomonitoring survey. .....................7
Figure 2.4. Location of the sites sampled during the 2006 biomonitoring survey. .....................8
Figure 3.1. Illustration of the calculation of ATSPT ..................................................................18
Figure 4.1. Dissolved oxygen concentration (mg/L) and temperature (°C) at the water surface, based on averages of measurements taken at the left bank, right bank, and centre of the channel at 21 sites sampled in 2006. .................................................................21
Figure 4.2. Conductivity (µS/cm) and pH at the water surface, based on averages of measurements taken at the left bank, right bank, and centre of the channel at 21 sites sampled in 2006. .............................................................................................22
Figure 5.1 Values of the diversity index (H’) and dominance index (D) for benthic diatoms at 21 sites in 2006. .......................................................................................................29
Figure 5.2 Regression relationship between taxonomic richness of benthic diatoms and the Average Site Disturbance Score for sites sampled in 2004, 2005 and 2006. ..........30
Figure 5.3 Regression relationship between abundance of benthic diatoms and the Average Site Disturbance Score for sites sampled in 2004, 2005 and 2006. ........................30
Figure 5.4 Regression relationship between the Shannon-Wiener diversity index for benthic diatoms and the Average Site Disturbance Score for sites sampled in 2004, 2005 and 2006. .................................................................................................................30
Figure 5.5 Regression relationship between the Berger-Parker dominance index for benthic diatoms and the Average Site Disturbance Score for sites sampled in 2004, 2005 and 2006. .................................................................................................................30
Figure 5.6 Regression relationship between the ATSPT for benthic diatoms and the Average Site Disturbance Score for sites sampled in 2004, 2005 and 2006. ........................31
Figure 6.1 The diversity and dominance index values of zooplankton at 21 sites in 2006. .....37

vi
Figure 6.2 Relationship between the richness of zooplankton and the Average Site Disturbance Score for sites sampled in 2004, 2005, and 2006. ..............................38
Figure 6.3 Relationship between the abundance of zooplankton and the Average Site Disturbance Score for sites sampled in 2004, 2005, and 2006. ..............................38
Figure 6.4 Relationship between the diversity index of zooplankton and the Average Site Disturbance Score for sites sampled in 2004, 2005, and 2006. ..............................38
Figure 6.5 Relationship between the dominance index of zooplankton and the Average Site Disturbance Score for sites sampled in 2004, 2005, and 2006. ..............................38
Figure 6.6 Relationship between the Average Tolerance Score Per Taxon of zooplankton and the Average Site Disturbance Score for sites sampled in 2004, 2005, and 2006. ...39
Figure 7.1 The diversity and dominance index values of littoral macroinvertebrates at 21 sites in 2006. ....................................................................................................................46
Figure 7.2 Regression relationship between taxonomic richness of littoral macroinvertebrates and the Average Site Disturbance Score for sites sampled in 2004, 2005 and 2006. .................................................................................................................................47
Figure 7.3 Regression relationship between abundance of littoral macroinvertebrates and the Average Site Disturbance Score for sites sampled in 2004, 2005 and 2006. ..........47
Figure 7.4 Regression relationship between the Shannon-Wiener diversity index for littoral macroinvertebrates and the Average Site Disturbance Score for sites sampled in 2004, 2005 and 2006. ..............................................................................................47
Figure 7.5 Regression relationship between the Berger-Parker dominance index for littoral macroinvertebrates and the Average Site Disturbance Score for sites sampled in 2004, 2005 and 2006. ..............................................................................................47
Figure 7.6 Regression relationships between the Average Tolerance Score Per Taxon for littoral macroinvertebrates and the Average Site Disturbance Score for sites sampled in 2004, 2005 and 2006. ............................................................................48
Figure 8.1 Values of the diversity (H’) and dominance (D) indices for benthic macroinvertebrates at 21 sites in 2006. ...................................................................55
Figure 8.2 Regression relationship between taxonomic richness of benthic macroinvertebrates and the Average Site Disturbance Score for sites sampled in 2004, 2005 and 2006. .................................................................................................................................56

vii
Figure 8.3 Regression relationship between abundance of benthic macroinvertebrates and the Average Site Disturbance Score for sites sampled in 2004, 2005 and 2006. ..........56
Figure 8.4 Regression relationship between the Shannon-Wiener diversity index for benthic macroinvertebrates and the Average Site Disturbance Score for sites sampled in 2004, 2005 and 2006. ..............................................................................................57
Figure 8.5 Regression relationship between the Berger-Parker dominance index for benthic macroinvertebrates and the Average Site Disturbance Score for sites sampled in 2004, 2005 and 2006. ..............................................................................................57
Figure 8.6 Regression relationship between the Average Tolerance Score per Taxon for benthic macroinvertebrates and the Average Site Disturbance Score for sites sampled in 2004, 2005 and 2006. ............................................................................57
Figure 9.1 Tolerance score of diatoms, zooplankton, and littoral and benthic macroinvertebrates based on 57 sampling events at 43 sites, 2004 – 2006. ............62
Figure 9.2 Site ratings based on ATSPT values at 57 samples from 43 sites visited during, the 2004 – 2006 biomonitoring surveys. Class A represents the lowest level of stress to the biological community (most healthy ecological condition) and Class E the highest level of stress. .............................................................................................66

viii

ix
Table of tables
Table 2.1. Sites sampled during the 2004 –2006 biomonitoring surveys. ..................................3
Table 4.1. Altitude, river width, average water depth and water transparency (Secchi depth), turbidity and the amount of chlorophyll-a for 21 sites sampled in 2006. ........................................................................................................................21
Table 4.2. Biomass of green, blue green algae, diatoms, and cryptomonads for 21 sites sampled in 2006. .....................................................................................................23
Table 5.1. Diatom metrics for 2006. ........................................................................................28
Table 6.1. Total number of taxa of zooplankton recorded at 21 sites sampled in March 2006. ............................................................................................................35
Table 6.2. Zooplankton taxon richness and abundance (individuals/10 L) at 21 sites sampled in March 2006. ........................................................................................................36
Table 7.1. Numbers of taxa within each major group of littoral macroinvertebrate taxa recorded at each site in 2006. ..................................................................................44
Table 7.2. Number of individual littoral macroinvertebrates at 21 sites in 2006. ....................45
Table 8.1. Numbers of taxa of major groups of benthic macroinvertebrates collected at 21 sites in 2006. ............................................................................................................53
Table 8.2. Density (individuals/m2) of benthic macroinvertebrates at 21 sites in 2006. ..........55
Table 9.1. Correlation coefficients (r) and p-values from regression analysis of physical and chemical factors and average tolerance score per taxon (ATSPT) values for diatoms, zooplankton, and littoral and benthic macroinvertebrates based on samples from 2004 – 2006. ......................................................................................61
Table 9.2. ATSPT values for the four indicator groups at all the sites sampled in 2004, 2005 and 2006. ..............................................................................................63
Table 9.3. Sites for which multiple year comparisons of the ATSPT values could be made. ..64
Table 10.1. Sites, Average Site Disturbance Scores, and ATSPT scores for which collections have been made for multiple years. .........................................................................70

x

xi
Acknowledgements
The authors thank Mr Monyrak Meng and the staff of the Environment Programme of the Mekong River Commission for their assistance in coordinating the sampling programme in 2006. The authors also express their appreciation for the support given to the study by representatives from the National Mekong Committees of Cambodia, Lao PDR, Thailand, and Viet Nam, particularly for the help they provided in the field.
The authors are indebted to Prof. Vince Resh and Dr Bruce Chessman for their guidance during the field programme and their help with drafting this paper. The authors also express their appreciation to Dr Hakan Berg, Dr Dao Huy Giap, Dr Vithet Srinetr, and Dr Hanne Bach for their comments and suggestions when reviewing this paper.

xii

xiii
Abbreviations and acronyms
ATSPT: Average Tolerance Score Per TaxonBDP: Basin Development Plan programme of the MRCSBMWP: Biological Monitoring Working PartyLMB: Lower Mekong BasinMRC: Mekong River CommissionMRCS: Mekong River Commission SecretariatNMC: National Mekong CommitteeSDS: Site Disturbance Score

xiv

xv
Glossary of biomonitoring terms
Abundance: This is a measurement of the number of individual plants or animals belonging to a particular biological indicator group counted in a sample. Low abundance is sometimes a sign that the ecosystem has been harmed.
Average Tolerance Score per Taxon (ATSPT): Each taxon of a biological indicator group is assigned a score that relates to its tolerance to pollution. ATSPT is a measure of the average tolerance score of the taxa recorded in a sample. A high ATSPT may indicate harm to the ecosystem, as only tolerant taxa survive under these heavily disturbed conditions.
Benthic macroinvertebrates: In this report, the use of this term refers to animals that live in the deeper parts of the riverbed and its sediments, well away from the shoreline. Because many of these species are not mobile, benthic macroinvertebrates respond to local conditions and, because some species are long living, they may be indicative of environmental conditions that are long standing.
Biological indicator group: These are groups of animals or plants that can be used to indicate changes to aquatic environments. Members of the group may or may not be related in an evolutionary sense. So while diatoms are a taxon that is related through evolution, macroinvertebrates are a disparate group of unrelated taxa that share the character of not having a vertebral column, or backbone. Different biological indicator groups are suitable for different environments. Diatoms, zooplankton, littoral and benthic macroinvertebrates, and fish are the biological indicator groups most commonly used in aquatic freshwater environments. In addition, although not strictly a biological group, planktonic primary productivity can also be used as an indicator. However, for a number of logistical reasons fish and planktonic primary production are not suitable for use in the Mekong.
Diatoms: Single-celled microscopic algae (plants) with cell walls made of silica. They drift in river water (planktic/planktonic) or live on substrata such as submerged rocks and aquatic plants (benthic/benthonic). They are important primary producers in aquatic food webs and are consumed by many invertebrate animals. Diatoms are a diverse group and respond in many ways to physical and chemical changes in the riverine environment. Diatom communities respond rapidly to environmental changes because diatoms have short generation times.
Environmental variables: These are chemical and physical parameters that were recorded at each sampling site at the same time as samples for biological indicator groups were collected. The parameters include altitude, water transparency and turbidity, water temperature, concentration of dissolved oxygen (DO), electrical conductivity (EC), activity of hydrogen ions (pH), and concentrations of chlorophyll-a, as well as the physical dimensions of the river at the site.

xvi
Littoral macroinvertebrates: In this report, the use of this term refers to animals that live on, or close to, the shoreline of rivers and lakes. This group of animals is most widely used in biomonitoring exercises worldwide. They are often abundant and diverse and are found in a variety of environmental conditions. For these reasons littoral macroinvertebrates are good biological indicators of environmental changes.
Littoral organisms: Those organisms that live near the shores of rivers, lakes, and the sea.
Macroinvertebrate: An informal name applied to animals that do not have a vertebral column, including snails, insects, spiders, and worms, which are large enough to be visible to the naked eye. Biomonitoring programmes often use both benthic and littoral macroinvertebrates as biological indicators of the ecological health of water bodies.
Primary producer: Organisms at the bottom of the food chain, such as most plants and some bacteria (including blue-green algae), which can make organic material from inorganic matter.
Primary production: The organic material made by primary producers. Therefore, planktonic primary production is the primary production generated by plants (including diatoms) and bacteria (including blue-green algae) that live close to the surface of rivers, lakes, and the sea.
Primary productivity: The total organic material made by primary producers over a given period of time.
Reference sites: These are sampling sites that are in almost a natural state with little disturbance from human activity. To be selected as a reference site in the MRC biomonitoring programme, a site must meet a number of requirements including pH (between 6.5 and 8.5), electrical conductivity (less than 70 mS/cm), dissolved oxygen concentration (greater than 5 mg/L) and average SDS (between 1 and 1.67). Reference sites provide a baseline from which to measure environmental changes.
Richness: This is a measurement of the number of taxa (types) of plants or animals belonging to a particular biological indicator group counted in a sample. Low species richness is often a sign that the ecosystem has been harmed.
Sampling sites: Sites chosen for single or repeated biological and environmental sampling. Although locations of the sites are geo-referenced, individual samples may be taken from the different habitats at the site that are suitable for particular biological indicator groups. Sites were chosen to provide broad geographical coverage of the basin and to sample a wide range of river settings along the mainstream of the Mekong and its tributaries.
Site Disturbance Score (SDS): This is a comparative measure of the degree to which the site being monitored has been disturbed by human activities, such as urban development, water resource developments, mining, and agriculture. In the MRC biomonitoring programme, the SDS is determined by a group of ecologists who attribute a score of 1 (little or no disturbance)

xvii
to 3 (substantial disturbance) to each of the sampling sites in the programme after discussion of possible impacts in and near the river.
Taxon/taxa (plural): This is a group or groups of animals or plants that are related through evolution. Examples include species, genera, or families.
Zooplankton: Small or microscopic animals that drift or swim near the surface of rivers, lakes, and the sea. Some are single celled while others are multi-cellular. They include primary consumers than feed on phytoplankton (including diatoms) and secondary consumers that eat other zooplankton. Zooplankton can be useful biological indicators of the ecological health of water bodies because they are a diverse group that has a variety of responses to environmental changes. Zooplankton communities respond rapidly to changes in the environment because zooplankton species have short generation times.

xviii

xix
Summary
The aquatic resources of the Mekong River and its tributaries are essential to the livelihoods of a large portion of the 60 million people who live in the Lower Mekong Basin. Maintaining the ecological health of the river is the basis of the sustainable management of these resources. The Environment Programme of the Mekong River Commission (MRC) has monitored the ecological health of the Mekong river-system using biological indices since 2003, and continues to do so. This report describes the Programme’s biomonitoring activities in 2006. During that year the Programme’s biologists sampled 21 localities in Cambodia and Viet Nam. On the basis of the results of work the Programme conducted during the preceding years, the 2006 monitoring study used benthic diatoms, zooplankton, littoral macroinvertebrates, and benthic macroinvertebrates as biological indicator groups. At the same time, the physical and chemical properties of the river were recorded at each of the sampling sites.
The objectives of this paper are to (i) describe the floral and faunal components of the assemblages in the samples collected during 2006, (ii) develop quantitative tolerance-to-stress values for all species collected in this survey and earlier surveys conducted in 2004 and 2005, and (iii) use this information to evaluate the ecological health of the sites examined in 2006.
The suite of 2004–2006 field surveys provides records for 43 sites in the basin and contains a total of 57 ‘sampling events’ (some of the sites were sampled in more than one year). A visual assessment of human disturbance (called the Site Disturbance Score — SDS) was made for each of these 57 sampling events.
Littoral and benthic macroinvertebrates had a higher proportion of intolerant species than did diatoms or zooplankton. The tolerance of each species present at an individual site was used to calculate an Average Tolerance Score Per Taxon (ATSPT) for each site. In general, ATSPT values increased in a downstream direction in the mainstream of the river, while tributaries generally recorded scores indicative of lower stress than did sites in the mainstream.
Five biological metrics were calculated and evaluated for their applicability to the Mekong’s ecosystems. The metrics were: (i) richness (number of taxa), (ii) abundance (numbers of individuals), (iii) the Shannon-Wiener Diversity Index, (iv) the Berger-Parker Dominance Index, and (v) the ATSPT.
A regression analysis of the average SDS against all five biological metrics was undertaken. Significant correlations were found for all metrics in the case of littoral macroinvertebrates, for two metrics (diversity and ATSTP) in the case of zooplankton, and for only ATSPT in the case of diatoms and benthic macroinvertebrates. Sites that were sampled in multiple years had consistent ATSPT values, confirming the broad validity of this approach to biomonitoring in the Lower Mekong Basin.

Report on the 2006 biomonitoring survey of the Mekong River and selected tributaries
Page xx
The ATSPT determined from the 2006 study clearly can serve as a basis for a long-term monitoring programme to evaluate ecological health. Studies in 2007 will include an independent assessment of the relationship of ATSPT to visual assessments of human disturbance, and evaluate further the use of ATSPT and other metrics in environmental assessment and management.

Page 1
1. Introduction
Arguably, the Mekong is the most important river in the world in terms of human dependency on riverine aquatic resources for sustenance and survival. The quality of life of the 60 million people living in the Lower Mekong Basin depends on both the economic and the ecological health of the river. The river-system is also an important centre of biodiversity. During the period from 1999 to 2001, four localities in the basin were designated as Ramsar sites, and a number of possible future sites were identified.
This 2006 paper describes ongoing studies in the lower Mekong River that were conducted to evaluate the overall ecological health of the river. It builds on activities initiated in 2003, when pilot studies were undertaken to determine which biological indicator groups should be used to evaluate ecological health. In 2004, emphasis was placed on evaluating intra-site variability in biological assemblages and on establishing the association between environmental factors and the composition of the assemblages. The 2004 and 2005 surveys were designed to sample all the sub-basins in the LMB, to characterise the biological communities, and to develop tools for evaluating ecological health. The following metrics were calculated for all sites sampled in 2004 and 2005: (i) richness (number of taxa), (ii) abundance (numbers of individuals), (iii) the Shannon-Wiener Diversity Index, (iv) the Berger-Parker Dominance Index, (v) the proportion of pollution sensitive taxa, and (vi) the proportion of pollution sensitive individuals. All six metrics were tested for their potential as indicators of human impact through regression analysis against an average site disturbance score (SDS). The 2005 study found that the correlation between the average SDS and the six biological metrics differed among the four biological groups. Therefore, an objective of the 2006 study was to focus on expanding and improving the assessment of the sensitivity to pollution of the various taxa.
The objectives of this report are to: (i) describe the faunal and floral characteristics of the biological communities sampled quantitatively at 21 sites during the 2006 survey; (ii) develop quantitative tolerance scores based on data collected at 20 sites in 2004, 16 sites in 2005, and 21 sites in 2006; and (iii) report biotic condition scores for each of the sites examined in 2006.
Four of the six biological metrics investigated in the 2005 study (richness, abundance, the Shannon-Wiener Diversity Index, and the Berger-Parker Dominance Index) were evaluated further in 2006 study. A new biological metric—Average Tolerance Score Per Taxon (ATSPT)—was also added. Regression analyses were undertaken to assess the correlation between the five biological metrics and the SDS.
Four biological assemblages were used in this analysis: littoral and benthic macroinvertebrates, diatoms, and zooplankton. Benthic macroinvertebrates are the group of organisms that is most widely used for biological monitoring. The most frequently cited advantages of using these organisms include: their wide diversity, which includes the large number of species and their various responses to environmental change; their wide distribution;

Report on the 2006 biomonitoring survey of the lower Mekong River and selected tributaries
Page 2
their limited mobility; the ease in sampling them; the long life-span of some species; and the fact that taxonomic keys, at least to higher identification levels, are available for most regions of the world. Because different species occur in the deeper parts of river channels and in the littoral zone, the survey sampled each zone separately, and this report presents data on each of the littoral and benthic macroinvertebrates individually.
Although benthic macroinvertebrates are the most widely used group of organisms in biomonitoring, they do not respond to all stressors, and they are very dependant on local habitat conditions. For these reasons, we have also included two other groups of organisms in the analysis, benthic diatoms and zooplankton.
Benthic diatoms are increasingly used in biomonitoring programs but they are usually used in conjunction with macroinvertebrates rather than as a separate unit. They offer some similar advantages to macroinvertebrates, including the ease with which they can be sampled, the diversity of their responses, and their widespread occurrence. However, because of their shorter generation time, they also often show more rapid responses to disturbance than do macroinvertebrates.
Riverine zooplankton are less commonly used in biomonitoring than either macroinvertebrates or diatoms but the reason for this is that most programmes evaluate smaller, wadeable streams and rivers rather than large rivers like the Mekong. Zooplankton also have high diversity and clearly are an essential part of the ecosystem in large rivers. Their response time to disturbance is shorter than that of macroinvertebrates and longer than that of diatoms, and so they provide a complementary, intermediate role in the assemblages used to monitor ecological health.
Biomonitoring programmes elsewhere in the world commonly use species of freshwater fish as indicators of riverine ecological health. (In terms of their frequency of use for biomonitoring, they are intermediate between macroinvertebrates and diatoms.) Previous reports on the earlier Mekong surveys provide details of why, after pilot studies conducted in 2003, fish were not used in the biomonitoring analysis. In short, fish were excluded from the biomonitoring programme because they could not be sampled adequately in the short period (2–3 hours) allocated per site, and because, in any case, fisheries data were available from other sources.

Page 3
2. Sampling sites and programme
The 2004 – 2006 suite of samples includes records of 57 sets of samples collected from 43 sites on the Mekong and its tributaries (some sites were sampled in more than one year — see Table 2.1).
Table 2.1. Sites sampled during the 2004 –2006 biomonitoring surveys.
Country Site 2004 2005 2006Cambodia CBS X
CKM X XCKT X XCMR X XCNL XCPP X XCPS XCPT XCSJ X XCSK XCSN XCSP X X XCSS X XCSU X XCTU X X
Lao PDR LKD XLKL XLKU XLMH XLMX XLNG XLNK XLNO XLOU XLPB X XLPS XLVT X
Thailand TCH XTKO X XTMC XTMI XTMU XTSK X
Viet Nam VCD X XVCL XVCT XVKT XVSP XVSS XVLX XVSR X XVTC X XVTR X

Report on the 2006 biomonitoring survey of the lower Mekong River and selected tributaries
Page 4
The sites were chosen to provide broad geographical coverage of the basin, to include each of the ‘sub-basins’ as defined by the MRC’s Basin Development Plan (BDP), and to sample the mainstream of Mekong River and each of its major tributaries (Figure 2.1).
2004 Biomonitoring survey
The sites surveyed in 2004 represent a broad geographic coverage across the Lower Mekong Basin (Figure 2.2). They include localities on the Mekong and its major tributaries, in each of the BDP sub-areas, and in each of the MRC member countries — Cambodia, Lao PDR, Thailand and Viet Nam. The sampling localities cover a range of river settings from the rock-cut channels in northern Lao PDR and northeast Thailand, through the alluvial channel systems of central and southern Lao PDR and the plains of Cambodia, to the distributary system of the Mekong Delta in southern Cambodia and Viet Nam. The sites also exhibit varying disturbance from human activity. Some are located in or close by villages or towns, some are next to fields where crops are grown and livestock graze, some are upstream or downstream of dams and weirs, and at some there is moderate to heavy river traffic. Details of the sites sampled in 2004 can be found in MRC Technical Paper No. 13 (MRC, 2006).
2005 Biomonitoring survey
The geographic coverage of the 2005 survey was more focused than the 2004 survey (Figure 2.3). The sites fall into two groups: (i) northern Lao PDR and the northern provinces of Thailand (mainly Chiang Rai), which lie in BDP Sub-area 1 (Northern Laos) and Sub-area 2 (Chiang Rai), and (ii) southern Lao PDR and eastern Cambodia, which lie largely in Sub-area 7 (Se San/Sre Pok/Se Kong). They also include localities in a range of river settings and anthropogenic influences.
2006 Biomonitoring survey
The 2006 survey focused on the mainstream and its major tributaries downstream of the Ramsar site at Stung Treng in northern Cambodia (Figure 2.4). The survey included localities in Sub-area 6 (Southern Laos), Sub-area 7 (Se San/Sre Pok/Se Kong), Sub-Area 8 (Kratie), Sub-area 9 (Tonle Sap), and Sub-area 10 (Delta). Again the sites represented a range of river settings and anthropogenic influences. Details of the location and geographic characteristics of the sites are given below (Table 2.2).

Page 5
Sampling sites and programme
Figure 2.1. Location of the sites sampled during the 2004, 2005, and 2006 biomonitoring surveys.
0 100 200 kilometres
Gulf of Thailand
Gulf of Tonkin
LOWER MEKONG BASIN
Thailand
Viet Nam
Cambodia
Lao PDR
Viet Nam 1. Northern Laos
2. Chiang Rai
3. Nong Khai/Songkhram
4. Central Laos
5. Mun/Chi
6. Southern Laos
7. Se San/Sre Pok/Se Kong
8. Kratie
9. Tonle Sap
10. Delta
BDP Sub-area
2006 2005
2004
Biomonitoring surveys 2007-2007

Report on the 2006 biomonitoring survey of the lower Mekong River and selected tributaries
Page 6
Figure 2.2. Location of the sites sampled during the 2004 biomonitoring survey.
0 100 200 kilometres
CPPCTU
CPS
CSS
CSP
VTC
VSP
LNOLPB
LVT
LNGLKD
LPSTMU
TCH
TSK
TKO
VSS
CKT
VCD
Biomonitoring Survey 2004
Sampling site
Gulf of Thailand
Gulf of Tonkin
LOWER MEKONG BASIN
Thailand
Viet Nam
Cambodia
Lao PDR
Viet Nam 1. Northern Laos
2. Chiang Rai
3. Nong Khai/Songkhram
4. Central Laos
5. Mun/Chi
6. Southern Laos
7. Se San/Sre Pok/Se Kong
8. Kratie
9. Tonle Sap
10. Delta
BDP Sub-area

Page 7
Sampling sites and programme
Figure 2.3. Location of the sites sampled during the 2005 biomonitoring survey.
0 100 200 kilometres
LOU
LNK
LMH
LMX
TMI
TMC
TKO
LKULKL
LPB
CSS
CKMCSUCMR
CSPCSJ
Biomonitoring Survey 2005
Sampling site
Gulf of Thailand
Gulf of Tonkin
LOWER MEKONG BASIN
Thailand
Viet Nam
Cambodia
Lao PDR
Viet Nam 1. Northern Laos
2. Chiang Rai
3. Nong Khai/Songkhram
4. Central Laos
5. Mun/Chi
6. Southern Laos
7. Se San/Sre Pok/Se Kong
8. Kratie
9. Tonle Sap
10. Delta
BDP Sub-area

Report on the 2006 biomonitoring survey of the lower Mekong River and selected tributaries
Page 8
Figure 2.4. Location of the sites sampled during the 2006 biomonitoring survey.
0 100 200 kilometres
CKLCNL
CSN
CSK
CPTCKT
VSS
VSR
VTR
VCTVLX
VCLVCD
CMRCKM
CSJCSP
CSU
CTU
CPP
VTC
Biomonitoring Survey 2006
Sampling site
Gulf of Thailand
Gulf of Tonkin
LOWER MEKONG BASIN
Thailand
Viet Nam
Cambodia
Lao PDR
Viet Nam 1. Northern Laos
2. Chiang Rai
3. Nong Khai/Songkhram
4. Central Laos
5. Mun/Chi
6. Southern Laos
7. Se San/Sre Pok/Se Kong
8. Kratie
9. Tonle Sap
10. Delta
BDP Sub-area

Page 9
Sampling sites and programme
Site
Cod
eD
ate
Coo
rdin
ates
(UTM
)G
PS
elev
atio
n (m
)
Wid
th
(m)
Dep
th (m
)La
nd u
se c
over
Subs
tratu
mPo
tent
ial h
uman
im
pact
sR
ight
Left
LM
RLe
ft ba
nkR
ight
ban
kLi
ttora
lC
hann
el
Tonl
e Sa
p riv
er
at P
hnom
Pen
h Po
rt
CPP
6/3/
0649
1666
(E)
1280
205
(N)
4919
60 (E
) 12
8055
3 (N
)6
460
7 – 8
125 –
6H
ouse
s and
doc
ksH
ouse
s and
doc
ksM
ud; s
and;
ga
rbag
e;
bam
boo
stic
ks
R –
Mud
; litt
le
clay
Sew
age
disc
harg
e;
urba
n ru
noff;
ru
bbis
h di
spos
al;
spill
age
and
leak
age
from
do
cks
M –
Sand
L – S
and;
cla
y;
little
mud
Bas
sac
at K
oh
Khe
lC
KL
7/3/
0650
3327
(E)
1246
641(
N)
5035
20 (E
) 12
4634
0 (N
) 2 –
329
84
74 –
8V
illag
es a
nd
gard
ens;
ban
anas
Vill
ages
and
ga
rden
sSa
nd; m
ud;
wat
er h
yaci
nth
R –
Sand
; mud
Agr
icul
tura
l ru
noff;
dis
posa
l of
hum
an a
nd a
nim
al
was
tes
M –
Sand
; a
few
gra
nule
s
L – M
ud; fi
ne
sand
; deb
ris
Mek
ong
at N
ak
Loeu
ngC
NL
8/3/
0652
8321
(E)
1250
852
(N)
5305
80 (E
) 12
4993
7 (N
)8 –
1416
293
154 –
12Fi
elds
; few
hou
ses
Sand
ban
ks;
field
s; v
illag
esSa
nd; a
lit
tle m
ud;
filam
ento
us
alga
e
R –
Mud
; litt
le
sand
Agr
icul
tura
l ru
noff;
dis
posa
l of
hum
an a
nd a
nim
al
was
tes
M –
Sand
; litt
le
mud
L – S
and;
cla
y
Tabl
e 2.
2.
Loca
tion
and
geog
raph
ic c
hara
cter
istic
s of t
he si
tes s
ampl
ed in
the
2006
bio
mon
itori
ng su
rvey
.

Report on the 2006 biomonitoring survey of the lower Mekong River and selected tributaries
Page 10
Site
Cod
eD
ate
Coo
rdin
ates
(UTM
)G
PS
elev
atio
n (m
)
Wid
th
(m)
Dep
th (m
)La
nd u
se c
over
Subs
tratu
mPo
tent
ial h
uman
im
pact
sR
ight
Left
LM
RLe
ft ba
nkR
ight
ban
kLi
ttora
lC
hann
el
Tonl
e Sa
p riv
er
at P
rek
Kda
mC
TU9/
3/06
4783
64 (E
) 13
0707
1 (N
)47
9071
(E)
1367
00 (N
)3
522
310
5H
ouse
s; fi
sh
pens
; som
e tre
es
on b
ank;
ferr
y do
wns
tream
Hou
ses a
nd
float
ing
hous
es;
fish
cage
s
Firm
mud
; st
icks
R –
Cla
y; sa
ndH
uman
was
tes;
ur
ban
runo
ff;
rubb
ish
disp
osal
; fis
h fa
rmin
gM
– M
ud; s
and;
cl
ay
L – M
ud;
debr
is; a
littl
e sa
nd
Stoe
ng S
enC
SN10
/3/0
649
0998
(E)
1401
845
(N)
4909
10 (E
) 14
0177
0 (N
)6
661.
01.
23.
0 – 4.
5Fa
rms;
veg
etab
le
gard
ens;
few
ho
uses
; sta
ble
slop
ing
and
terr
aced
ban
ks
Stee
p, b
are,
er
oded
ban
k; tr
ees
and
field
s at t
op
Mud
ove
r firm
sa
ndR
– M
ud; l
ittle
sa
ndA
gric
ultu
ral
runo
ff; d
ispo
sal o
f hu
man
and
ani
mal
w
aste
s; b
ank
eros
ion
M –
Mud
; san
d
L – M
ud
Stoe
ng S
angk
eC
SK11
/3/0
634
8375
(E)
1465
699
(N)
3488
95 (E
) 14
6577
2 (N
)5
127
0.5 –
0.7
1.5 –
2.0
0.5 –
1.0
Ope
n fo
rest
; fish
pe
ns; fl
oatin
g hu
t; flo
atin
g vi
llage
do
wns
tream
Ope
n fo
rest
; fish
pe
nsSi
lt; fl
oode
d bu
shes
R –
Mud
; de
bris
Hum
an w
aste
s an
d ru
bbis
h di
spos
al fr
om
dow
nstre
am
villa
ge; fi
sh
farm
ing
M –
Mud
; litt
le
debr
is
L – M
ud; d
ebris
Prek
Te
CPT
13/3
/06
6138
99 (E
) 13
7481
1 (N
)61
3871
(E)
1374
792
(N)
9 – 13
391.
51.
61.
1V
illag
e; v
eget
able
ga
rden
s; c
attle
gr
azin
g; tr
ees a
t ba
nk to
p; st
eep,
pa
rtly
erod
ed
bank
s with
wee
d co
ver o
n lo
wer
ba
nk
Ric
e fie
lds;
cat
tle
graz
ing;
few
tree
s;
erod
ed b
anks
with
m
oder
ate
slop
e an
d pa
rtial
wee
d co
ver o
n lo
wer
ba
nk
Mud
; deb
risR
– M
ud;
debr
isA
gric
ultu
ral
runo
ff; d
ispo
sal o
f hu
man
and
ani
mal
w
aste
s; li
vest
ock
dam
age
to b
anks
; ba
nk e
rosi
onM
– M
ud;
debr
is
L – M
ud; d
ebris

Page 11
Sampling sites and programme
Site
Cod
eD
ate
Coo
rdin
ates
(UTM
)G
PS
elev
atio
n (m
)
Wid
th
(m)
Dep
th (m
)La
nd u
se c
over
Subs
tratu
mPo
tent
ial h
uman
im
pact
sR
ight
Left
LM
RLe
ft ba
nkR
ight
ban
kLi
ttora
lC
hann
el
Mek
ong
at
Kam
pi
CK
T14
/3/0
660
9207
(E)
1393
544
(N)
6109
43 (E
) 13
9380
8 (N
)10
– 13
1300
1.7
7 – 8
1.7
Few
hou
ses;
to
uris
t are
a;
mod
erat
e sl
ope;
so
me
eros
ion
Stee
p, e
rode
d ba
nk; s
ome
trees
on
face
; man
y on
to
p; fe
w h
ouse
s
Sand
; som
e st
ones
R –
Sand
; roc
k;
little
deb
risB
ank
eros
ion
M –
Sand
; roc
k;
alga
e
L – S
and;
rock
; al
gae
Mek
ong
at
Ram
sar s
ite
CM
R15
/3/0
660
4976
(E)
1539
456
(N)
6055
86 (E
) 15
3977
7 (N
)58
450
1.5
7 – 8
1 – 1.
5Fo
rest
, few
ho
uses
Fore
st, f
ew
hous
esSa
nd; p
ebbl
es;
cobb
les;
be
droc
k;
filam
ento
us
alga
e
R –
Sand
; roc
k;
little
deb
risD
ispo
sal o
f hu
man
and
ani
mal
w
aste
s; li
vest
ock
dam
age
to b
anks
; ba
nk e
rosi
onM
– Sa
nd; l
ittle
de
bris
L – S
and;
de
bris
Se S
an
dow
nstre
am o
f Sr
epok
Riv
er
junc
tion
CSJ
16/3
/06
6209
73 (E
) 14
9941
2 (N
)62
0973
(E)
1499
412
(N)
48-5
262
21
31
Fore
st; w
ater
bu
ffalo
Fore
st; w
ater
bu
ffalo
Sand
; peb
bles
; co
bble
s; b
ushe
sR
– Sa
nd; r
ock
Live
stoc
k da
mag
e to
ban
ks; b
ank
eros
ion
M –
Roc
k;
cobb
les;
sand
L – S
and;
rock
; lit
tle d
ebris
Low
er S
e K
ong
CK
M16
/3/0
661
5508
(E)
1500
632
(N)
NA
47-5
038
60.
51 –
20.
5Fo
rest
; few
ho
uses
; ero
ded
bank
s
Fore
st; f
ew
hous
es; e
rode
d ba
nks
R
– Sa
nd; l
ittle
de
bris
Live
stoc
k da
mag
e to
ban
ks; b
ank
eros
ion
M –
Roc
k
L – S
and;
mud
; de
bris

Report on the 2006 biomonitoring survey of the lower Mekong River and selected tributaries
Page 12
Site
Cod
eD
ate
Coo
rdin
ates
(UTM
)G
PS
elev
atio
n (m
)
Wid
th
(m)
Dep
th (m
)La
nd u
se c
over
Subs
tratu
mPo
tent
ial h
uman
im
pact
sR
ight
Left
LM
RLe
ft ba
nkR
ight
ban
kLi
ttora
lC
hann
el
Lum
phat
CSP
18/3
/06
7174
24 (E
) 14
9080
4 (N
)71
7397
(E)
1490
604
(N)
98-1
0220
01.
72.
81
Fore
st, s
mal
l sca
le
agric
ultu
re; f
erry
cr
ossi
ng
Fore
st; s
mal
l sca
le
agric
ultu
re; f
erry
cr
ossi
ng
Bed
rock
and
co
bble
, with
m
any
smal
l ch
anne
ls
R –
Cla
y an
d m
ud, b
ambo
o le
aves
Som
e ag
ricul
tura
l in
fluen
ces a
nd
smal
l boa
t tra
ffic;
se
wag
e fr
om
villa
geM
– Sa
nd
L-M
ud w
ith
few
leav
es
Pam
Pi (
Se S
an
at b
orde
r)C
US
19/3
/06
7645
06 (E
) 15
2606
5 (N
)76
4635
(E)
1526
043
(N)
134
173
1.1-
1.5
~ 15
~ 1.
5Fo
rest
, bam
boo
bush
; cas
hew
nut
be
hind
ripa
rian
Fore
st a
nd
bam
boo
bush
; fr
uit t
rees
beh
ind
ripar
ian
Bou
lder
s on
bedr
ock
R-S
and;
deb
ris D
am u
pstre
am;
2 da
ys b
efor
e sa
mpl
ing
ther
e w
as n
o flo
w;
sew
age
inpu
ts;
som
e er
osio
nM
– R
ock;
sand
L – S
and;
mud
; de
bris
Upp
er S
e Sa
nV
SS20
/3/0
618
0527
(E)
1588
158
(N)
1805
85 (E
) 15
8815
8 (N
)52
716
75
0.5
1.5
Bam
boo
bush
; ba
nana
fiel
ds;
isla
nd w
ith
farm
ing
in c
entre
of
site
Sand
ext
ract
ion;
ba
nana
; hou
sing
Cob
ble
and
grav
elR
– Sa
nd; m
ud;
debr
isA
gric
ultu
re;
bana
na; C
assa
va
rice;
vill
age
M –
Sand
;
L – S
and;
mud
; de
bris
Upp
er S
re P
okV
SP21
/3/0
681
7329
(E)
1396
950
(N)
8177
31 (E
) 13
9658
4 (N
)29
8-31
293
-10
62
52.
5G
rass
y hi
ll si
de;
bam
boo
bush
an
d tre
es; l
arge
am
ount
s of
mim
osa
Hou
ses;
ba
nana
fiel
ds;
larg
e am
ount
s of
mim
osa;
ag
ricul
tura
l pu
mps
; de
com
posi
ng
mat
eria
l
Cob
ble,
gra
vel,
sand
R –
Mud
; or
gani
c m
ater
ial
Agr
icul
ture
ca
ssav
a, b
anan
a,
coffe
e; tr
ees
clea
red
on ri
ght
bank
; ero
sion
; na
viga
tion
M –
Sand
; co
bble
L – M
ud;
orga
nic
mat
eria
l

Page 13
Sampling sites and programme
Site
Cod
eD
ate
Coo
rdin
ates
(UTM
)G
PS
elev
atio
n (m
)
Wid
th
(m)
Dep
th (m
)La
nd u
se c
over
Subs
tratu
mPo
tent
ial h
uman
im
pact
sR
ight
Left
LM
RLe
ft ba
nkR
ight
ban
kLi
ttora
lC
hann
el
Vin
h Lo
ngV
VL
23/3
/06
6039
76 (E
) 11
3575
9 (N
)60
3576
(E)
1134
724
(N)
4-9
1064
-10
705.
24.
82
Hou
sing
; fish
fa
rms;
wat
er
hyac
inth
Few
tree
s;
agric
ultu
re o
f ca
shew
and
frui
t cr
ops
Mud
; deb
risR
– M
ud;
orga
nic
mat
eria
l
Nav
igat
ion;
sa
nd c
olle
ctio
n;
agric
ultu
re;
sew
age;
ero
sion
; fis
hing
M –
Sand
L – M
ud;
orga
nic
debr
is
Can
Tho
(B
assa
c)V
CT
24/3
/06
5883
65 (E
) 11
1067
3 (N
)58
7117
(E)
1110
902
(N)
7-10
872
3.2
6.9
3A
gric
ultu
ral;
frui
t tre
esFo
rest
Har
d m
udR
– Sa
nd; m
ud;
som
e or
gani
c m
atte
r
Nav
igat
ion;
br
idge
co
nstru
ctio
n;
sew
age
treat
men
t pl
ant c
onst
ruct
ion
M –
Sand
; mud
L – C
lay;
sa
nd; m
ud;
som
e or
gani
c m
ater
ial
Long
Xuy
enV
LX25
/3/0
655
1878
(E)
1143
546
(N)
5519
25 (E
) 11
4451
8 (N
)7
662
6.9-
77.
2-7.
77.
2-7.
4N
avig
atio
n;
Agr
icul
ture
alo
ng
bank
;Ero
ding
sh
orel
ine;
B
anan
a; m
ango
;p
apay
a; c
assa
va
Con
stru
ctio
n of
br
idge
; Inc
reas
ing
silta
tion;
Ver
y st
rong
flow
; Se
wag
e an
d w
aste
fr
om fa
ctor
ies
Hig
h hu
man
po
pula
tion
dens
ity; F
ish
farm
; som
e sc
atte
red
bam
boo
bush
Mud
from
er
osio
nR
– M
ud;
clay
; org
anic
m
ater
ial;
debr
is
Agr
icul
ture
; co
nstru
ctio
n; b
ank
eros
ion
M –
Soil;
cla
y
L – M
ud; s
oil;
clay

Report on the 2006 biomonitoring survey of the lower Mekong River and selected tributaries
Page 14
Site
Cod
eD
ate
Coo
rdin
ates
(UTM
)G
PS
elev
atio
n (m
)
Wid
th
(m)
Dep
th (m
)La
nd u
se c
over
Subs
tratu
mPo
tent
ial h
uman
im
pact
sR
ight
Left
LM
RLe
ft ba
nkR
ight
ban
kLi
ttora
lC
hann
el
Cao
Lan
hV
CL
26/3
/06
5638
07 (E
) 11
5386
8 (N
)56
4116
(E)
1196
192
(N)
710
84-
1090
0.7
10-1
54.
5U
pstre
am o
f is
land
; gra
sses
an
d sh
rubs
; flo
atin
g fis
h tra
ps
and
brus
h tra
ps
Agr
icul
ture
; fru
it tre
es; b
anan
a;
corn
; som
e ba
mbo
o bu
sh
and
trees
. Mor
e hu
man
influ
ence
th
an le
ft ba
nk
Mud
; som
e sa
ndR
– C
lay;
mud
Agr
icul
ture
; na
viga
tion
espe
cial
ly o
n th
e rig
ht b
ank;
er
osio
n on
righ
t ba
nk (f
rom
ag
ricul
ture
and
na
viga
tion)
M –
Sand
L – S
and;
m
ud; o
rgan
ic
mat
eria
l
Tan
Cha
VTC
27/3
/06
5242
59 (E
) 11
9580
8 (N
)52
4706
(E)
1196
192
(N)
610
60-
1180
5.5
8.5
>12
30%
agr
icul
ture
bu
t mos
tly tr
ees;
m
easu
rem
ents
ta
ken
307
m fr
om
shor
e; in
crea
se
of sh
allo
w w
ater
an
d sa
ndy
botto
m;
heav
y na
viga
tion
Nea
rly a
ll ba
nks
is a
gric
ultu
re;
mor
e er
osio
n th
an
left
bank
; sam
ples
ta
ken
170
m fr
om
right
ban
k
Sand
R –
Cla
y; m
udA
gric
ultu
re;
navi
gatio
n;
dom
estic
was
teM
– Sa
nd; m
ud
L – S
and;
mud
Cha
Doc
VC
D28
/3/0
651
0969
(E)
1188
413
(N)
5108
29 (E
) 11
8831
1 (N
)5
255
5.4
7.4
3.14
Agr
icul
ture
; fe
w tr
ees (
Teak
; Eu
caly
ptus
); ba
mbo
o bu
sh;
mim
osa;
mor
ning
gl
ory;
gar
bage
Wat
er h
yaci
nth;
ve
geta
ble
patc
hes;
fis
h ca
ges;
ga
rbag
e; n
ext t
o ro
ad; h
ighe
r slo
pe
Med
ium
har
d m
udR
– M
ud;
orga
nic
mat
eria
l
Agr
icul
ture
; ga
rbag
e;
navi
gatio
n;
sew
age
from
flo
atin
g ho
uses
M –
Mud
; or
gani
c m
ater
ial
L – M
ud;
orga
nic
mat
eria
l

Page 15
3. Calculation of tolerance scores and development of biological indices of stress
3.1 Introduction
Group of organisms that are most useful for biomonitoring contain species with widely differing tolerances to environmental stressors. This is the most commonly stated justification for macroinvertebrates as the basis of biomonitoring, the second most common justification for zooplankton and other algae (after ease of sampling), and the most common justification for zooplankton. In contrast, this is rarely given as a reason to choose fish as the basis of a biomonitoring programme.
Tolerance values are typically based on expert opinion, whereby species, genera, or families are subjectively assigned to broad categories (e.g. very pollution sensitive, pollution sensitive, pollution tolerant, or very pollution tolerant) or given numerical scores (e.g. 1 – 10). Quantitative analysis has been used to develop tolerance scores only relatively recently (Chessman et al., 1997; Walley and Hawkes 1997).
The 2006 biomonitoring study of the Lower Mekong Basin (i) developed regional tolerance values for species of diatoms, zooplankton, littoral macroinvertebrates, and benthic macroinvertebrates; (ii) used appropriate formulae to express the tolerance of an assemblage at a site; and (iii) grouped scores into ranges with associated descriptions for the purpose of interpretation and communication.
3.2 Methods
Development of tolerance values
A tolerance value was calculated for each taxon that was collected during the studies conducted in 2004, 2005, and 2006. Tolerance values were derived by assessing the relationship between the presence and absence of species in samples from each study site and the value of an independently measured ‘Site Disturbance Score’ (SDS) for each site.
In order to determine the Site Disturbance Score, a team of 8 to 10 ecologists/biologists individually rated each site they had visited in terms of their observations of the stressors generated by human activities. Light stress was rated 1, medium stress 2, and heavy stress 3. Sites were initially scored independently. The results were then discussed among the group of

Report on the 2006 biomonitoring survey of the lower Mekong River and selected tributaries
Page 16
assessors and a small percentage (-1%) of scores were changed. The 10 scores were averaged to obtain the overall Site Disturbance Score for each site.
The tolerance of each species (or higher taxon where identification to species was not possible) was calculated as the average Site Disturbance Score for all sites at which that species occurred weighted by the number of samples per site in which the species was recorded. The tolerance values were then re-scaled so that they ranged from 0 to 100, where 0 represents low tolerance and 100 represents high tolerance to human-generated stress such as water pollution.
The Average Tolerance Score per Taxon (ATSPT) was then calculated for each sample collected. ATSPT is the average tolerance of all taxa recorded in a sample, calculated without regard to their abundances. A worked example1 on the calculations is given in figure 3.1.
1 This worked example was extracted from the zooplankton survey in 2004. For demonstration purposes, it has been simplified by considering only three taxa (Ceratium spp., Chironomidae sp., and Copepoda sp. (nauplius) and only four sites (LNO, LPB, LVT, and LNG).

Page 17
Calculation of tolerance scores and development of biological indices of stress
Figure 3.1. Illustration of the calculation of ATSPT
Step
Zooplankton were sampled at four di�erent sites. Three samples of zooplankton were collected at each site (at Left, Middle and Right). Data in the table is number of individual found per sample.
Example Calculation
SDS is determined by a group of ecologists who attribute a score of 1 (little or no disturbance) to 3 (substantial disturbance) to each of the sampling sites.
Step 1: Calculation of SDS for each site
Eight participants gave the following scores:
for Site 1: 1, 1, 1, 1, 1, 1, 1, 1
for Site 3: 1, 1, 2, 1, 2, 2, 2, 3
for Site 2: 1, 1, 2, 1, 1, 1, 1, 2
for Site 4: 3, 3, 3, 3, 3, 2, 3, 3
SDS1 = (1+1+1+1+1+1+1+1)/8 = 1.00
SDS2 = (1+1+2+1+1+1+1+2)/8 = 1.25
SDS3 = (1+1+2+1+2+2+2+3)/8 = 1.75
SDS4 = (3+3+3+3+3+2+3+3)/8 = 2.88
This is calculated as the average of the SDSs for all samples in which the particular taxon was collected.
Step 2. Calculation of the Tolerance Score for each taxon
Taxon A was found in: 1, 3, 2, 3 samples from Sites 1, 2, 3, 4 respectively.
Taxon C was found in: 2, 2, 2, 3 samples from Sites 1, 2, 3, 4 respectively.
Taxon B was found in: 2, 3, 3, 0 samples from Sites 1, 2, 3, 4 respectively.
The tolerance score of taxon A would be: (1.00*1+1.25*3+1.75*2+2.88*3)/(1+3+2+3) = 1.88
The tolerance score of taxon C would be: (1.00*2+1.25*2+1.75*2+2.88*3)/(2+2+2+3) = 1.85
The tolerance score of taxon B would be: (1.00*2+1.25*3+1.75*3+2.88*0)/(2+3+3+0) = 1.38
Tolerance scores were then re-scaled to range from 0 – 100 instead of 1 – 3, in order to make a more sensible range.
Step 3. Re-scaling of Tolerance Scores
The re-scaling is done by subtracting 1 from the average tolerance score and then multiplying the remainder by 50.
Re-scaling of Tolerance Score (taxon A) = (1.88-1.00)*50 = 43.75 Re-scaling of Tolerance Score (taxon B) = (1.38-1.00)*50 = 18.75 Re-scaling of Tolerance Score (taxon C) = (1.85-1.00)*50 = 42.36
L M R L M R L M R L M RTaxon A 1 196 149 145 1 8 13 7 6Taxon B 2 1 1 2 1 2 3 2Taxon C 2 1 3 1 1 5 42 38 78
Site 4Taxa Name Site 1 Site 2 Site 3
Step 4. Calculation of the Average Tolerance Score Per Taxon for each individual sample from a site
=(43.75*1+18.75*1+42.36*1)/(1+1+1) = 34.95Site 2, sample 1: taxa A, B, C were found
=(43.75*0+18.75*1+42.36*0)/(0+1+0) = 18.75Site 1, sample 1: taxa B was found
=(43.75*1+18.75*0+42.36*1)/(1+0+1) = 43.06Site 1, sample 3: taxa A, C were found=(43.75*0+18.75*1+42.36*1)/(0+1+1) = 30.56Site 1, sample 2: taxa B, C were found
=(43.75*1+18.75*1+42.36*0)/(1+1+0) = 31.25Site 2, sample 2: taxa A, B were found=(43.75*1+18.75*1+42.36*1)/(1+1+1) = 34.95Site 2, sample 3: taxa A, B, C were found
=(43.75*1+18.75*1+42.36*1)/(1+1+1) = 34.95Site 3, sample 1: taxa A, B, C were found=(43.75*1+18.75*1+42.36*0)/(1+1+0) = 31.25Site 3, sample 2: taxa A, B were found=(43.75*0+18.75*1+42.36*1)/(0+1+1) = 30.56Site 3, sample 3: taxa B, C were found=(43.75*1+18.75*0+42.36*1)/(1+0+1) = 43.06Site 4, sample 1: taxa A, C were found=(43.75*1+18.75*0+42.36*1)/(1+0+1) = 43.06Site 4, sample 2: taxa A, C were found=(43.75*1+18.75*0+42.36*1)/(1+0+1) = 43.06Site 4, sample 3: taxa A, C were found
Step 5. Calculation of the mean Average Tolerance Score Per Taxon for each site
=(34.95+31.25+30.56)/3 = 32.25ATSPT for Site 3
=(34.95+31.25+34.95)/3 = 33.72ATSPT for Site 2
=(18.75+30.56+43.06)/3 = 30.79ATSPT for Site 1
=(43.06+43.06+43.06)/3 = 43.06ATSPT for Site 4

Report on the 2006 biomonitoring survey of the lower Mekong River and selected tributaries
Page 18
Page 19
4. Environmental variables
4.1 Introduction
Variables describing the physical and chemical environment provide essential information for characterising aquatic ecosystems, because these factors directly influence the structure and function of an ecosystem’s biological components. Physical and chemical variables are widely used to set water-quality standards and can be used to assist in interpreting biological trends and patterns. Although the biological monitoring programme has only recently begun, the Mekong River Commission has been monitoring physical and chemical water-quality in the Mekong River Basin for over 20 years (Campbell, 2007).
The objectives of the study of the physical and chemical factors completed in 2006 were as follows: (i) to describe selected physical and chemical characteristics of sites in the lower Mekong River, and (ii) to provide environmental data that could be related to various biological patterns. To address these objectives, the study collected data on altitude, river width, water depth, water transparency, turbidity, water temperature, dissolved oxygen, electrical conductivity (EC), and pH. The amounts of chlorophyll-a and various algal groups were also measured.
4.2 Study sites and sampling methods
Study sites
In March 2006, various environmental variables were measured at 21 sites in the Mekong River and its tributaries. Details of the study sites are provided in Chapter 2. Study sites sampled in 2004 and 2005 are presented in the biomonitoring reports for those years (MRC 2006; MRC, in press).
Field methods
The sampling methods in the 2006 survey generally followed those used in the 2005 survey (MRC, in press). The map coordinates and altitudes of the sampling sites were determined with a Garmin GPS 12xL, and stream width was measured with a Newcon Optik LRB 7x50 laser rangefinder. At each site, water-quality measurements were made in three sections of the river: near the left bank, near the right bank, and in the centre of the river. A Secchi disc was used

Report on the 2006 biomonitoring survey of the lower Mekong River and selected tributaries
Page 20
to determine water transparency. The disc was slowly lowered into the water, and the depth at which it could no longer be seen was recorded. The disc was then lowered another metre and slowly pulled up until it reappeared. If it reappeared at a depth more than 0.05 m different from the depth at which it disappeared, the procedure was repeated. Water turbidity was measured at the water surface with a Hach 2100P turbidity meter. Temperature, DO, EC, and pH were measured with YSI 556MP5 meter, calibrated according to the manufacturer’s instructions. Readings were taken at the surface and at a depth of 3.5 m, or the maximum of the river, whichever was less.
The amount of chlorophyll-a in water was measured at the surface with an Aquaflour hand-held fluorimeter. In addition, the amounts of pigments for four algal groups (green, blue green, diatoms, and cryptomonads) in the water column were averaged from readings at different depths taken with a Ts. UV Fluorimeter.
Data analysis
The environmental variables were reported as average values. Site comparisons were made for selected variables in a simple graphic form. In Chapter 9, correlation coefficients are reported between selected environmental variables and ATSPT values for all biological assemblages examined (data from Chapters 5 – 8).
4.3 Results
Environmental data collected in 2006
The environmental variables showed a broad range of values across the 21 study sites (Table 4.1). For example, altitude varied from 3 masl (metres above sea level) at sites CBS and CTU to 527 masl at site VSS. Channel width varied from as narrow as 39 m at CPT to as wide as 1,629 m at CNL. Water transparency (Secchi depth) ranged from 0.2 m at CSN to 1.5 m at site CMR. Over the sites sampled, average transparency was 0.76 m (with standard deviation of ±0.37 m). Turbidity was generally higher at sites in the main channel than at sites in tributaries, except for VSR where the site sampled was downstream (~ 6 km) from a dam construction site. The average turbidity was 19.01 (±17.19) NTU with the lowest value of 6 NTU at CSJ and the highest of 71 NTU at VSR. Chlorophyll-a ranged between 0.27 and 3.99 μg/L with an average of 1.26 (±1.09) μg/L.
Water temperature (Fig. 8.1) varied slightly from site to site, with an average of 29.6ºC (±1.4ºC). Dissolved oxygen (DO) concentrations (Fig. 8.1) were generally high compared to those typically reported for tropical waters, with an average of 6.8 mg/L (±1.67 mg/L). The highest value of 10.5 mg/L was at site CMR, and lower DO values were found at sites with

Page 21
Environmental variables
human activities, such as site CSK and site VCD. The lowest value of 3.8 mg/L was recorded at site CSK.
Table 4.1. Altitude, river width, maximum water depth and average water transparency (Secchi depth), turbidity and the amount of chlorophyll-a for 21 sites sampled in 2006.
Site Altitude (m) Width (m) Depth (m) Secchi Depth (m)
Turbidity (NTU)
Chlorophyll-a (µg/L)
CPP 6 460 12.0 0.54 25.87 3.36CBS 3 298 7.0 0.72 14.37 2.13CNL 14 1,629 15.0 0.78 21.53 0.72CTU 3 522 10.0 0.52 29.97 1.12CSN 6 66 4.5 0.20 12.93 2.04CSK 5 127 2.0 0.33 37.50 3.45CPT 13 39 1.6 0.26 55.50 3.99CKT 13 1,300 8.0 1.30 5.87 0.27CMR 58 450 8.0 1.50 5.89 0.42CSJ 52 622 3.0 1.10 5.67 0.61CKM 50 386 2.0 1.18 6.05 0.57CSP 102 200 2.8 1.07 6.77 0.61CSU 134 173 15.0 1.17 7.51 0.39VSS 527 167 1.5 0.98 9.14 0.40VSR 312 106 5.0 0.18 71.08 0.98VTR 9 1,070 5.2 0.68 13.17 0.82VCT 10 872 6.9 0.63 15.93 1.20VLX 7 662 7.7 0.67 12.55 0.97VCL 7 1,090 15.0 0.59 14.27 0.97VTC 6 1,180 12.0 0.97 8.26 0.73VCD 5 255 7.4 0.55 19.32 0.63
Figure 4.1. Dissolved oxygen concentration (mg/L) and temperature (°C) at the water surface, based on averages of measurements taken at the left bank, right bank, and centre of the channel at 21 sites sampled in 2006.
25 26 27 28 29 30 31 32 330
2
4
6
8
10
12
Temperature (0C)
Dis
solv
ed o
xyg
en (m
g/L
)
CPP
VCD
CSKCPT
VCT
CTUVLXVTR
CSP CNLCSNVSRCSJVSS VTC
CBSVCLCSU CKT CKM
CMR
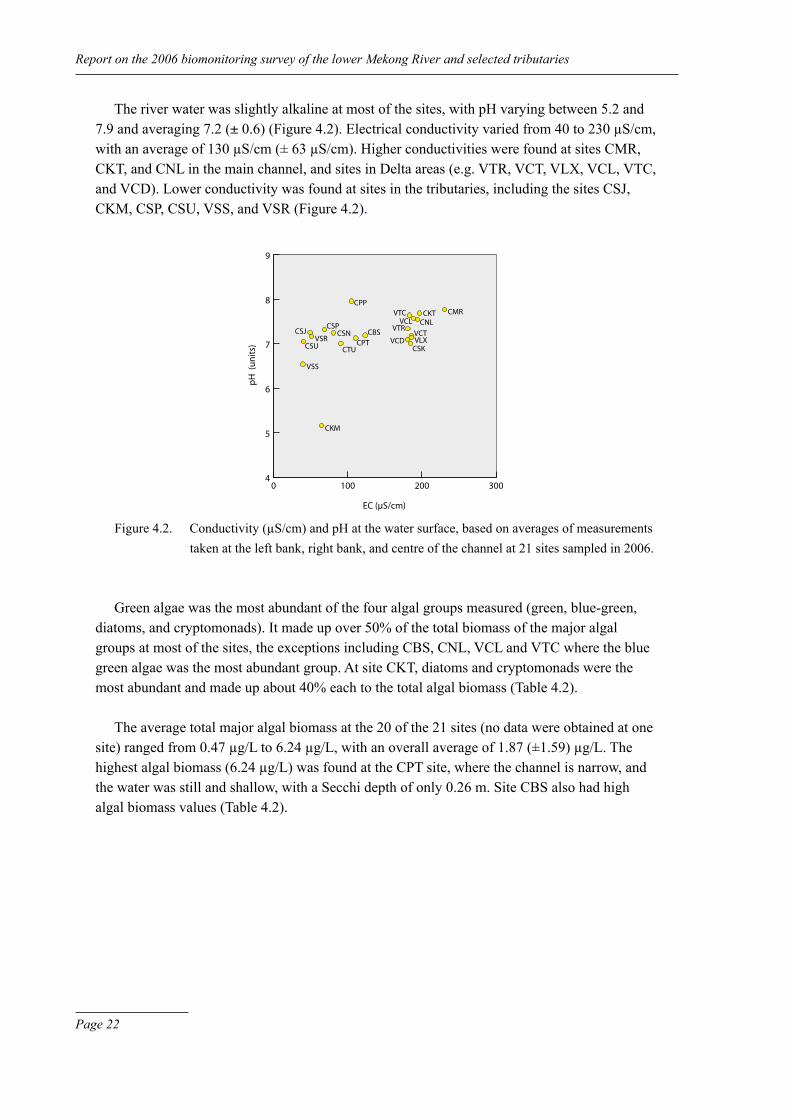
Report on the 2006 biomonitoring survey of the lower Mekong River and selected tributaries
Page 22
The river water was slightly alkaline at most of the sites, with pH varying between 5.2 and 7.9 and averaging 7.2 (± 0.6) (Figure 4.2). Electrical conductivity varied from 40 to 230 µS/cm, with an average of 130 µS/cm (± 63 µS/cm). Higher conductivities were found at sites CMR, CKT, and CNL in the main channel, and sites in Delta areas (e.g. VTR, VCT, VLX, VCL, VTC, and VCD). Lower conductivity was found at sites in the tributaries, including the sites CSJ, CKM, CSP, CSU, VSS, and VSR (Figure 4.2).
Figure 4.2. Conductivity (µS/cm) and pH at the water surface, based on averages of measurements taken at the left bank, right bank, and centre of the channel at 21 sites sampled in 2006.
Green algae was the most abundant of the four algal groups measured (green, blue-green, diatoms, and cryptomonads). It made up over 50% of the total biomass of the major algal groups at most of the sites, the exceptions including CBS, CNL, VCL and VTC where the blue green algae was the most abundant group. At site CKT, diatoms and cryptomonads were the most abundant and made up about 40% each to the total algal biomass (Table 4.2).
The average total major algal biomass at the 20 of the 21 sites (no data were obtained at one site) ranged from 0.47 µg/L to 6.24 µg/L, with an overall average of 1.87 (±1.59) µg/L. The highest algal biomass (6.24 µg/L) was found at the CPT site, where the channel is narrow, and the water was still and shallow, with a Secchi depth of only 0.26 m. Site CBS also had high algal biomass values (Table 4.2).
0 100 200 3004
5
6
7
8
9
EC (µS/cm)
pH
(u
nit
s)
CPP
VCDCSK
CPTVCT
CTUVLX
VTRCSP CNL
CSNVSR
CSJ
VSS
VTC
CBS
VCL
CSU
CKT
CKM
CMR

Page 23
Environmental variables
Table 4.2. Biomass of green, blue green algae, diatoms, and cryptomonads for 21 sites sampled in 2006.
Site Green algae (µg/L)
Blue green algae (µg/L)
Diatoms (µg/ L) Cryptomonads (µg/L)
Total (µg/L)
CPP 0.40 0.15 0.12 0.01 0.68CBS 1.89 3.58 0.07 0.13 5.66CNL 0.19 0.33 0.06 0.10 0.68CTU 0.40 0.26 0.17 0.14 0.97CSN 1.79 1.05 0.42 0.49 3.75CSK 1.31 0.58 0.07 0.06 2.02CPT 2.63 2.47 1.03 0.11 6.24CMR NACKT 0.05 0.09 0.35 0.37 0.86CSJ 1.07 0.72 0.07 0.05 1.90CKM 1.07 0.60 0.18 0.06 1.92CSP 0.67 0.50 0.15 0.00 1.32CSU 0.45 0.13 0.01 0.06 0.65VSS 0.23 0.05 0.18 0.00 0.47VSR 0.67 0.36 0.08 0.00 1.11VTR 0.73 0.51 0.08 0.00 1.32VCT 1.05 0.49 0.08 0.06 1.68VLX 0.82 0.66 0.06 0.02 1.56VCL 0.77 0.83 0.40 0.03 2.03VTC 0.59 0.96 0.36 0.03 1.94VCD 0.33 0.28 0.00 0.02 0.64
4.4 Discussion
Physical and chemical conditions in the Mekong River System
The environmental variables at the sampling sites were mostly within the natural ranges expected for surface waters in this region. Conductivity was within the natural range although it was slightly higher at the main channel sites and sites in the Delta area. The pH, DO, and temperature data were also within the ranges defined for aquatic ecosystems according to the standards for surface water quality set by Thailand, Viet Nam, and Cambodia (MRC, 2005; PCD, 2004). The distinctly low pH value of 5 at CKM may have been caused by recent activities upstream of that sampling site. This conclusion is based on the pH value of 7.5 taken at the same site in 2005 (MRC, in press).
Dissolved oxygen values were high, even at those sites showing evidence of human disturbances from villages, agriculture, or dam construction. Most of the sites had DO values higher than, or very close to 6 mg/L, falling within Class 2 (very clean) of Thailand’s water quality standards and within the range specified for biodiversity conservation for Cambodian

Report on the 2006 biomonitoring survey of the lower Mekong River and selected tributaries
Page 24
rivers. Although sites CSK, VCD, and CPT had low DO, they were still within Class 3 (suitable for agriculture, navigation).
The high turbidity and low Secchi disk depth at site VSR were most probably caused by the sediments released from the dam construction site, 6 km upstream.
Nutrients are important factors affecting algal assemblages and biomass in natural waters. The high total algal biomasses at sites CBS and CPT were also associated with high levels of blue green algae. These may have been caused by high nutrient inputs from human activities including agriculture and sewage disposal nearby.

Page 25
5. Benthic diatoms
5.1 Introduction
Algae, including diatoms, are important primary producers in aquatic ecosystems. The major function of these small photosynthetic organisms is as a base for pathways by which energy and materials are transferred in aquatic food-webs. Moreover, algae have many human uses in areas such as in aquaculture, environmental monitoring, and medicine.
Diatoms have been studied in Southeast Asia since the late 19th century, when early taxonomic studies were undertaken by foreign scientists. Ostrup reported 81 species of diatoms from Koh Chang Island, after the Danish expeditions to Thailand in 1899 – 1900 (Peerapornpisal et al., 2000). Patrick (1939) reported 185 diatom species in her study of the intestinal contents of tadpoles from Thailand and the Federal Malay States. In 1961 – 1962, material collected by the Joint Thai-Japanese Biological Expedition to Southeast Asia was identified by Hirano and has served as a valuable species list of potential taxa present.
The objective of this chapter is to (i) describe the characteristics of the diatom community that was quantitatively sampled at 21 sites in 2006, (ii) report tolerance scores based on the diatom community present at each of the sites examined in 2006, and (iii) relate tolerance scores and other metrics to the Site Disturbance Score.
5.2 Study sites and sampling methods
Study sites
In March 2006, benthic diatoms were sampled along the shore at 21 sites in the Mekong River and its tributaries. These sites are listed in Chapter 2. Details of the sample sites examined in 2004 and 2005 are given in the biomonitoring reports for those years (MRC, 2006; MRC, in press).
Field methods
Locations for sampling of benthic diatoms were chosen where the water depth was less than 1 m and substrata suitable for sampling extended over 100 m. The most appropriate substrata were cobbles and other stones with a surface area that was greater than 10 cm2, but still small

Report on the 2006 biomonitoring survey of the lower Mekong River and selected tributaries
Page 26
enough to fit in a sampling bowl of 20–30 cm diameter. At sites that lacked stones but had predominantly muddy or sandy beds, suitable substrata included bamboo sticks, aquatic plants, and artificial substrata.
Ten points were sampled at intervals of about 10 m. At each point a single stone was selected that appeared to be covered by a thin brownish film or have a slippery feel, which are often signs of a coating of abundant benthic diatoms. For each point that had no stones, the nearest hard substratum was sampled. To sample the diatoms, a plastic sheet with a 10 cm2 square cutout was placed on the upper surface of the selected stone or other substratum, and benthic diatoms were brushed and washed off into a plastic bowl until the cutout area was completely clear. Each sample was transferred to a plastic container and labelled with the site name, location code, date, and replicate number. The collector’s name and substratum type were also recorded. Samples were preserved with Lugol’s solution.
Laboratory methods
In the laboratory, the samples were cleaned by digestion in concentrated acid, and then centrifuged at 3500 rpm for 15 minutes. The diatom cells (the brown layer between the supernatant and solid particles) were siphoned into an 18 cm core tube. Strong acid (H2SO4, HCl or HNO3) was added and the tubes were heated in a boiler (70 – 80 oC) for 30 – 45 minutes. The samples were then rinsed with de-ionized water 4 – 5 times and adjusted to a volume of 1 mL. 2 – 3 drops of each sample (0.02 mL per drop) were placed on a microscope slide and dried. A mounting agent such as Naphrax or Durax was added to make a permanent slide for diatom identification and counting, which were done under a compound microscope; about 300 diatom cells were counted per slide and used to estimate total numbers per sample. Identification was based on frustule type, size, special characteristics, and structure, as described and illustrated in textbooks, monographs and other publications on tropical and temperate diatoms (Foged, 1971, 1975, 1976; Krammer & Lange-Bertalot, 1986, 1988, 1991a, 1991b; Pfister, 1992). In many cases, species-level identifications were not possible and presumptive species were designated by numbers. All samples of diatoms collected from 2004 – 2006 have been standardised in terms of the numerical designations used to describe the taxa. The permanent slides are kept in the Applied Algal Research Laboratory Collection at Chiang Mai University.
Multimetric analysis
The following metrics were calculated for all sites sampled in 2006 : (i) taxonomic richness (i.e. number of taxa), (ii) abundance (numbers of individuals per unit area sampled), (iii) the Shannon-Wiener Diversity Index, and (iv) the Berger-Parker Dominance Index. The Shannon-Wiener Diversity Index (H’) is based on species richness and evenness in abundance among species (Pinder, 1999; Stiling, 2002), and is calculated by the following formula:

Page 27
Benthic diatoms
sH' = -Ʃpi.log(pi)
i=1
where pi is the proportion of individuals in the sample that belong to the ith of s taxa. The Berger-Parker Index (D) expresses the dominance of the single most abundant taxon as (from Stiling, 2002):
D = 1-Nmax
N
where Nmax is the number of individuals of the most common taxon and N is the total number of individuals in the sample.
The above metrics were related to the Average Site Disturbance Scores, which were calculated for each site as described in Chapter 3.
Tolerance values
Tolerance values were calculated for each taxon of benthic diatoms collected in 2004, 2005 and 2006, as described in Chapter 3. The Average Tolerance Score per Taxon (ATSPT) was calculated for each sample and then averaged over all samples in each sampling event from 2004 – 2006. Average ATSPT values were rated as described in Chapter 9.
5.3 Results
Biota collected in 2006
The 21 sites sampled in 2006 yielded a total of 79 species of benthic diatoms out of the 2100 cm2 of algal samples collected; 75 species were in the order Pennales and 4 in the order Centrales (Appendix 1.1). Navicula symmetrica, Gomphonema parvulum and Nitzschia clausii had the widest distribution and each occurred at all sites sampled.

Report on the 2006 biomonitoring survey of the lower Mekong River and selected tributaries
Page 28
Species richness
Species richness per site ranged from 13 to 38 at the 2006 sites (Table 5.1). The highest richness occurred at sites CKM (38 species) and CSJ (35 species), while the lowest richness was found at the lower Mekong River sites that had sandy and muddy substrata, such as sites VCT (13 species) and CSU (14 species).
Abundance
The average density of diatoms ranged from 72 to 377 cells/cm2 at the 2006 sites (Table 5.1). The highest abundance occurred at site CPP (377 cells/cm2), while the lowest abundance was found at the lower Mekong River sites in Viet Nam that had hard muddy substrata, such as site VCT (72 cells/cm2).
Table 5.1. Diatom metrics for 2006.
Site No. of species Density (cell/cm2)
CPP 19 377.1CBS 19 311.1CNL 22 313.6CTU 13 219.1CSN 19 221.3CSK 13 107.0CPT 24 268.3CKT 26 134.3CMR 28 216.8CSJ 35 313.5CKM 38 249.8CSP 30 308.0CSU 14 140.0VSS 25 334.1VSR 31 161.2VTR 21 100.1VCT 13 72.1VLX 18 316.5VCL 23 179.7VTC 19 234.4VCD 19 279.5

Page 29
Benthic diatoms
Shannon-Wiener diversity index
The Shannon-Wiener diversity index ranged from 1.2 to 2.5 at the 21 sites examined (Figure 5.1). The values for diversity were highest at sites that had sandy and hard substrata, such as CKT and CMR (2.52 and 2.64), while the lowest diversity index values were at the sites that had muddy and debris substrata, such as site CPT (1.18).
Dominance index
The Berger-Parker dominance index ranged from 0.30 to 0.85 in the 2006 sites (Figure 5.1). The lowest dominance index value occurred at sites that had muddy and debris substrata, such as site CPT (0.30), while the highest dominance index was at sites that had sandy and hard substrata, such as CKT and CMR (0.84 and 0.85 respectively).
There is a strong direct relationship between the values of the species diversity index and the dominance index (Figure 5.1).
Figure 5.1 Values of the diversity index (H’) and dominance index (D) for benthic diatoms at 21 sites in 2006.
Relationship of richness and abundance, and of species diversity and dominance index values, to the Average Site Disturbance Score
Taxonomic richness, number of individuals, and the values of the species diversity index and the dominance index from 57 sampling events at 43 sites, 2004 – 2006, showed no statistically
0.2 0.4 0.6 0.8 1.00.0
0.5
1.0
1.5
2.0
2.5
3.0
CPP
CTUVCD
CPT
VLX
CMR
CBSVTC
VSR
CSP
VTR
VCT& CSU
CSJ
CSK
CKMCNL
VSS
CSN
VCL
CKT
Div
ersi
ty in
dex
Dominance index

Report on the 2006 biomonitoring survey of the lower Mekong River and selected tributaries
Page 30
significant relationships with the Average Site Disturbance Score (P > 0.05; Figures 5.2 – 5.5). Likewise, a log transformation of abundance data did not produce a statistically significant relationship.
Figure 5.2 Top left. Regression relationship between taxonomic richness of benthic diatoms and the Average Site Disturbance Score for sites sampled in 2004, 2005 and 2006.
Figure 5.3 Top right. Regression relationship between abundance of benthic diatoms and the Average Site Disturbance Score for sites sampled in 2004, 2005 and 2006.
Figure 5.4 Bottom left. Regression relationship between the Shannon-Wiener diversity index for benthic diatoms and the Average Site Disturbance Score for sites sampled in 2004, 2005 and 2006.
Figure 5.5 Bottom right. Regression relationship between the Berger-Parker dominance index for benthic diatoms and the Average Site Disturbance Score for sites sampled in 2004, 2005 and 2006.
1.0 1.5 2.0 2.5 3.00
10
20
30
40
50
60
70
80
Site Disturbance Score
Nu
mb
er o
f sp
ecie
s
R2 =0.0430P = 0.120
Richness(diatoms, 2004-2006)
1.0 1.5 2.0 2.5 3.00.5
1.0
1.5
2.0
2.5
3.0
3.5
Site Disturbance score
Div
ersi
ty (S
han
no
n-W
ien
er in
dex
)
R2 = 0.0140P = 0.388
Species Diversity Index(diatoms, 2004-2006)
1.0 1.5 2.0 2.5 3.00
100
200
300
400
500
Site Disturbance ScoreN
um
ber
of i
nd
ivid
ual
s (c
ells
/cm
2 )
R2 = 0.0110P = 0.447
Abundance(diatoms, 2004-2006)
1.0 1.5 2.0 2.5 3.00.0
0.1
0.2
0.3
0.4
0.5
0.6
0.7
0.8
0.9
Site Disturbance Score
Do
min
ance
(Ber
ger
-Par
ker i
nd
ex)
R2 = 0.0006P = 0.697
Dominance Index(diatoms, 2004-2006)

Page 31
Benthic diatoms
Variation in ATSPT among sampling sites in the Lower Mekong, 2004-2006
The tolerance values for individual taxa of benthic diatoms collected from 2004 – 2006 varied from 4 to 75 (Appendix 1.2) and middle-range values were most numerous (Chapter 9). The ATSPT varied greatly among the sites examined in 2004 – 2006, ranging from 28 to 52. These scores ranged up to 4.3 standard deviations above the mean for reference sites, placing the sites in classes A – C (low – medium stress). No sites ranked in the high or very high tolerance levels. There was a very strong, statistically significant, relationship between ATSPT and Average Site Disturbance Score (Figure 5.6).
There was a general trend of increasing the ATSPTs from north to south indicating a decrease in pollution sensitive species. Generally, ATSPTs were lower in the upper and tributaries sites than in the lower Mekong sites.
Figure 5.6 Regression relationship between the ATSPT for benthic diatoms and the Average Site Disturbance Score for sites sampled in 2004, 2005 and 2006.
5.4 Discussion
Relationship of richness and abundance, and of species diversity and dominance index values, to the Average Site Disturbance Score
No statistically significant relationships were found between the above metrics from 57 sampling events at 43 sites and the Average Site Disturbance Score from these sites. In addition, log transformation of abundance did not produce a statistically significant relationship. Values of all these metrics were highly variable among the sites, probably because of differences in
1.0 1.5 2.0 2.5 3.00
10
20
30
40
50
60
70
80
90
100
Site Disturbance Score
ATSP
T va
lue
R2 = 0.649P = 4.23 E-14
ATSPT(diatoms, 2004-2006)

Report on the 2006 biomonitoring survey of the lower Mekong River and selected tributaries
Page 32
habitat. For example, the high richness occurring at tributaries of the Mekong River, sites TKO (52 species), TSK (41 species) and CKM (38 species), and the island in the Mekong River, VTC (37 species), was associated with appropriate substrata (i.e. hard substrata such as cobbles and stones), and physical conditions, such as high transparency and low disturbance, that made these sites conducive to a rich flora of benthic diatoms. In contrast, the coarse sand, mud and clay substrata at main-channel sites VTC (13 species), CTU (13 species), LKL (14 species), and CSU (14 species) were an obvious limiting factor for richness of benthic diatoms. Variations in abundance and values of the species diversity and dominance indices can be attributed to the same factors.
Tolerance scores
The distribution of tolerance scores for the taxa of diatoms collected in 2004 – 2006 indicates a flora that has some sensitive taxa but is predominantly composed of taxa with middle-range pollution tolerance. This is similar to the results for zooplankton but different from those for benthic and littoral macroinvertebrates, which included a higher proportion of sensitive taxa.
Some stress-sensitive taxa were found as numerically dominant species in the sites with low human impact. For example, Synedra ulna var. aequalis, with a tolerance value of 33.6 that is indicative of a stress-sensitive species, was found in high abundance at site CPS, which had a somewhat higher ATSPT (43).
Variation in ATSPT among sampling sites in the Lower Mekong, 2004 –2006
The distribution of ATSPT values at the 43 sites visited reflects a gradient of increasing stress from north to south. For example, the sites with lower Average Site Disturbance Scores (LMH, LMX, LNO, LNK, LPB, LKL, CSJ, CKM, CKT) had lower ATSPT values than Mekong River sampling sites down river, where the Average Site Disturbance Scores and the ATSPT values are higher (e.g. sites CTU, CPP, CNL, CBS, VTC, VCD, VCL, VLX, VTR, and VCT). Furthermore, the ATSPTs calculated for the benthic diatoms in lower Mekong River sites were higher than the values of sites in the tributaries. The average ATSPT in the sites sampled in the four countries from 2004 – 2006 ranged from a low in Lao PDR (35), through Cambodia (38) and Thailand (41), to a high in Viet Nam (45).
Page 33
6. Zooplankton
6.1 Introduction
Zooplankton are widely distributed and present in most water bodies in the world. In rivers, the smallest members of the zooplankton are protozoans and rotifers (Kudo, 1963), and the larger zooplankton are mostly crustaceans (Hynes, 1970). The zooplankton community is composed of both primary consumers, which feed on bacteria and phytoplankton, and secondary consumers, which feed on other zooplankton. Zooplankton link the primary producers (phytoplankton) with larger organisms at higher trophic levels, and they are important as food for forage fish species and for larval stages of all fish.
Zooplankton are excellent indicators of environmental conditions because they respond to low concentrations of dissolved oxygen, high levels of nutrients and non-living organic matter, and toxic contaminants. The main groups of zooplankton, especially Crustacea and Eurotatorea, have long been assessed quantitatively and considered useful in evaluating environmental quality (Crivelli and Catsadorakis, 1997). Recently, zooplankton have been increasingly used in biological monitoring programs. For example, zooplankton were used as indicators in an ecological health assessment for estuaries in Australia (Deeley and Paling, 1999). However, in the Mekong River system, studies of zooplankton have been limited. Most studies have concerned the Mekong Delta in Viet Nam (e.g. Doan et al., 2000; Le and Pham, 2002) and have focused on taxonomy and food resources for fisheries.
The objective of this report is to: (i) describe the characteristics of the zooplankton community that was quantitatively sampled at 21 sites in 2006; (ii) tolerance scores based on the zooplankton community for each of the sites examined in 2006, and (iii) relate tolerance scores and other metrics to the Site Disturbance Score.
6.2 Study sites and sampling methods
Study sites
In March 2006, zooplankton samples were collected at 21 sites in the Mekong River and its tributaries within two countries, Cambodia and Viet Nam, as listed in Chapter 2. Details of the sample sites examined in 2004 and 2005 are given in biomonitoring reports for those years (MRC, 2006; MRC, in press).

Report on the 2006 biomonitoring survey of the lower Mekong River and selected tributaries
Page 34
Field methods
Three samples were collected at each site. One was taken near the left bank of the river, at a distance of about 4 – 5 m from the water’s edge. A separate sample was taken at a similar distance from the right bank, and another in the middle of the river. The samples were taken at least 1 m from potentially contaminating substances such as debris and aquatic plants, and at least 2 m from vertical banks. At sites where the water current was too fast to sample exactly in the mid-stream, samples were collected closer to the left or the right bank, but not as close to the bank as where the ‘side samples’ were taken.
Before sampling at each site, the sampling equipment (a net, bucket, and plastic jar) was washed to remove any organisms and other matter left from the previous site. Quantitative samples were collected at a depth of 0 to 0.5 m in a bucket having a volume of 10 L. The 10 L of river water collected was filtered slowly through a plankton net (mesh size of 20 µm) to avoid any overflow. When the water volume remaining in the net was about 150 mL, the water was transferred to a plastic jar (250 mL volume). The samples were immediately fixed in the field with 4% formaldehyde. The sample jars were labelled with the site name, site code, sampling position, sampling date, and the sample number.
Laboratory methods
In the laboratory, large debris particles were removed from the samples with forceps. Each sample was filtered via a net with a mesh size of 10 µm and rinsed with distilled water, and then settled in a graduated cylinder. Excess water was discarded until about 50 mL of water and settled material remained. This was transferred into a petri dish and examined under a stereo-microscope at a magnification of 40x to identify the large species of zooplankton (> 50 µm in diameter). The smaller species and details of larger species were examined on a microscope slide under a compound microscope at a magnification of 100 – 400 x. All individuals collected were counted and identified to lowest level of taxonomy possible, generally species. Identification was based on morphology as described in Vietnamese and international references (e.g. Dang et al., 1980; Eiji, 1993). After analysis, samples were returned to the bottles and preserved. All specimens are kept at Ton Duc Thang University, Ho Chi Minh City, Viet Nam.
Multimetric analysis
Zooplankton results from all sites sampled in the years 2004, 2005 and 2006 were used to calculate the following metrics: (i) species richness (number of taxa per site), (ii) abundance (number of individuals per sample), (iii) the Shannon-Wiener Diversity Index, and (iv) the Berger-Parker Dominance Index. The above metrics were tested for their potential use as indicators of human impact by regressing them against the ‘Average Site Disturbance Score’ derived for all sites

Page 35
Zooplankton
sampled in 2004, 2005, and 2006 as described in Chapter 3. For each metric examined against this index, p values and R2 values were calculated from linear least-squares regression.
Tolerance values
Tolerance values were calculated for each taxon of zooplankton collected in 2004, 2005, and 2006, as described in Chapter 3. The Average Tolerance Score per Taxon (ATSPT) was calculated for each sample, and then averaged over all samples in each sampling events for 2004 – 2006. The ATSPT was rated as described in Chapter 9.
6.3 Results
Biota collected in 2006
In total 20,825 individuals were collected in the zooplankton samples taken at the 21 sites examined in 2006. These comprised 105 species in 56 genera and 28 families, and 4 forms of larva. The zooplankton included four main groups: Crustacea (including Copepoda, Brachiopoda, and Ostracoda), Eurotatorea, Protozoa and larvae (Table 6.1). Eurotatorea had the most taxa (30 genera and 12 families comprising 58.7% of the total zooplankton taxa collected). The Brachionidae (Eurotatorea), Difflugiidae (Protozoa) and Lecanidae (Eurotatorea) were richest families with 17, 11 and 10 taxa, respectively (Appendix 2.1). The Ostracoda was represented by only one taxon, which was recorded at some sites in the Mekong Delta (Appendix 2.1).
Table 6.1. Total number of taxa of zooplankton recorded at 21 sites sampled in March 2006.
Group Number of taxaCrustacea- Copepoda- Ostracoda- Branchiopoda
2312110
Eurotatorea 64Protozoa 18Larvae 4
Eurotatorea, Protozoa, and larvae were recorded at all 21 sites, while Copepoda and Brachiopoda were found at 16 – 18 sites. Some taxa had a wide distribution from fresh water to brackish water (Crustacea: Pseudodiaptomidae, Eurotatoria: Brachionidae) whereas others were found only at some sites in Mekong Delta. Copepod nauplii (larval forms) had the
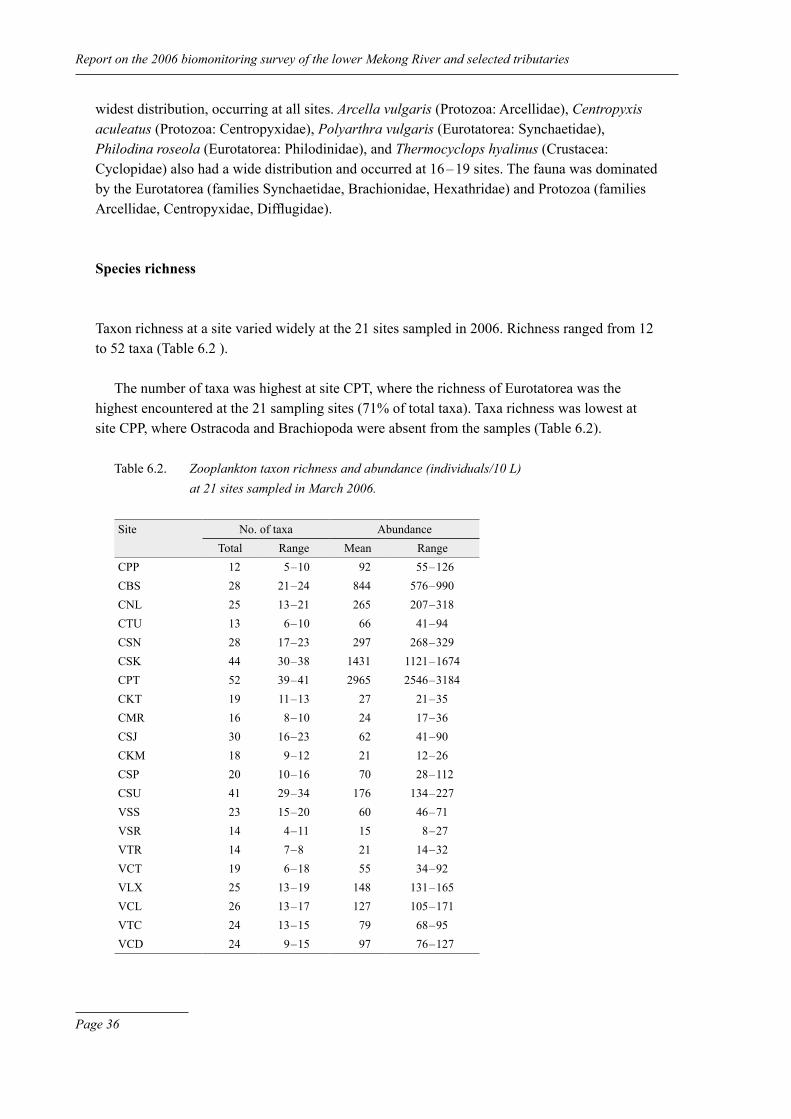
Report on the 2006 biomonitoring survey of the lower Mekong River and selected tributaries
Page 36
widest distribution, occurring at all sites. Arcella vulgaris (Protozoa: Arcellidae), Centropyxis aculeatus (Protozoa: Centropyxidae), Polyarthra vulgaris (Eurotatorea: Synchaetidae), Philodina roseola (Eurotatorea: Philodinidae), and Thermocyclops hyalinus (Crustacea: Cyclopidae) also had a wide distribution and occurred at 16 – 19 sites. The fauna was dominated by the Eurotatorea (families Synchaetidae, Brachionidae, Hexathridae) and Protozoa (families Arcellidae, Centropyxidae, Difflugidae).
Species richness
Taxon richness at a site varied widely at the 21 sites sampled in 2006. Richness ranged from 12 to 52 taxa (Table 6.2 ).
The number of taxa was highest at site CPT, where the richness of Eurotatorea was the highest encountered at the 21 sampling sites (71% of total taxa). Taxa richness was lowest at site CPP, where Ostracoda and Brachiopoda were absent from the samples (Table 6.2).
Table 6.2. Zooplankton taxon richness and abundance (individuals/10 L) at 21 sites sampled in March 2006.
Site No. of taxa AbundanceTotal Range Mean Range
CPP 12 5 – 10 92 55 – 126CBS 28 21 – 24 844 576 – 990CNL 25 13 – 21 265 207 – 318CTU 13 6 – 10 66 41 – 94CSN 28 17 – 23 297 268 – 329CSK 44 30 – 38 1431 1121 – 1674CPT 52 39 – 41 2965 2546 – 3184CKT 19 11 – 13 27 21 – 35CMR 16 8 – 10 24 17 – 36CSJ 30 16 – 23 62 41 – 90CKM 18 9 – 12 21 12 – 26CSP 20 10 – 16 70 28 – 112CSU 41 29 – 34 176 134 – 227VSS 23 15 – 20 60 46 – 71VSR 14 4 – 11 15 8 – 27VTR 14 7 – 8 21 14 – 32VCT 19 6 – 18 55 34 – 92VLX 25 13 – 19 148 131 – 165VCL 26 13 – 17 127 105 – 171VTC 24 13 – 15 79 68 – 95VCD 24 9 – 15 97 76 – 127

Page 37
Zooplankton
Abundance
Abundance at a site also varied at the 21 sites sampled in 2006. Mean abundance ranged from 15 to 2,965 individuals/10L (Table 6.2). As with number of taxa, the number of individuals was highest at site CPT (2,546 – 3,184 individuals/sample). Site CSK also had high abundance (1,121 – 1,674 individuals/sample). The dominant species present were those well adapted to nutrient-rich conditions and belonged to the families Synchaetidae and Brachionidae (Eurotatorea). The lowest abundance was at VSR (8 – 27 individuals/sample) where no or few crustaceans were present.
The species of the families Centropyxidae and Difflugidae (Protozoa) were numerically dominant, and these species characteristically occur in sites with high turbidity and slow water currents (Appendix 2.1).
Shannon-Wiener diversity index and dominance index
The Shannon-Wiener Diversity Index ranged from 0.63 to 2.91 in 2006 (Figure 6.1). The diversity index value was highest at site CSU, where there was high taxa richness. The diversity index value was lowest at site CPP, where the number of taxa was also lowest.
Figure 6.1 The diversity and dominance index values of zooplankton at 21 sites in 2006.
The Berger-Parker Dominance Index ranged from 0.12 to 0.84 in 2006 (Figure 6.1). The dominance index value was highly correlated with the diversity index value; the lowest dominance index value was at site CPP, where the diversity index value was also lowest. The
0.0 0.2 0.4 0.6 0.8 1.00.0
0.5
1.0
1.5
2.0
2.5
3.0
CPP
CTU
VCD
CPT
VLX
CMR
CBS
VTC
VSR CSP
VTR
VCT
CSJ
CSU
CSK
CKM
CNL
VSS
CSN
VCL
CKT
Shan
no
n-W
ien
er D
iver
sity
Ind
ex
Berger-Parker Dominance Index

Report on the 2006 biomonitoring survey of the lower Mekong River and selected tributaries
Page 38
highest dominance index value was at site CKT, where the value of diversity index was also high (Figure 6.1).
Figure 6.2 Top left. Relationship between the richness of zooplankton and the Average Site Disturbance Score for sites sampled in 2004, 2005, and 2006.
Figure 6.3 Top right. Relationship between the abundance of zooplankton and the Average Site Disturbance Score for sites sampled in 2004, 2005, and 2006.
Figure 6.4 Bottom left. Relationship between the diversity index of zooplankton and the Average Site Disturbance Score for sites sampled in 2004, 2005, and 2006.
Figure 6.5 Bottom right. Relationship between the dominance index of zooplankton and the Average Site Disturbance Score for sites sampled in 2004, 2005, and 2006.
1.0 1.5 2.0 2.5 3.00
10
20
30
40
50
60
70
Site Disturbance Score
Nu
mb
er o
f sp
ecie
s
R2 = 0.0390P = 0.141
Species Richness (zooplankton, 2004-2006)
1.0 1.5 2.0 2.5 3.00
1000
2000
3000
4000
5000
6000
7000
8000
9000
10000
Site Disturbance Score
R2 = 0.0620P = 0.063
Ab
un
dan
ce (n
um
ber
s o
f sp
ecim
ens)
Abundance(zooplankton, 2004-2006)
1.0 1.5 2.0 2.5 3.00.5
1.0
1.5
2.0
2.5
3.0
3.5
Site Disturbance Score
R2 = 0.0760P = 0.038
Shan
no
n-W
ien
er D
iver
sity
Ind
ex
Species Diversity Index(zooplankton, 2004-2006)
1.0 1.5 2.0 2.5 3.00.0
0.1
0.2
0.3
0.4
0.5
0.6
0.7
0.8
0.9
Site Disturbance Score
Ber
ger
-Par
ker D
om
inan
ce In
dex
)
R2 = 0.0660P = 0.054
Dominance Index(zooplankton, 2004-2006)
1.0

Page 39
Zooplankton
Relationship of richness and abundance, and of species diversity and dominance index values, to the Average Site Disturbance Score
For combined results for 57 sampling events at 43 sites (2004, 2005 and 2006), the relationship between richness and the Average Site Disturbance Score was not statistically significant (P > 0.05) (Figure 6.2).
Abundance did not have a statistically significant relationship with the Average Site Disturbance Score (P > 0.05). (Figure 6.3).
The correlation between the diversity index and the Average Site Disturbance Score at 57 sites was statistically significant (P = 0.038) (Figure 6.4).
The relationship between the dominance index and the Average Site Disturbance Score was not statistically significant (P = 0.054) (Figure 6.5).
Variation in ATSPT among sampling sites in the Lower Mekong River, 2004-2006
The tolerance values for individual taxa of zooplankton collected from 2004-2006 varied from 0 to 94. The ATSPT varied greatly among the sites examined in 2004-2006, ranging from 22 to 54 (Figure 6.6). There was a statistically significant relationship between the ATSPT values and the Average Site Disturbance Score (P < 0.05) (Figure 6.6).
Figure 6.6 Relationship between the Average Tolerance Score Per Taxon of zooplankton and the Average Site Disturbance Score for sites sampled in 2004, 2005, and 2006.
1.0 1.5 2.0 2.5 3.00
10
20
30
40
50
60
70
80
90
100
Site Disturbance Score
ATSP
T va
lue
R2 = 0.610P = 7.43E-13
ATSPT(zooplankton, 2004-2006)
Report on the 2006 biomonitoring survey of the lower Mekong River and selected tributaries
Page 40
In general, there was trend of increased ATSPT from north to south, indicating a decrease in pollution sensitive species.
6.4 Discussion
Relationship of richness, abundance, species diversity index values, and dominance index values, to the Average Site Disturbance Score
For the 57 sampling events at 43 sites, the relationships of species diversity index values to the average Site Disturbance Score were statistically significant. There was no significant relationship between richness, abundance, or the dominance index and the Average Site Disturbance Score, which may have been the result of natural variations in natural habitat suitability.
Zooplankton abundance was high at some sites where the Average Site Disturbance Score was also high. This suggests that at some sites the rich-nutrient environments, resulting from human activities, were favourable to the growth of the zooplankton community.
The species diversity index had a statistically significant relationship with the Average Site Disturbance Score, with the expected trend of decreasing diversity values as the Average Site Disturbance Score values increased. For example, site CPP (in 2006) had the highest value of Average Site Disturbance Scores (2.89) and the lowest value of the diversity index (0.626). In contrast, at some sites like LOU (in 2005) and LKU (in 2005), the Average Site Disturbance Score was low (1.0 and 1.13), the diversity index was high (2.09 and 1.93). This suggests that the diversity is reduced as human impact increases.
Variation in ATSPT among sampling sites in the Lower Mekong, 2004 – 2006
The range of tolerance values for the 195 taxa of zooplankton collected from 2004 – 2006 represent a fauna that has a predominance of taxa of intermediate stress tolerance (Appendix 2.2).
The distribution of ATSPT at the 43 sites visited reflects a gradient of increasing pollution or human impact levels from north to south. For example, the sites with lower human impact (LOU, LNO, LPB, LNK, LKU, LKL) are north of the sites with higher human impact (CSK, CSN, CTU, CPP, CBS, VTC, VCD, VCL, VLX, VTR, VCT).

Page 41
7. Littoral macroinvertebrates
7.1 Introduction
Littoral macroinvertebrates have been used widely in bioassessment activities primarily in temperate areas, but they have also been used in tropical countries. For example, Thorne and Williams (1997) applied a variety of rapid assessment methods for macroinvertebrates in Brazil, Ghana, and Thailand. They tested 20 analytical methods that have been used in temperate regions, including representatives of the five major types identified by Resh and Jackson (1993): richness indices, enumerations, diversity and similarity measures, biotic indices, and functional measures. Seven of the 20 methods behaved as expected in response to pollution gradients, but these did not include any enumeration or ‘functional feeding’ measures. Two diversity indices also failed to respond to pollution gradients in the predicted manner, whereas three ‘similarity/loss indices’ all met the test criteria. The Biological Monitoring Working Party (BMWP) score and the Average Score Per Taxon (ASPT) performed satisfactorily.
Mustow (1997) studied the macroinvertebrate community at 23 sites on the Mae Ping River in northern Thailand and suggested some modifications of the BMWP score to suit local conditions. According to Mustow (1997), 71 of the 85 BMWP families are known to occur in Thailand and 65 of these, together with an additional 33 that do not occur in the U.K., were found in the Mae Ping system. He incorporated 10 of these additional families in a modified BMWP scoring system, which he called the BMWPTHAI score. In addition, Pinder (1999) applied similar approaches to biomonitoring that are applicable to other areas of Southeast Asia as well.
The objective of this chapter is to: (i) describe the characteristics of the littoral macroinvertebrate community that was quantitatively sampled at 21 sites in 2006, (ii) report tolerance scores based on the littoral macroinvertebrate community for each of the sites examined in 2006, and (iii) relate tolerance scores and other metrics to the Site Disturbance Score.
7.2 Study sites and sampling methods
Study sites
In March 2006, samples of littoral macroinvertebrates were collected at the 21 sites in the Mekong River basin listed in Chapter 2. Details of the sample sites examined in 2004 and 2005 are given in the biomonitoring reports for those years (MRC, 2006; MRC, in press).

Report on the 2006 biomonitoring survey of the lower Mekong River and selected tributaries
Page 42
Field methods
At each site littoral macroinvertebrate samples usually were taken on only one side of the river. In most instances this was the depositional side where sampling was easier because of the gradual shelving of the bottom that occurs in this setting in contrast to the steeper bottom that is characteristic of the erosional side. In addition, the depositional side tends to support more aquatic vegetation, which also provides more habitat suitable for invertebrates. Because the study area was large, a wide range of littoral habitat types was sampled. As far as possible, similar habitats were selected at each site to facilitate comparisons among sites.
In 2006, as in 2003 and 2005, both sweep and kick sampling methods were used. A D-frame net with 30 cm x 20 cm opening and mesh size of 475µm was used for both sweep and kick sampling. Sweep samples were taken along the shore at intervals of about 20 m. To obtain each sweep sample, the collector stood in the river about 1.5 m from the water’s edge and swept the net toward the bank 10 times near the substrate surface. Each sweep was done for about 1 m at right angles to the bank, in water no deeper 1.5 m, and did not overlap the previous sweep. Kick sampling was done off-riverbank in areas of rapid current. Sampling involved kicking the substrate in an area of 30 x 30 cm, or using fingers to disturb this area, for about 20 seconds. A range of substrates was sampled, including cobbles, gravel, sand, silt, mud, and aquatic plants. Five kick and five sweep samples were taken per site, unless there was no suitable habitat for kick sampling, in which case ten sweep samples were taken.
After sample collection, the net contents were washed to the bottom of the net. The net was inverted and its contents were emptied into a metal sorting tray, with any material adhering to the net being washed off with clean water. Invertebrates were picked from the tray with forceps and placed in a jar of 70% ethanol. Small samples were kept in 30 mL jars and large samples were kept in 150 mL jars. During the picking process, the tray was shaken from time to time to redistribute the contents, and tilted occasionally to look for animals adhering to it. Sorting proceeded by working back and forth across the tray until no more animals were found. A second person then checked the tray to be sure that no animals remained. The sample jars were labelled with the site location code, date, and sample replicate number. The collector’s name, the sampling site, and replicate characteristics (including substrate types sampled) were recorded in a field notebook.
Laboratory methods
In the laboratory, the samples were identified under a stereomicroscope with a 2x – 4x objective lens and a 10x eyepiece. Identification was done to the lowest taxonomic level that could be applied accurately, which was usually to genus. The references used for identification included Sangpradub and Boonsoong (2004), Nguyen et al. (2000), and Merritt and Cummins (1996). Specimens were divided into orders, kept in separate jars. All specimens were stored in the Department of Biology at the National University of Laos.

Page 43
Littoral macroinvertebrates
Multimetric analysis
For all sites sampled in 2004, 2005, and 2006, the following metrics were calculated: (i) taxonomic richness (i.e. number of taxa), (ii) abundance (i.e. numbers of individuals per sample), (iii) the Shannon-Wiener Diversity Index, and (4) The Berger-Parker Dominance Index. The four metrics were tested for their potential as indicators of human impact by regressing values for all three years (57 sampling events for 43 sites) against the Average Site Disturbance Score, which was derived as described in Chapter 3. For each metric examined against this index, p values and r2 values were calculated from linear regression analyses.
Tolerance values
Tolerance values were calculated for each taxon of littoral macroinvertebrates collected in 2004, 2005, and 2006, as described in Chapter 3. The Average Tolerance Score per Taxon (ATSPT) were calculated for each sample, and then averaged over all samples in each sampling events for 2004 – 2006 (Appendix 3.3). ATSPT values were rated as described in Chapter 9.
7.3 Results
Biota collected in 2006
In 2006, 24,242 individuals and 116 taxa of littoral macroinvertebrates were collected at the 21 sites sampled (Appendix 3.1).
The Trichoptera, Ephemeroptera, Mesogastropoda, and Hemiptera were the richest orders of littoral macroinvertebrates with 28, 26, 24 and 20 taxa respectively. Hemiptera and Decapoda had the widest distribution, being found at all sites, while species of Nematoda and Basommatophora were found at only one and two sites each (Table 7.1). Two other groups, Diptera and Mesogastropoda, were also widely distributed. The groups that were widespread include taxa occurring in nutrient-rich conditions.
Almost half of the 21 sites examined in 2006 had more than 20 taxa and high abundance (Appendix 3.1).

Report on the 2006 biomonitoring survey of the lower Mekong River and selected tributaries
Page 44
Table 7.1. Numbers of taxa within each major group of littoral macroinvertebrate taxa recorded at each site in 2006.
Site
Am
phip
oda
Arc
oida
Bas
omm
atop
hora
Col
eopt
era
Col
lem
bola
Dec
apod
a
Dip
tera
Ephe
mer
opte
ra
Hem
ipte
ra
Lepi
dopt
era
Meg
alop
tera
Mes
ogas
tropo
da
Myt
iloid
a
Nem
atod
a
Neo
gast
ropo
da
Odo
nata
Olig
ocha
eta
Plec
opte
ra
Poly
chae
ta
Spha
erom
atid
ae
Tric
hopt
era
Uni
onoi
da
Vene
roid
a
Tota
l tax
a
CPP 0 0 0 0 0 3 0 0 1 0 0 0 0 0 1 0 1 0 0 1 0 0 0 7
CBS 0 1 0 0 0 2 2 2 2 0 0 0 4 1 0 1 2 1 0 0 1 4 1 24
CNL 0 0 0 0 0 2 2 2 1 0 0 7 1 0 0 0 0 0 0 0 1 1 1 18
CTU 0 1 0 0 0 2 1 0 1 0 0 4 0 0 1 0 0 0 1 0 0 0 1 12
CSN 0 0 0 0 0 2 1 0 1 0 0 5 1 0 1 1 1 0 0 0 0 1 1 15
CSK 0 0 0 0 0 3 1 0 1 0 0 4 0 0 0 0 0 0 0 0 0 0 0 9
CPT 0 0 0 0 0 2 2 0 2 0 0 6 0 0 1 2 1 0 0 0 0 2 1 19
CKT* 0 0 1 1 0 4 3 8 3 0 0 8 0 0 1 3 1 0 0 0 3 0 1 37
CMR* 0 0 1 1 0 5 2 3 2 0 0 11 0 0 1 0 1 0 0 1 0 0 0 28
CSJ* 0 0 0 5 0 2 5 15 5 0 0 7 0 1 1 6 1 1 0 0 9 0 1 59
CKM* 0 0 0 1 0 6 3 13 4 1 0 7 0 0 0 4 0 1 0 0 12 1 0 53
CSP* 0 0 0 7 0 4 8 14 7 1 1 2 0 0 0 6 1 2 0 0 19 0 1 73
CSU* 0 0 0 3 0 2 1 11 7 1 0 0 0 0 1 0 0 1 1 0 4 0 1 33
VSS* 0 0 0 2 0 3 5 15 6 2 1 0 0 0 0 6 1 1 0 0 10 0 1 53
VSR* 0 0 0 4 0 2 4 13 11 0 0 1 0 0 1 5 0 0 0 0 6 0 1 48
VTR 0 1 0 0 0 4 1 0 2 0 0 4 0 0 1 1 0 0 1 0 0 0 1 16
VCT 0 1 0 0 0 1 1 0 2 0 0 0 0 0 1 0 1 0 1 0 0 0 0 8
VLX 1 0 0 0 0 2 1 1 1 0 0 2 0 0 1 2 1 0 0 1 0 0 1 14
VCL 0 0 0 0 0 2 1 1 2 0 0 3 1 0 1 0 1 0 1 1 0 0 1 15
VTC 0 0 0 0 0 2 0 0 1 0 0 0 0 0 0 0 0 0 0 0 0 0 0 3
VCD 0 0 0 1 1 1 3 1 2 0 0 3 0 0 1 1 1 0 1 0 0 0 0 16
All sites 1 1 1 13 1 9 13 26 20 2 1 24 1 1 1 11 1 2 2 1 28 4 1 165
Note: At sites with asterisks, both sweep and kick sampling were applied.
Taxonomic richness
The number of taxa collected per site ranged from 3 to 73. The highest richness occurred at sites having substrata with cobbles and gravels, such as sites CSP (73 taxa), CSJ (59 taxa), and VSS and CKM (53 taxa each). In contrast, the lowest richness was at sites with muddy substrata, such as at sites VCT (8 taxa), CPP (7 taxa) and VTC (3 taxa) (Table 7.1). In sites with highest richness, such as sites CSP, CSJ, VSS, and CKM, taxa of Trichoptera and Ephemeroptera were common and abundant. These taxa occurred in substrata containing cobbles, pebbles and gravels.

Page 45
Littoral macroinvertebrates
Abundance
The number of individuals per site was highly variable, ranging from 54 (CTU) to 2062 (CMK) individuals (Table 7.2). As with numbers of taxa, the highest abundances occurred at sites with sandy and rocky substrata, while the lowest abundances occurred at sites with muddy and debris substrata. In the sites with the highest abundance, such as CMK, CSP, and CSU, species of Decapoda, Mesogastropoda, Ephemeroptera, Hemiptera, and Trichoptera were dominant. These common species occur in both rocky substrata and nektonic habitats.
Table 7.2. Number of individual littoral macroinvertebrates at 21 sites in 2006.
Site
Am
phip
oda
Arc
oida
Bas
omm
atop
hora
Col
eopt
era
Col
lem
bola
Dec
apod
a
Dip
tera
Ephe
mer
opte
ra
Hem
ipte
ra
Lepi
dopt
era
Meg
alop
tera
Mes
ogas
trapo
da
Myt
iloid
a
Nem
atod
a
Neo
gast
ropo
da
Odo
nata
Olig
ocha
eta
Plec
opte
ra
Poly
chae
ta
Spha
erom
atid
ae
Tric
hopt
era
Uni
onto
ida
Vene
roid
a
Tota
l
CPP 0 0 0 0 0 47 0 0 5 0 0 0 0 0 1 0 1 0 0 1 0 0 0 55
CBS 0 6 0 0 0 68 10 66 561 0 0 46 2 0 4 22 10 0 0 2 0 18 2 817
CNL 0 0 0 0 0 12 21 110 50 0 0 543 3 0 0 0 0 0 0 0 2 8 69 828
CTU 0 1 0 0 0 24 2 0 1 0 0 7 0 0 3 0 0 0 4 4 0 0 8 54
CSN 0 0 0 0 0 36 18 0 89 0 0 427 1 0 1 1 1 0 0 0 0 11 42 627
CSK 0 0 0 0 0 388 1 0 63 0 0 9 0 0 0 0 0 0 0 0 0 0 0 461
CPT 0 0 0 0 0 21 3 0 7 0 0 131 0 0 1 12 3 0 0 0 0 33 22 231
CKT* 0 0 49 1 0 50 34 77 18 0 0 514 0 0 5 21 16 0 0 0 8 0 2 795
CMK* 0 0 82 2 0 942 3 20 25 0 0 947 0 0 2 0 11 0 0 1 0 0 0 2062
CSJ* 0 0 0 19 0 14 39 268 13 0 0 198 0 4 4 17 2 2 0 0 119 0 6 705
CMR* 0 0 0 12 0 57 7 257 31 1 0 40 0 0 0 7 0 1 0 0 51 1 0 465
CSP* 0 0 0 19 0 13 116 507 95 1 1 6 0 0 0 42 1 4 0 0 303 0 45 1153
CSU* 0 0 0 5 0 7 4 528 589 1 0 0 0 0 1 0 0 1 1 1 8 0 4 1150
VSS* 0 0 0 7 0 17 106 289 15 3 1 0 0 0 0 26 2 33 0 0 62 0 3 564
VSR* 0 0 0 5 0 5 110 288 236 0 0 1 0 0 1 13 0 0 0 0 22 0 9 690
VTR 0 3 0 0 0 101 11 0 96 0 0 11 0 0 26 1 0 0 4 4 0 0 16 273
VCT 0 1 0 0 0 84 6 0 25 0 0 0 0 0 1 0 2 0 2 0 0 0 0 121
VLX 2 0 0 0 0 119 7 1 7 0 0 2 0 0 1 4 1 0 0 2 0 0 2 148
VCL 0 0 0 0 0 83 19 2 54 0 0 6 2 0 5 0 3 0 1 12 0 0 10 197
VTC 0 0 0 0 0 6 0 0 108 0 0 0 0 0 0 0 0 0 0 0 0 0 0 114
VCD 0 0 0 2 2 1 5 1 45 0 0 15 0 0 1 1 1 0 1 1 0 0 0 76
Total 2 11 131 72 2 2095 532 2414 2133 6 2 2930 8 4 57 167 54 41 13 30 575 71 238 11588
Note: At sites with asterisks, both, sweep and kick sampling were applied.
Shannon-Wiener diversity index
The Shannon-Wiener Diversity Index ranged from 0.24 to 3.27 (Figure 7.1). The highest diversity value was found at site CKM and the lowest diversity at site VTC. This trend is

Report on the 2006 biomonitoring survey of the lower Mekong River and selected tributaries
Page 46
similar to that observed for taxon richness. The highest diversity index values were found at sites with sandy and rocky substrata, such as at site CSJ, CSP and CKM, while low diversity index values were found at sites located in the Delta area, such as at VTC, VLX, and VCT (Appendix 3.3).
Dominance index
The Berger-Parker Dominance Index ranged from 0.05 to 0.88 at the 2006 sampling sites (Figure 7.1). The lowest dominance value was found at site VTC, and the highest value of dominance was found at site CKM. The Dominance Index showed the same trend as the taxon richness and diversity index values (Appendix 3.3).
Figure 7.1 The diversity and dominance index values of littoral macroinvertebrates at 21 sites in 2006.
Relationship of richness and abundance, and of species diversity and dominance index values, to the Average Site Disturbance Score
The values for taxonomic richness, number of individuals, the species diversity index, and the dominance index from 57 sampling events at 43 sites, 2004 – 2006, all showed statistically significant relationships with the Average Site Disturbance Score (P < 0.05; Figure 7.2– 7.5).
0.0 0.2 0.4 0.6 0.8 1.00.0
0.5
1.0
1.5
2.0
2.5
3.0
3.5
4.0
CPP
CTU
VCD
CPT
VLX
CMR
CBS
VTC
VSR
CSP
VTR
VCT
CSJ
CSU
CSK
CKM
CNL
VSS
CSN
VCL
CKT
Div
ersi
ty in
dex
Dominance index

Page 47
Littoral macroinvertebrates
Figure 7.2 Top left. Regression relationship between taxonomic richness of littoral macroinvertebrates and the Average Site Disturbance Score for sites sampled in 2004, 2005 and 2006.
Figure 7.3 Top right. Regression relationship between abundance of littoral macroinvertebrates and the Average Site Disturbance Score for sites sampled in 2004, 2005 and 2006.
Figure 7.4 Bottom left. Regression relationship between the Shannon-Wiener diversity index for littoral macroinvertebrates and the Average Site Disturbance Score for sites sampled in 2004, 2005 and 2006.
Figure 7.5 Bottom right. Regression relationship between the Berger-Parker dominance index for littoral macroinvertebrates and the Average Site Disturbance Score for sites sampled in 2004, 2005 and 2006.
1.0 1.5 2.0 2.5 3.00
10
20
30
40
50
60
70
80
90
100
Site Disturbance Score
Nu
mb
er o
f tax
a R2 = 0.1250P = 0.007
Taxa Richness (littoral macroinvertebrates,
2004-2006)
1.0 1.5 2.0 2.5 3.00
1000
2000
3000
4000
5000
6000
7000
8000
9000
10000
Site Disturbance Score
Ab
un
dan
ce (n
um
ber
of s
pec
imen
s)
R2 = 0.1440P = 0.004
Abundance(littoral macroinvertebrates,
2004-2006)
1.0 1.5 2.0 2.5 3.00
1
2
3
4
5
Site Disturbance Score
R2 = 0.1160P = 0.009
Div
ersi
ty (S
han
no
n-W
ien
er in
dex
)
Species Diversity Index(littoral macroinvertebrates,
2004-2006)
1.0 1.5 2.0 2.5 3.00.0
0.1
0.2
0.3
0.4
0.5
0.6
0.7
0.8
0.9
Site Disturbance Score
Do
min
ance
(Ber
ger
-Par
ker i
nd
ex)
R2 = 0.1190P = 0.009
Dominance Index(littoral macroinvertebrates,
2004-2006)
1.0

Report on the 2006 biomonitoring survey of the lower Mekong River and selected tributaries
Page 48
Average Tolerance Score Per Taxon
The Average Tolerance Score Per Taxon (ATSPT) of littoral macroinvertebrates of sweep samples taken from 2004 – 2006 ranged from 20 to 52, with the highest value found at site VCD and the lowest found at site LOU. These scores ranged up to 6.5 standard deviations above the mean of reference sites, placing sites in the classes A – D (from low to high, but not extreme, stress)(see Chapter 9).
There was a general trend of increasing tolerance scores in a north to south direction, indicating a decrease in pollution sensitive species. Generally, the tolerance scores calculated for the Delta sites were higher than for other areas.
The relationship between the ATSPT and the Average Site Disturbance Score for all sites examined in 2004-2006 was statistically significant (p<0.001, Figure 7.6).
Figure 7.6 Regression relationships between the Average Tolerance Score Per Taxon for littoral macroinvertebrates and the Average Site Disturbance Score for sites sampled in 2004,
2005 and 2006.
1.0 1.5 2.0 2.5 3.00
10
20
30
40
50
60
70
80
90
100
Site Disturbance Score
ATSP
T va
lue
R2 = 0.494P = 1.07E-09
ATSPT(littoral macroinvertebrates
2004-2006)

Page 49
Littoral macroinvertebrates
7.4 Discussion
Relationship of richness and abundance, and of taxon diversity and dominance index values, to the Average Site Disturbance Score
All these metrics used to describe the littoral macroinvertebrates had statistically significant relationships with the Average Site Disturbance Score for the 57 sampling events at 43 sites, sampled in 2004 – 2006. Values of all these metrics were highly variable among the sites, probably because of differences in both human impact and habitat. For example, high richness was found at sites with cobble, pebble and gravel substrata, such as at sites CSP (74 taxa in 2006), CSU (33 taxa in 2006), CSS (33 taxa in 2004), CKM (62 taxa in 2005), LKL (63 taxa in 2005), LOU (42 taxa) and CSJ (59 taxa in 2006). These sites are located on tributaries (Sre Pok, Se San, Se Kong, and Nam Ou) of the Mekong. The high richness found in these sites probably resulted from a combination of suitable habitats and sampling accessibility (as both sweep and kick sampling were possible). In contrast, sites with soft sediments of mud and sand, and often with decreased water-quality and other disturbance from human activities, are limited in their ability to develop a rich fauna of littoral macroinvertebrates. They include sites CSK (9 taxa), VCT (8 taxa), CPP (7 taxa), and VTC (3 taxa). The same factors that determine taxon richness probably account for the patterns in abundance and values of the taxon diversity index and the dominance index.
Variation in ATSPT among sampling sites in the Lower Mekong, 2004 – 2006
The distribution of tolerance values for the 323 taxa of littoral macroinvertebrates collected in 2004 – 2006 represent a fauna that has a predominance of taxa that are stress-sensitive (Appendix 3.2). Littoral macroinvertebrates had a lower median value (34) and included more stress-sensitive taxa (203) than either the zooplankton or diatoms; however, they are comparable to the benthic macroinvertebrates in terms of their stress sensitivity (see Chapter 9).
The distribution of ATSPT values at the 57 samples from 43 sites visited reflects a gradient of increasing pollution or human impact levels from north to south, which is consistent with patterns of development and human population density.

Report on the 2006 biomonitoring survey of the lower Mekong River and selected tributaries
Page 50

Page 51
8. Benthic macroinvertebrates
8.1 Introduction
The benthic macroinvertebrates occurring at the bottom of river channels are promising indicators of health for the lower Mekong River. The objective of this chapter is to: (i) describe the characteristics of the benthic macroinvertebrate community that was quantitatively sampled at 21 sites in 2006, (ii) report biotic condition scores based on the benthic macroinvertebrate community for each of the sites examined in 2006, and (iii) relate tolerance scores and other metrics to the Site Disturbance Score.
8.2 Study sites and sampling methods
Study sites
In March 2006, samples of benthic macroinvertebrates were collected at the 21 sites in the Mekong River basin listed in Chapter 2. Details of the sample sites examined in 2004 and 2005 are given in the biomonitoring reports for those years (MRC, 2006; MRC, in press).
Field methods
Sample locations at each site were selected in each of the right, middle, and left parts of the river. Five locations were sampled at each of these parts of the river. At some sites, the middle of the river could not be sampled because of the presence of hard beds or fast currents. Also, sites narrower than 30 m were not sampled in the middle portion.
Prior to sampling, all the equipment to be used was thoroughly cleaned to remove any material left from the previous sampling site. At each sampling location, a composite of four samples was taken with a Petersen grab sampler, covering a total area of 0.1 m2. Grab contents were discarded if the grab did not close properly because material such as wood, bamboo, large water-plants, or stones jammed the grab’s jaws. In these cases the sample was retaken. The sample was washed through a sieve (0.3 mm) with care taken to ensure that macroinvertebrates did not escape. The contents of the sieve were then placed in a white sorting tray and dispersed in water. All the animals in the tray were picked out with forceps and pipettes, placed in jars, and fixed with formaldehyde. Samples of less experienced sorters were checked by an experienced sorter. The sample jar was labelled with site name, location code, date, position

Report on the 2006 biomonitoring survey of the lower Mekong River and selected tributaries
Page 52
within the river, and replicate number. The sampling location conditions, collector’s name and sorter’s name were recorded on a field sheet.
Sometimes, samples could not be sorted on site because the boat was poorly balanced, because a very large number of animals were collected, because there was insufficient time at a site, or because the presence of lumps of clay caused the samples to cloud continually. In these cases, samples were sorted in the laboratory.
Laboratory methods
All individuals collected were identified and counted under a compound microscope (with magnifications of 40 – 1200 x) or a dissecting microscope (16 – 56 x). Oligochaeta, Gastropoda, Bivalvia, and Crustacea were generally identified to species level. Insecta and Insecta larvae were classified only to genus level. The results were recorded on data sheets and specimens are kept at the Ton Duc Thang University, HCMC, Viet Nam.
Multimetric analysis
For all sites sampled in 2004, 2005, and 2006, the following metrics were calculated: (i) taxonomic richness (i.e. number of taxa); (ii) abundance (i.e. numbers of individuals per sample); (iii) the Shannon-Wiener Diversity Index; (iv) the Berger-Parker Dominance Index. The four metrics were tested for their potential as indicators of human impact by regressing values for all three years (57 sampling events for 43 sites) against the Average Site Disturbance Score, which was derived as described in Chapter 3. For each metric examined against this index, p values and r2 values were calculated from linear regression analyses.
Tolerance values
Tolerance values were calculated for each taxon of benthic macroinvertebrates collected in 2004, 2005, and 2006, as described in Chapter 3. The Average Tolerance Score per Taxon (ATSPT) was calculated for each sample, and then averaged over each sampling event for 2004 – 2006. ATSPTs were rated as described in Chapter 3.

Page 53
Benthic macroinvertebrtaes
8.3 Results
Biota collected in 2006
In 2006, 4,586 individuals and 95 taxa of benthic macroinvertebrates were collected (Appendix 4.1). The Insecta was the most species-rich group and occurred at each of the sites (Table 8.1). Molluscs also occurred at all sites. The fauna at sites that were not affected by the tides from the South China Sea consisted entirely of freshwater taxa such as insects, oligochaetes, and some freshwater crustaceans and molluscs. In contrast, sites that were influenced by these tides included polychaetes, and other species of molluscs and crustaceans.
The Oligochaeta were widely distributed, with species of the family Tubificidae found at most sites, while species of Naididae were found at only a few sites. Relatively few species of Crustacea and Polychaeta were encountered. In mid-basin or upstream sites, crustaceans were absent in samples collected from deep-water habitats, and tended to occur among aquatic plants or rocky substrata.
Table 8.1. Numbers of taxa of major groups of benthic macroinvertebrates collected at 21 sites in 2006.
Sampling Site
Annelida Mollusca ArthropodaTotal
Polychaeta Oligochaeta Gastropoda Bivalvia Crustacea InsectaCPP - 2 5 3 2 5 17CBS - 2 4 11 - 5 22CNL - 2 1 4 4 5 16CTU - 2 3 7 1 6 19CSN - 2 3 2 1 8 16CSK - 2 3 4 - 6 15CPT - 2 1 6 - 7 16CKT - 2 5 1 - 6 14CMR - 2 4 - - 4 10CSJ - 1 2 1 - 4 8CKM - - 2 1 - 5 8CSP - 1 3 1 - 11 16CSU - 2 - 1 - 12 15VSS - 1 - 1 - 5 7VSR - 1 - 1 - 8 10VTR 3 2 2 4 2 4 17VCT 1 2 1 3 7 4 18VLX 2 2 6 5 3 5 23VCL - 2 - 4 3 2 11VTC - 2 2 6 4 5 19VCD 1 2 4 4 3 4 18

Report on the 2006 biomonitoring survey of the lower Mekong River and selected tributaries
Page 54
Chironomid midge larvae had the widest distribution of any taxon collected in 2006, and occurred at all sites. Several other taxa (tubificid worms, the clam Corbicula tenuis, and larvae of the caddisfly family Philopotamidae) were also widely distributed (Appendix 4.1). A number of the species that were widespread are characteristic of those occurring in nutrient-rich conditions. These include: the worms Limnodrilus hoffmeisteri and Branchiura sowerbyi (Oligochaeta, Tubifichidae); the polychaetes Scoloplos sp., Prionospio sp. and Polydora sp; species of Stenothyridae and Hydrobiidae (Mollusca, Gastropoda); the phantom midge Chaoborus sp. (Diptera, Chaoboridae); and the midge larvae Chironomus sp., Parachironomus sp., Cryptochironomus sp., Sergentia sp., and Polypedilum sp. (Diptera, Chironomidae).
Most of the 95 taxa were found at only one or two sites, usually in low abundance (Appendix 4.1). Some of these uncommon taxa belong to groups that are not normally associated with soft sediments. For example, Neritidae snails (Mollusca, Gastropoda), Leptophlebiidae mayflies (Insecta, Ephemeroptera), and Ryacophilidae caddisflies (Insecta, Trichoptera) normally occur on rocks, stones, and aquatic plants. Many of these taxa could be considered ‘vagrants’ in the collections made in the soft-sediment habitats.
Taxonomic richness
Taxon richness at a site ranged widely, from 7 to 23, at the 21 sites sampled in 2006 (Table 8.1). The highest richness occurred at sites having substrata with mud and debris, such as CBS (22 species) and VXL (23 species), while the lowest richness was at sites with sandy and rocky substrata, such as sites CSJ (8 species), CKM (8 species), and VSS (7 species) (Table 8.1). In the sites with moderately high richness, such as sites CTU, VTC, VCD, and VCT, species in the families Tubificidae (Oligochaeta), Corbiculidae (Mollusca, Bivalvia), and Chironomidae (Insecta, Diptera) were dominant. These common species occurred in mixed substrata containing mud and debris.
Abundance
The mean number of individuals at a site was highly variable, ranging from 30 to 480 individuals/m2. As with numbers of taxa, the highest abundances occurred at sites with muddy and debris substrata such as CTU (480 indv./m2), while the lowest abundances occurred at sites with sandy and rocky substrata, such as sites CSJ, CKM and VSS (30 indiv./m2) (Table 8.2). In the sites with highest abundance, such as CSN, CPT, CMR, VLX and VCD, species in the families Tubificidae (Oligochaeta), Hydrobiidae (Mollusca, Gastropoda), Corbiculidae (Mollusca, Bivalvia), Palingeniidae (Insecta, Ephemeroptera), and Chironomidae (Insecta, Diptera) were dominant. These common species occurred in mixed substrata containing mud, gravel, and debris (Appendix 4.1).

Page 55
Benthic macroinvertebrtaes
Table 8.2. Density (individuals/m2) of benthic macroinvertebrates at 21 sites in 2006.
Site Right Middle Left AverageCPP 60-140 10-30 10-160 60CBS 60-450 20-50 20-610 170CNL 20-180 0 10-190 80CTU 360-910 170-450 280-720 480CSN 20-320 240-420 100-390 240CSK 40-200 30-160 20-150 110CPT 190-310 170-450 80-220 220CKT 40-300 20-170 10-30 80CMR 270-1250 10-30 20-220 240CSJ 10-50 0 10-120 30CKM 10-30 0 10-100 30CSP 10-70 10-20 40-210 60CSU 20-110 10-20 100-350 100VSS 10-90 0 10-50 30VSR 170-370 0 30-190 150VTR 90-300 10-100 80-340 140VCT 40-90 30-50 30-170 70VLX 60-640 0 50-300 250VCL 40-380 0 10-150 90VTC 40-510 180-380 20-170 180VCD 160-370 320-500 20-120 230
Shannon-Wiener diversity index and dominance index
Figure 8.1 Values of the diversity (H’) and dominance (D) indices for benthic macroinvertebrates at 21 sites in 2006.
0.2 0.4 0.6 0.8 1.00.0
0.5
1.0
1.5
2.0
2.5
3.0
3.5
4.0
CPP
CTU
VCD
CPT
VLX
CMR
CBS
VTC
VSR
CSP
VTR
VCT
CSJ
CSUCSK
CKM
CNL
VSS
CSN
VCL
CKT
Div
ersi
ty in
dex
Dominance index

Report on the 2006 biomonitoring survey of the lower Mekong River and selected tributaries
Page 56
Values for the diversity and dominance indices at the 21 sites sampled in 2006 ranged greatly (Figure 8.1). Both indices ranked site CBS and as having the highest and sites CSJ and CKM as having the lowest diversity and dominance. While there were some differences in relative rankings, the values for the two indices were highly correlated.
Relationship of richness and abundance, and of species diversity and dominance index values, to the Average Site Disturbance Score.
The values of taxonomic richness, number of individuals, the taxon diversity index, and the dominance index from 57 sampling events at 43 sites, 2004 – 2006, did not have statistically significant relationships with the Average Site Disturbance Score (P > 0.05; Figure 8.2 – 8.5).
Figure 8.2 Left. Regression relationship between taxonomic richness of benthic macroinvertebrates and the Average Site Disturbance Score for sites sampled in 2004, 2005 and 2006.
Figure 8.3 Right. Regression relationship between abundance of benthic macroinvertebrates and the Average Site Disturbance Score for sites sampled in 2004, 2005 and 2006.
1.0 1.5 2.0 2.5 3.00
10
20
30
40
Site Disturbance Score
Nu
mb
er o
f tax
a
R2 = 0.0020P = 0.724
Taxon Richness (benthic macroinvertebrates,
2004-2006)
1.0 1.5 2.0 2.5 3.00
500
1000
1500
2000
2500
3000
Site Disturbance Score
R2 = 0.0180P = 0.326
Ab
un
dan
ce (n
um
ber
s o
f sp
ecim
ens
per
m2 )
Abundance(benthic macroinvertebrates,
2004-2006)

Page 57
Benthic macroinvertebrtaes
Figure 8.4 Left. Regression relationship between the Shannon-Wiener diversity index for benthic macroinvertebrates and the Average Site Disturbance Score for sites sampled in 2004, 2005 and 2006.
Figure 8.5 Right. Regression relationship between the Berger-Parker dominance index for benthic macroinvertebrates and the Average Site Disturbance Score for sites sampled in 2004, 2005 and 2006.
Variation of ATSPT among sampling sites in the Lower Mekong River, 2004 – 2006
Figure 8.6 Regression relationship between the Average Tolerance Score per Taxon for benthic macroinvertebrates and the Average Site Disturbance Score for sites sampled in 2004, 2005 and 2006.
1.0 1.5 2.0 2.5 3.00.0
0.5
1.0
1.5
2.0
2.5
3.0
Site Disturbance Score
R2 = 0.0070P = 0.525
Div
ersi
ty (S
han
no
n-W
ien
er in
dex
)Taxon Diversity Index
(benthic macroinvertebrates, 2004-2006)
1.0 1.5 2.0 2.5 3.00.0
0.1
0.2
0.3
0.4
0.5
0.6
0.7
0.8
0.9
Site Disturbance Score
Do
min
ance
(Ber
ger
-Par
ker i
nd
ex)
R2 = 0.0040P = 0.640
Dominance Index(benthic macroinvertebrates,
2004-2006)
1.0
1.0 1.5 2.0 2.5 3.00
10
20
30
40
50
60
70
80
90
100
Site Disturbance Score
ATSP
T va
lue
R2 = 0.607P = 0.9.6E-13
ATSPT (benthic macroinvertebrates,
2004-2006)
Report on the 2006 biomonitoring survey of the lower Mekong River and selected tributaries
Page 58
The tolerance values for individual taxa of benthic macroinvertebrates collected from 2004 – 2006 varied from 0 to 95 (Appendix 4.2). Mean ATSPT values ranged up to 6.4 standard deviations above the mean for reference sites, placing sites in classes A-D (from low to high, but not extreme, stress) (see Chapter 9). There was a very high statistically significant relationship between the ATSPT values and the Average Site Disturbance Score (Figure 8.6).
There was a general trend of increasing tolerance scores from north to south, indicating a decrease in stress-sensitive species. Generally, the ATSPTs calculated for the benthic macroinvertebrates in the Delta sites were higher than those of other sites.
8.4 Discussion
Relationship of richness and abundance, and of species diversity and dominance index values, to the Average Site Disturbance Score
No statistically significant relationships were found when these metrics from 57 sampling events at 43 sites, 2004 – 2006, were compared to the Average Site Disturbance Score from these sites. In addition, log transformation of abundance did not produce a statistically significant relationship (P > 0.05). Values of all these metrics were highly variable among the sites, probably because of differences in habitat. For example, the high richness at main channel sites CTU (22 taxa), CBS (22 taxa), VTC (27 taxa), VCD (30 taxa) and VLX (23 taxa) and in tributaries LNO (30 taxa), LNK (31 taxa), LKU (24 taxa) and LKL (24 taxa) probably resulted from the soft sediments of mud and sand, and the presence of many aquatic plants and abundant amounts of organic debris, which made these sites conducive to a rich fauna of benthic macroinvertebrates. In contrast, the coarse sandy, clay, and rocky substrata at main channel sites LMX (14 taxa), LPB (10 taxa), LVT (4 taxa), TMC (12 taxa), and CKT (10 taxa) and in tributaries CSJ (8 taxa), CKM (8 taxa), and VSS (7 taxa) were an obvious limiting factor for richness of benthic macroinvertebrates. Abundance and values of the taxon diversity and dominance indices can be explained by the same reasons.
Relationship of tolerance scores to sampling sites in the Lower Mekong, 2004 – 2006
The distribution of tolerance values for the 160 taxa of benthic macroinvertebrates collected in 2004 – 2006 indicates a fauna that has a predominance of taxa that are stress-sensitive (Appendix 4.2). Benthic macroinvertebrates had a lower median value than the littoral macroinvertebrates (35), but their median value (27) was comparable to this group.
The distribution of ATSPT scores at the 43 sites visited reflects a gradient of increasing pollution or human impact levels from north to south. This pattern is consistent with the results

Page 59
Benthic macroinvertebrtaes
obtained from other ecological health monitoring programmes being conducted in the south of Viet Nam (including the Mekong Delta), where the benthic macroinvertebrates indicate higher levels of human impact on water and sediment quality in comparison with the results from phytoplankton or zooplankton studies.

Report on the 2006 biomonitoring survey of the lower Mekong River and selected tributaries
Page 60

Page 61
9. Overall results and discussion
9.1 Relationship between environmental variables and ATSPT
Several physical and chemical variables showed statistically significant relationships when correlated with the ATSPT values obtained for the different groups and based on 57 sampling events at 43 sites. Dissolved oxygen concentration and Secchi disc depths showed significant negative correlation with ATSPT for all the groups. Altitude was significantly negatively correlated with ATSPT for all groups except for diatoms. Conductivity showed no statistically significant correlations with any of the biological assemblages.
Although there were many statistically significant correlations, the r values were often low (Table 9.1). For example, r values exceeded 0.50 in only 2 of 11 significant correlations.
Table 9.1. Correlation coefficients (r) and p-values from regression analysis of physical and chemical factors and average tolerance score per taxon (ATSPT) values for diatoms, zooplankton, and littoral and benthic macroinvertebrates based on samples from 2004 – 2006.
p values Correlation coefficients (r)Diatoms Zooplankton Littoral
Macro sweep
Benthic Macro.
Diatoms Zooplankton Littoral Macro sweep
Benthic Macro
DO 0.006 0.001 0.000 0.001 -0.36 -0.42 -0.47 -0.41
Altitude 0.103 0.013 0.007 0.001 -0.27 -0.40 -0.43 -0.52
Secchi depth 0.000 0.005 0.007 0.019 -0.54 -0.37 -0.35 -0.31
Conductivity 0.554 0.887 0.546 0.585 0.08 0.02 0.08 0.07
9.2 Tolerance values for the fauna
The distribution of sensitivities varied among the faunal assemblages examined (Figure 9.1). Macroinvertebrates (found in both the littoral and the benthic collections) had a higher proportion of sensitive taxa than either the diatoms or the zooplankton. This is evident in both the skewness of the distributions and the median value for each of the biological assemblages.

Report on the 2006 biomonitoring survey of the lower Mekong River and selected tributaries
Page 62
Figure 9.1. Tolerance score of diatoms, zooplankton, and littoral and benthic macroinvertebrates based on 57 sampling events at 43 sites, 2004 – 2006.
9.3 Variability of ATSPT values over the three sampling years
ATSPT values varied among for four biological indicator groups examined (Table 9.2). However, the values of each group were similar for collections made during different years at the same site (Table 9.3).
0
5
10
15
20
25
30
35
40
90-10080-9070-8060-7050-6040-5030-4020-3010-200-10
Nu
mb
er o
f tax
a
Tolerance score
Diatoms
0
10
20
30
40
50
60
70
90-10080-9070-8060-7050-6040-5030-4020-3010-200-10
Nu
mb
er o
f tax
a
Tolerance score
Zooplankton
0
10
20
30
40
50
60
70
80
90
90-10080-9070-8060-7050-6040-5030-4020-3010-200-10
Nu
mb
er o
f tax
a
Tolerance score
Littoral Macroinvertebrates
0
5
10
15
20
25
30
35
40
90-10080-9070-8060-7050-6040-5030-4020-3010-200-10
Nu
mb
er o
f tax
a
Tolerance score
Benthic Macroinvertebrates

Page 63
Overall results and discussion
Table 9.2. ATSPT values for the four indicator groups at all the sites sampled in 2004, 2005 and 2006.
Yera Site Diatoms ZooplanktonLittoral
Macroinvertebrates (sweep samples)
Benthic Macroinvertebrate
2004 LNO 29 23 27 222004 LPB 36 33 29 322004 LVT 42 39 35 312004 LNG 34 39 35 362004 LKD 33 42 34 392004 LPS 38 40 33 372004 TMU 40 43 39 462004 TCH 43 40 35 432004 TSK 42 47 38 512004 TKO 41 40 29 352004 CPP 45 53 40 552004 CTU 42 49 45 522004 CPS 43 45 41 402004 CSS 37 43 33 392004 CSP 39 43 29 352004 CKT 34 41 32 342004 VTC 41 50 47 622004 VCD 45 49 44 572004 VKT 42 44 37 452004 VSP 37 41 27 382005 LOU 29 22 20 332005 LPB 38 41 34 332005 LNK 33 34 29 322005 LMH 39 43 34 342005 LMX 39 42 36 352005 TMI 42 43 35 362005 TMC 40 43 32 352005 TKO 40 42 34 322005 LKU 35 35 29 362005 LKL 35 34 31 352005 CMR 33 37 36 382005 CSJ 33 38 31 352005 CKM 33 39 32 342005 CSU 36 38 34 362005 CSS 36 36 34 362005 CSP 28 40 28 382006 CPP 51 51 46 522006 CBS 44 52 42 532006 CNL 40 49 38 522006 CTU 49 49 45 532006 CSN 44 48 45 472006 CSK 45 48 47 472006 CPT 45 50 45 462006 CKT 39 40 31 312006 CMR 35 41 32 452006 CSJ 36 39 28 322006 CKM 37 39 32 352006 CSP 36 39 27 302006 CSU 39 41 28 392006 VSS 41 42 34 342006 VSR 41 39 31 402006 VTR 45 53 47 592006 VCT 49 54 46 652006 VLX 52 49 47 582006 VCL 50 51 44 542006 VTC 47 50 50 572006 VCD 50 49 52 55

Report on the 2006 biomonitoring survey of the lower Mekong River and selected tributaries
Page 64
Table 9.3. Sites for which multiple year comparisons of the ATSPT values could be made.
9.4 Rating of sampling sites
Each site was rated in one of five classes according to the ATSPTs of the four biological assemblages. The average and variability (standard deviation) of ATSPT at designated reference sites were used as benchmarks from which to rate other sites. Reference sites were defined as those with very little or no disturbance, and included sites on the Nam Ou in Lao PDR, the Sre Pok and Se Kong in Cambodia, and the Mekong at Kampi, also in Cambodia.
Each ATSPT value was scaled in relation to reference data by subtracting the reference mean for the same assemblage and dividing the difference by the reference standard deviation. The result is the number of standard deviations by which a site falls above the reference mean. In statistical terms, the more standard deviations a site lies above the reference mean, the less likely it is to be ‘equivalent to reference’ in terms of the tolerance of the biota. For example, if a site has a value of two standard deviations above the reference mean it only has a 4% chance of being of reference status.
DiatomsSite 2004 2005 2006LPB 36 38 -CPP 45 - 51CTU 42 - 49CSS 37 36 -CSP 39 28 36CKT 34 - 39CMR - 33 35CSJ - 33 36CKM - 33 37CSU - 36 39TKO 41 40 -VTC 41 - 47VCD 45 - 50
ZooplanktonSite 2004 2005 2006LPB 33 41 -CPP 53 - 51CTU 49 - 49CSS 43 36 -CSP 43 40 39CKT 41 - 40CMR - 37 41CSJ - 38 39CKM - 39 39CSU - 38 41TKO 41 42 -VTC 50 - 50VCD 49 - 49
Littoral MacroinvertebratesSite 2004 2005 2006LPB 29 34CPP 40 46CTU 45 45CSS 33 34CSP 29 28 27CKT 32 31CMR 36 32CSJ 31 28CKM 32 32CSU 34 28TKO 29 34VTC 47 50VCD 44 52
Benthic MacroinvertebratesSite 2004 2005 2006LPB 32 33 -CPP 55 - 52CTU 52 - 53CSS 39 36 -CSP 35 38 30CKT 34 - 31CMR - 38 45CSJ - 35 32CKM - 34 35CSU - 36 39TKO 35 32 -VTC 62 - 57VCD 57 - 55

Page 65
Overall results and discussion
The greatest scaled value of the four biological indicator groups was used to rate each site as follows:
Class A: < 2 standard deviations above reference
Class B: 2 – 4 standard deviations above reference
Class C: 4 – 6 standard deviations above reference
Class D: 6 – 8 standard deviations above reference
Class E: > 8 standard deviations above reference.
Class A represents the lowest level of stress to the biological community (most ecologically healthy condition) and class E the highest level of stress.
Most sites rated in classes A and B (Figure 9.2) indicating relatively low stress. Only two sites rated in class D and no site rated in the highest stress class (Class E). This indicates that, in general, the Mekong River and its major tributaries are not severely polluted.

Report on the 2006 biomonitoring survey of the lower Mekong River and selected tributaries
Page 66
Figure 9.2. Site ratings based on ATSPT values at 57 samples from 43 sites visited during, the 2004 – 2006 biomonitoring surveys. Class A represents the lowest level of stress to the biological community (most healthy ecological condition) and Class E the highest level of stress. Note no sites had stress levels in Class E.
0 100 200 kilometres
Gulf of Thailand
Gulf of Tonkin
LOWER MEKONG BASIN
Thailand
Viet Nam
Cambodia
Lao PDR
Viet Nam 1. Northern Laos
2. Chiang Rai
3. Nong Khai/Songkhram
4. Central Laos
5. Mun/Chi
6. Southern Laos
7. Se San/Sre Pok/Se Kong
8. Kratie
9. Tonle Sap
10. Delta
BDP Sub-area
Biomonitoring Surveys 2004-2006ATSPT Site Ratings
Class A: < 2 SD above reference
Class B: 2-4 SD above reference
Class C: 4-6 SD above reference
Class D: 6-8 SD above reference
Class E: > 8 SD above reference
CPPCTU
CPS
CSS
CSP
VTCVCD
VKT
VSP
LNOLPB
LVT
LNGLKD
LPSTMU
TCH
TSK
LOU
LNK
LMH
LMX
TMITMC
TKO
LKU
LKL
CMR
CSJCKM
CBS CNL
CSN
CSK
CPT
CKT
CSU
VSS
VSR
VTR
VCT
VLXVCL
VCD

Page 67
10. General conclusions
This 2006 report covers the third year of a four-year assessment of the ecological health of the Lower Mekong River (2004 – 2007). This assessment was preceded by an initial testing of alternative sampling methods in 2003. Data analysis in each year of the programme has emphasised different issues and has progressively improved our capacity to interpret the data collected for diatoms, zooplankton, littoral macroinvertebrates and benthic macroinvertebrates. In 2004, a major component of the analysis was to compare both the biological variability within the individual sites and the biological variability among sites. This analysis confirmed that within-site variability is comparatively low and that the sampling effort used in the programme is sufficient to characterize each site adequately. The 2005 analysis then focused on testing the performance of assessment metrics developed and widely used elsewhere to describe community structure (species richness, abundance, a species diversity index, and a dominance index) when these approaches were applied to data from the Mekong River system. In many cases these metrics did not perform very well. In the 2006 programme, the emphasis was on developing values for each taxon (which included organisms identified to species, genus or family) representing tolerance to stress, which are specifically applicable to the Mekong River system. In addition, the other metrics were re-tested with the larger data set that was available following the 2006 sampling.
Some clear relationships were found between the original metrics and the Average Site Disturbance Score calculated for each of the 57 sampling events that occurred at 43 sites during the 2004, 2005, and 2006 field seasons. For example, statistically significant correlations (p<0.05) were found for all four metrics (richness, abundance, diversity, and dominance) in the case of littoral macroinvertebrates and for one metric (diversity) in the case of zooplankton. In contrast, no statistically significant relationships were found for any of the original metrics in the case of diatoms or benthic macroinvertebrates. Although these metrics have been used in assessments of river health and water quality in other countries, their applicability for evaluating the ecological health of the lower Mekong River appears limited. One problem with these metrics is that they can all vary considerably in response to natural factors such as inter-site differences in habitat features that strongly influence the structure and composition of the communities being examined.
In contrast to these metrics, the tolerance values obtained showed much promise for developing an appropriate analytical tool for biological monitoring of the lower Mekong River. The Average Tolerance Score Per Taxon (ATSPT) showed a strong correlation with the Average Site Disturbance Score for each group of organisms. However, this is not an independent test because the Site Disturbance Scores were used in the derivation of tolerance values. However, the ATSPT was significantly related to the measured water-quality data for all four groups, which does provide an independent, objective test. Further testing of the ATSPT was scheduled for the 2007 biomonitoring programme.

Report on the 2006 biomonitoring survey of the lower Mekong River and selected tributaries
Page 68
A trend of increasing ATSPT values (suggesting increasing environmental stress) in a downstream direction was evident for the four biological groups examined (Table 10.1). Furthermore, the tributaries generally had scores that are indicative of a less stressed assemblage than the mainstream of the lower Mekong River. However, only a few sites were considered to have a highly stressed biota, and no site was evaluated as being indicative of extremely stressed conditions. Because some sites were sampled in more than one year, a comparison can be made between the average Site Disturbance Scores and the ATSPT values for the different biological assemblages and years. In this analysis, the average Site Disturbance Scores were similar and sometimes the same from year to year, and the biological assemblages showed far more similarities than differences (Table 10.1). In many cases, ATSPT values were the same or only slightly different between years. This indicates that the tolerance values can be used to produce consistent data.
Table 10.1. Sites, Average Site Disturbance Scores, and ATSPT scores for which collections have been made for multiple years.
No. Site
Site Disturbance Score
ATSPT mean
Diatoms ZooplanktonLittoral
MacroinvertebratesBenthic
Macroinvertebrates
2004
2005
2006
2004
2005
2006
2004
2005
2006
2004
2005
2006
2004
2005
2006
1 CKM 1.50 1.19 33 37 39 39 32 32 34 35
2 CKT 1.25 1.14 34 39 41 40 32 31 34 31
3 CMR 1.75 1.42 33 35 37 41 36 32 38 45
4 CPP 2.88 2.89 45 51 53 51 40 46 55 52
5 CSJ 1.50 1.25 33 36 38 39 31 28 35 32
6 CSP 1.25 1.13 1.11 39 28 36 43 40 39 29 28 27 35 38 30
7 CSS 1.75 1.75 37 36 43 36 33 34 39 36
8 CSU 2.13 1.75 36 39 38 41 34 28 36 39
9 CTU 2.13 2.04 42 49 49 49 45 45 52 53
10 LNO 1.00 1.00 29 29 23 22 27 20 22 33
11 LPB 1.28 1.69 36 38 33 41 29 34 32 32
12 TKO 1.88 1.86 40 41 40 42 29 34 35 32
13 VCD 2.69 2.31 45 50 49 49 44 52 57 55
14 VTC 2.50 2.28 41 47 50 50 47 50 62 57
In conclusion, the field and laboratory procedures are performing well, and the tolerance values determined from the 2006 data analysis clearly can serve as a basis for a long-term monitoring programme to evaluate ecological health. The final phase of development and application of methods for data interpretation and reporting was scheduled for 2007 – 08.

Page 69
11. References
Barbour, M.T., Gerritsen, J., Snyder, J. & J.B. Stribling (1999) Rapid bioassessment protocols for use in streams and wadable rivers: periphyton, benthic macroinvertebrates and fish. US Environmental Protection Agency, Washington D.C.
Bonada, N., Prat, N., Resh, V.H. & B. Statzner. (2006) Developments in aquatic insect biomonitoring: a comparative analysis of recent approaches. Annual Review of Entomology, 51, 495 – 523.
Campbell, I.C. (2007) Perceptions, data, and river management: Lessons from the Mekong River. Water Resources Research, 43 W02407, 13 pp
Chessman, B.C., Growns, J.E. & A.R. Kotlash, (1997). Objective derivation of macroinvertebrate family sensitivity grade numbers for the SIGNAL biotic index: application to the Hunter River system, New South Wales. Marine and Freshwater Research, 48, 159 – 172.
Cimdins, P., Druvietis, I., Liepa, R., Parele, E., Urtane L. & A. Urtans (1995) A Latvian catalogue of indicator species of freshwater saprobity. Latvian Academy of Sciences.
Crivelli, A.J. & G. Catsadorakis (1997) The zooplankton of Lake Prespa. Kluwer Academic Publishers.
Dang, N.T, Thai, T.B. & V.M. Pham (1980) Classification of freshwater invertebrate zoology in North Viet Nam. Science and Technology Publisher.
De Pauw, N., Damme, D.V & B. De Vaate (1996) Integrated training program for implementation of the recommended trans — national monitoring strategy for the Danube River Basin: Manual for macroinvertebrate identification and water quality assessment. CEC PHASE/TACIS project.
De Zwart, D. & R.C. Trivedi (1994) Manual on integrated water quality evaluation. National Institute of Public Health and Environmental Protection, Bilthoven, the Netherlands.
Deeley, D.M. & E.I. Paling (1999) Assessing the ecological health of estuaries in Australia. LWRRDC Occasional Paper 17/99 (Urban Subprogram, Report No. 10).
Doan, C. (2000) The studies of biodiversity in Dong Thap Muoi Wetlands for the sustainable socio – economic development. The Institute of Tropical Biology, HCMC.
Eiji, T. (1993) An illustrated guide to fresh water zooplankton. Togai University.

Report on the 2006 biomonitoring survey of the lower Mekong River and selected tributaries
Page 70
Foged, N. (1971) Freshwater diatoms in Thailand. Publisher, Lehre.
Foged, N. (1975) Some littoral diatoms from the coast of Tanzania. Odense, Lehre.
Hynes, H.B.N. (1970) The ecology of running waters. University of Toronto Press, Toronto.
Krammer, K. & H. Lange-Bertalot (1986) Bacillariophyceae. Teil 1. Naviculaceae. Süßwasserflora von Mitteleuropa, Bd. 2. Gustav Fisher Verlag, Stuttgart.
Krammer, K. & H. Lange-Bertalot (1988) Bacillariophyceae. Teil 2. Epithemiaceae, Surirellaceae. Süßwasserflora von Mitteleuropa, Bd.2. Gustav Fisher Verlag, Stuttgart.
Krammer, K. & H. Lange-Bertalot (1991a) Bacillariophyceae. Teil 3. Centrales, Fragilariaceae, Eunotiaceae. Süßwasserflora von Mitteleuropa , Bd.2. Gustav Fisher Verlag , Stuttgart.
Krammer, K. & H. Lange-Bertalot (1991b) Bacillariophyceae. Teil 4. Achnanthaceae. Kritische Ergänzungen zu Navicula. Süßwasserflora von Mitteleuropa, Bd.2. Gustav Fisher Verlag , Stuttgart.
Kudo, R.R. (1963) Protozoology. 4th edn. Charles C. Thomas.
Le, T. & V.M. Pham (2002) The studies of aquatic flora and fauna in canals and river system of Vinh Long Province for planning the aquaculture. The Institute of Environment and Sustainable Development.
Merritt, R.W. & K.W. Cummins (1996) An introduction to the aquatic insects of North America. 3rd edition. Kendall Hunt, Dubuque.
MRC (2005) Integrated water quality management report No. 1. Mekong River Commission, Vientiane.
MRC (2006) Biomonitoring of the lower Mekong River and selected tributaries. MRC Technical Paper No. 13. Mekong River Commission, Vientiane.
MRC (2008) Biomonitoring of the lower Mekong River and selected tributaries, 2004 – 2007. MRC Technical Paper No. 20. Mekong River Commission, Vientiane.
MRC (in press) Report on the 2005 biomonitoring survey of the lower Mekong River and selected tributaries. MRC Technical Paper. Mekong River Commission, Vientiane.
Mustow, S.E. (1997) Biological monitoring of rivers in Thailand: use and adaptation of the BMWP score. Hydrobiologia, 479,191 – 229.

Page 71
References
Nguyen, X.Q., Mai, D.Y., Pinder, C. & S. Tilling (2000) Biological surveillance of freshwaters using macroinvertebrates. A practical manual and identification key for use in Vietnam. Field Studies Council.
Patrick, R. (1939) A taxonomic and distribution study of some diatoms from Siam and the Federated Malay States. Proceedings of the Academy of Natural Sciences, Philadelphia, 88.
PCD (2004) Standard surface water quality for Thailand. Pollution Control Department, Ministry of Natural Resources and Environment, Thailand, Bangkok. (Available at http://www.pcd.go.th/info_serv/en_reg_std_water05.html#s3)
Peerapornpisal, Y., Pekthong, T., Waiyaka, P. & S. Promkutkaew (2000) Diversity of phytoplankton and benthic algae in Mae Sa Stream, Doi Suthep-Pui National Park, Chiang Mai. Siam Society, 48, 193 – 211.
Pfister, V.P. (1992) Phytobenthos communities from 2 Tyrolean mountain streams. Arbeitsgemeinschaft Limnologie , Telfs , Österreich.
Pinder, L.C.V. (1999) Biological surveillance of freshwaters using macroinvertebrates and its application in South East Asia. Proceedings of International Conference on Water Resources Management in Intermontane Basins. Chiang Mai University, Thailand
Resh, V.H. & J.K. Jackson (1993) Rapid assessment approaches to biomonitoring using benthic macroinvertebrates. pp. 195 – 233 In: D.M. Rosenberg & V.H. Resh (eds.). Freshwater biomonitoring and benthic macroinvertebrates. Chapman and Hall, New York.
Rosenberg, D.M. & V.H. Resh (eds.) (1993) Freshwater biomonitoring and benthic Macroinvertebrates. Chapman and Hall, New York.
Sangpradub, N. & B. Boonsoong (2004) Identification of freshwater invertebrates of the Mekong River and tributaries. Faculty of Science, Applied Taxonomic Research Center, Khon Kaen University, Khon Kaen, Thailand. Report submitted to Mekong River Commission, Vientiane, Lao PDR.
Stiling, P. (2002) Ecology: theories and applications (4th edn). Prentice Hall International, New Jersey.
Thorne, R.S.J. & W.P. Williams (1997) The response of benthic macroinvertebrates to pollution in developing countries: a multimetric system of bioassessment. Freshwater Biology, 37, 671 – 686.
Walley W.J. and H.A. Hawkes (1997) A computer-based development of the Biological Monitoring Working Party score system incorporating abundance rating, biotope type and indicator value. Water Research, 31 (2), 201 – 210.

Report on the 2006 biomonitoring survey of the lower Mekong River and selected tributaries
Page 72

Page 73
Appendix 1.1. Diatoms species list and abundanceN
o.Ta
xon
Sam
plin
g si
tes
CPP
CTU
CK
KC
NL
CSN
CSK
CPT
CK
TC
MR
CSJ
CK
MC
SPC
SUV
SSV
SPV
VL
VC
TV
LXV
CL
VTC
VC
D
1Ac
hana
nthe
s exi
qua
var.
cons
tric
ta
(Tor
ka) H
uste
dt3
3
2Ac
hnan
thes
bia
sole
ttian
a G
runo
w13
014
6
3Ac
hnan
thes
cre
nula
ta G
runo
w1
1
4Ac
hnan
thes
freq
uent
issi
mun
(Lan
ge-
Ber
tale
t) La
nge-
Ber
tale
t22
295
20
5Ac
hnan
thes
lanc
eola
ta (B
rébi
sson
) G
runo
w2
167
6630
22
629
6Ac
hnan
thes
lanc
eola
ta sp
. ros
tral
a (O
estru
p) H
uste
dt21
11
7Ac
hnan
thes
min
utis
sim
a K
ützi
ng24
884
024
876
018
8Ac
hnan
thes
sp.1
767
05
9Am
phor
a m
onta
na K
rass
ke24
11
10Am
phor
a sp
.123
11Au
laco
seir
a g
ranu
lata
Ehr
enbe
rg2
113
960
59
192
12Au
laco
seir
a m
uzza
nens
is (M
eist
er)
Kra
mm
er21
13Ba
cilla
ria
para
doxa
Gm
elin
12
11
14C
alon
eis s
ilicu
la (E
hren
berg
) Cle
ve1
1
15C
occo
neis
ped
icul
us E
hren
berg
21
8219
386
6852
20
16C
yclo
tella
stel
liger
a C
leve
8817
09
4813
5216
222
4672
17C
ymbe
lla ja
poni
ca R
eich
elt
141
18C
ymbe
lla sp
.117
11
111
748
348
5
19C
ymbe
lla sp
.27
249
3330
6624

Report on the 2006 biomonitoring survey of the lower Mekong River and selected tributaries
Page 74
No.
Taxo
nSa
mpl
ing
site
s
CPP
CTU
CK
KC
NL
CSN
CSK
CPT
CK
TC
MR
CSJ
CK
MC
SPC
SUV
SSV
SPV
VL
VC
TV
LXV
CL
VTC
VC
D
20C
ymbe
lla tu
mid
a (B
rébi
sson
) Van
H
eurc
k4
17
41
21C
ymbe
lla tu
rgid
ula
Gru
now
84
326
15
22D
iplo
neis
elli
ptic
a (K
ützi
ng) C
leve
11
1
23En
cyon
ema
sile
siac
um (B
leis
ch) D
.G.
Man
n1
122
2914
24En
cyon
ema
sp.1
7750
25Ep
ithem
ia a
dnat
a (K
ützi
ng) B
rébi
sson
3645
26Fr
agila
ria
capu
cina
Des
maz
ière
s2
255
106
102
3111
747
1221
101
226
2
27G
eiss
leri
a de
cuss
is (Ø
stru
p) L
ange
-B
erta
lot&
Met
zelti
n1
64
2820
21
28G
eiss
leri
a pa
ludo
sa (H
uste
dt) L
ange
-B
erta
lot&
Met
zelti
n2
5
29G
omph
onem
a au
gur v
ar. t
urri
s (E
hren
berg
) Lan
ge-B
erta
let
31
30G
omph
onem
a cl
evei
Fric
ke58
021
614
712
571
19
31G
omph
onem
a en
tole
jum
Øst
rup
5110
3
32G
omph
onem
a gr
acile
Ehr
enbe
rg29
4721
843
101
298
1149
1412
14
111
7
33G
omph
onem
a pa
rvul
um (K
ützi
ng)
Gru
now
6539
380
138
9051
218
441
951
4224
344
1213
32
34G
yros
igm
a sc
alpr
oide
s (R
aben
hors
t) C
leve
11
11
1
35G
yros
igm
a sp
ence
rii (
Que
kett)
G
riffit
h&H
erfr
ey1
11
41
36Lu
ticul
a go
eppe
rtia
na (B
leis
ch)
D.G
.Man
n59
424
678
105
8111
63
810
123
108
2841
513
6
37Lu
ticul
a m
onita
(Hus
tedt
) D.G
.Man
n2
60
38Lu
ticul
a m
utic
a (K
ützi
ng) D
.G.M
ann
160
3

Page 75
Appendix 1. Diatom data
No.
Taxo
nSa
mpl
ing
site
s
CPP
CTU
CK
KC
NL
CSN
CSK
CPT
CK
TC
MR
CSJ
CK
MC
SPC
SUV
SSV
SPV
VL
VC
TV
LXV
CL
VTC
VC
D
39Lu
ticul
a ni
valis
(Ehr
enbe
rg) D
.G. M
ann
109
3
40M
elos
eira
var
ians
Aga
rdh
14
22
13
41N
avic
ula
cryt
ocep
hala
Küt
zing
209
13
42N
avic
ula
cryt
oten
ella
Küt
zing
64
6391
73
4920
5670
171
8113
3628
15
43N
avic
ula
flabe
llate
MEI
ST1
1110
44N
avic
ula
gast
rum
(Ehr
enbe
rg) K
ützi
ng10
21
81
45N
avic
ula
radi
osa
Küt
zing
224
1011
46N
avic
ula
sym
met
rica
Pat
rick
211
175
6444
1619
9733
174
276
173
2627
7134
2474
47N
avic
ula
viri
dula
var
. ger
mai
nii
(Wal
lace
) Lan
ge-B
erta
lot
51
39
48N
avic
ula
viri
dula
var
. ros
tella
ta
(Küt
zing
) Cle
ve1
111
430
81
81
614
17
49N
eidi
um b
inod
is (E
hren
berg
) Hus
tedt
1
50N
eidi
um d
ubiu
m (E
hren
berg
) Cle
ve1
51N
eidi
um g
raci
lle H
uste
dt v
ar. a
equa
lis
Hus
tedt
1
52N
itszc
hia
obtu
sa W
. Sm
ith1
53N
itzsc
hia
calid
a G
runo
w2
54N
itzsc
hia
clau
sii H
antz
sch
975
499
472
188
2969
5758
136
676
169
283
588
55N
itzsc
hia
diss
ipat
a (K
ützi
ng) G
runo
w34
56N
itzsc
hia
frus
tulu
m K
ützi
ng2
205
57N
itzsc
hia
levi
dens
is (W
.Sm
ith)G
runo
w1

Report on the 2006 biomonitoring survey of the lower Mekong River and selected tributaries
Page 76
No.
Taxo
nSa
mpl
ing
site
s
CPP
CTU
CK
KC
NL
CSN
CSK
CPT
CK
TC
MR
CSJ
CK
MC
SPC
SUV
SSV
SPV
VL
VC
TV
LXV
CL
VTC
VC
D
58N
itzsc
hia
litto
ralis
Gru
now
11
59N
itzsc
hia
pale
a (K
ützi
ng) W
. Sm
ith17
717
1426
648
628
510
1010
561
1942
843
1410
2088
258
60N
itzsc
hia
pseu
dofo
ntic
ola
Hus
tedt
121
2018
4
61N
itzsc
hia
sp.1
43
62N
itzsc
hia
suba
cicu
lari
s Hus
tedt
21
162
12
63Pi
nnul
aria
bra
unii
(Gru
now
) Cle
ve2
21
64Pi
nnul
aria
div
erge
ns v
ar. l
inea
ris Ø
stru
p3
65Pi
nnul
aria
mic
rost
auro
n Eh
renb
erg
59
66Pl
euro
sigm
a sa
linar
um G
runo
w1
1
67Pl
euro
sira
laev
is (E
hren
berg
) Com
père
1
68Rh
opal
odia
gib
beru
la E
hren
berg
O.
Mül
ler
188
210
722
2
69Se
llaph
ora
amoe
na L
ange
-Ber
talo
t7
21
70Se
llaph
ora
gibb
ula
Lang
e-B
erta
lot
13
12
71Se
llaph
ora
popu
la (K
ützi
ng)
Mer
esch
kow
sky
104
791
542
42
72Su
rire
lla a
ngus
ta K
ützi
ng2
21
12
23
2
73Su
rire
lla ro
ba L
ecle
rcq
31
74Su
rire
lla sp
lend
ida
Kra
mm
er1
23
1
75Sy
nedr
a ul
na (N
itzsc
h) E
hren
berg
71
16
511
57
23
76Sy
nedr
a ul
na v
ar. a
equa
lis (K
ützi
ng)
Hus
tedt
97

Page 77
Appendix 1. Diatom data
Appendix 1.2. Diatoms tolerance score
Order Family Species Tolerance score
Total samples
Centrales Coscinodiscineae Cyclotella meneghiniana Kützing 44 12
Centrales Coscinodiscineae Cyclotella stelligera Cleve 45 99
Centrales Melosiraceae Aulacoseira granulata Ehrenberg 47 67
Centrales Melosiraceae Aulacoseira muzzanensis (Meister)Krammer 51 18
Centrales Melosiraceae Meloseira varians Agardh 45 68
Centrales Thalassiosiraceae Thalassiosira sp.1 19 12
Pennales Achnanthaceae Achnanthes biasolettiana Grunow 50 41
Pennales Achnanthaceae Achnanthes crenulata Grunow 46 17
Pennales Achnanthaceae Achananthes exiqua var. constricta (Torka) Hustedt 44 2
Pennales Achnanthaceae Achnanthes frequentissimun (Lange-Bertalet) Lange-Bertalet 35 36
Pennales Achnanthaceae Achnanthes inflata (Kützing) Grunow 47 1
Pennales Achnanthaceae Achnanthes lanceolata (Brébisson) Grunow 33 174
Pennales Achnanthaceae Achnanthes lanceolata sp. rostrala (Oestrup) Hustedt 37 28
Pennales Achnanthaceae Achnanthes minutissima Kützing 33 222
Pennales Achnanthaceae Achnanthes oblongella Østrup 37 9
Pennales Achnanthaceae Achnanthes sp.1 49 67
Pennales Achnanthaceae Achnanthes sp.2 61 4
Pennales Achnanthaceae Achnanthes sp.3 39 1
Pennales Achnanthaceae Cocconeis pediculus Ehrenberg 17 31
Pennales Achnanthaceae Cocconeis placentula Ehrenberg 33 241
Pennales Bacillariaceae Bacillaria paradoxa Gmelin 33 23
Pennales Bacillariaceae Hantzschia amphioxys (Ehrenberg) Grunow 63 3
Pennales Bacillariaceae Hantzschia elongata (Hantzsch) Grunow 38 2
Pennales Bacillariaceae Nitzschia calida Grunow 27 2
Pennales Bacillariaceae Nitzschia clausii Hantzsch 59 173
Pennales Bacillariaceae Nitzschia coarctata Grunow 56 2
Pennales Bacillariaceae Nitzschia dissipata (Kützing) Grunow 37 77
Pennales Bacillariaceae Nitzschia frustulum Kützing 59 9
Pennales Bacillariaceae Nitzschia levidensis (W.Smith)Grunow 41 11
Pennales Bacillariaceae Nitzschia levidensis var. salinarum Grunow 44 1
Pennales Bacillariaceae Nitzschia littoralis Grunow 45 1
Pennales Bacillariaceae Nitszchia obtusa W. Smith 65 9
Pennales Bacillariaceae Nitzschia palea (Kützing) W. Smith 42 302
Pennales Bacillariaceae Nitzschia perminuta (Grunow) Peragalle 41 8
Pennales Bacillariaceae Nitzschia pseudofonticola Hustedt 66 23
Pennales Bacillariaceae Nitzschia reversa W. Smith 39 3
Pennales Bacillariaceae Nitzschia sigma (Kützing) W. Smith 21 1
Pennales Bacillariaceae Nitzschia subacicularis Hustedt 45 22
Pennales Bacillariaceae Nitzschia sp.1 55 7
Pennales Bacillariaceae Nitzschia sp.2 6 7
Pennales Epithemiaceae Epithemia adnata (Kützing) Brébisson 20 72
Pennales Epithemiaceae Rhopalodia contorta Hustedt 44 1
Pennales Epithemiaceae Rhopalodia gibba (Ehrenberg) O. Müller var. gibba 15 18

Report on the 2006 biomonitoring survey of the lower Mekong River and selected tributaries
Page 78
Order Family Species Tolerance score
Total samples
Pennales Epithemiaceae Rhopalodia gibberula Ehrenberg O. Müller 25 76
Pennales Fragilariaceae Fragilaria bidens Heiberg 40 9
Pennales Fragilariaceae Fragilaria capucina Desmazières 39 152
Pennales Fragilariaceae Fragilaria leptostauron (Ehrenberg) Hustedt 56 1
Pennales Fragilariaceae Fragilaria tenera (W. Smith) Lange-Bertalet 25 7
Pennales Fragilariaceae Fragilaria ulna var. acus (Kützing) Lange-Bertalot 21 9
Pennales Fragilariaceae Synedra lanceolata (Kützing) Reichardt 43 5
Pennales Fragilariaceae Synedra ulna var. aequalis (Kützing) Hustedt 34 117
Pennales Fragilariaceae Synedra ulna (Nitzsch) Ehrenberg 39 218
Pennales Naviculaceae Luticula goeppertiana (Bleisch) D.G.Mann 57 100
Pennales Naviculaceae Luticula monita (Hustedt) D.G.Mann 64 6
Pennales Naviculaceae Luticula mutica (Kützing) D.G.Mann 81 6
Pennales Naviculaceae Luticula nivalis (Ehrenberg) D.G. Mann 57 8
Pennales Naviculaceae Luticula sp.1 44 9
Pennales Naviculaceae Amphora montana Krasske 39 76
Pennales Naviculaceae Amphora sp.1 40 6
Pennales Naviculaceae Amphora sp.2 56 2
Pennales Naviculaceae Cymbella cistula (Ehrenberg) Kirchner 12 28
Pennales Naviculaceae Cymbella helmckei Krammer 23 3
Pennales Naviculaceae Cymbella japonica Reichelt 53 30
Pennales Naviculaceae Cymbella tumida (Brébisson) Van Heurck 48 117
Pennales Naviculaceae Cymbella turgidula Grunow 40 180
Pennales Naviculaceae Cymbella sp.1 37 89
Pennales Naviculaceae Cymbella sp.2 28 64
Pennales Naviculaceae Diatoma vulgaris Bory 18 10
Pennales Naviculaceae Diploneis elliptica (Kützing) Cleve 15 17
Pennales Naviculaceae Diploneis oblongella (Naegeli) Cleve 21 1
Pennales Naviculaceae Diploneis puella (Schumann) Cleve 26 13
Pennales Naviculaceae Encyonema silesiacum (Bleisch) D.G. Mann 32 70
Pennales Naviculaceae Encyonema vulgare Krammer 43 2
Pennales Naviculaceae Encyonema sp.1 37 69
Pennales Naviculaceae Encyonema sp.2 36 31
Pennales Naviculaceae Encyonema sp.3 43 30
Pennales Naviculaceae Encyonema sp.4 43 26
Pennales Naviculaceae Enocyonopsis leei var. leei Lange-Bertalet 37 5
Pennales Naviculaceae Encyonopsis subminuta Krammer&Reichardt 31 37
Pennales Naviculaceae Eunotia minor (Kützing) Grunow 56 1
Pennales Naviculaceae Eunotia pectinalis var. undulata (Ralf) Rabenhorst 56 1
Pennales Naviculaceae Frustularia vulgaris (Brébisson) Lange-Bertalet 54 2
Pennales Naviculaceae Geissleria decussis (Østrup) Lange-Bertalot&Metzeltin 25 35
Pennales Naviculaceae Geissleria paludosa (Hustedt) Lange-Bertalot&Metzeltin 28 25
Pennales Naviculaceae Gomphonema augur var. turris (Ehrenberg) Lange-Bertalet 36 3
Pennales Naviculaceae Gomphonema clevei Fricke 32 85
Pennales Naviculaceae Gomphonema entolejum Østrup 29 63
Pennales Naviculaceae Gomphonema gracile Ehrenberg 46 127

Page 79
Appendix 1. Diatom data
Order Family Species Tolerance score
Total samples
Pennales Naviculaceae Gomphonema parvulum (Kützing) Grunow 46 225
Pennales Naviculaceae Gomphonema truncatum Ehrenberg 24 5
Pennales Naviculaceae Gomphonema sp.1 40 58
Pennales Naviculaceae Gomphonema sp.2 39 24
Pennales Naviculaceae Gomphonema sp.3 60 10
Pennales Naviculaceae Gomphonema sp.4 57 15
Pennales Naviculaceae Gyrosigma scalproides (Rabenhorst) Cleve 44 31
Pennales Naviculaceae Gyrosigma spencerii (Quekett) Griffith&Herfrey 28 35
Pennales Naviculaceae Navicula affine (Ehrenberg) Pfitzer 75 2
Pennales Naviculaceae Navicula antonii Lange-Bertalot 56 3
Pennales Naviculaceae Navicula catarata-rheni Lange-Bertalot 43 10
Pennales Naviculaceae Navicula constans Hustedt 43 1
Pennales Naviculaceae Navicula crytocephala Kützing 20 10
Pennales Naviculaceae Navicula crytotenella Kützing 35 164
Pennales Naviculaceae Navicula flabellate MEIST 15 7
Pennales Naviculaceae Navicula gastrum (Ehrenberg) Kützing 37 19
Pennales Naviculaceae Navicula symmetrica Patrick 44 247
Pennales Naviculaceae Navicula radiosa Kützing 30 49
Pennales Naviculaceae Navicula viridula var. germainii (Wallace) Lange-Bertalot 37 82
Pennales Naviculaceae Navicula viridula var.linearis Hustedt 4 9
Pennales Naviculaceae Navicula viridula var. rostellata (Kützing) Cleve 44 124
Pennales Naviculaceae Navicula viridula (Kützing) Ehrenberg var. viridula 33 8
Pennales Naviculaceae Navicula sp.1 53 8
Pennales Naviculaceae Navicula sp.2 49 52
Pennales Naviculaceae Navicula sp.3 47 8
Pennales Naviculaceae Neidium binodis (Ehrenberg) Hustedt 34 7
Pennales Naviculaceae Neidium dubium (Ehrenberg) Cleve 23 3
Pennales Naviculaceae Neidium gracille Hustedt var. aequalis Hustedt 67 1
Pennales Naviculaceae Neidium sp.1 56 1
Pennales Naviculaceae Pleurosigma salinarum Grunow 11 6
Pennales Naviculaceae Sellaphora amoena Lange-Bertalot 40 17
Pennales Naviculaceae Sellaphora illustris Lange-Bertalot 61 6
Pennales Naviculaceae Sellaphora gibbula Lange-Bertalot 28 46
Pennales Naviculaceae Sellaphora popula (Kützing) Mereschkowsky 30 73
Pennales Naviculaceae Stauroneis anceps Ehrenberg 29 5
Pennales Pinnulariaceae Caloneis bacillum (Grunow) Cleve 43 3
Pennales Pinnulariaceae Caloneis silicula (Ehrenberg) Cleve 58 2
Pennales Pinnulariaceae Caloneis lauta Carter&Bailey 75 1
Pennales Pinnulariaceae Caloneis sp.1 38 5
Pennales Pinnulariaceae Caloneis sp.2 11 5
Pennales Pinnulariaceae Pinnularia acrospharia W. Smith 75 1
Pennales Pinnulariaceae Pinnularia braunii (Grunow) Cleve 63 11
Pennales Pinnulariaceae Pinnularia divergens var. linearis Østrup 21 1
Pennales Pinnulariaceae Pinnularia graciloides Hustedt 64 1
Pennales Pinnulariaceae Pinnularia mesolepta (Ehrenberg) W. Smith 39 5

Report on the 2006 biomonitoring survey of the lower Mekong River and selected tributaries
Page 80
Order Family Species Tolerance score
Total samples
Pennales Pinnulariaceae Pinnularia microstauron Ehrenberg 71 10
Pennales Pinnulariaceae Pinnularia subcapitata Gregory 32 1
Pennales Pinnulariaceae Pinnularia sp.1 56 1
Pennales Surirellaceae Cymatopleura solae (Brébisson) W. Smith 21 1
Pennales Surirellaceae Surirella angusta Kützing 39 20
Pennales Surirellaceae Surirella capronii Brébisson 6 1
Pennales Surirellaceae Surirella roba Leclercq 45 10
Pennales Surirellaceae Surirella splendida Krammer 41 20
Pennales Surirellaceae Surirella tenera Grunow 44 1
Pennales Triceratiaceae Pleurosira laevis (Ehrenberg) Compère 27 9

Page 81
Appendix 1. Diatom data
Appendix 1.3. Diatom metrics
No. Year Site Site disturbance
score
Species richness
Abundance Species diversity
index
Dominance index
ATSPT values
1 2004 LNO 1.00 23 326 1.237 0.631 29
2 2004 LPB 1.28 26 388 2.073 0.363 36
3 2004 LVT 1.78 29 562 1.746 0.561 42
4 2004 LNG 1.50 21 354 1.674 0.540 34
5 2004 LKD 1.43 33 372 1.734 0.576 33
6 2004 LPS 1.57 23 343 2.123 0.269 38
7 2004 TMU 1.71 23 346 1.410 0.577 40
8 2004 TCH 1.86 29 306 1.798 0.542 43
9 2004 TSK 2.13 41 318 2.160 0.336 42
10 2004 TKO 1.88 52 372 2.486 0.302 41
11 2004 CPP 2.88 16 197 1.226 0.518 45
12 2004 CTU 2.13 22 227 2.332 0.179 42
13 2004 CPS 2.22 18 231 2.107 0.140 43
14 2004 CSS 1.75 19 214 1.801 0.496 37
15 2004 CSP 1.25 18 144 1.961 0.282 39
16 2004 CKT 1.25 32 318 2.542 0.203 34
17 2004 VTC 2.50 37 239 2.537 0.252 41
18 2004 VCD 2.69 24 326 2.397 0.219 45
19 2004 VSS 2.29 27 318 2.098 0.383 42
20 2004 VSP 1.29 34 359 2.214 0.269 37
21 2005 LOU 1.00 21 257 2.246 0.317 29
22 2005 LPB 1.69 16 305 2.058 0.283 38
23 2005 LNK 1.38 15 276 2.282 0.262 33
24 2005 LMH 1.94 25 154 2.534 0.273 39
25 2005 LMX 1.94 24 129 2.239 0.273 39
26 2005 TMI 2.25 22 196 2.313 0.231 42
27 2005 TMC 1.64 22 229 2.031 0.251 40
28 2005 TKO 1.86 18 227 1.984 0.241 40
29 2005 LKU 1.13 20 209 1.935 0.369 35
30 2005 LKL 1.50 14 219 1.376 0.666 35
31 2005 CMR 1.75 21 206 1.093 0.521 33
32 2005 CSJ 1.50 24 214 1.020 0.563 33
33 2005 CKM 1.5ß 20 191 1.837 0.399 33
34 2005 CSU 2.13 19 268 1.573 0.514 36
35 2005 CSS 1.75 21 231 1.559 0.514 36
36 2005 CSP 1.13 23 232 1.388 0.569 28
37 2006 CPP 2.89 19 377 1.478 0.417 51
38 2006 CBS (CKL) 2.19 19 311 1.884 0.304 49
39 2006 CNL 1.97 22 314 2.421 0.233 44
40 2006 CTU 2.04 13 219 1.607 0.433 40
41 2006 CSN 2.00 19 221 1.775 0.427 44
42 2006 CSK 2.00 13 107 1.528 0.462 45

Report on the 2006 biomonitoring survey of the lower Mekong River and selected tributaries
Page 82
No. Year Site Site disturbance
score
Species richness
Abundance Species diversity
index
Dominance index
ATSPT values
43 2006 CPT 2.33 24 268 1.176 0.698 45
44 2006 CKT 1.14 26 134 2.516 0.159 39
45 2006 CMR 1.42 28 217 2.645 0.151 35
46 2006 CSJ 1.25 35 314 2.366 0.337 36
47 2006 CKM 1.19 38 250 2.466 0.298 37
48 2006 CSP 1.11 30 308 1.611 0.592 36
49 2006 CSU (CUS) 1.75 14 140 1.655 0.460 39
50 2006 VSS 2.00 25 334 1.575 0.571 41
51 2006 VSR (VSP) 2.00 31 161 2.264 0.221 41
52 2006 VTR (VVL) 2.44 21 100 2.201 0.280 45
53 2006 VCT 2.64 13 72 1.663 0.460 49
54 2006 VLX 2.69 18 317 1.532 0.393 5255 2006 VCL 1.91 23 180 1.623 0.535 5056 2006 VTC 2.28 19 234 1.856 0.321 4757 2006 VCD 2.31 19 280 1.608 0.410 50

Page 83
Appendix 2.1. Zooplankton species list and abundanceN
o.Ta
xon
Sam
plin
g Si
tes
CPP
CB
SC
NL
CTU
CSN
CSK
CPT
CK
TC
MR
CSJ
CK
MC
SPC
SUV
SSV
SRV
TRV
CT
VLX
VC
LV
TCV
CD
Phyl
um A
rthro
poda
Cla
ss C
rust
acea
Subc
lass
Cop
epod
a
Ord
er C
lano
ida
Fam
ily P
seud
odia
ptom
idae
1Ps
eudo
diap
tom
us b
eier
i Bre
hm0
03
10
00
00
00
00
00
36
263
16
2Sc
hmac
keri
a bu
lbos
a Sh
en e
t Tai
00
00
00
00
00
00
00
00
00
10
2
Fam
ily D
iapt
omid
ae
3Vi
etod
iapt
omus
hat
inhe
nsis
Dan
g0
01
015
00
00
00
00
00
00
00
00
4Eo
diap
tom
us d
raco
nisi
gniv
omi B
rehm
10
00
00
00
00
00
00
00
00
00
0
5N
eodi
apto
mus
vis
nu (B
rehm
)0
00
00
00
00
00
02
00
00
00
11
6N
eodi
apto
mus
bot
ulife
r (K
iefe
r)0
00
00
00
00
00
00
00
10
00
00
Ord
er C
yclo
poid
a
Fam
ily C
yclo
pida
e
7Ec
tocy
clop
s pha
lera
tus (
Koc
h)0
00
00
00
00
00
03
20
00
00
00
8M
icro
cycl
ops v
aric
ans (
Sars
)0
00
00
01
00
00
00
00
00
00
00
9M
esoc
yclo
ps le
ucka
rti (
Cla
us)
024
11
210
80
00
00
00
00
00
00
0
10Th
erm
ocyc
lops
hya
linus
(Reh
berg
) 5
372
475
8720
11
40
20
170
01
17
22
1
11Th
erm
ocyc
lops
taih
okue
nsis
(Har
ada)
00
01
13
10
00
00
80
00
00
00
0
Ord
er H
arpa
ctic
oida
Fam
ily P
aras
teno
carid
ae
12Pa
rast
enoc
aris
sp.
00
00
00
00
00
00
00
00
02
00
0
Subc
lass
Ost
raco
da
Ord
er P
odoc
opid
a
Fam
ily C
yprid
ae
13H
eter
ocyp
ris a
nom
ala
Klie
00
00
00
00
00
00
00
01
01
11
0
Subc
lass
Bra
nchi
opod
a
Ord
er C
lado
cera
Fam
ily B
osm
inid
ae
14Bo
smin
a lo
ngiro
stri
s (O
. F. M
ulle
r)0
54
00
00
10
40
18
00
00
20
00

Report on the 2006 biomonitoring survey of the lower Mekong River and selected tributaries
Page 84
No.
Taxo
nSa
mpl
ing
Site
s
CPP
CB
SC
NL
CTU
CSN
CSK
CPT
CK
TC
MR
CSJ
CK
MC
SPC
SUV
SSV
SRV
TRV
CT
VLX
VC
LV
TCV
CD
15Bo
smin
a co
rego
ni B
aird
01
00
00
00
00
00
00
00
00
00
0
16Bo
smin
opsi
s dei
ters
i Ric
hard
05
450
155
4570
80
12
06
20
00
00
07
2
Fam
ily S
idid
ae
17D
iaph
anos
oma
sars
i Ric
hard
05
00
114
11
01
00
00
00
02
01
0
18D
iaph
anos
oma
pauc
ispi
nosu
m B
rehm
00
00
50
00
00
00
00
00
00
00
0
Fam
ily D
aphn
iidae
19M
oino
daph
nia
mac
leay
ii (K
ing)
01
00
00
20
00
00
00
00
00
00
0
20C
erio
daph
nia
riga
udi R
icha
rd0
31
00
03
00
01
02
00
00
00
00
Fam
ily C
hydo
ridae
21D
ispa
ralo
na ro
stra
ta (K
och)
00
00
00
00
00
00
13
00
00
00
0
22Le
ydig
ia a
cant
hoce
rcoi
des (
Fisc
her)
00
00
00
01
01
00
00
10
00
00
0
23Bi
aper
tura
inte
rmed
ia (S
ars)
00
00
00
00
00
00
01
00
00
00
0
Phyl
um A
sche
lmin
thes
Cla
ss E
urot
ator
ea
Fam
ily P
hilo
dini
dae
24Tr
icho
tria
tetr
actis
(Ehr
enbe
rg)
00
00
00
00
01
00
2218
00
00
00
0
25Ro
tari
a ne
ptun
ia (E
hren
berg
)0
00
00
15
00
00
00
00
01
10
00
26Ph
ilodi
na ro
seol
a (E
hren
berg
)0
23
00
2918
31
03
157
221
15
20
17
27Ph
ilodi
na m
egal
otro
cha
(Ehr
enbe
rg)
00
00
09
150
00
00
00
00
00
00
2
28Ph
ilodi
na c
itrin
a Eh
renb
erg
00
00
00
00
02
00
00
00
00
00
0
29Ph
ilodi
na sp
.0
00
00
00
00
100
00
00
00
00
00
Fam
ily N
otom
mat
idae
30N
otom
mat
a au
rita
(O.F
.Mul
ler)
00
00
00
00
00
00
27
00
00
00
0
31C
epha
lode
lla e
xign
a (G
osse
)0
00
00
270
00
120
91
00
00
00
00
32C
epha
lode
lla c
atel
lina
(O.F
.Mul
ler)
00
00
00
00
00
00
318
00
00
00
0
33C
epha
lode
lla g
ibba
Ehr
enbe
rg0
00
00
00
01
00
50
00
00
00
00
34Sc
arid
ium
long
icau
dum
(Mul
ler)
00
00
00
40
00
00
30
00
00
00
0
Fam
ily T
richo
cerc
idae
34D
iure
lla si
mili
s (W
ierz
ejsk
i)1
63
58
4666
00
00
00
00
00
01
00
35D
iure
lla ti
gris
(Mul
ler)
00
00
017
170
01
00
12
00
00
00
0

Page 85
Appendix 2. Zooplankton data
No.
Taxo
nSa
mpl
ing
Site
s
CPP
CB
SC
NL
CTU
CSN
CSK
CPT
CK
TC
MR
CSJ
CK
MC
SPC
SUV
SSV
SRV
TRV
CT
VLX
VC
LV
TCV
CD
34D
iure
lla w
eber
i Jen
ning
s0
00
03
013
00
00
00
00
00
00
00
35Tr
icho
cerc
a cy
lindr
ica
(Im
hof)
00
00
20
00
00
00
00
00
00
00
0
36Tr
icho
cerc
a ca
puci
na (
Wie
rsej
ski e
t Za
char
ias)
00
00
00
20
00
00
00
00
00
00
1
37Tr
icho
cerc
a ra
ttus r
attu
s Mul
ler
00
00
011
00
00
00
00
00
10
10
0
38Tr
icho
cerc
a pu
silla
Jenn
igns
016
90
321
618
70
05
06
00
00
00
01
0
Fam
ily S
ynch
aetid
ae
40Po
lyar
thra
vul
gari
s Car
lin4
4065
1317
082
545
130
28
562
30
02
152
6241
15
41Po
lyar
thra
mir
a Vo
igt
010
4861
00
00
00
00
00
00
00
00
00
42Pl
oeso
ma
huds
oni (
Imho
f)0
01
039
00
00
00
01
00
00
07
00
Fam
ily T
estu
dine
llida
e
43Te
stud
inel
la p
atin
a (H
erm
ann)
00
00
03
21
00
00
00
00
00
00
0
44Po
mph
olyx
com
plan
ata
Gos
se0
00
00
70
00
20
00
00
00
00
00
45Po
mph
olyx
sulc
ata
Hud
son
00
00
00
00
06
11
132
00
03
00
0
Fam
ily A
spla
nchn
idae
46As
plan
chna
sieb
oldi
(Ley
dig)
00
00
00
148
00
00
00
00
02
10
01
47As
plan
chno
pus m
ultic
eps (
Schr
ank)
220
00
031
660
00
00
00
00
01
00
00
Fam
ily G
astro
podi
dae
48As
com
orph
a ec
audi
s Per
ty0
00
00
2442
30
016
626
43
00
00
00
0
49As
com
orph
a ov
alis
(Car
lin)
045
00
00
00
00
00
00
00
00
00
0
Fam
ily L
ecan
idae
50Le
cane
leon
tina
(Tur
ner)
00
00
00
02
00
00
00
00
00
00
0
51Le
cane
luna
(Mul
ler)
00
00
017
100
01
00
2614
00
00
00
0
52Le
cane
cur
vico
rnis
(Mur
ray)
00
00
02
00
00
00
01
00
00
00
0
53Le
cane
has
tata
(Mur
ray)
00
00
10
100
00
10
10
00
00
00
0
54Le
cane
pus
illa
Har
ring
00
00
00
00
00
01
100
00
00
00
0
55Le
cane
ung
ulat
a (E
hren
berg
)0
00
00
00
00
00
05
00
00
00
00
56M
onos
tyla
bul
la (G
osse
)0
00
00
72
10
10
015
10
00
00
01
57M
onos
tyla
cre
nata
Har
ring
00
00
02
20
00
00
35
00
00
00
0
58M
onos
tyla
luna
ris E
hren
berg
00
00
03
30
00
10
282
00
00
00
0
59M
onos
tyla
qua
drid
enta
ta E
hren
berg
00
00
00
10
00
00
00
00
00
00
0
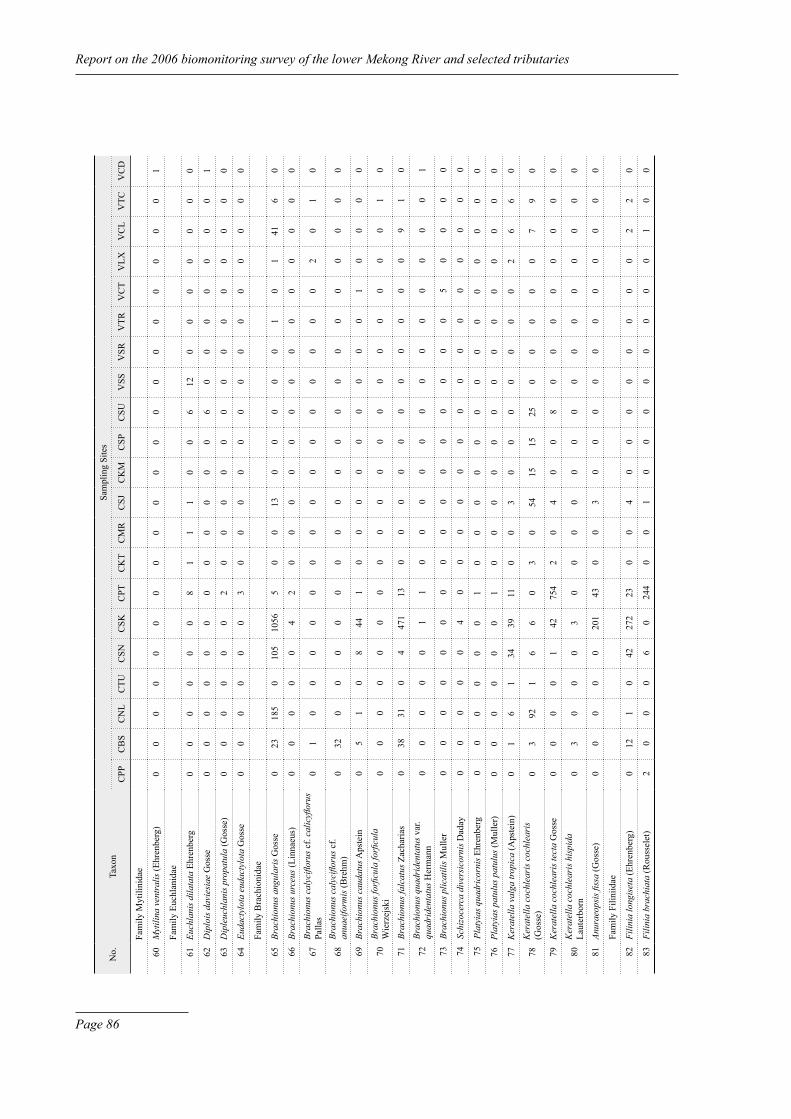
Report on the 2006 biomonitoring survey of the lower Mekong River and selected tributaries
Page 86
No.
Taxo
nSa
mpl
ing
Site
s
CPP
CB
SC
NL
CTU
CSN
CSK
CPT
CK
TC
MR
CSJ
CK
MC
SPC
SUV
SSV
SRV
TRV
CT
VLX
VC
LV
TCV
CD
Fam
ily M
ytili
nida
e
60M
ytili
na v
entr
alis
(Ehr
enbe
rg)
00
00
00
00
00
00
00
00
00
00
1
Fam
ily E
uchl
anid
ae
61Eu
chla
nis d
ilata
ta E
hren
berg
00
00
00
81
11
00
612
00
00
00
0
62D
iplo
is d
avie
siae
Gos
se0
00
00
00
00
00
06
00
00
00
01
63D
iple
uchl
anis
pro
patu
la (G
osse
)0
00
00
02
00
00
00
00
00
00
00
64Eu
dact
ylot
a eu
dact
ylot
a G
osse
00
00
00
30
00
00
00
00
00
00
0
Fam
ily B
rach
ioni
dae
65Br
achi
onus
ang
ular
is G
osse
023
185
010
510
565
00
130
00
00
10
141
60
66Br
achi
onus
urc
eus (
Linn
aeus
)0
00
00
42
00
00
00
00
00
00
00
67Br
achi
onus
cal
ycifl
orus
cf.
calic
yflor
us
Palla
s0
10
00
00
00
00
00
00
00
20
10
68Br
achi
onus
cal
ycifl
orus
cf.
anua
eifo
rmis
(Bre
hm)
032
00
00
00
00
00
00
00
00
00
0
69Br
achi
onus
cau
datu
s Aps
tein
05
10
844
10
00
00
00
00
10
00
0
70Br
achi
onus
forfi
cula
forfi
cula
W
ierz
ejsk
i0
00
00
00
00
00
00
00
00
00
10
71Br
achi
onus
falc
atus
Zac
haria
s0
3831
04
471
130
00
00
00
00
00
91
0
72Br
achi
onus
qua
drid
enta
tus v
ar.
quad
ride
ntat
us H
erm
ann
00
00
01
10
00
00
00
00
00
00
1
73Br
achi
onus
plic
atili
s Mul
ler
00
00
00
00
00
00
00
00
50
00
0
74Sc
hizo
cerc
a di
vers
icor
nis D
aday
00
00
04
00
00
00
00
00
00
00
0
75Pl
atyi
as q
uadr
icor
nis E
hren
berg
00
00
00
10
00
00
00
00
00
00
0
76Pl
atyi
as p
atul
us p
atul
us (M
ulle
r)0
00
00
01
00
00
00
00
00
00
00
77K
erat
ella
val
ga tr
opic
a (A
pste
in)
01
61
3439
110
03
00
00
00
02
66
0
78K
erat
ella
coc
hlea
ris c
ochl
eari
s (G
osse
)0
392
16
60
30
5415
1525
00
00
07
90
79K
erat
ella
coc
hlea
ris t
ecta
Gos
se0
00
01
4275
42
04
00
80
00
00
00
0
80K
erat
ella
coc
hlea
ris h
ispi
da
Laut
erbo
rn0
30
00
30
00
00
00
00
00
00
00
81An
urae
opsi
s fiss
a (G
osse
)0
00
00
201
430
03
00
00
00
00
00
0
Fam
ily F
ilini
idae
82Fi
linia
long
iset
a (E
hren
berg
)0
121
042
272
230
04
00
00
00
00
22
0
83Fi
linia
bra
chia
ta (R
ouss
elet
)2
00
06
024
40
01
00
00
00
00
10
0

Page 87
Appendix 2. Zooplankton data
No.
Taxo
nSa
mpl
ing
Site
s
CPP
CB
SC
NL
CTU
CSN
CSK
CPT
CK
TC
MR
CSJ
CK
MC
SPC
SUV
SSV
SRV
TRV
CT
VLX
VC
LV
TCV
CD
84Te
tram
astix
opo
liens
is Z
acha
rias
05
00
00
680
00
00
00
00
00
30
0
Fam
ily H
exat
hrid
ae
85H
exat
hra
mir
a (H
udso
n)0
198
340
10
80
00
21
00
03
4354
4219
5
Phyl
um S
arco
mas
tigop
hora
Cla
ss L
obos
ea
Fam
ily A
rcel
lidae
84Ar
cella
vul
gari
s Ehr
enbe
rg6
02
21
3859
136
85
523
418
01
62
13
85Ar
cella
con
ica
Defl
ante
00
00
05
70
00
00
00
00
00
00
0
86Ar
cella
hem
isph
aeri
ca P
erty
0
00
00
00
00
01
00
00
00
00
00
Fam
ily C
entro
pyxi
dae
87C
entro
pyxi
s acu
leat
a St
ein
10
00
05
113
22
51
2323
172
55
50
2
Fam
ily D
iffug
iidae
88D
ifflug
ia e
lega
ns P
enar
d1
015
74
015
09
110
00
21
04
1912
4491
15
89D
ifflug
ia u
rceo
lata
Car
ter
00
00
00
00
00
00
10
10
00
26
0
90D
ifflug
ia c
oron
a W
allic
h0
00
00
10
00
00
00
01
00
10
01
91D
iffug
ia lo
bost
oma
Leid
y0
00
02
130
83
02
45
03
00
00
00
92D
ifflug
ia a
cum
inat
a Eh
renb
erg
00
00
00
00
01
00
81
10
00
10
1
93D
ifflug
ia p
irifo
rmis
Ehr
enbe
rg0
00
00
07
62
00
00
01
00
10
11
94D
ifflug
ia g
lobu
losa
Duj
ardi
n0
00
00
00
00
00
1212
52
02
143
00
95D
ifflug
ia tu
berc
ulat
us (W
allic
h)0
00
013
2071
00
00
00
00
00
00
00
96D
iflug
ia la
nceo
lata
Pen
ard
00
00
00
00
10
40
00
00
00
00
0
97D
iflug
ia sp
.0
00
00
016
10
00
00
00
00
00
00
0
98Le
sque
reus
ia sp
iral
is (E
hren
berg
)0
00
00
00
00
00
10
04
00
00
00
Cla
ss F
ilose
a
Fam
ily E
ugly
phid
ae
99Eu
glyp
ha a
lveo
rata
Duj
ardi
n0
00
00
00
00
00
00
01
00
00
10
Cla
ss P
hyto
mas
tigop
hora
Fam
ily P
erid
iniid
ae
100
Cer
atiu
m sp
p0
00
04
00
01
00
01
00
00
00
00
Fam
ily V
olvo
cida
e
101
Pleo
dori
na c
alifo
rnic
a Sh
aw7
747
30
00
00
00
01
00
13
2013
01

Report on the 2006 biomonitoring survey of the lower Mekong River and selected tributaries
Page 88
No.
Taxo
nSa
mpl
ing
Site
s
CPP
CB
SC
NL
CTU
CSN
CSK
CPT
CK
TC
MR
CSJ
CK
MC
SPC
SUV
SSV
SRV
TRV
CT
VLX
VC
LV
TCV
CD
Larv
a
102
Nau
pliu
s cop
epod
a24
287
969
160
173
626
375
431
82
213
34
321
5122
072
3421
7
103
Biv
alvi
a 3
012
30
00
85
75
490
10
23
649
23
104
Gas
tropo
da0
00
00
00
00
00
00
00
1915
21
00
105
Chi
rono
mid
ae -
Dip
tera
00
00
01
03
13
22
40
10
00
00
0

Page 89
Appendix 2. Zooplankton data
Appendix 2.2. Zooplankton tolerance score
Class Family Taxon Tolerance score
Total samples
Crustacea Pseudodiaptomidae Pseudodiaptomus beieri Brehm 68 14Crustacea Pseudodiaptomidae Schmackeria bulbosa Shen et Tai 59 3Crustacea Diaptomidae Allodiaptomus calcarus Shen et Tai 23 4Crustacea Diaptomidae Allodiaptomus raoi Kiefer 94 1Crustacea Diaptomidae Allodiaptomus sp. 49 3Crustacea Diaptomidae Eodiaptomus draconisignivomi Brehm 82 3Crustacea Diaptomidae Vietodiaptomus hatinhensis Dang 50 4Crustacea Diaptomidae Neodiaptomus visnu (Brehm) 59 7Crustacea Diaptomidae Neodiaptomus botulifer (Kiefer) 45 4Crustacea Cyclopidae Ectocyclops phaleratus (Koch) 47 12Crustacea Cyclopidae Paracyclops fimbriatus (Fischer) 38 1Crustacea Cyclopidae Microcyclops varicans (Sars) 51 17Crustacea Cyclopidae Microcyclops sp. 39 3Crustacea Cyclopidae Mesocyclops leuckarti (Claus) 54 23Crustacea Cyclopidae Thermocyclops hyalinus (Rehberg) 49 55Crustacea Cyclopidae Thermocyclops taihokuensis (Harada) 39 41Crustacea Cyclopidae Thermocyclops sp. 36 1Crustacea Canthocamptidae Canthocamptus staphylinus Jurine 16 2Crustacea Canthocamptidae Elaphoidella sp. 30 3Crustacea Canthocamptidae Epactophanes sp. 56 1Crustacea Parastenocaridae Parastenocaris sp. 54 10Crustacea Cypridae Heterocypris anomala Klie 68 5Crustacea Cypridae Heterocypris sp. 28 2Crustacea Cypridae Cypris sp. 43 1Crustacea Cypridae Candona sp. 19 1Crustacea Bosminidae Bosmina longirostris (O. F. Muller) 37 36Crustacea Bosminidae Bosmina coregoni Baird 40 23Crustacea Bosminidae Bosminopsis deitersi Richard 47 61Crustacea Sididae Diaphanosoma sarsi Richard 54 20Crustacea Sididae Diaphanosoma paucispinosum Brehm 45 3Crustacea Macrothricidae Macrothrix spinosa King 43 3Crustacea Macrothricidae Macrothrix sp. 43 2Crustacea Daphniidae Moina sp. 43 2Crustacea Daphniidae Daphnia lumholtzi Sars 25 2Crustacea Daphniidae Daphnia cf. galeata Sars 47 2Crustacea Daphniidae Moinodaphnia macleayii (King) 64 3Crustacea Daphniidae Ceriodaphnia rigaudi Richard 40 11Crustacea Daphniidae Ceriodaphnia laticaudata O. F. Muller 25 8Crustacea Daphniidae Ceriodaphnia cornuta Sars 36 1Crustacea Chydoridae Chydorus sphaericus sphaericus (O. F. Muller) 29 6Crustacea Chydoridae Chydorus barroisi barroisi (Richard) 25 1Crustacea Chydoridae Chydorus sp. 43 1Crustacea Chydoridae Alonella excisa (Fischer) 48 3

Report on the 2006 biomonitoring survey of the lower Mekong River and selected tributaries
Page 90
Class Family Taxon Tolerance score
Total samples
Crustacea Chydoridae Disparalona rostrata (Koch) 45 15Crustacea Chydoridae Pleuroxus hamatus hamatus Birge 44 3Crustacea Chydoridae Pleuroxus similis Varva 43 2Crustacea Chydoridae Leydigia acanthocercoides (Fischer) 39 8Crustacea Chydoridae Alona rectangula Sars 43 9Crustacea Chydoridae Alona davidi Richard 44 5Crustacea Chydoridae Biapertura karua (King) 47 4Crustacea Chydoridae Biapertura intermedia (Sars) 50 5Eurotatorea Philodinidae Trichotria tetractis (Ehrenberg) 41 28Eurotatorea Philodinidae Rotaria rotaria (Pallas) 39 2Eurotatorea Philodinidae Rotaria neptunia (Ehrenberg) 71 4Eurotatorea Philodinidae Philodina roseola (Ehrenberg) 48 48Eurotatorea Philodinidae Philodina megalotrocha (Ehrenberg) 59 7Eurotatorea Philodinidae Philodina citrina Ehrenberg 13 2Eurotatorea Philodinidae Philodina sp. 33 15Eurotatorea Notommatidae Monomata sp. 43 1Eurotatorea Notommatidae Notommata aurita (O.F.Muller) 43 15Eurotatorea Notommatidae Notommata sp. 44 1Eurotatorea Notommatidae Cephalodella compacta Wiszniewski 0 4Eurotatorea Notommatidae Cephalodella catellina (O.F.Muller) 34 13Eurotatorea Notommatidae Cephalodella exigna (Gosse) 23 13Eurotatorea Notommatidae Cephalodella gibba Ehrenberg 21 3Eurotatorea Notommatidae Cephalodella auriculata (O.F.Muler) 94 1Eurotatorea Notommatidae Cephalodella sp. 17 6Eurotatorea Notommatidae Scaridium longicaudum (Muller) 44 11Eurotatorea Trichocercidae Diurella similis (Wierzejski) 57 28Eurotatorea Trichocercidae Diurella tigris (Muller) 52 18Eurotatorea Trichocercidae Diurella weberi Jennings 63 4Eurotatorea Trichocercidae Diurrella tenuior (Goose) 0 2Eurotatorea Trichocercidae Diurella brachyura (Gosse) 43 4Eurotatorea Trichocercidae Trichocerca gracilis (Tessin) 56 12Eurotatorea Trichocercidae Trichocerca cylindrica (Imhof) 40 3Eurotatorea Trichocercidae Trichocerca capucina (Wiersejski et Zacharias) 66 7Eurotatorea Trichocercidae Trichocerca longiseta (Schrank) 60 2Eurotatorea Trichocercidae Trichocerca rattus minor Fad 36 1Eurotatorea Trichocercidae Trichocerca rattus rattus Muller 64 7Eurotatorea Trichocercidae Trichocerca pusilla Jennigns 46 30Eurotatorea Trichocercidae Trichocerca bicristata (Gosse) 39 1Eurotatorea Synchaetidae Polyarthra vulgaris Carlin 47 95Eurotatorea Synchaetidae Polyarthra mira Voigt 54 6Eurotatorea Synchaetidae Ploesoma hudsoni (Imhof) 49 19Eurotatorea Testudinellidae Testudinella patina (Hermann) 47 5Eurotatorea Testudinellidae Testudinella mucronata (Gosse) 43 3Eurotatorea Testudinellidae Testudinella sp. 0 2Eurotatorea Testudinellidae Pompholyx complanata Gosse 32 15

Page 91
Appendix 2. Zooplankton data
Class Family Taxon Tolerance score
Total samples
Eurotatorea Testudinellidae Pompholyx sulcata Hudson 32 32Eurotatorea Asplanchnidae Asplanchna sieboldi (Leydig) 52 26Eurotatorea Asplanchnidae Asplanchna girodi de Guerne 35 5Eurotatorea Asplanchnidae Asplanchna priodonta Gosse 45 5Eurotatorea Asplanchnidae Asplanchnopus multiceps (Schrank) 69 13Eurotatorea Gastropodidae Ascomorpha ecaudis Perty 34 53Eurotatorea Gastropodidae Ascomorpha agilis Zach 12 3Eurotatorea Gastropodidae Ascomorpha ovalis Perty 56 4Eurotatorea Gastropodidae Ascomorpha sp. 30 10Eurotatorea Lecanidae Lecane leontina (Turner) 27 6Eurotatorea Lecanidae Lecane luna (Muller) 42 40Eurotatorea Lecanidae Lecane curvicornis (Murray) 40 8Eurotatorea Lecanidae Lecane hastata (Murray) 48 11Eurotatorea Lecanidae Lecane pusilla Harring 42 6Eurotatorea Lecanidae Lecane ungulata (Ehrenberg) 38 2Eurotatorea Lecanidae Lecane ludwigii (Eckstein) 36 1Eurotatorea Lecanidae Lecane hornemanni (Ehrenberg) 36 1Eurotatorea Lecanidae Lecane signifera ploenensis (Voigt) 39 4Eurotatorea Lecanidae Lecane sp. 43 1Eurotatorea Lecanidae Monostyla bulla (Gosse) 33 32Eurotatorea Lecanidae Monostyla crenata Harring 50 9Eurotatorea Lecanidae Monostyla lunaris Ehrenberg 41 27Eurotatorea Lecanidae Monostyla quadridentata Ehrenberg 67 1Eurotatorea Lecanidae Monostyla closterocerca Schmarda 25 2Eurotatorea Proalidae Proales decipiens (Ehrenberg) 56 1Eurotatorea Mytilinidae Mytilina ventralis (Ehrenberg) 36 9Eurotatorea Mytilinidae Mytilina compressa (Gosse) 14 1Eurotatorea Colurellidae Lepadella patella (Muller) 34 9Eurotatorea Colurellidae Lepadella sp. 29 1Eurotatorea Colurellidae Colurella uncinata (O.F.Muller) 38 1Eurotatorea Euchlanidae Euchlanis dilatata Ehrenberg 44 25Eurotatorea Euchlanidae Euchlanis sp. 39 2Eurotatorea Euchlanidae Diplois daviesiae Gosse 42 14Eurotatorea Euchlanidae Dipleuchlanis propatula (Gosse) 55 4Eurotatorea Euchlanidae Eudactylota eudactylota Gosse 67 2Eurotatorea Brachionidae Brachionus angularis Gosse 54 49Eurotatorea Brachionidae Brachionus urceus (Linnaeus) 54 5Eurotatorea Brachionidae Brachionus cf. urceus (Linnaeus) 43 3Eurotatorea Brachionidae Brachionus calyciflorus cf. calicyflorus Pallas 62 14
Eurotatorea Brachionidae Brachionus calyciflorus cf. anuaeiformis (Brehm) 59 3
Eurotatorea Brachionidae Brachionus caudatus Apstein 52 14Eurotatorea Brachionidae Brachionus forficula forficula Wierzejski 70 2Eurotatorea Brachionidae Brachionus falcatus Zacharias 55 19
Eurotatorea Brachionidae Brachionus quadridentatus var. quadridentatus Hermann 49 6

Report on the 2006 biomonitoring survey of the lower Mekong River and selected tributaries
Page 92
Class Family Taxon Tolerance score
Total samples
Eurotatorea Brachionidae Brachionus plicatilis Muller 82 2Eurotatorea Brachionidae Schizocerca diversicornis Daday 68 5Eurotatorea Brachionidae Platyias quadricornis Ehrenberg 50 3Eurotatorea Brachionidae Platyias patulus patulus (Muller) 53 7Eurotatorea Brachionidae Keratella valga tropica (Apstein) 50 58Eurotatorea Brachionidae Keratella cochlearis cochlearis (Gosse) 40 92Eurotatorea Brachionidae Keratella cochlearis tecta Gosse 48 40Eurotatorea Brachionidae Keratella cochlearis hispida Lauterborn 43 5Eurotatorea Brachionidae Keratella irregularis (Lauterborn) 24 4Eurotatorea Brachionidae Keratella quadrata (O.F.Muller) 46 8Eurotatorea Brachionidae Anuraeopsis fissa (Gosse) 35 19Eurotatorea Brachionidae Anuraeopsis sp. 60 6Eurotatorea Brachionidae Macrochaetus subquadritus Petry 25 5Eurotatorea Flosculariidae Sinantheria socialis (Linnaeus) 36 1Eurotatorea Filiniidae Filinia longiseta (Ehrenberg) 45 27Eurotatorea Filiniidae Filinia longiseta var. passa (O. F. Muller) 41 2Eurotatorea Filiniidae Filinia brachiata (Rousselet) 55 13Eurotatorea Filiniidae Tetramastix opoliensis Zacharias 54 10Eurotatorea Hexathridae Hexathra mira (Hudson) 56 47Ciliata Epistylidae Epistylis plicatilis Ehrenberg 47 2Ciliata Epistylidae Epistylis sp. 38 1Ciliata Vorticellidae Vorticella sp. 47 1Lobosea Arcellidae Arcella vulgaris Ehrenberg 38 122Lobosea Arcellidae Arcella discoides Ehrenberg 27 10Lobosea Arcellidae Arcella hemisphaerica Perty 32 21Lobosea Arcellidae Arcella gibbosa Penard 56 1Lobosea Arcellidae Arcella conica Deflante 60 5Lobosea Arcellidae Arcella sp. 42 11Lobosea Centropyxidae Centropyxis aculeata Stein 40 79Lobosea Centropyxidae Centropyxis constricta Ehrenberg 29 12
Lobosea Diffugiidae Protocucurbitella coroniformis Gauthier-Lie’vre & Thomas 32 9
Lobosea Diffugiidae Protocucurbitella sp. 46 4Lobosea Diffugiidae Pseudodifflugia gracilis Schlumberger 8 10Lobosea Diffugiidae Pseudodifflugia fascicularis Penard 11 8Lobosea Diffugiidae Difflugia elegans Penard 51 71Lobosea Diffugiidae Difflugia urceolata Carter 52 29Lobosea Diffugiidae Difflugia corona Wallich 49 15Lobosea Diffugiidae Diffugia lobostoma Leidy 31 56Lobosea Diffugiidae Difflugia acuminata Ehrenberg 35 24Lobosea Diffugiidae Difflugia piriformis Ehrenberg 36 21Lobosea Diffugiidae Difflugia globulosa Dujardin 35 39Lobosea Diffugiidae Diflugia scalpellum Penard 0 1Lobosea Diffugiidae Difflugia molesta Penard 19 2Lobosea Diffugiidae Difflugia lanceolata Penard 22 11Lobosea Diffugiidae Difflugia amphora Leidy 25 1

Page 93
Appendix 2. Zooplankton data
Class Family Taxon Tolerance score
Total samples
Lobosea Diffugiidae Difflugia tuberculatus (Wallich) 49 11Lobosea Diffugiidae Diflugia sp. 40 5Lobosea Diffugiidae Pontigulasia bigibbosa Penard 25 1Lobosea Diffugiidae Lesquereusia spiralis (Ehrenberg) 35 3Filosea Euglyphidae Euglypha alveorata Dujardin 40 18Filosea Euglyphidae Euglypha laevis Ehrenberg 37 6Filosea Euglyphidae Euglypha sp. 13 1Phytomastigophora Peridiniidae Ceratium spp 30 26Phytomastigophora Euglenidae Euglena acus Ehrenberg 57 4Phytomastigophora Euglenidae Phacus longicauda (Ehrenberg) 34 7Phytomastigophora Volvocidae Pleodorina californica Shaw 61 44Phytomastigophora Volvocidae Volvox spermatosphaera Powers 94 1Larvae Nauplius copepoda 43 158Larvae Bivalvia 43 65Larvae Gastropoda 74 8Larvae Chironomidae - Diptera 28 48Larvae Ephemeroptera 28 20Larvae Hydra carina 32 6

Report on the 2006 biomonitoring survey of the lower Mekong River and selected tributaries
Page 94

Page 95
Appendix 2. Zooplankton data
Appendix 2.3. Zooplankton metrics
No. Year Site Site disturbance
score
Species richness
Abundance Abundance(log)
Species diversity
index
Dominance index
ATSPTvalue
1 2004 LNO 1.00 16 172 2.236 1.564 0.546 23
2 2004 LPB 1.28 18 547 2.738 0.578 0.104 33
3 2004 LVT 1.78 17 72 1.857 2.39 0.75 39
4 2004 LNG 1.50 28 1194 3.077 1.965 0.576 39
5 2004 LKD 1.43 13 53 1.724 2.181 0.773 42
6 2004 LPS 1.57 31 681 2.833 1.289 0.306 40
7 2004 TMU 1.71 61 3982 3.600 1.424 0.508 43
8 2004 TCH 1.86 28 2252 3.353 1.296 0.332 40
9 2004 TSK 2.13 18 1739 3.240 1.621 0.576 47
10 2004 TKO 1.88 22 160 2.204 2.42 0.75 40
11 2004 CPP 2.88 34 954 2.980 1.717 0.431 53
12 2004 CTU 2.13 30 2234 3.349 1.004 0.497 49
13 2004 CPS 2.22 30 576 2.760 1.714 0.39 45
14 2004 CSS 1.75 26 150 2.176 2.632 0.76 43
15 2004 CSP 1.25 20 67 1.826 2.646 0.776 43
16 2004 CKT 1.25 24 106 2.025 2.798 0.858 41
17 2004 VTC 2.50 35 1378 3.139 2.25 0.732 50
18 2004 VCD 2.69 25 1090 3.037 1.833 0.601 49
19 2004 VKT 2.29 19 194 2.288 2.024 0.603 44
20 2004 VSP 1.29 21 80 1.903 2.573 0.712 41
21 2005 LOU 1.00 16 64 1.806 2.093 0.578 22
22 2005 LPB 1.69 23 77 1.886 2.708 0.818 41
23 2005 LNK 1.38 29 169 2.228 2.92 0.846 34
24 2005 LMH 1.94 24 332 2.521 1.534 0.379 43
25 2005 LMX 1.94 27 228 2.358 2.091 0.508 42
26 2005 TMI 2.25 29 541 2.733 2.191 0.622 43
27 2005 TMC 1.64 23 485 2.686 1.153 0.237 43
28 2005 TKO 1.86 43 435 2.638 2.572 0.714 42
29 2005 LKU 1.13 18 152 2.182 1.925 0.539 35
30 2005 LKL 1.50 24 67 1.826 2.886 0.835 34
31 2005 CMR 1.75 23 118 2.072 2.25 0.567 37
32 2005 CSJ 1.50 23 356 2.551 1.826 0.62 38
33 2005 CKM 1.50 19 235 2.371 1.947 0.638 39
34 2005 CSU 2.13 20 42 1.623 2.77 0.857 38
35 2005 CSS 1.75 19 103 2.013 2.487 0.796 36
36 2005 CSP 1.13 16 259 2.413 1.935 0.656 40
37 2006 CPP 2.89 12 275 2.439 0.626 0.12 51
38 2006 CBS (CKL) 2.19 28 2532 3.403 1.652 0.587 52
39 2006 CNL 1.97 25 796 2.901 2.308 0.768 49
40 2006 CTU 2.04 13 199 2.299 0.909 0.196 49
41 2006 CSN 2.00 28 890 2.949 2.338 0.806 48
42 2006 CSK 2.00 44 4293 3.633 2.385 0.755 48

Report on the 2006 biomonitoring survey of the lower Mekong River and selected tributaries
Page 96
No. Year Site Site disturbance
score
Species richness
Abundance Abundance(log)
Species diversity
index
Dominance index
ATSPTvalue
43 2006 CPT 2.33 52 8895 3.949 1.97 0.493 50
44 2006 CKT 1.14 19 81 1.908 2.559 0.84 40
45 2006 CMR 1.42 16 73 1.863 2.035 0.576 41
46 2006 CSJ 1.25 30 185 2.267 2.732 0.709 39
47 2006 CKM 1.19 18 63 1.799 2.566 0.762 39
48 2006 CSP 1.11 20 210 2.322 2.169 0.705 39
49 2006 CSU (CUS) 1.75 41 527 2.722 2.912 0.748 41
50 2006 VSS 2.00 23 179 2.253 2.533 0.771 42
51 2006 VSR (VSP) 2.00 14 45 1.653 2.066 0.623 39
52 2006 VTR (VVL) 2.44 14 62 1.792 1.931 0.662 53
53 2006 VCT 2.64 19 166 2.220 2.081 0.693 54
54 2006 VLX 2.69 25 445 2.648 1.885 0.506 49
55 2006 VCL 1.91 26 381 2.581 2.413 0.812 51
56 2006 VCT 2.28 24 237 2.375 2.057 0.617 50
57 2006 VCD 2.31 24 291 2.464 1.229 0.255 49

Page 97
Appendix 3.1. Littoral macroinvertebrates species list and abundance
No.
Ta
xon
Sam
plin
g si
tes
CPP
CK
LC
NL
CTU
CSN
CSK
CPT
CK
TC
MR
CSJ
CK
MC
SPC
SUV
SSV
SPV
VL
VTC
VLX
VC
LV
CT
VC
D
1H
aust
orus
sp0
00
00
00
00
00
00
00
00
00
00
2Sc
aphu
sa sp
00
01
00
00
00
00
00
00
00
00
0
3In
dopl
anor
bis s
p0
00
00
00
00
00
00
00
00
00
00
4C
arba
idae
sp0
00
00
00
00
00
00
00
00
00
00
5La
ccop
hilu
s sp
00
00
00
00
00
00
00
00
00
00
0
6Rh
antu
s sp
00
00
00
00
00
00
00
00
00
00
0
7C
lept
elm
is sp
00
00
00
00
00
00
00
00
00
00
0
8La
ra sp
00
00
00
00
00
00
00
00
00
00
0
9M
acro
nych
us sp
00
00
00
00
06
00
00
00
00
00
0
10O
ptio
serv
us sp
00
00
00
00
00
00
00
00
00
00
0
11G
eory
ssus
sp0
00
00
00
00
00
00
00
00
00
00
12G
yret
es sp
00
00
00
00
00
00
00
00
00
00
0
13Ex
noch
rus s
p0
00
00
00
00
00
00
00
00
00
00
14La
mpy
rida
e sp
00
00
00
00
00
01
00
00
00
00
0
15Ps
ephe
nus s
p0
00
00
00
00
20
00
00
00
00
00
16Sc
ritid
ae sp
00
00
00
00
00
00
00
00
00
00
0
17Is
otom
idae
sp0
00
00
00
00
00
00
00
00
00
00
18C
arid
ina
sp0
10
03
370
384
00
00
10
4315
2517
00
19M
acro
brac
hium
die
nbie
nphu
ensi
s0
00
00
00
10
00
10
00
00
00
00
20M
acro
brac
hium
eri
oche
irum
00
00
00
00
00
00
00
00
00
00
0
21M
acro
brac
hium
lanc
hest
eri
52
10
011
08
202
00
01
00
00
00
0
22M
acro
brac
hium
mie
ni0
00
00
00
00
00
00
00
00
00
00
23M
acro
brac
hium
thai
20
00
00
00
10
00
00
00
00
00
0
24M
acro
brac
hium
yui
00
00
00
00
00
02
01
00
00
00
0
25Pa
rath
elph
usid
ae sp
00
00
00
00
30
00
00
01
00
00
0
26D
ecao
pda
unkn
own
00
00
00
00
00
00
00
00
00
10
0
27C
anac
eoid
es sp
00
00
00
00
00
00
00
00
00
00
0
28Be
zzia
sp0
00
00
00
00
10
10
02
00
00
00

Report on the 2006 biomonitoring survey of the lower Mekong River and selected tributaries
Page 98
No.
Ta
xon
Sam
plin
g si
tes
CPP
CK
LC
NL
CTU
CSN
CSK
CPT
CK
TC
MR
CSJ
CK
MC
SPC
SUV
SSV
SPV
VL
VTC
VLX
VC
LV
CT
VC
D
29C
ulic
oide
s sp
00
00
00
00
00
00
00
00
00
00
0
30D
asyh
elea
sp0
00
00
00
00
00
00
00
00
00
00
31Ab
labe
smyi
a sp
00
00
00
00
00
02
00
30
00
00
0
32C
hiro
nom
us sp
00
100
00
05
05
13
27
510
10
80
033
Rhap
hium
can
pest
re0
00
00
00
00
00
00
00
00
00
00
34Si
mul
ium
fene
stra
tum
00
00
00
00
022
01
00
00
00
00
035
Sim
uliu
m in
than
onen
se0
00
00
00
00
40
00
00
00
00
00
36Ta
bani
nae
sp0
00
00
00
00
10
00
00
00
00
00
37An
toch
a sp
00
00
00
00
00
03
02
00
00
00
038
Lim
noph
ila sp
00
00
00
00
00
02
01
00
00
00
039
Pedi
cia
sp0
00
00
00
00
00
20
00
00
00
00
40Ba
etie
lla sp
00
00
00
00
00
00
00
20
00
00
041
Baet
is sp
00
00
00
00
00
00
30
00
00
00
042
Cen
tropt
ilum
sp0
00
00
00
10
23
13
00
00
00
00
43C
loeo
n sp
00
00
00
03
00
00
00
00
01
00
044
Gra
tia n
arum
onae
00
00
00
00
00
00
00
00
00
00
045
Het
eroc
loeo
n sp
00
00
00
01
337
43
590
80
00
00
046
Plat
ybae
tis sp
00
00
00
00
03
00
010
280
00
00
047
Cae
nocu
lis sp
03
50
00
03
00
73
09
00
00
00
048
Cae
node
s sp
00
00
00
00
00
00
00
10
00
00
049
Epha
cere
lla c
omm
onde
ma
00
00
00
00
00
05
01
00
00
00
050
Eato
nige
nia
sp0
00
00
00
00
00
00
60
00
00
00
51Ep
hem
era
sp0
00
00
00
00
00
01
00
00
00
00
52C
inyg
min
a sp
00
00
00
00
09
51
00
20
00
00
053
Thal
eros
phyr
us sp
00
00
00
00
00
10
00
00
00
00
054
Ison
ychi
a sp
00
00
00
00
00
00
00
00
00
00
055
Cho
rote
rpes
sp0
00
00
00
20
81
200
51
00
00
00
56C
horo
terp
ides
sp0
00
00
00
00
80
531
50
00
00
00
57H
abro
phle
biod
es sp
00
00
00
00
00
00
00
00
00
00
058
Pota
man
thel
lus c
aeno
des
00
00
00
00
09
04
02
00
00
00
0

Page 99
Appendix 3. Littoral macroinvertebrate data
No.
Ta
xon
Sam
plin
g si
tes
CPP
CK
LC
NL
CTU
CSN
CSK
CPT
CK
TC
MR
CSJ
CK
MC
SPC
SUV
SSV
SPV
VL
VTC
VLX
VC
LV
CT
VC
D
59Po
tam
anth
ellu
s edm
unds
i0
00
00
00
00
00
00
00
00
00
00
60An
thop
otam
us sp
00
00
00
00
00
00
00
00
00
00
0
61Po
tam
anth
us sp
00
00
00
00
00
00
00
00
00
00
0
62Rh
oena
nthu
s sp
00
00
00
00
00
00
01
00
00
00
0
63Pr
osop
isto
ma
anna
mes
e0
00
00
00
00
50
01
00
00
00
00
64Pr
osop
isto
ma
sine
nsis
00
00
00
00
00
00
00
00
00
00
0
65Pr
osop
isto
ma
wou
tera
e0
00
00
00
00
00
00
00
00
00
00
66Ap
helo
chei
rus s
p0
00
00
00
00
00
00
00
00
00
00
67C
rypt
obat
es ja
poni
cus
00
00
00
00
00
00
00
00
00
00
0
68Li
mno
gonu
s sp
00
00
00
00
00
00
00
00
00
00
0
69N
aboa
ndel
us sp
00
00
00
00
00
00
00
00
00
00
0
70Pt
ilom
era
tigri
na0
00
00
00
00
00
00
04
00
00
00
71Rh
eum
atob
ates
sp0
00
00
00
00
00
01
00
00
00
00
72Ta
nago
gonu
s sp
00
00
00
00
00
10
00
10
00
00
0
73Tr
epob
ates
sp0
00
00
00
02
00
00
00
00
00
00
74Ve
ntid
ius s
p0
00
00
00
00
00
120
00
00
00
00
75H
ebru
s sp
00
00
00
00
00
00
00
00
00
00
0
76M
icro
nect
a sp
088
40
5313
04
60
50
700
1124
63
1555
3
77Li
mno
cori
s sp
00
00
00
00
00
00
00
10
00
00
0
78C
erco
tmet
us sp
00
00
00
00
00
00
00
00
00
00
0
79Ra
natr
a sp
00
00
00
00
00
00
00
00
00
00
0
80N
ychi
a su
ppho
00
00
00
00
00
00
00
00
00
00
0
81Pa
rapl
ea sp
00
00
00
00
00
00
10
00
00
00
0
82Ba
ptis
ta sp
00
00
00
00
00
00
00
00
00
00
0
83C
hene
velia
sp0
00
00
00
00
40
00
00
00
00
00
84M
icro
velia
sp0
00
00
00
00
00
00
00
00
00
00
85Rh
agov
elia
sp0
00
00
00
00
00
20
010
00
00
00
86Eu
phob
ia sp
00
00
00
00
00
00
00
00
00
00
0
87Pe
ltrop
hila
con
fusa
lis0
00
00
00
00
00
00
00
00
00
00

Report on the 2006 biomonitoring survey of the lower Mekong River and selected tributaries
Page 100
No.
Ta
xon
Sam
plin
g si
tes
CPP
CK
LC
NL
CTU
CSN
CSK
CPT
CK
TC
MR
CSJ
CK
MC
SPC
SUV
SSV
SPV
VL
VTC
VLX
VC
LV
CT
VC
D
88Pr
otoh
erm
es sp
00
00
00
00
00
00
00
00
00
00
0
89As
sim
inei
dae
sp0
112
00
00
018
00
00
00
00
00
00
90Bi
thyn
ia sp
00
00
00
03
00
00
00
00
00
00
0
91W
altte
bled
ia sp
00
00
00
00
00
00
00
00
00
00
0
92H
uben
dick
ia sp
00
00
00
00
00
00
00
00
00
00
0
93H
ydro
riss
oia
sp0
00
00
00
07
00
00
00
00
00
00
94Ju
llien
ia sp
00
00
00
00
40
10
00
00
00
00
0
95K
arel
iani
a sp
00
00
00
00
00
00
00
00
00
00
0
96La
cuno
psis
sp0
00
00
00
00
06
00
00
00
00
00
97N
eotr
icul
a sp
00
140
00
00
403
20
00
00
00
00
0
98Pa
chyd
robi
a br
evis
00
00
00
00
220
10
00
00
00
00
0
99Pa
rapr
osos
then
ia sp
00
80
00
02
00
00
00
00
00
00
0
100
Rehd
erie
lla sp
00
00
00
00
20
00
00
00
00
00
0
101
Pila
pes
mi
00
00
00
00
00
00
00
00
00
00
0
102
Pila
scut
ata
00
00
50
81
00
00
00
00
00
00
0
103
Sten
othy
ra sp
10
25
00
00
2533
70
30
00
00
00
00
104
Sten
othy
ra sp
20
00
00
00
50
00
00
00
00
00
00
105
Adem
ietta
hou
sei
00
01
00
00
00
00
00
00
00
00
0
106
Brot
ia sp
00
00
00
00
00
00
00
00
00
00
0
107
Unk
now
n0
00
00
00
00
00
00
00
00
00
00
108
Filo
palu
dina
mar
tens
i0
00
05
05
00
00
00
00
00
00
00
109
Filo
palu
dina
pol
ygra
mm
a0
00
00
01
00
00
00
00
00
00
00
110
Indi
opom
a sp
00
00
22
00
00
00
00
00
00
00
5
111
Mek
ongi
a sp
00
00
830
280
00
00
00
00
00
00
0
112
Sino
taia
sp0
00
00
03
00
00
00
00
00
00
00
113
Lim
nope
rna
sp0
03
00
00
00
00
00
00
00
01
00
114
Nem
atod
a0
00
00
00
00
10
00
00
00
00
00

Page 101
Appendix 3. Littoral macroinvertebrate data
No.
Ta
xon
Sam
plin
g si
tes
CPP
CK
LC
NL
CTU
CSN
CSK
CPT
CK
TC
MR
CSJ
CK
MC
SPC
SUV
SSV
SPV
VL
VTC
VLX
VC
LV
CT
VC
D
115
Cle
a he
lena
03
00
00
00
00
00
00
02
10
20
0
116
Amph
ipte
rygi
dae
sp0
00
00
00
00
00
30
00
00
00
00
117
Cal
opte
rygi
dae
sp0
00
00
00
00
00
00
00
00
00
00
118
Chl
oroc
yphy
nae
sp0
00
00
00
00
21
10
10
00
00
00
119
Cor
dulii
nae
sp0
00
00
00
00
00
20
00
00
00
00
120
Amph
ylla
will
iam
soni
00
00
00
20
00
00
00
00
00
00
0
121
Gom
phus
sp0
00
00
00
00
00
00
02
00
00
00
122
Oct
ogom
phus
sp0
00
00
00
00
00
40
30
00
00
00
123
Oph
iogo
mph
us sp
00
00
00
00
00
00
02
00
00
00
0
124
Prog
omph
us sp
00
00
00
01
00
00
00
00
00
00
0
125
Plat
hem
is sp
00
00
00
02
00
00
00
00
00
00
0
126
Prot
oneu
ra sp
010
00
00
03
02
00
00
00
01
00
0
127
Olig
ocha
eta
10
00
00
00
01
01
00
00
00
10
0
128
Pelto
perl
a sp
00
00
00
00
00
00
00
00
00
00
0
129
Neo
perl
a sp
00
00
00
00
00
02
010
00
00
00
0
130
Poly
chae
ta sp
10
00
20
00
00
00
00
00
00
00
00
131
Poly
chae
ta sp
20
00
00
00
00
00
00
00
00
00
00
132
Spha
erom
atid
a sp
00
00
00
00
00
00
00
00
01
40
0
133
Gan
onem
a ex
tens
um0
00
00
00
00
00
00
00
00
00
00
134
Dis
eudo
psis
sp0
00
00
00
00
00
00
00
00
00
00
135
Seud
oneu
recl
ipsi
s sp
00
00
00
00
00
00
00
00
00
00
0
136
Ecno
mus
sp0
00
00
00
00
00
00
00
00
00
00
137
Glo
soso
ma
sp0
00
00
00
00
00
00
00
00
00
00
138
Goe
ra sp
00
00
00
00
00
20
00
00
00
00
0
139
Amph
isyc
he sp
00
00
00
00
00
00
00
00
00
00
0
140
Hyd
rom
anic
us sp
00
00
00
00
00
022
00
00
00
00
0
141
Hyd
rops
yche
sp0
00
00
00
00
240
330
50
00
00
00

Report on the 2006 biomonitoring survey of the lower Mekong River and selected tributaries
Page 102
No.
Ta
xon
Sam
plin
g si
tes
CPP
CK
LC
NL
CTU
CSN
CSK
CPT
CK
TC
MR
CSJ
CK
MC
SPC
SUV
SSV
SPV
VL
VTC
VLX
VC
LV
CT
VC
D
142
Mac
rost
emum
sp0
00
00
00
00
410
280
10
00
00
00
143
Pseu
dole
pton
ema
sp0
00
00
00
00
00
00
00
00
00
00
144
Tric
hom
acro
nem
a sp
00
00
00
00
00
04
00
00
00
00
0
145
Hyd
ropt
ila sp
00
00
00
00
00
00
00
00
00
00
0
146
May
atri
chia
sp0
00
00
00
00
00
00
00
00
00
00
147
Ort
hotr
ichi
a sp
00
00
00
00
00
05
00
00
00
00
0
148
Cer
acle
a sp
00
00
00
00
00
02
00
00
00
00
0
149
Lept
ocer
us sp
00
00
00
00
00
01
00
00
00
00
0
150
Oce
tis sp
00
00
00
00
00
00
01
00
00
00
0
151
Sito
des s
p0
00
00
00
00
00
00
00
00
00
00
152
Tria
node
s sp
00
00
00
00
00
00
11
10
00
00
0
153
Cry
ptoc
hia
sp0
00
00
00
00
10
10
00
00
00
00
154
Pedo
moe
cus s
p0
00
00
00
00
00
00
00
00
00
00
155
Mol
anno
des s
p0
00
00
00
00
00
00
00
00
00
00
156
Chi
mar
ra sp
00
00
00
00
01
00
00
00
00
00
0
157
Dol
ophi
lode
s sp
00
00
00
00
00
00
00
00
00
00
0
158
Tino
des s
p0
00
00
00
00
01
00
00
00
00
00
159
Fatti
gia
sp0
00
00
00
00
00
00
00
00
00
00
160
Sten
opsy
che
siam
ensi
s0
00
00
00
00
00
00
00
00
00
00
161
Ensi
dens
inga
llsia
nus
08
00
60
00
00
00
00
00
00
00
0
162
Phys
unio
cam
bodi
ensi
s0
00
00
00
00
00
00
00
00
00
00
163
Phys
unio
exi
min
us0
00
00
00
00
00
00
00
00
00
00
164
Scab
ies c
risp
ata
00
60
00
60
00
10
00
00
00
00
0
165
Cor
bicu
la sp
01
213
70
20
02
019
32
21
00
40
0

Page 103
Appendix 3. Littoral macroinvertebrate data
Appendix 3.2. Littoral macroinvertebrates tolerance scores
Order Family Species Tolerance score
Total samples
Amphipoda Haustoridae Haustorus sp. 77 8
Arcoida Arcidae Scaphusa sp. 50 8
Basommatophora Planorbidae Indoplanorbis sp. 11 3
Coleoptera Psephenidae Acneus sp. 15 3
Coleoptera Salpingidae Aegialites sp. 40 2
Coleoptera Elmidae Ancyronyx sp. 24 3
Coleoptera Carbaidae Carbaidae sp. 13 1
Coleoptera Elmidae Cleptelmis sp. 13 32
Coleoptera Hydrophilidae Derallus sp. 52 2
Coleoptera Gyrinidae Dineutus sp. 7 2
Coleoptera Chrysomelidae Donacia sp. 25 3
Coleoptera Dytiscidae Dytiscidae sp. 63 1
Coleoptera Scirtidae Elodes sp. 13 2
Coleoptera Hydrophilidae Exnochrus sp. 40 3
Coleoptera Georyssidae Georyssus sp. 48 2
Coleoptera Gyrinidae Gyretes sp. 49 3
Coleoptera Gyrinidae Gyrinidae sp. 47 4
Coleoptera Haliplidae Haliplus sp. 56 1
Coleoptera Carbaidae Harpalus sp. 25 1
Coleoptera Hydrophilidae Helechares sp. 31 2
Coleoptera Heteroceridae Heteroceridae sp. 64 1
Coleoptera Elmidae Heterolimnius sp. 16 15
Coleoptera Hydrophilidae Hydrobius sp. 42 2
Coleoptera Hydrophilidae Hydrochara sp. 13 5
Coleoptera Hydropchidae Hydrochus sp. 0 2
Coleoptera Hydroscaphidae Hydroscapha sp. 32 2
Coleoptera Dytiscidae Hydrovatus sp. 25 1
Coleoptera Dytiscidae Laccophilus sp. 26 21
Coleoptera Lampyridae Lampyrinae sp. 11 10
Coleoptera Elmidae Lara sp. 32 4
Coleoptera Elmidae Macronychus sp. 34 13
Coleoptera Mysidae Neomysid sp. 84 1
Coleoptera Elmidae Optioservus sp. 13 1
Coleoptera Elmidae Ordobrevia sp. 47 3
Coleoptera Elmidae Oulimnius sp. 25 10
Coleoptera Hydrophilidae Paracymus sp. 30 2
Coleoptera Haliplidae Peltodytes sp. 26 3
Coleoptera Psephenidae Psephenus sp. 12 12
Coleoptera Dytiscidae Rhantus sp. 32 10
Coleoptera Scritidae Scritidae sp. 13 1
Coleoptera Staphilinidae Staphilinidae 47 1
Coleoptera Elmidae Stenelmis sp. 31 3

Report on the 2006 biomonitoring survey of the lower Mekong River and selected tributaries
Page 104
Order Family Species Tolerance score
Total samples
Coleoptera Staphilinidae Thinopinus sp. 56 2
Collembola Isotomidae Isotomidae sp. 65 1
Collembola Isotomidae Isotomurus tricolor 29 3
Decapoda Atyidae Caridina sp. 53 111
Decapoda Palaemonidae Macrobrachium dienbienphuensis 6 2
Decapoda Palaemonidae Macrobrachium eriocheirum 50 3
Decapoda Palaemonidae Macrobrachium hirsutimanus 26 1
Decapoda Palaemonidae Macrobrachium lanchesteri 35 18
Decapoda Palaemonidae Macrobrachium mieni 27 187
Decapoda Palaemonidae Macrobrachium pilimanus 20 18
Decapoda Palaemonidae Macrobrachium rosenbergii 31 20
Decapoda Palaemonidae Macrobrachium thai 77 3
Decapoda Palaemonidae Macrobrachium yui 32 6
Decapoda Parathelphusidae Parathelphusidae sp. 27 9
Decapoda Potamonidae Potamon sp. 13 20
Decapoda Unknown Unknown 59 2
Diptera Chironomidae Ablabesmyia sp. 30 45
Diptera Culicidae Anophelinae sp. 38 2
Diptera Tipulidae Antocha sp. 30 13
Diptera Athericidae Atherix sp. 42 8
Diptera Ceratopogonidae Bezzia sp. 37 46
Diptera Blephariceridae Blephariceridae sp. 56 1
Diptera Canacidae Canaceoides sp. 5 4
Diptera Chaoboridae Chaoborus sp. 53 4
Diptera Chironomidae Chironomus sp. 36 214
Diptera Culicidae Culicidae 11 6
Diptera Ceratopogonidae Culicoides sp. 51 7
Diptera Ceratopogonidae Dasyhelea sp. 37 4
Diptera Empididae Empidinae sp. 31 13
Diptera Tipulidae Limnophila sp. 28 32
Diptera Sciomyzidae Nanocladius sp. 22 7
Diptera Stratiomyidae Odontomyia sp. 0 1
Diptera Tipulidae Pedicia sp. 32 4
Diptera Tipulidae Pilaria sp. 63 3
Diptera Psychodidae Psychoda sp. 25 1
Diptera Dolichopodidae Rhaphium canpestre 65 1
Diptera Dolichopodidae Rhaphium sp. 32 1
Diptera Ceratopogonidae Sciomyzid sp. 14 1
Diptera Sciomyzidae Sepadon sp. 43 1
Diptera Simulidae Simulium fenestratum 16 12
Diptera Simulidae Simulium inthanonense 11 2
Diptera Tabanidae Tabaninae sp. 13 1
Diptera Tanyderidae Tanyderinae sp. 43 1
Diptera Chironomidae Thaumalea sp. 31 13
Diptera Tipulidae Tipula sp. 39 6
Ephemeroptera Ephemeridae Afromera siamensis 43 1

Page 105
Appendix 3. Littoral macroinvertebrate data
Order Family Species Tolerance score
Total samples
Ephemeroptera Potamanthidae Anthopotamus sp. 50 1
Ephemeroptera Anthropleidae Arthroplea sp. 14 1
Ephemeroptera Heptageniidae Asionurus sp. 19 15
Ephemeroptera Baetidae Baetiella sp. 26 62
Ephemeroptera Baetidae Baetis sp. 32 98
Ephemeroptera Caenidea Caenis sp. 44 21
Ephemeroptera Caenidea Caenoculis sp. 32 87
Ephemeroptera Caenidea Caenodes sp. 25 41
Ephemeroptera Baetidae Centroptilum sp. 26 85
Ephemeroptera Caenidae Cercobrachys sp. 35 3
Ephemeroptera Leptophlebiidae Choroterpes sp. 22 89
Ephemeroptera Leptophlebiidae Choroterpides 21 55
Ephemeroptera Heptageniidae Cinygmina sp. 25 93
Ephemeroptera Baetidae Cloeon sp. 34 48
Ephemeroptera Ephemerellidae Crinitella sp. 15 11
Ephemeroptera Ephemeridae Eatonigenia sp. 43 7
Ephemeroptera Ephemerellidae Ephacerella commodema 24 18
Ephemeroptera Ephemeridae Ephemera sp. 26 36
Ephemeroptera Baetidae Gratia narumonae 41 10
Ephemeroptera Leptophlebiidae Habrophlebiodes sp. 13 1
Ephemeroptera Baetidae Heterocloeon sp. 23 44
Ephemeroptera Isonycheiridae Isonycheirus sp. 20 9
Ephemeroptera Isonychidae Isonychia sp. 50 2
Ephemeroptera Heptageniidae Leucrocuta sp. 14 3
Ephemeroptera Palingeniidae Palingenea sp. 43 1
Ephemeroptera Baetidae Platybaetis sp. 35 85
Ephemeroptera Neoephmeridae Potamanthellus caenodes 19 30
Ephemeroptera Neoephemeridae Potamanthellus edmundsi 18 17
Ephemeroptera Neoephmeridae Potamanthus formosus 0 2
Ephemeroptera Potamanthidae Potamanthus sp. 21 12
Ephemeroptera Prosopistomatidae Prosopistoma annamense 21 29
Ephemeroptera Prosopistomatidae Prosopistoma sinensis 13 2
Ephemeroptera Prosopistomatidae Prosopistoma wouterae 9 2
Ephemeroptera Potamanthidae Rhoenanthus obscurus 14 8
Ephemeroptera Potamanthidae Rhoenanthus sp. 50 2
Ephemeroptera Teloganosidae Teloganodes sp. 15 7
Ephemeroptera Heptageniidae Thalerosp.hyrus sp. 20 18
Ephemeroptera Epemerellidae Uracanthella sp. 17 13
Hemiptera Notonectidae Anisops sp. 49 6
Hemiptera Aphelocheiridae Aphelocheirus sp. 18 20
Hemiptera Notonectidae Aphelonecta sp. 41 2
Hemiptera Veliidae Baptista sp. 5 2
Hemiptera Belostomatidae Belostoma sp. 47 1
Hemiptera Nepidae Cercometus sp. 51 4
Hemiptera Veliidae Chenevelia stridulans 31 4
Hemiptera Gerridae Cryptobates japonicus 12 14

Report on the 2006 biomonitoring survey of the lower Mekong River and selected tributaries
Page 106
Order Family Species Tolerance score
Total samples
Hemiptera Gerridae Cryptobates sp. 26 3
Hemiptera Hebridae Hebrus sp. 35 2
Hemiptera Platycnemidae Heleocoris sp. 0 1
Hemiptera Nepidae Laccotrephes sp. 43 1
Hemiptera Naucoridae Limnocoris sp. 50 1
Hemiptera Gerridae Limnogonus sp. 20 2
Hemiptera Macroveliidae Macrovelia sp. 36 2
Hemiptera Mesoveliidae Mesovelia sp. 33 9
Hemiptera Gerridae Metrocoris sp. 19 8
Hemiptera Micronectidae Micronecta sp. 42 207
Hemiptera Veliidae Microvelia sp. 65 1
Hemiptera Gerridae Naboandelus sp. 72 1
Hemiptera Naucoridae Naucoris scutellaris 19 9
Hemiptera Gerridae Noegerris parvurus 32 22
Hemiptera Notonectidae Nychia suppho 35 9
Hemiptera Pleidae Paraplea sp. 21 7
Hemiptera Veliidae Perittopus sp. 36 1
Hemiptera Pleidae Plea sp. 28 8
Hemiptera Gerridae Ptilomera tigrina 14 16
Hemiptera Nepidae Ranatra sp. 36 9
Hemiptera Veliidae Rhagovelia sp. 14 18
Hemiptera Gerridae Rheumatobates sp. 50 1
Hemiptera Gerridae Rheumatogonus intermedius 12 6
Hemiptera Saldidae Saldidae sp. 43 1
Hemiptera Corixidae Sigara sp. 32 8
Hemiptera Naucoridae Stenicoris sp. 13 1
Hemiptera Veliidae Strongyvelia sp. 13 2
Hemiptera Gerridae Tanagogonus sp. 8 2
Hemiptera Gerridae Tenagogonus sp. 0 1
Hemiptera Gerridae Tinaggonus sp. 25 3
Hemiptera Gerridae Trepobates sp. 33 3
Hemiptera Veliidae Trochopus sp. 56 1
Hemiptera Gerridae Ventidius sp. 28 25
Hymenoptera Trichogrammatidae Hydrophilita aquivolans 47 1
Isopoda Sp.haeromatidae Sp.haeromatid sp. 42 33
Lepidoptera Noctuidae Archanara sp. 0 1
Lepidoptera Grambidae Elophila sp. 25 1
Lepidoptera Crambidae Euphobia sp. 50 1
Lepidoptera Pyralidae Peltrophila confusalis 28 2
Lepidoptera Pyralidae Petrophila sp. 25 4
Lepidoptera Cossidae Prionoxystus sp. 45 2
Megaloptera Corydalidae Corydalus sp. 6 3
Megaloptera Corydalidae Protohermes sp. 28 2
Mesogastropoda Thiaridae Ademietta housei 52 3
Mesogastropoda Assimineidae Assimineidae 37 9
Mesogastropoda Bithyniidae Bithynia sp. 27 64
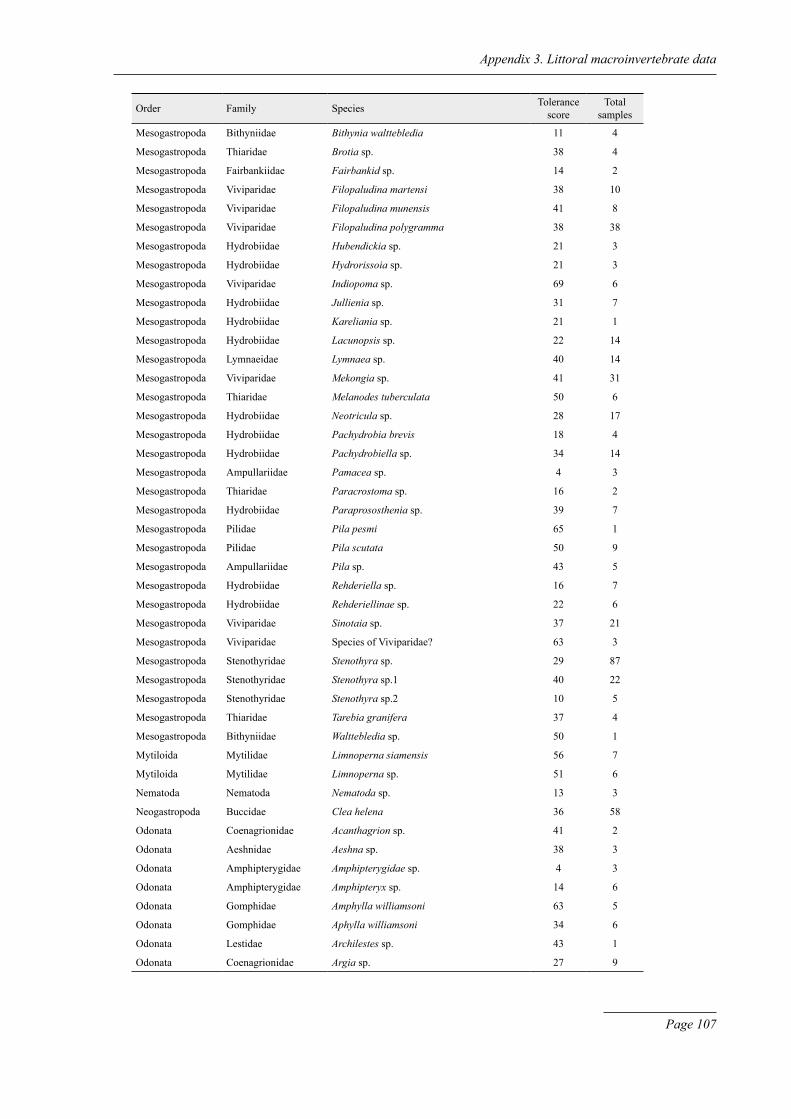
Page 107
Appendix 3. Littoral macroinvertebrate data
Order Family Species Tolerance score
Total samples
Mesogastropoda Bithyniidae Bithynia walttebledia 11 4
Mesogastropoda Thiaridae Brotia sp. 38 4
Mesogastropoda Fairbankiidae Fairbankid sp. 14 2
Mesogastropoda Viviparidae Filopaludina martensi 38 10
Mesogastropoda Viviparidae Filopaludina munensis 41 8
Mesogastropoda Viviparidae Filopaludina polygramma 38 38
Mesogastropoda Hydrobiidae Hubendickia sp. 21 3
Mesogastropoda Hydrobiidae Hydrorissoia sp. 21 3
Mesogastropoda Viviparidae Indiopoma sp. 69 6
Mesogastropoda Hydrobiidae Jullienia sp. 31 7
Mesogastropoda Hydrobiidae Kareliania sp. 21 1
Mesogastropoda Hydrobiidae Lacunopsis sp. 22 14
Mesogastropoda Lymnaeidae Lymnaea sp. 40 14
Mesogastropoda Viviparidae Mekongia sp. 41 31
Mesogastropoda Thiaridae Melanodes tuberculata 50 6
Mesogastropoda Hydrobiidae Neotricula sp. 28 17
Mesogastropoda Hydrobiidae Pachydrobia brevis 18 4
Mesogastropoda Hydrobiidae Pachydrobiella sp. 34 14
Mesogastropoda Ampullariidae Pamacea sp. 4 3
Mesogastropoda Thiaridae Paracrostoma sp. 16 2
Mesogastropoda Hydrobiidae Paraprososthenia sp. 39 7
Mesogastropoda Pilidae Pila pesmi 65 1
Mesogastropoda Pilidae Pila scutata 50 9
Mesogastropoda Ampullariidae Pila sp. 43 5
Mesogastropoda Hydrobiidae Rehderiella sp. 16 7
Mesogastropoda Hydrobiidae Rehderiellinae sp. 22 6
Mesogastropoda Viviparidae Sinotaia sp. 37 21
Mesogastropoda Viviparidae Species of Viviparidae? 63 3
Mesogastropoda Stenothyridae Stenothyra sp. 29 87
Mesogastropoda Stenothyridae Stenothyra sp.1 40 22
Mesogastropoda Stenothyridae Stenothyra sp.2 10 5
Mesogastropoda Thiaridae Tarebia granifera 37 4
Mesogastropoda Bithyniidae Walttebledia sp. 50 1
Mytiloida Mytilidae Limnoperna siamensis 56 7
Mytiloida Mytilidae Limnoperna sp. 51 6
Nematoda Nematoda Nematoda sp. 13 3
Neogastropoda Buccidae Clea helena 36 58
Odonata Coenagrionidae Acanthagrion sp. 41 2
Odonata Aeshnidae Aeshna sp. 38 3
Odonata Amphipterygidae Amphipterygidae sp. 4 3
Odonata Amphipterygidae Amphipteryx sp. 14 6
Odonata Gomphidae Amphylla williamsoni 63 5
Odonata Gomphidae Aphylla williamsoni 34 6
Odonata Lestidae Archilestes sp. 43 1
Odonata Coenagrionidae Argia sp. 27 9

Report on the 2006 biomonitoring survey of the lower Mekong River and selected tributaries
Page 108
Order Family Species Tolerance score
Total samples
Odonata Libellulidae Brechmorhoga sp. 56 1
Odonata Calopterygidae Calopterygidae sp. 50 1
Odonata Calopterygidae Calopteryx maculata 17 4
Odonata Chlorocyphidae Chlorocyphidae sp. 31 8
Odonata Corduliidae Corduliinae sp. 30 9
Odonata Gomphidae Dromogomphus sp. 19 20
Odonata Coenagrionidae Enallagma civile 28 5
Odonata Libellulidae Epicordulia princeps 25 1
Odonata Gomphidae Erpetogomphus sp. 3 6
Odonata Euphaeidae Euphaeidae sp. 36 9
Odonata Gomphidae Gomphus sp. 41 4
Odonata Aeshnidae Gynacantha sp. 14 3
Odonata Gomphidae Hagenius brevistylus 14 1
Odonata Calopterygidae Hetaerina titia 0 2
Odonata Libellulidae Macrothemis 27 9
Odonata Gomphidae Meglogomphus sp. 84 1
Odonata Gomphidae Octogomphus sp. 19 28
Odonata Gomphidae Ophiogomphus sp. 35 40
Odonata Libellulidae Plathemis sp. 24 62
Odonata Platycnemidae Platycnemidae sp. 56 1
Odonata Gomphidae Progomphus sp. 20 16
Odonata Protoneuridae Protoneura sp. 39 44
Odonata Gomphidae Stylogomphus albistylus 19 1
Odonata Aeshnidae Triacanthagyna trifida 14 3
Oligochaeta Oligochaeta Oligochaeta sp. 40 60
Plecoptera Peltoperidae Crytoperla sp. 13 7
Plecoptera Peridae Eccoptura xanthenes 23 19
Plecoptera Perlidae Etrocorema sp. 16 35
Plecoptera Neoperidae Neoperla sp. 23 33
Plecoptera Peltoperidae Peltoperla sp. 24 2
Plecoptera Perlidae Phanoperla sp. 0 3
Polychaeta Polychaeta Polychaeta sp.1 65 23
Polychaeta Polychaeta Polychaeta sp.2 38 1
Trichoptera Hydroptilidae Agraylea sp. 18 3
Trichoptera Hydropsychidae Amphisyche sp. 5 1
Trichoptera Calamoceridae Anisocentropus brevi 38 4
Trichoptera Hydropsychidae Arctopsyche sp. 9 6
Trichoptera Leptoceridae Ceraclea sp. 8 3
Trichoptera Philopotamidae Chimarra sp. 28 25
Trichoptera Limnephilidae Cryptochia sp. 24 5
Trichoptera Diseudopsidae Diseudopsis sp. 8 2
Trichoptera Philopotamidae Dolophilodes sp. 52 7
Trichoptera Ecnomidae Ecnomus sp. 5 1
Trichoptera Branchycentridae Eobrachycentrus sp. 36 2
Trichoptera Sericostomatidae Fattigia 21 6
Trichoptera Calamoceridae Ganonema extensum 41 5

Page 109
Appendix 3. Littoral macroinvertebrate data
Order Family Species Tolerance score
Total samples
Trichoptera Glososomatidae Glososoma sp. 9 2
Trichoptera Goeridae Goera sp. 22 5
Trichoptera Limnephilidae Goerita sp. 29 17
Trichoptera Helichopsychidae Helichopsyche sp. 0 2
Trichoptera Calamoceridae Heteroplecton sp. 56 2
Trichoptera Hydropsychidae Hydatonicus sp. 6 4
Trichoptera Hydropsychidae Hydromanicus sp. 24 5
Trichoptera Hydropsychidae Hydropsyche bettni 21 4
Trichoptera Hydropsychidae Hydropsyche sp. 21 38
Trichoptera Hydroptilidae Hydroptila sp. 19 8
Trichoptera Hydroptilidae Ithytrichia sp. 25 1
Trichoptera Leptoceridae Leptocerus sp. 21 16
Trichoptera Limnephilidae Limnephilus 27 2
Trichoptera Hydropsychidae Macrostemum sp. 13 26
Trichoptera Limnephilidae Madeophylax sp. 35 3
Trichoptera Hydroptilidae Mayatrichia sp. 10 1
Trichoptera Branchycentridae Micrasema sp. 24 13
Trichoptera Molannidae Molannodes sp. 8 2
Trichoptera Limnephilidae Moselyana comosa 13 2
Trichoptera Polycentropodidae Neureclipsis sp. 33 10
Trichoptera Polycentropodidae Nyctiophylax sp. 53 5
Trichoptera Leptoceridae Ocetis sp. 18 3
Trichoptera Leptoceridae Oecetis sp. 23 9
Trichoptera Helichopsychidae Orthotrichia sp. 23 16
Trichoptera Limnephilidae Pedomoecus sp. 37 3
Trichoptera Peltoperidae Peltoperlopsis sp. 24 3
Trichoptera Polycentropodidae Polycentropus sp. 24 9
Trichoptera Hydropsychidae Polymorphanisus sp. 11 6
Trichoptera Odontoceridae Pseudogoera sp. 25 1
Trichoptera Hydropsychidae Pseudoleptonema sp. 6 3
Trichoptera Diseudopsidae Pseudoneureclipsis sp. 20 5
Trichoptera Limnephilidae Pseudostenophylax sp. 13 7
Trichoptera Phryganeidae Ptilostomis sp. 56 2
Trichoptera Rhyacophilidae Rhyacophila sp. 6 1
Trichoptera Sericostomatidae Sericostoma sp. 25 2
Trichoptera Leptoceridae Setodes sp. 21 11
Trichoptera Diseudopsidae Seudoneureclipsis sp. 7 6
Trichoptera Leptoceridae Sitodes sp. 10 1
Trichoptera Stenopsychidae Stenopsyche siamensis 50 1
Trichoptera Psychomyiidae Tinodes sp. 5 1
Trichoptera Leptoceridae Triaenodes sp. 35 3
Trichoptera Hydropsychidae Trichomacronema sp. 6 2
Trichoptera Philopotamidae Wormaldia sp. 0 1
Unioroida Amblemidae Ensidens ingallsianus 56 7
Unioroida Amblemidae Ensidens sp. 29 5
Unioroida Amblemidae Physunio cambodiensis 59 1

Report on the 2006 biomonitoring survey of the lower Mekong River and selected tributaries
Page 110
Order Family Species Tolerance score
Total samples
Unioroida Amblemidae Physunio eximinus 59 1
Unioroida Amblemidae Physunio sp. 13 1
Unioroida Amblemidae Pilsbryoconcha exilis 6 1
Unioroida Amblemidae Scabies crispata 61 8
Unioroida Amblemidae Scabies sp. 41 19
Veneroida Corbiculidae Corbicula sp. 45 46

Page 111
Appendix 3. Littoral macroinvertebrate data
Appendix 3.3. Littoral macroinvertebrates metrics
No. Year Site Site disturbance
score
Species richness
Abundance Species diversity
index
Dominance index
Littoral sweep ATSPT values
1 2004 LNO 1.00 42 2390 0.867 0.207 27
2 2004 LPB 1.28 14 670 0.473 0.724 29
3 2004 LVT 1.78 15 151 0.779 0.384 35
4 2004 LNG 1.50 27 1975 0.744 0.433 35
5 2004 LKD 1.43 25 442 1.099 0.204 34
6 2004 LPS 1.57 13 880 0.527 0.661 33
7 2004 TMU 1.71 15 301 0.721 0.372 39
8 2004 TCH 1.86 28 170 1.152 0.176 35
9 2004 TSK 2.13 26 1105 0.270 0.890 38
10 2004 TKO 1.88 16 117 0.738 0.470 29
11 2004 CPP 2.88 7 36 0.827 0.194 40
12 2004 CTU 2.13 24 369 0.801 0.444 41
13 2004 CPS 2.22 53 1807 0.845 0.334 29
14 2004 CSS 1.75 10 43 0.826 0.256 45
15 2004 CSP 1.25 39 695 1.016 0.414 33
16 2004 CKT 1.25 35 988 0.834 0.383 32
17 2004 VTC 2.50 54 894 1.210 0.282 47
18 2004 VCD 2.69 19 119 0.935 0.378 37
19 2004 VSS 2.29 17 454 0.597 0.553 44
20 2004 VSP 1.29 17 9759 0.161 0.924 27
21 2005 LOU 1.00 18 1176 2.929 0.209 34
22 2005 LPB 1.69 59 811 1.725 0.342 20
23 2005 LNK 1.38 46 7614 1.169 0.508 29
24 2005 LMH 1.94 22 108 2.072 0.306 34
25 2005 LMX 1.94 27 217 2.077 0.406 36
26 2005 TMI 2.25 52 1650 1.701 0.468 35
27 2005 TMC 1.64 62 855 1.893 0.295 32
28 2005 TKO 1.86 22 708 1.591 0.435 34
29 2005 LKU 1.13 23 1638 2.773 0.245 29
30 2005 LKL 1.50 36 1587 3.300 0.101 31
31 2005 CMR 1.75 12 1656 1.951 0.281 36
32 2005 CSJ 1.50 57 1283 2.857 0.175 31
33 2005 CKM 1.50 63 1096 3.124 0.177 32
34 2005 CSU 2.13 89 894 2.671 0.449 34
35 2005 CSS 1.75 66 632 3.137 0.222 34
36 2005 CSP 1.13 73 2317 3.428 0.143 28
37 2006 CPP 2.89 7 55 1.299 0.545 46
38 2006 CBS 2.19 24 817 1.443 0.671 42
39 2006 CNL 1.97 18 828 2.211 0.314 38
40 2006 CTU 2.04 12 50 2.001 0.380 45
41 2006 CSN 2.00 15 627 1.336 0.636 45
42 2006 CSK 2.00 9 461 1.093 0.557 47

Report on the 2006 biomonitoring survey of the lower Mekong River and selected tributaries
Page 112
No. Year Site Site disturbance
score
Species richness
Abundance Species diversity
index
Dominance index
Littoral sweep ATSPT values
43 2006 CPT 2.33 19 231 2.313 0.255 45
44 2006 CKT 1.14 37 795 2.302 0.367 31
45 2006 CMR 1.42 28 2062 2.198 0.373 32
46 2006 CSJ 1.25 59 705 3.162 0.133 28
47 2006 CKM 1.19 53 465 3.268 0.123 32
48 2006 CSP 1.11 73 1157 3.238 0.160 27
49 2006 CSU 1.75 66 1149 1.186 0.480 28
50 2006 VSS 2.00 53 564 2.843 0.289 34
51 2006 VSR 2.00 48 690 2.269 0.284 31
52 2006 VTR 2.44 16 269 1.700 0.353 47
53 2006 VCT 2.64 8 121 0.978 0.694 46
54 2006 VLX 2.69 14 148 0.959 0.797 47
55 2006 VCL 1.91 15 196 1.741 0.418 44
56 2006 VTC 2.28 3 114 0.240 0.947 50
57 2006 VCD 2.31 16 75 1.607 0.587 52

Page 113
Appendix 4.1. Benthic macroinvertebrates species list and abundance
No.
Taxo
nSa
mpl
ing
site
s
CPP
CB
SC
NL
CTU
CSN
CSK
CPT
CK
TC
MR
CSJ
CK
MC
SPC
SUV
SSV
SRV
TRV
CT
VLX
VC
LV
TCV
CD
Ph
ylum
Ann
elid
a
C
lass
Pol
ycha
eta
O
rder
Nev
eim
orph
a
Fa
mily
Nep
hthy
dida
e
1N
epht
hys p
olyb
ranc
hia
(Sou
ther
n)
19
Fa
mily
Ner
eida
e
2N
amal
ycas
tis a
bium
a M
ulle
r
18
30
3N
eant
hes c
auda
ta (D
elle
Chi
aje)
4
O
rder
Spi
omor
pha
Fa
mily
Aric
iidae
4Sc
olop
los s
p.
2
Fa
mily
Spi
onid
ae
5Pr
iono
spio
sp.
19
6Po
lydo
ra sp
.
3
C
lass
Olig
ocha
eta
Fa
mily
Nai
dida
e
7G
enus
sp.
7
16
7
10
41
Fa
mily
Tub
ifici
dae
8Li
mno
drilu
s hof
fmei
ster
i C
lapa
rede
182
617
325
277
54
56
2181
2726
6
9Br
anch
iura
sow
erby
i Bed
dard
1519
1957
51
36
12
2
118
219
193
33
Ph
ylum
Mol
lusc
a
C
lass
Gas
tropo
da
O
rder
A
RC
HA
EOG
AST
RO
POD
A
Fa
mily
Ner
itida
e
10N
eriti
na ru
bida
(Pea
se)
5
O
rder
Mes
ogas
tropo
da
Fa
mily
Ste
noth
yiid
ae

Report on the 2006 biomonitoring survey of the lower Mekong River and selected tributaries
Page 114
No.
Taxo
nSa
mpl
ing
site
s
CPP
CB
SC
NL
CTU
CSN
CSK
CPT
CK
TC
MR
CSJ
CK
MC
SPC
SUV
SSV
SRV
TRV
CT
VLX
VC
LV
TCV
CD
11St
enot
hyra
mcm
ulle
ni B
rand
t2
1
6
12St
enot
hyra
kor
aten
sis h
olos
culp
ta
Bra
ndt
211
4
13
10
9
2
13St
enot
hyra
kor
aten
sis k
orat
ensi
s B
rand
t1
14St
enot
hyra
sp.
2
Fa
mily
Hyd
robi
idae
15Pa
chyd
robi
a sp
.
1
2
4
18
16H
uben
dick
ia c
rook
i Bra
ndt
175
17H
uben
dick
ia sp
.
1
18H
ydro
riss
oia
sp.
12
19Pa
rapr
osos
thni
a sp
.
75
20Ju
llien
ia a
cuta
Poi
rier
6
Fa
mily
Viv
ipar
idae
21Fi
lopa
ludi
an (F
ilopa
ludi
na) fi
losa
(R
eeve
)1
3
4
22Fi
lopa
ludi
na (F
ilopa
ludi
na)
dolia
ris (
Gou
ld)
1
1
23M
ekon
gia
swai
nson
i bre
ueri
(K
obel
t)
3
24M
ekon
gia
swai
nson
i flav
ida
n.
subs
p.
7
43
Fa
mily
Byt
hini
idae
25Bi
thyn
ia sp
.
3
6
60
1
3
6
26W
atte
bled
ia si
amen
sis
(Moe
llend
orff)
1
Fa
mily
Flu
min
icol
idae
27G
enus
sp.
2
3
Fa
mily
Thi
arid
ae
28Se
rmyl
a to
rnat
ella
(Lea
)1
5
52
41
10
4
29M
elan
oide
s tub
ercu
latu
s (M
ulle
r)
1
2
1

Page 115
Appendix 4. Benthic macroinvertebrate data
No.
Taxo
nSa
mpl
ing
site
s
CPP
CB
SC
NL
CTU
CSN
CSK
CPT
CK
TC
MR
CSJ
CK
MC
SPC
SUV
SSV
SRV
TRV
CT
VLX
VC
LV
TCV
CD
Fa
mily
Ass
imin
eida
e
30C
yclo
tropi
s sp.
40
C
lass
Biv
alvi
a
O
rder
Arc
oida
Fa
mily
Arc
idae
31Sc
aphu
la p
inna
Ben
son
1
2
O
rder
Myt
iloid
a
Fa
mily
Myt
ilida
e
32Li
mno
pern
a si
amen
sis (
Mor
elet
)
39
8
3
610
2
O
rder
Ven
eroi
da
Fa
mily
Dre
isse
nida
e
33Si
nom
ytilu
s har
man
di
(Roc
hebr
une)
242
119
22
115
21
Fa
mily
Cor
bicu
lidae
34C
orbi
cula
lam
arck
iana
Prim
e
2
35C
orbi
cula
levi
uscu
la P
rime
41
1
36C
orbi
cula
tenu
is C
less
in5
268
406
11
105
1
69
30
354
356
1314
2
37C
orbi
cula
bau
doni
Mor
let
27
1
1
9
1
38C
orbi
cula
mor
etel
iana
Prim
e
11
2
2
39C
orbi
cula
cyr
enifo
rmis
Prim
e
17
38
1
21
40C
orbi
cula
bla
ndia
na P
rime
121
2
6
1
85
O
rder
Uni
onoi
da
Fa
mily
Am
blem
idae
41En
side
ns in
galls
ianu
s in
galls
ianu
s (Le
a)
33
11
42Ps
eudo
don
vond
embu
schi
anus
el
liptic
us (C
onra
d)
2
43Ps
eudo
don
inos
cula
ris c
umin
gi
(Lea
)
1
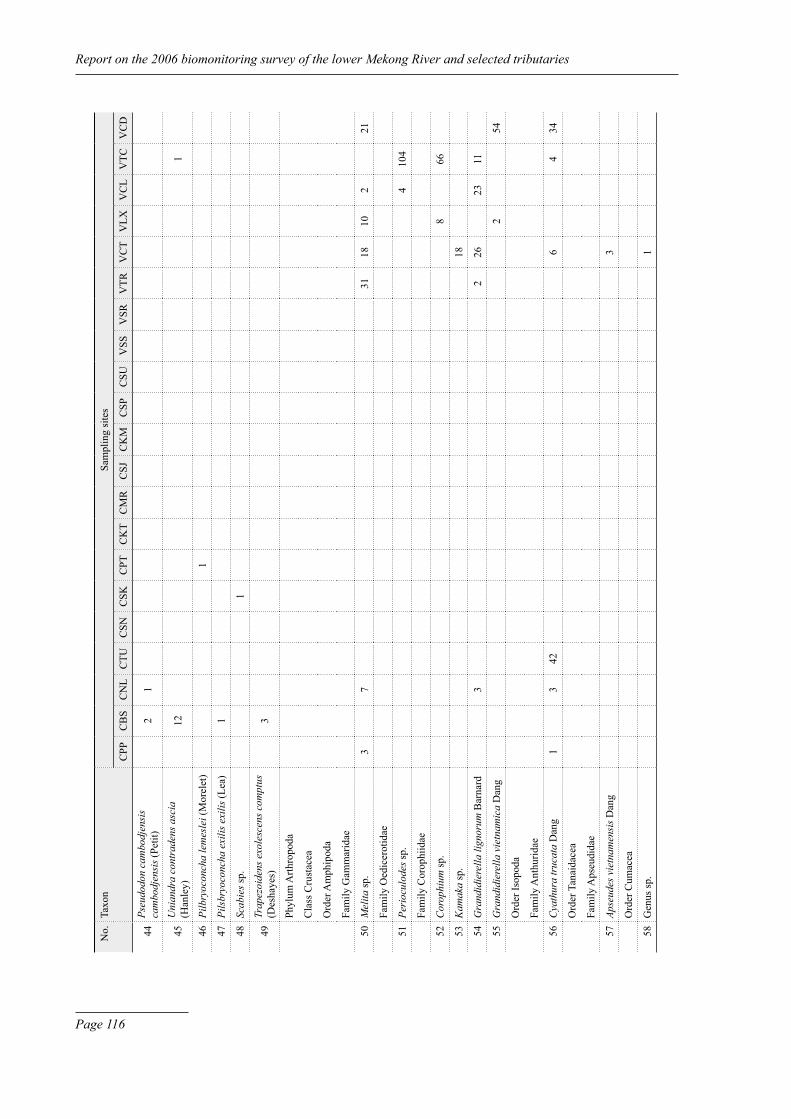
Report on the 2006 biomonitoring survey of the lower Mekong River and selected tributaries
Page 116
No.
Taxo
nSa
mpl
ing
site
s
CPP
CB
SC
NL
CTU
CSN
CSK
CPT
CK
TC
MR
CSJ
CK
MC
SPC
SUV
SSV
SRV
TRV
CT
VLX
VC
LV
TCV
CD
44Ps
eudo
don
cam
bodj
ensi
s ca
mbo
djen
sis (
Petit
)
21
45U
nian
dra
cont
rade
ns a
scia
(H
anle
y)
12
1
46Pi
lbry
ocon
cha
lem
esle
i (M
orel
et)
1
47Pi
lsbr
yoco
ncha
exi
lis e
xilis
(Lea
)
1
48Sc
abie
s sp.
1
49Tr
apez
oide
ns e
xole
scen
s com
ptus
(D
esha
yes)
3
Ph
ylum
Arth
ropo
da
C
lass
Cru
stac
ea
O
rder
Am
phip
oda
Fa
mily
Gam
mar
idae
50M
elita
sp.
3
7
31
1810
2
21
Fa
mily
Oed
icer
otid
ae
51Pe
rioc
ulod
es sp
.
4
104
Fa
mily
Cor
ophi
idae
52C
orop
hium
sp.
8
66
53K
amak
a sp
.
18
54G
rand
idie
rella
lign
orum
Bar
nard
3
2
26
2311
55G
rand
idie
rella
vie
tnam
ica
Dan
g
2
54
O
rder
Isop
oda
Fa
mily
Ant
hurid
ae
56C
yath
ura
truc
ata
Dan
g1
3
42
6
434
O
rder
Tan
aida
cea
Fa
mily
Aps
eudi
dae
57Ap
seud
es v
ietn
amen
sis D
ang
3
O
rder
Cum
acea
58G
enus
sp.
1

Page 117
Appendix 4. Benthic macroinvertebrate data
No.
Taxo
nSa
mpl
ing
site
s
CPP
CB
SC
NL
CTU
CSN
CSK
CPT
CK
TC
MR
CSJ
CK
MC
SPC
SUV
SSV
SRV
TRV
CT
VLX
VC
LV
TCV
CD
O
rder
Dec
apod
a
Fa
mily
Pal
aem
onid
ae
59M
acro
brac
hium
pili
man
us (D
e M
an)
1
1
Fa
mily
Alp
heid
ae
60Al
pheu
s bis
inci
sus (
De
Man
)
1
C
lass
Inse
cta
O
rder
Eph
emer
opte
ra
Fa
mily
Bae
tidae
61Ba
etis
sp.
1
Fa
mily
Cae
nida
e
62C
aeni
s sp.
13
151
6
2
Fa
mily
Lep
topl
ebiid
ae
63Le
ptop
hleb
ia sp
.
1
64Tr
aver
ella
sp.
2
65C
horo
terp
es sp
.
2
Fa
mily
Eph
emer
idae
66Ep
hem
era
sp.
1
67Ea
toni
geni
a sp
.
74
Fa
mily
Pal
inge
niid
ae
68Pe
ntag
enia
sp.
182
10
3
2
O
rder
Ple
copt
era
Fa
mily
Per
lidae
69Pe
rla
sp.
1
O
rder
Odo
nata
Fa
mily
Gom
phid
ae
70D
rom
ogom
phus
sp.
2
3
2
3
3
1
71O
ctog
omph
us sp
.
2
72Ap
hylla
sp.
1
1

Report on the 2006 biomonitoring survey of the lower Mekong River and selected tributaries
Page 118
No.
Taxo
nSa
mpl
ing
site
s
CPP
CB
SC
NL
CTU
CSN
CSK
CPT
CK
TC
MR
CSJ
CK
MC
SPC
SUV
SSV
SRV
TRV
CT
VLX
VC
LV
TCV
CD
Fa
mily
Lib
ellu
lidae
73Li
bellu
la sp
.
1
O
rder
Hem
ipte
ra
Fa
mily
Nau
corid
ae
74N
auco
ris s
p.
2
O
rder
Col
eopt
era
Fa
mily
Elm
idae
75G
enus
sp.
3
5
4
3
Fa
mily
Dyt
isci
dae
76G
enus
sp.
1
O
rder
Tric
hopt
era
Fa
mily
Rhy
acop
hilid
ae
77Rh
yaco
phila
sp.
2
Fa
mily
Ecn
omid
ae
78Ec
onom
us sp
.
2
2
Fa
mily
Phi
lopo
tam
idae
79G
enus
sp.
114
2943
22
51
2
79
2
8
O
rder
Lep
idop
tera
Fa
mily
Cra
mbi
dae
80G
enus
sp.
1
O
rder
Dip
tera
Fa
mily
Hel
eida
e
81C
ulic
oide
s sp.
53
22
2
Fa
mily
Cul
icid
ae
82C
haob
orus
sp.
22
Fa
mily
Lim
oniid
ae
83Er
ioce
ra sp
.
21
84Pe
dici
a sp
.
2
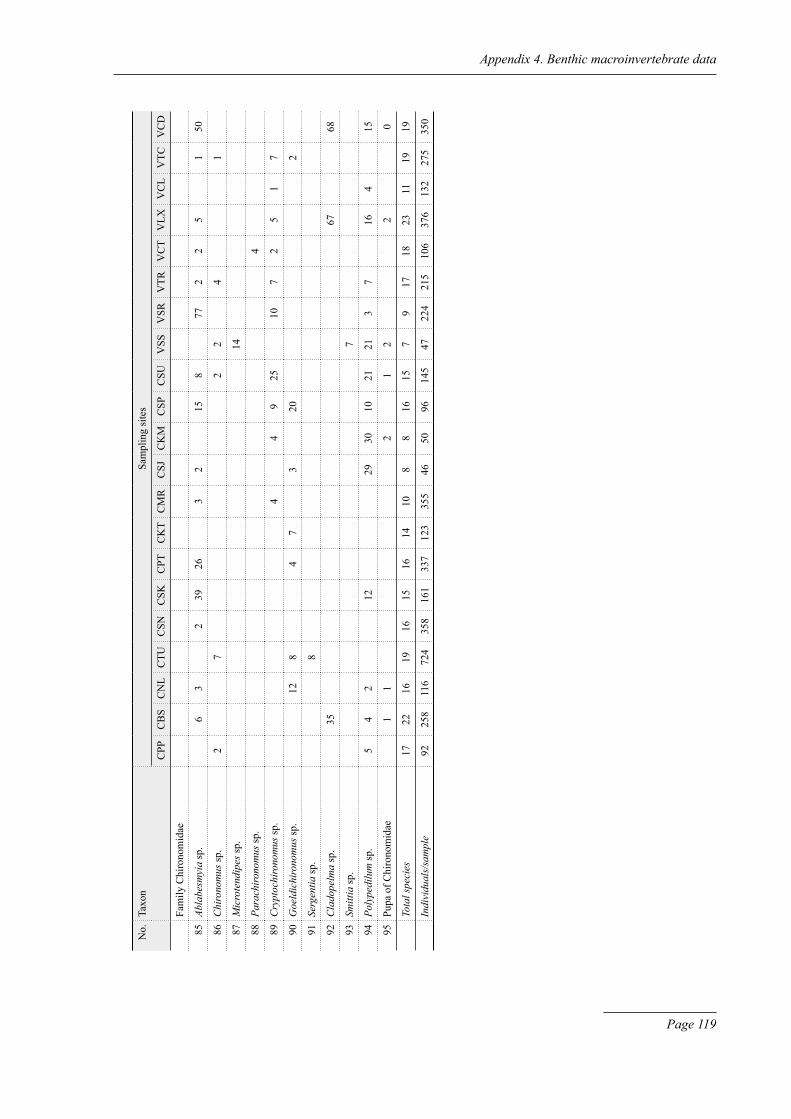
Page 119
Appendix 4. Benthic macroinvertebrate data
No.
Taxo
nSa
mpl
ing
site
s
CPP
CB
SC
NL
CTU
CSN
CSK
CPT
CK
TC
MR
CSJ
CK
MC
SPC
SUV
SSV
SRV
TRV
CT
VLX
VC
LV
TCV
CD
Fa
mily
Chi
rono
mid
ae
85Ab
labe
smyi
a sp
.
63
2
3926
3
2
158
77
22
5
150
86C
hiro
nom
us sp
.2
7
2
2
4
1
87M
icro
tend
ipes
sp.
14
88Pa
rach
irono
mus
sp.
4
89C
rypt
ochi
rono
mus
sp.
4
49
25
107
25
17
90G
oeld
ichi
rono
mus
sp.
128
47
3
20
2
91Se
rgen
tia sp
.
8
92C
lado
pelm
a sp
.
35
67
68
93Sm
ittia
sp.
7
94Po
lype
dilu
m sp
.5
42
12
2930
1021
213
7
164
15
95Pu
pa o
f Chi
rono
mid
ae
11
2
1
2
2
0
To
tal s
peci
es17
2216
1916
1516
1410
88
1615
79
1718
2311
1919
In
divi
dual
s/sa
mpl
e92
258
116
724
358
161
337
123
355
4650
9614
547
224
215
106
376
132
275
350

Report on the 2006 biomonitoring survey of the lower Mekong River and selected tributaries
Page 120

Page 121
Appendix 4. Benthic macroinvertebrate data
Appendix 4.2. Benthic macroinvertebrates tolerance scores
Order Family Taxon Tolerance score
Total samples
Neveimorpha Nephthydidae Nephthys polybranchia (Southern) 72 6Neveimorpha Nereidae Namalycastis longicirris (Takahasi) 94 2Neveimorpha Nereidae Namalycastis abiuma Muller 74 28Neveimorpha Nereidae Neanthes caudata (Delle Chiaje) 82 1Spiomorpha Ariciidae Scoloplos sp. 72 2Spiomorpha Spionidae Prionospio sp. 85 6Spiomorpha Spionidae Polydora sp. 77 15Oligochaeta Naididae Pristina sp. 8 3Oligochaeta Naididae Chaetogaster sp. 0 1Oligochaeta Naididae Genus sp. 26 104Oligochaeta Tubificidae Limnodrilus hoffmeisteri Claparede 58 155Oligochaeta Tubificidae Branchiura sowerbyi Beddard 52 167Gastropoda Family Genus sp. 0 3Archaeogastropoda Neritidae Neritina rubida (Pease) 43 14Mesogastropda Stenothyiidae Stenothyra mcmulleni Brandt 27 34Mesogastropda Stenothyiidae Stenothyra koratensis holosculpta Brandt 53 68Mesogastropda Stenothyiidae Stenothyra koratensis koratensis Brandt 95 1Mesogastropda Stenothyiidae Stenothyra jiraponi Brandt 25 1Mesogastropda Stenothyiidae Stenothyra labiata Brandt 19 8Mesogastropda Stenothyiidae Stenothyra sp. 57 2Mesogastropda Hydrobiidae Pachydrobia sp. 41 26Mesogastropda Hydrobiidae Hubendickia crooki Brandt 25 18Mesogastropda Hydrobiidae Hubendickia sp. 28 2Mesogastropda Hydrobiidae Hydrorissoia sp. 21 4Mesogastropda Hydrobiidae Paraprososthnia levayi (Bavay) 38 9Mesogastropda Hydrobiidae Paraprososthnia sp. 22 8Mesogastropda Hydrobiidae Jullienia acuta Poirier 7 1Mesogastropda Viviparidae Filopaludian (Filopaludina) filosa (Reeve) 49 7Mesogastropda Viviparidae Filopaludina (Filopaludina) doliaris (Gould) 51 2Mesogastropda Viviparidae Mekongia swainsoni breueri (Kobelt) 46 5Mesogastropda Viviparidae Mekongia swainsoni flavida n. ssp. 60 22Mesogastropda Viviparidae Angulyara sp. 52 8Mesogastropda Bythiniidae Bithynia sp. 31 37Mesogastropda Bythiniidae Wattebledia siamensis (Moellendorff) 5 1Mesogastropda Fluminicolidae Genus sp. 11 4Mesogastropda Thiaridae Thiara scabra (Muller) 27 4Mesogastropda Thiaridae Sermyla tornatella (Lea) 57 48Mesogastropda Thiaridae Tarebia granifera (Lamarck) 25 2Mesogastropda Thiaridae Melanoides tuberculatus (Muller) 45 13Mesogastropda Assimineidae Cyclotropis sp. (Assimineidae) 62 12Neogastropoda Pyramidellidae Morrisonietta spiralis Brandt 29 3Neogastropoda Pyramidellidae Morrisonietta sp. 38 5Neogastropoda Planorbidae Gyraulus sp. 27 3Neogastropoda Lymnaeidae Lymnaea viridis Qouy et Gaimard 19 1Neogastropoda Lymnaeidae Lymnaea sp. 6 1Arcoida Arcidae Scaphula pinna Benson 70 5Mytiloida Mytilidae Limnoperna siamensis (Morelet) 64 23Veneroida Dreissenidae Sinomytilus harmandi (Rochebrune) 64 28

Report on the 2006 biomonitoring survey of the lower Mekong River and selected tributaries
Page 122
Order Family Taxon Tolerance score
Total samples
Veneroida Corbiculidae Corbicula lamarckiana Prime 34 51Veneroida Corbiculidae Corbicula leviuscula Prime 55 23Veneroida Corbiculidae Corbicula tenuis Clessin 46 247Veneroida Corbiculidae Corbicula baudoni Morlet 69 23Veneroida Corbiculidae Corbicula moreteliana Prime 67 26Veneroida Corbiculidae Corbicula cyreniformis Prime 64 34Veneroida Corbiculidae Corbicula blandiana Prime 55 76Veneroida Corbiculidae Corbicula arata (Sowerby) 21 2Veneroida Pisidiidae Afropisidium clarkeanum (Nevill) 24 3Unionoida Amblemidae Hyriopsis (Hyriopsis) bialatus Simpson 43 1Unionoida Amblemidae Hyriopsis (Limnoscapha) desowitzi 25 1Unionoida Amblemidae Ensidens ingallsianus ingallsianus (Lea) 56 10Unionoida Amblemidae Pseudodon vondembuschianus ellipticus (Conrad) 50 1Unionoida Amblemidae Pseudodon inoscularis cumingi (Lea) 50 1Unionoida Amblemidae Pseudodon cambodjensis cambodjensis (Petit) 56 3Unionoida Amblemidae Uniandra contradens ascia (Hanley) 43 8Unionoida Amblemidae Uniandra sp. 25 3Unionoida Amblemidae Pilsbryoconcha exilis compressa (Martens) 43 2Unionoida Amblemidae Pilbryoconcha lemeslei (Morelet) 76 2Unionoida Amblemidae Pilsbryoconcha exilis exilis (Lea) 59 1Unionoida Amblemidae Physunio cambodiensis (Lea) 29 4Unionoida Amblemidae Physunio micropterus (Morelet) 84 1Unionoida Amblemidae Scabies sp. 50 1Unionoida Amblemidae Trapezoidens exolescens comptus (Deshayes) 59 3Amphipoda Gammaridae Melita sp. 75 49Amphipoda Oedicerotidae Perioculodes sp. 62 11Amphipoda Corophiidae Corophium sp. 68 11Amphipoda Corophiidae Kamaka sp. 79 18Amphipoda Corophiidae Grandidierella lignorum Barnard 66 18Amphipoda Corophiidae Grandidierella vietnamica Dang 75 20Isopoda Corallanidae Tachaea chinensis Thielemann 6 1Isopoda Anthuridae Cyathura trucata Dang 70 35Tanaidacea Apseudidae Apseudes vietnamensis Dang 82 2Cumacae Family Genus sp. 82 1Decapoda Palaemonidae Macrobrachium pilimanus (De Man) 35 3Decapoda Atyidae Caridina nilotica Roux 33 3Decapoda Atyidae Caridina sp. 6 1Decapoda Alpheidae Alpheus bisincisus (De Man) 82 1Ephemeroptera Baetidae Cloeon sp. 20 13Ephemeroptera Baetidae Baetis sp. 30 19Ephemeroptera Baetidae Centroptilum sp. 23 11Ephemeroptera Caenidae Caenis sp. 33 64Ephemeroptera Heptageniidae Heptagenia sp. 29 3Ephemeroptera Heptageniidae Genus sp. 0 1Ephemeroptera Heptageniidae Epeorus sp. 0 1Ephemeroptera Leptoplebiidae Leptophlebia sp. 27 10Ephemeroptera Leptoplebiidae Traverella sp. 22 2Ephemeroptera Leptoplebiidae Choroterpes sp. 19 2Ephemeroptera Ephemeridae Ephemera sp. 30 48Ephemeroptera Ephemeridae Afromera sp. 32 12Ephemeroptera Ephemeridae Hexagenia sp. 61 1

Page 123
Appendix 4. Benthic macroinvertebrate data
Order Family Taxon Tolerance score
Total samples
Ephemeroptera Ephemeridae Eatonigenia sp. 50 11Ephemeroptera Palingeniidae Pentagenia sp. 46 55Ephemeroptera Palingeniidae Genus sp. 33 13Ephemeroptera Potamanthidae Potamanthus sp. 20 6Ephemeroptera Behningiidae Genus sp. 64 1Plecoptera Perlidae Perla sp. 22 10Odonata Agrionidae Agrion sp. 6 1Odonata Aeschnidae Aeschna sp. 0 1Odonata Calopterygidae Calopteryx sp. 28 2Odonata Gomphidae Gomphus sp. 32 33Odonata Gomphidae Dromogomphus sp. 31 40Odonata Gomphidae Octogomphus sp. 14 6Odonata Gomphidae Progomphus sp. 22 5Odonata Gomphidae Aphylla sp. 23 17Odonata Libellulidae Libellula sp. 11 2Odonata Libellulidae Macromia sp. 23 6Hemiptera Corixidae Corixa sp. 36 9Hemiptera Naucoridae Naucoris sp. 28 12Coleoptera Gerridae Genus sp. 0 1Coleoptera Elmidae Heterlimnius sp. 19 23Coleoptera Hygrobiidae Hyphydrus sp. 13 2Coleoptera Dolichopodidae Hydrophorus sp. 47 1Coleoptera Haplidae Genus sp. 63 1Coleoptera Elmidae Genus sp. 35 15Coleoptera Dytiscidae Genus sp. 5 1Coleoptera Staphilinidae Bledius sp. 44 1Trichoptera Rhyacophilidae Rhyacophila sp. 17 3Trichoptera Hydroptilidae Oxyethira sp. 25 1Trichoptera Hydroptilidae Agraylea sp. 75 1Trichoptera Hydroptilidae Genus sp. 43 1Trichoptera Ecnomidae Economus sp. 29 16Trichoptera Psychomyiidae Genus sp. 50 32Trichoptera Philopotamidae Genus sp. 42 53Trichoptera Hydropsychidae Hydropsyche sp. 25 5Trichoptera Hydropsychidae Macronema sp. 19 1Trichoptera Sialidae Sialis sp. 6 1Trichoptera Crambidae Genus sp. 7 1Trichoptera Pyralidae Genus sp. 0 2Diptera Heleidae Culicoides sp. 39 71Diptera Chaoboridae Chaoborus sp. 42 4Diptera Limoniidae Eriocera sp. 29 40Diptera Limoniidae Pedicia sp. 50 1Diptera Tipulidae Antoncha sp. 31 9Diptera Tipulidae Genus sp. 14 4Diptera Tabanidae Chrysops sp. 0 1Diptera Tabanidae Tabanus sp. 56 1Diptera Chironomidae Ablabesmyia sp. 34 223Diptera Chironomidae Chironomus sp. 44 52Diptera Chironomidae Tanytarsus sp. 25 2Diptera Chironomidae Clinotanypus sp. 24 14Diptera Chironomidae Procladius sp. 0 5

Report on the 2006 biomonitoring survey of the lower Mekong River and selected tributaries
Page 124
Order Family Taxon Tolerance score
Total samples
Diptera Chironomidae Microtendipes sp. 50 4Diptera Chironomidae Pseudochironomus sp. 27 14Diptera Chironomidae Parachironomus sp. 82 3Diptera Chironomidae Cryptochironomus sp. 34 74Diptera Chironomidae Goeldichironomus sp. 38 120Diptera Chironomidae Sergentia sp. 46 23Diptera Chironomidae Cladopelma sp. 71 28Diptera Chironomidae Smittia sp. 21 23Diptera Chironomidae Polypedilum sp. 35 254Diptera Chironomidae Pupa 38 58

Page 125
Appendix 4. Benthic macroinvertebrate data
Appendix 4.3. Benthic macroinvertebrates metrics
No. Year Site Site disturbance
score
Species richness
Abundance (indvs./m2)
Species diversity index
Dominance index
ATSPT value
1 2004 LNO 1.00 30 550 2.601 0.700 22
2 2004 LPB 1.28 13 250 1.993 0.642 32
3 2004 LVT 1.78 4 3 1.332 0.600 31
4 2004 LNG 1.50 22 420 2.067 0.552 32
5 2004 LKD 1.43 14 370 1.567 0.546 39
6 2004 LPS 1.57 24 580 2.358 0.730 37
7 2004 TMU 1.71 8 80 1.837 0.759 46
8 2004 TCH 1.86 18 200 1.665 0.422 43
9 2004 TSK 2.13 20 1,220 0.624 0.112 51
10 2004 TKO 1.88 19 310 1.857 0.521 35
11 2004 CPP 2.88 19 510 1.952 0.607 55
12 2004 CTU 2.13 22 460 1.918 0.647 52
13 2004 CPS 2.22 10 80 1.528 0.511 40
14 2004 CSS 1.75 14 30 2.023 0.721 39
15 2004 CSP 1.25 13 80 1.556 0.444 35
16 2004 CKT 1.25 10 70 1.139 0.303 34
17 2004 VTC 2.50 27 2,190 2.150 0.698 62
18 2004 VCD 2.69 30 430 2.539 0.638 57
19 2004 VSS 2.29 2 2 0.637 0.249 45
20 2004 VSP 1.29 19 770 1.084 0.249 38
21 2005 LOU 1.00 22 250 2.159 0.706 33
22 2005 LPB 1.69 10 60 1.887 0.652 33
23 2005 LNK 1.38 31 1020 2.131 0.676 32
24 2005 LMH 1.94 16 130 2.086 0.712 34
25 2005 LMX 1.94 14 40 2.382 0.786 35
26 2005 TMI 2.25 16 260 1.890 0.716 36
27 2005 TMC 1.64 12 180 1.694 0.504 35
28 2005 TKO 1.86 22 120 2.430 0.720 32
29 2005 LKU 1.13 24 160 2.502 0.725 37
30 2005 LKL 1.50 24 250 2.010 0.499 35
31 2005 CMR 1.75 19 200 1.957 0.513 38
32 2005 CSJ 1.50 11 30 1.958 0.615 35
33 2005 CKM 1.50 13 40 2.040 0.759 34
34 2005 CSU 2.13 22 230 2.299 0.669 36
35 2005 CSS 1.75 19 70 2.532 0.830 36
36 2005 CSP 1.13 32 250 2.682 0.813 38
37 2006 CPP 2.89 17 60 2.266 0.772 52
38 2006 CBS (CKL) 2.19 22 170 2.560 0.837 53
39 2006 CNL 1.97 16 80 2.324 0.750 52
40 2006 CTU 2.04 19 480 1.735 0.439 53
41 2006 CSN 2.00 16 240 1.598 0.492 47
42 2006 CSK 2.00 15 110 1.957 0.683 47

Report on the 2006 biomonitoring survey of the lower Mekong River and selected tributaries
Page 126
No. Year Site Site disturbance
score
Species richness
Abundance (indvs./m2)
Species diversity index
Dominance index
ATSPT value
43 2006 CPT 2.33 16 220 1.711 0.640 46
44 2006 CKT 1.14 14 80 1.860 0.512 31
45 2006 CMR 1.42 10 240 1.494 0.507 45
46 2006 CSJ 1.25 8 30 1.278 0.370 32
47 2006 CKM 1.19 8 30 1.396 0.400 35
48 2006 CSP 1.11 16 60 2.366 0.792 30
49 2006 CSU (CUS) 1.75 15 100 1.920 0.793 39
50 2006 VSS 2.00 7 30 1.437 0.553 34
51 2006 VSR (VSP) 2.00 10 150 1.553 0.647 40
52 2006 VTR (VVL) 2.44 17 140 2.233 0.740 59
53 2006 VCT 2.64 18 70 2.308 0.755 65
54 2006 VLX 2.69 23 250 2.426 0.215 58
55 2006 VCL 1.91 11 90 2.107 0.795 54
56 2006 VTC 2.28 19 180 2.003 0.622 57
57 2006 VCD 2.31 18 230 2.347 0.806 55

Other papers in the MRC Technical Paper series:
MRC Technical Paper No. 1 Status of the Mekong Pangasianodon hypophthalmus resources with special reference to the stock shared between Cambodia and Viet Nam.
MRC Technical Paper No. 2 Status of Pangasiid aquaculture in Viet Nam.
MRC Technical Paper No. 3 Mekong giant fish species: on their biology and management.
MRC Technical Paper No. 4 Deep pools as dry season fish habitats in the Mekong Basin.
MRC Technical Paper No. 5 Financial analysis and risk assessment of selected aquaculture and fishery activities in the Mekong Basin.
MRC Technical Paper No. 6 Fisheries in the Lower Mekong Basin: status and perspectives.
MRC Technical Paper No. 7 Freshwater aquaculture in the Lower Mekong Basin.
MRC Technical Paper No. 8 Fish migrations of the Lower Mekong Basin: implications for development, planning and environmental management.
MRC Technical Paper No. 9 The impacts of introductions and stocking of exotic species in the Mekong Basin and polices for their control.
MRC Technical Paper No. 10 Distribution and ecology of some important riverine fish species of the Mekong River Basin.
MRC Technical Paper No. 11 Hydro-acoustic survey of deep pools in the Mekong River of southern Lao PDR and northern Cambodia.
MRC Technical Paper No. 12 Tagging Fish - a case study from the Tonle Sap, Cambodia.
MRC Technical Paper No. 13 Biomonitoring of the lower Mekong River and selected tributaries.
MRC Technical Paper No. 14 Fish Migration Triggers in the Mekong River and other freshwater tropical systems.
MRC Technical Paper No. 15 Diagnostic study of water quality in the Lower Mekong Basin.
MRC Technical Paper No. 16 Fish Consumption and the Yield of Fish and Other Aquatic Animals from the Lower Mekong River Basin.
MRC Technical Paper No. 17 Socio-economics of the fisheries of the lower Songkhram River Basin, northeast Thailand.
MRC Technical Paper No. 18 Yield and value of the wild fishery of rice fields in Battambang Province, near Tonle Sap Lake, Cambodia.
MRC Technical Paper No. 19 An assessment of water quality in the Lower Mekong Basin.
MRC Technical Paper No. 20 Biomonitoring of the lower Mekong River and selected tributaries, 2004 – 2007
MRC Technical Paper No. 21 Flood situation report, August 2008.

Mekong River Commission P.O.Box 6101,Vientiane 01000,
Lao PDR.Telephone: (856) 21 263 263 Facsimile: (856) 21 263 264 E-mail: [email protected] Website: www.mrcmekong.org