issn: 1755 -6783 internationally indexed journal v.pdf · supplementation on the isocapnic...
TRANSCRIPT

Annals of Tropical Medicine & Public Health-Special March 2018 Vol V
ISSN: 1755-6783
Internationally indexed
journal
The journal is registered with the following abstracting partners: Baidu scholar, CNKI,
EBSCO Publishing’s Electronic databased, Google Scholar, National Library, ProQuest, and
African Index Medicus.
It is indexed with DOAJ, EMASE, ESCI, Index Copernicus, Scimago Journal Ranking, and
SCOPUS
Impact factor for 2018: 2.75

Annals of Tropical Medicine & Public Health-Special Issue Mar 2018 Vol V
i
Title Page Auditing the compliance with the principles of nurse-
patient communication at Psychiatric wards of Shahid
Behshti University of medical sciences in 2014
S201-18
Effects of Herbal Combination of Securigera
securidaca, Vaccinium arctostaphylos, Citrullus
colocynthis and Coriandrium sativum on Fasting Blood
Sugar in Pre-Diabetic Elderly People
S201-18
The effectiveness of acceptance and commitment
therapy on mental health and psychological well-being
in female breast cancer patients
S202-18
Prevalence Of Depression Among Hemodialysis
Patients Admitted In Gorgan (Iran) During 2014
S204-18
Perspectives of Iranian mothers with cerebral palsy
child about family coping
S209-18
Assessment of musculoskeletal Disorders in Iranian
dentists
S206-18
The Effect of Levothyroxine on Memory Impairment
Induced by Electroconvulsive Therapy in Bipolar
Patients: Clinical Trial
S207-18
“A Chance for a better life”: A thematic content
analysis of the reason for decision to perform
face cosmetic surgery from the perspective of
Iranian men and women
S208-18
Comparison of Serum Sodium And Potassium
Levels; Based On Two Methods Arterial Blood
Gas And Automatic Laboratory Analyzers
S210-18
Depression and Internet Addiction in Students
S211-18
Investigating the Relation between Anxiety,
Stress, Depression and Hemodialysis Adequacy
in Patients Hospitalized in Hemodialysis Center
of Dezful Grand Hospital in 2014
S212-18
COST-EFFECTIVENESS OF SPINAL ANESTHESIA
VERSUS GENERAL ANESTHESIA IN CESAREAN
SECTION
S212-18
The effect of home self-care on quality of life in
hemodialysis patients who are referred to Bu S218-18

Annals of Tropical Medicine & Public Health-Special Issue Mar 2018 Vol V
ii
Ali educational and treatment center, Ardabil,
Iran
The Prevalence of Depression and Some
Related Factors in Caregivers of Patients with
Bipolar Disorder
S214-18
Influence of sufentanil intrathecal
administration on Second-stage labor duration
S215-18
Results of Ponseti Casting On Residual Clubfoot
In Patients Referred To Shahid Motahari Clinic
Between 2011 And 2014
S216-18
The Effects of Short-Term Caffeine
Supplementation on the Isocapnic Buffering
and Hypocapnic Hyperventilation Phases in
Sedentary Men
S217-18
Mean Perineal Length in Iranian women S218-18
Annals of Tropical Medicine & Public Health-Special Issue Mar 2018 Vol V
S201-18
Auditing the Compliance with the Principles of Nurse -
Patient Communication at Psychiatric Wards of Shahid
Beheshti University of Medical Sciences in 2014
Mostafa Kakouei1, Jamileh Mohtashami*
2, Mansoureh Zagheri Tafreshi
3, Mohammad Amin Pourhossein
Qoli4
1 Psychiatric Nursing Graduate Student, Student Research Committee, Faculty of Nursing and Midwifery of Shahid
Beheshti University of Medical Sciences, Tehran, Iran 2 Assistant Professor of Psychiatric Nursing Department, Faculty of Nursing and Midwifery, Shahid Beheshti University
of Medical Sciences, Tehran, Iran 3 Associate Professor, Faculty of Nursing and Midwifery, Shahid Beheshti University of Medical Sciences, Tehran, Iran 4 Assistant Professor, Department of Biostatistics, Institute of Liver and Digestive Diseases, Shahid Beheshti University
of Medical Sciences, Tehran, Iran
*Corresponding Author Email: [email protected]
Abstract
Introduction: Establishing communication with patients is one of the most important duties of a nurse, so
that a nurse can improve the quality of nursing care though setting a correct and effective communication
with patients.
Purpose: This study was conducted with the aim of auditing the compliance with the principles of nurse -
patient communication at psychiatric wards of Shahid Beheshti University of medical sciences in 2016.
Method: In this descriptive study (audit approach), 100 cases of nurse – patient communication were
selected and observed in psychiatric wards at the selected hospitals affiliated to Shahid Beheshti University
of Medical Sciences using the event sampling method in 2016. Data were gathered through a demographic
questionnaire for nurses and a checklist of nurse – patient communication. The data were analyzed using
descriptive statistics, two-sample independent t-test and variance analysis at the significance level of
P<0.05.
Results: The conformity rate of nurse - patient communication principles with the standards was 76.31%
which is an acceptable level.
Conclusion: The degree of compliance with nurse-patient communication principles in psychiatric wards of
Shahid Beheshti University of Medical Sciences in 2016 was satisfactory. However, to better improve this
communication, training the nurses and clinical monitoring of managers are recommended.
Keywords: Auditing, Nurse patient communication, Psychiatric ward, Communication.
Introduction
Humans are social creatures that communicate through the exchange of feelings, attitudes, and emotions, thereby
provide their physical and mental needs (1). Communication means verbal and nonverbal transfer of information (2)
and it is a dynamic process between humans used to influence on each other and gain mutual support and what is
necessary for health, growth, and survival. Communication is one of the central concepts of the nature of nursing
and an important part of nursing jobs (1). In fact, the nurse-patient communication leads to numerous caring
behaviors that are the base for providing high quality nursing care (2).
In nursing profession, communication and communication skills play a very important role in solving patients’ problems; especially in patients with mental disorders since impairments in cognitive, emotional and insight areas
make communicating with them so difficult leading to their reduced provision of information and participation in
treatment programs (3).
Patients and nurses are the main communication factors in hospitals and communication with patients is one of the
key roles of nurses that contribute to care improvement, patient recovery, and professional and social development

Annals of Tropical Medicine & Public Health-Special Issue Mar 2018 Vol V
S201-18
of nurses’ personality (4). Improper communication can hinder a patient's recovery and may even permanently
deprive the patient of health or life; on the contrary, optimal communication is more effective in patients than the
treatment with medication. In fact, nurses will be successful in their work when they are able to establish an optimal
communication with their patients (5). Statistics also show that majority of public complaints and incorrect
application of directives by patients are not the result of incompetence healthcare workers, but they originate from
communication problems (6). Therefore, providing high quality nursing care requires creation of a meaningful
communication by nurses with patients and an ongoing assessment of them (2).
Auditing is one of the important components of clinical governance program (7) as well as one of the ways used to
improve and evaluate the quality of patient care. Auditing is gathering facts in relation to a particular problem which
is done systematically and offers strategies to improve the quality of nursing care. In fact, auditing evaluates the root
of a performance and also the outcome of a specific performance (8). Auditing patient care is a kind of control that
specifies the status quo of the patient care and accordingly problems and bottlenecks can be identified and the
required plans can be implemented to resolve them (9). The purpose of the audit of patient care is to enhance the
quality of patient care, staff training, and analysis of nursing care (10). Auditing is a management control work using
nursing standards (11). The term “standard” in nursing activities means a desired quality by which the nursing care
provided to a patient or a group of patients can be evaluated. Use of standards increases the quality of care and
directs the nurses to correct goals (12). Standard in Psychiatric Nursing is fulfillment of professional commitment in
order to improve the profession. The focus of standards is on the performance of individuals. Reviewing and
understanding the situation, diagnosing and planning nursing measures, applying and implementing designated
projects and finally evaluating these actions by the standards of nursing are used in each center (13).
One of the most important principles in psychiatric nursing is nurses’ communication with patients (14) and given
that incorrect action is always associated with complications, these complications are seen as a concern in the action
and speech in non-normative communication. This concern is a chain of negative and relatively uncontrollable
thoughts and imaginations in psychological problems that may be associated with one or more negative
consequences. By communication, nurses become aware of the needs and internal motivations of the patients with
mental disorders and take care of them because feeling pain and illness in patients with mental disorders are
expressed through communication. In addition, always duration and the way of communication is essential in the
hope and positive attitude of the patient to the treatment team, thereby the patient attains the motivation to deal with
the disease and trust the nurse that is particularly important in the diagnosis, treatment and progression of the
disease (15).
Therefore, comparing the communication of nurses with patients with the existing standards can be followed by
programing to enhance the work quality of psychiatric nurses. By estimating the distance between the existing care
and standards, the problems are appeared based on which some suggestions can be offered to improve the quality of
psychiatric nursing services, close the gap between the existing care and standards, and thus increase psychiatric
nursing services. Given the importance of communication with patients with mental disorders, the role of psychiatric
nurses in creating an effective communication with the patients and the importance of comparison between the
quality of the current nurse-patient communication and the approved standards as well as the fact that no research
has been done with this purpose in the country, it is necessary to measure this issue, so that the results can be used in
the correct and scientific advancement of accreditation program in order to improve the community health level and
the relationship between psychiatric nurses and the patients. Therefore, the present study was carried out with the
aim of auditing the conformity rate with the principles of nurse - patient communication at psychiatric wards of
Shahid Beheshti University of medical sciences in 2016.
Materials and Methods
This descriptive study is a kind of audit studies which was done in psychiatric wards of the hospitals affiliated to
Shahid Beheshti University of Medical Sciences in 2016. The population of the present study consisted of all kinds
of cares associated with the communication of nurses with patients in psychiatric wards of the hospitals mentioned.
The required sample size was p=0.5, d=0.1 and z=1.96 and was calculated 100using this formula:
2
2
2/1 1
d
PPZn

Annals of Tropical Medicine & Public Health-Special Issue Mar 2018 Vol V
S201-18
Time and event sampling was performed systematically by an observer (researcher) by visiting the sections
mentioned in three working shifts of morning, evening and night. In the sampling of events, observation happens in
specific situations, such as patients’ condition assessment, treatment interventions like medication, ECT and other
nursing interventions. The data gathered in this study consisted of two parts: demographic information and the
checklist of assessing the communication of nurses with patients. In the first part, demographic information that
included variables of age, sex, level of education, work experience, work shifts, marital status, passing
communication skills courses, adequacy of income, and years of being in a psychiatric ward. This part was
completed by nurses and also time and frequency of communications were investigated. In the second part, the
researcher-made checklist, which contained 21 items on how to communicate, was completed by the researchers.
These items were developed by collecting and extracting information from credible research papers in Iran and the
world, protocols and guidelines, and reference books. Checklist of communication principles contains information
on how nurses communicate with patients in psychiatric wards that this information was designed in different terms.
The response to the checklist consisted of two parts as follows: 1. Yes, which consisted of two parts: (A - Done
correctly) this part was scored when the desired care was taken correctly and properly, (B - Done incorrectly) this
part was scored when the desired care was not taken correctly and appropriately. 2. No, this part was scored when
the desired care was not taken. The method of scoring was as follows: Not done (Score 0), done incorrectly (Score:
1), done correctly (Score: 2).
Face validity and content validity methods were used to determine the content validity of the checklist. For this
purpose, the items of the checklist were judged and evaluated by 10 specialists, working nurses, and nursing faculty
members in terms of relevance, clarity and simplicity of the content of the questions. To assess the reliability of the
tool the method of agreement coefficient between observers was used which was calculated ICC=0.88.
To do the research, after obtaining ethics approval from the committee of ethics in medical research of International
Branch of Shahid Beheshti University with code IR.SBMU.RAM.REC.1395.110 and also after receiving a referral
letter from education unit of Shahid Beheshti University of Medical Sciences, the information was collected.
Officials were assured about the confidentiality of the information. While using the sources, observance of
trustworthiness was done by referring to books and papers used.
To analyze data, descriptive and inferential statistics (ANOVA and two independent samples t-test) were used by the
help of SPSS 18.
Findings
The majority of nurses (69%) were female and 98% of them had undergraduate education. As Table 1 shows, the
minimum and maximum ages were 24 and 43years old, respectively and the work experience in psychiatric wards
was in the range of 1 to 19 years.
Table 1: Descriptive study of quantitative variables
Variable Minim
um
Maxim
um
Avera
ge SD
Age 24 43 32.84 5.2
83
Experience in psychiatric
wards 1 19 6.94
4.4
47
Overall experience 1 22 7.63 4.8
84
Marital Status of the participating nurses showed that 70% were married and 30% were single. In considering
employment status, 50 people (50%) were officially employed so that 17 persons (17 %) were covenant contracts, 7
people (0.7 %) were contracted, 12 people (12 %) were plan employees and 14 people (14%) were sector
employees. 99 percent of the participants had no desire to work overtime. Most subjects (83%) had rotation work
shifts. According to the nurses participating in the study, 68 percent were satisfied with their jobs and 82 percent of
them were not satisfied with the income of this job. 85 percent of nurses passed communication skills courses. The
time of communication with patients for 90 percent of the participants was less than 10 minutes and the frequency of
communication for 85% of them was less than 5 times in one's shift. In Table 2, frequency distribution of the
principles of nurse - patient communication in psychiatric wards of Shahid Beheshti University of Medical Sciences

Annals of Tropical Medicine & Public Health-Special Issue Mar 2018 Vol V
S201-18
of Tehran was shown. According to this table, match the compliance of communication principles was 76.31% and
nurses were weak only in the item of encouraging patients to talk more (31.5%).
There was a significant relationship between gender and the principles of communication using two independent
samples t-test (p <0.05) so that females established better communication with patients. Level of education, marital
status, work shift and willingness to work overtime had no significant correlation with the principles of
communication with patients. Using ANOVA test, a significant relationship was observed between employment
status and compliance with the principles of communication (p <0.05) based on which sector employees established
better communications with patients. A significant correlation was found between passing the courses of
communication skills and principles of communication (p <0.05). There was a significant relationship between job
satisfaction and income and communication with patients so that nurses satisfied with their jobs were more
successful in compliance with the principles of communication as well as those who considered their incomes
sufficient complied better with the principles of communication.
Table 2: Frequency distribution of conformity rate with the principles of nurse –patient communication in psychiatric wards of
Shahid Beheshti University of Medical Sciences in 2016
Questio
n Items
Correct
Frequency
(percent)
Incorrect
Frequency
(percent)
No
Frequency
(percent)
Score
1 The nurse says hello to the patient at the beginning of the
communication.
99
(99.0) 0
1
(1.0) 99.0
2 The nurse responds to the greetings of the patient at the
beginning of the communication.
99
(99.0) 0
1
(1.0) 99.0
3 The nurse greets the patient at the beginning of the
communication.
90
(90.0)
8
(8.0)
2
(2.0) 94.0
4 The nurse accepts the patient away from the cultural
characteristics. (Race, ethnicity, religion)
95
(95.0)
4
(4.0)
1
(1.0) 97.0
5 The nurse accepts the patient away from social features.
(Level of education, marital status, occupation)
94
(94.0)
5
(5.0)
1
(1.0) 96.5
6 The nurse accepts the patient away from economic
characteristics. (Income, economic level)
90
(90.0)
8
(8.0)
2
(2.0) 94.0
7 The nurse builds up comfort for the patient during
communication.
68
(68.0)
20
(20.0)
12
(12.0) 78.0
8 The nurse communicates with the patient with simple and
understandable words.
87
(87.0)
11
(11.0)
2
(2.0) 93.0
9 The nurse does not stop the communication suddenly
while the patient is talking.
36
(36.0)
35
(35.0)
29
(29.0) 53.5
10 The nurse uses a polite and friendly tone during
communication.
70
(70.0)
28
(28.0)
2
(2.0) 84.0
11 According to the needs of the patient, the nurse gives the
opportunity to the patient to talk.
50
(50.0)
32
(32.0)
18
(18.0) 66.0
12 The nurse uses relaxing words indicating affection during
the conversation with the patient.
63
(63.0)
27
(27.0)
10
(10.0) 76.5
13 The nurse answers to the patient’s questions. 41
(41.0)
31
(31.0)
28
(28.0) 56.5
14 The nurse says his/her impressions of the patient's
condition to him/her. (Sadness, distress, anxiety, joy)
60
(60.0)
36
(36.0)
4
(4.0) 78.0
15
While talking with the patient, the nurse responds to the
patient by shaking his/her head and facial expression to
express attention to the patient.
56
(56.0)
33
(33.0)
11
(11.0) 72.5
16 The nurse speaks with a calm tone and measured words
during the conversation with the patient.
71
(71.0)
23
(23.0)
6
(6.0) 82.5
17
The nurse pays attention to nonverbal communication of
the patient (eye contact, tone and intonation, mode of
dress, body movements).
70
(70.0)
25
(25.0)
5
(5.0) 82.5
18
The nurse encourages the patient when s/he sees positive
points (personal hygiene, taking medicine, compliance with
the regulations of the ward) in the patient.
67
(67.0)
29
(29.0)
4
(4.0) 81.5

Annals of Tropical Medicine & Public Health-Special Issue Mar 2018 Vol V
S201-18
19 The nurse respects the privacy of the patient. 25
(25.0)
40
(40.0)
35
(35.0) 45.5
20 The nurse uses humor in communicating with patients. 27
(27.0)
33
(33.0)
40
(40.0) 43.5
21 The nurse encourages the patient to continue talking. 18
(18.0)
26
(26.0)
55
(55.0) 31.5
Total 1376 (65.43) 458
(21.77)
269
(12.8) 76.31
Discussion and Conclusion
In this study, 100 cases of nursing care related to the principles of nurse - patient communication were observed.
Conformity rate of the principles of nurse - patient communication with the standards was 76.31% which was
assessed desirable.
In considering the items, the highest compliance of communication with standards was related to the items of
nurse’s saying hello to the patient (99%) and also nurse’s response to the greeting of the patient (99%) which were
desirable and then respectively the items of the acceptance of the patient away from social features (97%) and
acceptance of the patient away from the cultural characteristics (96%) had the highest compliance of communication
with standards. The lowest score pertained to the nurse’s encouraging the patient to continue to talk (31.5 %) which
was reported as weak and was not consistent with the study of Salarvand et al. who showed in their study that 60
percent of the nurses tried to encourage patients to continue to talk to solve their problems by communication. The
reason for this difference in results can be due to the differences between the wards that were studied (16). In this
study, compliance with the privacy of the patient by nurses was reported medium (45.5%) which is in line with the
study of Aqajani and Dehghan Niri who reported 49.4% of the patients described the observance of their privacy at
emergency department relatively good (17). Furthermore, the study conducted by Sarkheyl et al. expressed
respecting the privacy of patients at 78.13 percent (18). Another study by Karro et al. (2005) conducted in Australia
stated the violation of privacy in emergency department was 33% (19). According to the researcher, the differences
in these studies may be due to differences in cultures in different cities and countries under the study or due to the
differences in physical structure of the wards under the study. In this study of Fleischer et al. (2009), it was
emphasized that different factors affect the nurse-patient communication that include three groups of variables:
variables of care providers, patient-related variables and environmental and situational variables (20). Respecting the
privacy of patients is emphasized in the creation of effective communication of medical team with patients,
satisfaction of patients and calmness of patients. Despite the importance of this issue, when patients are admitted to
the hospitals, they are not always able to control their privacy and their privacy is violated in different treatment
situations by medical staff for different reasons. Violation of the privacy causes increased anxiety, stress, aggressive
and violent behaviors in individuals (21).
In this study, 53.5% of the nurses did not interrupt the patient’s communication while the patient was talking which
indicates an average level. Coiera et al. reached to the similar results in 2002 in Australia so that 69.4% of nurses did
not interrupt the patient’s communication (22). Also, in a study conducted by Salarvand et al., it was found that 27
percent of all communications were interrupted (16). Differences in the results can be due to in the differences in use
of tools, scoring system, and surveyed wards.
In this study, 69% of the nurses were female and according to the statistical data, female nurses had a significant
difference in compliance with the principles of communication with male nurses. This finding is similar to the study
of Safavi et al. that showed audio and verbal communication skills had a positive correlation with gender (p<0 .05)
(24). The results showed that the subjects with master's degree were not significantly different in communicating
with patients compared to bachelor's degree nurses. However, the study of Gholami et al. demonstrated a significant
difference between communication skills and level of education (p<0 .05) (25). Existence of this difference may be
due to the fact that Gholami et al. studied a much wider range of degrees. Nurses' marital status showed no
significant differences in this study, but Taqi Zadeh et al. and Siaamian et al. found that there is a significant
correlation between marital status and the use of communication skills (26), (27). Results showed that nurses with
the employment status of sector employees had more successful communication than the nurses with other
employment status that reflects the impact of employment status on communication. This finding is similar to the
study of Barati et al. that showed employment status had a significant relationship with using communication skills
(28). In line with the results of the present study, a study conducted by Pope et al. in the U.S. proved the nurses with

Annals of Tropical Medicine & Public Health-Special Issue Mar 2018 Vol V
S201-18
morning shifts had a significantly better quality of communication with patients than the nurses with evening and
night shifts (p<0.01) (29). In another study by Goudarzi et al. done in Tehran, there was a significant relationship
between the quality of verbal communication of nurses with the working shifts of nurses (p<0.01) so that verbal
communication of nurses was reported weak in morning and circulation shifts and good in evening and night shifts
(30).
About job satisfaction, 68% of the nurses were satisfied with their jobs and nurses - patient communication between
these nurses was not significantly different from the nurses who were not satisfied with their jobs (p<0 .05). This
finding was consistent with other studies (31), (32), (33). Davis stated in his study that it seem, communication skills
and nurse - patient communication are affected by the nurses’ job satisfaction and applying these skills by nurses
can increase their satisfaction with the work. This was consistent with the results of our study (34).
In this study, 85% of the nurses passed the course of communication skills which has a significant correlation with
the compliance of the principles of communication (p<0.05) and this result is in line with the study of Namdar et al.
(35). Tongue also writes: acquiring communication skills such as clinical skills takes place better through education
(36).
The results of this study showed that nurses who were not satisfied with their income were less successful in the
compliance of the principles of communication. Mirkamali showed in his studies that the most important factor in
the lack of nurses’ satisfaction is poor payment and low income (37). Studies of Zahedi et al. and Mirzabeigi showed
payment method and promotion system as the most important dissatisfaction factors of nurses (38), (39). Income or
wage is considered as the most important aspect of any job and according to the researcher, in nursing job in which
many factors lead to the creation of dissatisfaction, low wages can lead to nurses’ increased leaving the work and
dissatisfaction.
The number of nurse’s communication with a patient on a psychiatric ward is less than 5 times with 85 percent. In
the variable of the duration of communication, most subjects (90%) spent less than 10 minutes to communicate with
patients that this result is in line with the study of Sabzevari et al (40). They concluded that, on average, after 23
seconds of talking to patients, the conversation was stopped and only 28 percent of the patients fully expressed their
concerns and this is a reason to prove the lack of focus on active listening skills among nurses. To be responsive to
the desirable communication with patients, nurses need knowledge, understanding, and skills in human
communication (41). Rana and Upton said that although the skills of conversation are dominantly used by
employees, it is required that such skills be addressed as part of nursing education (42). It seems that lack of
communication skills among providers of these services originates from inadequate trainings.
It has been proven in research that most important barriers in nurse - patient communication in professional
environment can be the large workload of nurses, hardness of nursing work, lack of amenities, and physical and
mental fatigue (38). According to the point that principles of nurse - patient communication were desirable, it seems
that they can be strengthened and raised to a higher level by holding specialized training courses by planners and
educational workshops for nurses. For the limitations of this study, it can be noted that the research environment was
limited to only two hospitals and also there was the lack of similar studies.
Acknowledgments
This study was derived from post-graduate student thesis of psychiatric nursing and the research project approved by
Research Council Authority of Shahid Beheshti University of with the code of IR.SBMU.RAM.REC.1395.110.
The researchers hereby appreciate the authorities of Nursing and Midwifery faculty, affiliated hospitals of Shahid
Beheshti University of Medical Sciences and all colleagues participated and cooperated in this project.
References

Annals of Tropical Medicine & Public Health-Special Issue Mar 2018 Vol V
S201-18
1. Matin M., Parvin N., Reisi S., Deris F. and Reisi M. H. The study of the relationship between nurses and patients in Hajar
hospital wards of Shahrekord in 2010. Journal of Clinical Nursing and Midwifery. 2012; 1 (2):1-8 (Persian).
2. Fakhr-Movahedi A., Salsali M., Negharandeh R. and Rahnavard Z. Exploring contextual factors of the nurse-patient
relationship: A qualitative study. Koomesh. 2011; 13 (1): 23-34. (Persian).
3. Coughlan M., Cronin P. and Ryan F. (2013)." Doing a Literature Review in Nursing, Health and Social Care”. 1ST
edition.
SAGE Publication.
4. Deborab M. and Nadzam P. (2009). “Nurse role in communication and patient safety”. Journal Nursing Care. 24 (3):184-
188.
5. Sadeghi T., Dehghan Nayyeri N. and Karimi R. Nursing-patient relationship: a comparison between nurses and
adolescents perceptions. ijme. 2011; 4 (3):69-78. (Persian).
6. Bakker D.A., Fitch M.I., Gray R., Reed E. and Bennett J. (2001). “Patient-health care provider communication during
chemotherapy treatment: the perspectives of women with breast cancer.” Northeastern Ontario Regional Cancer
Center. 43(1):61-71.
7. Heidarpour P., Dastjerdi R., Rafii S. and Sadat M., et al. Tehran: Tandis Publisher; 2011. Understanding the principles of
clinical governance, printing, publishing Trophy.
8. Zaidabadi S. [Audit respect for patient safety in hospital emergency departments martyr Beheshti University of Medical
Sciences in Tehran in 2013]. To obtain a master's degree, School of Nursing. Martyr Beheshti University of Medical
Sciences, Tehran, Iran.
9. Lancaster M. (2013) [Nursing issues in leading and managing changes] London, Mosby co.
10. Yaghobian M. (2013). [Nursing Management]. Second edition. Tehran. Bushra publication.
11. Jairus R. and Walia I. (2011) "Nursing audit". The Nursing Journal of India. 102(7): 157-160.
12. Hossein, M.M. (2012). [Principles of nursing management]. First Edition. Tehran. Publishing and promoting Bashari.
13. Mohtashami J. and Nvghaby F. (2010). [Textbook of Psychiatric Nursing]. Tehran. Tymurzadeh Atsharaty Cultural
Institute. Nashr Tabyb.
14. Aqajani S. and Asadi Noghabi A. (2008). [Mental health first]. First Edition. Tehran. Publishing and promoting Bashari
15. Moghimian M. and Salmani F. Comparative Study of the Influence of Communication Skill with Psychiatric Patients using
Wilkinson- Shimizu Method and Traditional Method on Anxious Thoughts of Nursing Students. IJN. 2012; 25 (78):42-51.
(Persian).
16. Aghajani M. and Dehghannayeri N. The rate of observe "various dimensions of Patients Privacy" by treatment team.
ijme. 2009; 2 (1): 59-70. (Persian).
17. Kashani F., Moghimian M., Salarvand SH. and Kashani P. [Nurses' knowledge, Attitude, Practice about Effective
Communication Skills in Patient Education]. J Res Dev Nurs Midwifery. Autumn & Winter 2015; 12(2): 59- 67) Persian .(
18. Sarkhil H., Darvishpoor-Kakhaki A. and Borzabadi-Farahani Z. [Respecting patient’s privacy in cardiac care units of
Tehran›s selected hospitals]. Cardiovascular Nursing Journal 2013; 2(2(: 40- 47(Persian).
19. Karro, J. et al. (2005). Patient perceptions of privacy infringements in an emergency department. Emergency Medicine
Australia. 17(2) 117-123.
20. Fleischer S., Berg A.,Zimmermann M., Wuste K. and Behrens J. Nurse patient interaction and communication: A
systematic literature review. J public Health. 2009; 17:339-353.
21. Dehghani-Mobarakeh M., Maghsoudi A., Malekpour-Tehrani A and Rahimi-Madiseh M. The viewpoints of members of
medical teams about patients’ privacy. Journal of Clinical Nursing and Midwifery. 2013; 2 (1):9-17. 22. Coiera WE., Jayasvrixa AR., Hardy J., Bannan A. and Thorpe EC. Max. Communication loads on clinical staff in Emergency
department. Med J. Australia. 2002 May; 176(9): 415-418.
23. Safavi M., Ghasemi Panjah S., Fesharaki M. and Esmaeilpour Bandboni M. Communication Skills and Its Related Factors
in Guilans Teaching Hospitals' Nurses 94. Sci J. Hamadan Nurs Midwifery Fac. 2016; 24(1):50-57. (Persian).
24. Gholami H., Sarhangi F., Mokhtari Nouri J. and Javadi M. Nurses’ communication skills in military hospitals. J Nurse
Midwife Sci. 2015; 2(1):40-5.
25. Taghizadeh Z., Rezaiepour A., Mehran A. and Alimoradi Z. Usage of communication skills by midwives and its relation to
clients’ satisfaction. Hayat. 2006; 12(4):47- 55. (Persian).
26. Siamian H., Bagheri-Nesami M., Nia R.D., Nezhad F.R. , Akbari H., Balaghafari A., et al. Barati M., Afsar A. and
Ahmadpanah M. [Assessment of Communication Skills Level among Healthcare Practitioners] Sci J Hamadan Univ Med
Sci. 2013;19(1): 62-9. (Persian).
27. Hendricks-Ferguson V.L., Sawin K.J., Montgomery K., Dupree C., Phillips-Salimi C.R. and Carr B., et al. Novice Nurses’ Experiences with Palliative and End-of-Life Communication. J Pediatr Oncol Nurs. 2015; 32(4):240-52.
28. Barati M., Moini B., Afsar A., Ahmad Panah M. Professional communication skills of medical practitioners’ city in the
spring of 2010. Sci J Hamdan Univ Med Sci. 2012; 19(1): 62-69. (Persian).
29. Pope C.A., Escobar-Gomez M., Davis B.H., Roberts J.R., O’Brien E.S. and Hinton E, et al. The challenge of tetradic
relationships in medically interpreted pediatric primary care visits: A descriptive study of communication practices.
Patient Educ Couns. 2016; 99(4):542-8.

Annals of Tropical Medicine & Public Health-Special Issue Mar 2018 Vol V
S201-18
30. Godarze Z., Darvesh A., and Neli F. [Assess the quality verbal communication with children under three years of
treatment in hospital]. Shahid Beheshti Nurse Midwife Fac. 2009; 19(67):13-20(Persian).
31. Mahmoodi H., Soori-laki A., Boulhasani M. and Sepahvand MJ. The relationship between use of communication skills
and job satisfaction of nurses. Scientific-Research Journal of Shahed University 2012; 20(101): 77-82. (Persian).
32. Arranz P., Ulla SM, Ramos JL., Del Rincon C. and LopezFando T. Evaluation of a counseling training program for nursing
staff. Patient education and counseling. 2005; 56(2):233-9. 33. Kalliope Kounenoua, Koumoundourou G. Nurses’ communication skills: Exploring their relationship with demographic
variables and job satisfaction in a Greek sample. Social and Behavioral Sciences; 2011: 30 (2011):2230 – 2234.
34. Davis H. The effects of communication /counseling in medical practice: an evaluation. Journal of the Royal Society of
Medicine. 1994; 87(7):429-431.
35. Namdar H., Rahmani A. and Ebrahimi H. [The Effect of a Skill-Training Model on Nursing Students' Skills in
communicating with mental patients]. Iranian Journal of Medical Education 2009; 8(2): 323-332. (Persian).
36. Tongue JR., Epps HR. and Froese LL. Communication skills for patient-centered care. The Journal of Bone & Joint
Surgery. 2005; 87(3): 652-8
37. Mirkamli M. and Nastiezaie N. The relationship between Psychological Empowerment and job satisfaction of nursing
personnel. Journal of Urmia Nursing and Midwifery Faculty.2011; 8(2):104 -113. (Persian).
38. Zahedi M., Palahang H and Ghafari M. Job satisfaction among health personnel in Chaharmahal & Bakhtiari
province, 1998 -99. Journal of Shahrekord University of Medical Sciences. 2000;2(1):27- 33.(Persian)
39. Mirzabeigi G., Sanjari M. and Heidari S. Job Satisfaction among Iranian Nurses. Hayat. 2009;15(1):49 -59(Persian)
40. Sabzevari S., Soltani Arabshahi K., Shekarabi R. and Koohpayehzadeh J. [Using students’ communication with patients in
hospitals affiliated to Kerman University of Medical Sciences] Iranian Journal of Medical Education 2006; 6(1): 43-49.
(Persian)
41. Mirhaghjou S. N., Nayebi N., Majd Teymouri R. and Kazemnejad leily E. [Communication skills and related factors within
patient by nursing student]. J Holist Nurse Midwifery. 2015; 25 (2):93-101(Persian).
42. Rana D. and Upton D. Psychology for nurses. Harlow: Pearson Hig J. Holist Nurse Midwifery. 2015; 25 (2):93-101her
education; 2009.
43. Ramezanli S., Kargar M., Talebizadeh M., Taheri L. and Zahedi R. Barriers of Nurse-patients effective Communication
from nurse's viewpoint. Journal of Education and Ethics in Nursing. 2014; 2(4): 1- 6.

Annals of Tropical Medicine & Public Health-Special Issue Mar 2018 Vol V
S201-18
Effects of Herbal Combination of Securigera securidaca, Vaccinium
arctostaphylos, Citrullus colocynthis and Coriandrium sativum on Fasting
Blood Sugar in Pre-Diabetic Elderly People
Zinat Shababi1, Shahnaz Pouladi
2*, Alirez Raeisi
3, Niloofar Motamed
4, Samad Jelodar
5, Fatemeh
Hajinezhad6, Mohammad Reza Farzaneh
7
1. MS Student in Nursing, Student Research Committee, Faculty of Nursing and Midwifery, Bushehr University of
Medical Sciences, Bushehr, Iran
2. Assistant Professor in Department of Nursing, Faculty of Nursing and Midwifery, Bushehr University of Medical
Sciences, Bushehr, Iran
3. Associate Professor in Department of Medicine, Faculty of Medicine, Bushehr University of Medical Sciences,
Bushehr, Iran
4. Associate Professor in Department of Social Medicine, Bushehr University of Medical Sciences, Bushehr, Iran
5. General practitioner, PhD student of traditional medicine, Bushehr, Iran
6. Lecturer, Master of Nursing, Department of Nursing, Faculty of Nursing and Midwifery, Bushehr University of
Medical Sciences, Bushehr, Iran
7. Assistant Professor in Department of Pathology, Faculty of Medicine, Bushehr University of Medical Sciences,
Bushehr, Iran
*Corresponding Author: Shahnaz Pouladi, Postal code: 7518759577, TEL in the workplace: 07733457187
ABSTRACT
Background and objectives: According to complications and inefficiency of pharmaceutical drugs in some
cases, the use of herbs in improving blood sugar has always been attracted the attention of researchers.
Therefore, the aim of present study was to investigate the effects of herbal combination of
Securigerasecuridaca, Vacciniumarctostaphylos, Citrulluscolocynthis and Coriandriumsativum on fasting
blood sugar in pre-diabetic elderly people.
Materials and methods: In this single-blind randomized controlled trial, 60 pre-diabetic elderly patients
aged 60-70 years with fasting blood sugar levels between 100 and 125 mg/dL were randomly divided into
two groups of 30 subjects (drug and placebo). The patients in drug group received diet with 500-mg herbal
capsules once a day and placebo group was administered by diet with placebo capsules (500 mg of flour) for
the same period. After 30 days, fasting blood sugar levels were assessed in both groups. The data were
analyzed using SPSS version 18 software.
Results: Based on the results of this study, after 30 days intervention, the fasting blood sugar level in the
group received herbal capsules was significantly decreased compared to before the intervention (p =0.007),
while the fasting blood sugar level and mean changes before and after the intervention were not
significantly different between the two groups.
Conclusion: Due to the lack of effect of 30-day herbal combination intervention on fasting blood sugar in
elderly people, it is recommended to be conducted further studies with regard to drug dosage and usage
duration of medicinal plants.
Keywords: Elderly, Pre-diabetes, Securigerasecuridaca, Vacciniumarctostaphylos, Citrulluscolocynthis,
Coriandriumsativum
INTRODUCTION
Elderliness or aging is not a disease but is a vital phenomenon that involves everyone and in fact is a natural process
in which physiological and psychological changes occur in the body (1). As the elderly population is rising, the risk
of chronic diseases can be increased such as heart degenerative diseases, cancers, diabetes, hyperlipidemia, chronic
respiratory disease, chronic musculoskeletal disorders (MSDs), digestive disorders, and neuropsychiatric
diseases. Therefore, the elderly individuals over 60 years are often suffering from at least one chronic disease (2,
3). Diabetes is the seventh known cause of death around the world (3). Pre-diabetes is of the early stages of diabetes
and a condition where blood sugar level though is not in the normal range, but still not considered diabetes. At this
stage, the body is forced to produce insulin at higher than normal levels to regulate the blood sugar. The fasting

Annals of Tropical Medicine & Public Health-Special Issue Mar 2018 Vol V
S201-18
blood sugar range is between 100 to 125 mg/dl in the pre-diabetes stage or before the diabetes, or between 140 to
199 mg/dl two hours after a glucose tolerance test (GTT) with 75 g glucose. Pre-diabetes status, even without
turning into diabetes, increases the risk of complications such as cardiovascular disease (4). Pre-diabetes in healthy
people with obesity and overweight can be one of the early indicators of before the onset of diabetes (5). Studies
have indicated that lifestyle, adherence to a proper diet, physical activity, and use of some medicines play an
important role to control the disease and prevent more developed stages (diabetes) (4). Given that the pre-diabetic
patients have the highest risk of diabetes, and assessing and evaluating these people in the care system of the country
is limited to once a year as well as implementation of interventions in this regard is limited, respective intervention
in this field appears to be necessary (6). In addition, due to the age and poor health conditions in elderly,
investigation of non-invasive, effective, safe and acceptable therapeutic methods that are able to maintain and
restore their abilities can be a great help to return the patients to normal life. Nowadays, traditional and herbal
medicine is of the most favorite therapies to treat the disease (7). Although the medicinal plants and their derivatives
are used in treating the diabetes mellitus and its complications for a long time, but there is no evidence and credible
research on the decisive effectiveness of many of them (8). Securigerasecuridaca, Vacciniumarctostaphylos,
Citrulluscolocynthis and Coriandriumsativum can be mentioned as the medicinal plants that seem to play an
important role in the treatment and control of diabetes. The reason for choosing these four sources of plant according
to traditional medicine was based on this hypothesis that if these four medicinal plants are used simultaneously in a
combination form, they could have a synergistic effect and neutralize each other's toxic effects (9). Of these four
medicinal plants, Citrulluscolocynthis has laxatives properties (10), and Coriandriumsativum and
Vacciniumarctostaphylos have anti-diarrhea properties (11, 12); that is why, the Vacciniumarctostaphylos and
Coriandriumsativum were combined with Citrulluscolocynthis to treat diarrhea complication of
Citrulluscolocynthis. Several clinical studies with different results about the effects of these herbs have been
published. Many studies on animals have indicated that these herbs are lowering the blood sugar and blood lipids
and have other biological effects (13-18), but the number of studies on human about the effects of medicinal plants
is limited, and there is no consensus about the blood sugar-lowering effects of these plants in studies on human. The
study of Fallah Hosseini et al. (2006) on patients with type 2 diabetes demonstrated that Securigerasecuridaca plant
had no impact on blood sugar (19), while Ibrahim et al. (2013) reported that this herb contains 19 amino acids that
lower the blood sugar (20). Obidov et al. (2006) showed that the plant Vacciniumarctostaphylos in addition to the
anti-diabetic effects has also the anti-inflammatory properties (21). Study of Fallah Hosseini et al. (2006) indicated
that Citrulluscolocynthis could decrease the blood sugar (22). Gray and Flatt (1999) found that Coriandriumsativum
causes the release of insulin and has an insulin-like activity (23). Despite the studies performed on this herb in
humans and laboratory animals and their different results and due to the presence of substances with synergistic or
neutralizing effect on the complications of medicinal plants, there is still no conducted study evaluating the effects
of combination of these plants. Therefore, the current study was designed to investigate the effect of herbal
combination of Securigerasecuridaca, Vacciniumarctostaphylos, Citrulluscolocynthis and Coriandriumsativum on
fasting blood sugar of pre-diabetic elderly people.
Material and methods
Preparation of the herbal capsules and placebo:
After preparing the plants of Securigerasecuridaca, Vacciniumarctostaphylos, Citrulluscolocynthis and
Coriandriumsativum, the samples were powdered; then 125 mg of the each plant was used to provide the 500-mg
capsules. Placebo capsules were prepared similar in shape and color compared to the herbal capsules but without
drugs, so that the ingredients of 500-mg placebo included flour, which has no effect on blood sugar. Based on
traditional medicine, combination of these four medicinal plants should contain equal amounts of them in the
capsule.
This single-blind placebo-controlled clinical trial with two groups was conducted on 60 pre-diabetic elderly people
in Bushehr, Iran. Basic information to determine the sample size was obtained based on other studies and
comparison of the treatment and control groups using the following equation:
Annals of Tropical Medicine & Public Health-Special Issue Mar 2018 Vol V
S201-18
With considering 95% confidence level, 80% power and respective succession information in the above-mentioned
equation, the sample size in each group was calculated 26 patients; by taking into account 10% attrition, 60 patients
(30 patients in each group) were enrolled in the study. The present study was carried out with approval of the
Research Ethics Committee of Bushehr University of Medical Sciences and Health Services, and with an ethical
code of bpums.rec.1394.24. In order to adherence to the ethical considerations, the patients signed a consent form
after explanation of the effects and possible side effects of the drug. The patients also were assured that in case of
any complication event, they have right to discontinue their participation in the study. The samples were taken after
registering the study in the Iranian Registry of Clinical Trials with a code of IRCT2015080822466N2. Inclusion
criteria were age between 60 to 70 years, fasting blood sugar between 100 and 125 mg/dl, willingness to participate
in the study and having an attendant that was able to adequately follow up, being mentally conscious and able to
communicate verbally and respond to questions and presenting training and dietary advice to participants by
researchers. Exclusion criteria included a history of taking blood sugar-lowering medications within two weeks
before study, history of active cardiovascular disease and liver disease. In this study, demographic and medical
information including age, gender, height, weight, body mass index, physical activity, educational level, occupation,
gastrointestinal symptoms and consumed medications (if necessary) were collected using a self-describe checklist in
a form of pre and post. Information on the results of laboratory values was also recorded in the mentioned
questionnaire. Participants were selected out of those that referred to the diabetes clinic located in the Haft-e-Tir
clinic and Mehr laboratory to perform blood glucose screening tests. The Haft-e-Tir clinic was selected because the
diabetes clinic of the Bushehr city in Iran was located in this clinic and people over 30 years old had referred to this
center to perform blood sugar screening tests and had documents there whose access was easier. The Mehr
laboratory was chosen because the tests were supposed to be performed there. In order to implementation of the
study, researcher referred to the diabetes clinic located in the Haft-e Tir clinic, and information including name, age,
gender, previous medical history, consumed medications and contact number were recorded from the documents of
those who referred to perform blood sugar screening tests and had inclusion criteria. The researcher also referred to
the Haft-e Mehr laboratory and reviewed the archived test results of the last month; information on the people, who
had the inclusion criteria, including name, age and contact number was recorded by researcher and these people
were called by the faculty of Nursing and Midwifery, and the study procedure was described for them. Those who
were willing to participate in the study were asked to be fasting 10-12 hours before the test and refer to blood
sampling room in the diabetes clinic of the Haft-e Mehr clinic in order to perform venipuncture. Followed by
overnight fasting for 12-10 hours, 2.5 ml of venous blood sample was collected from each patient on days 0 and 31.
After separating serum, blood sugar was measured by enzymatic method using Pars Azmoon kits and Cell Extra XL
1000 device. After 24 hours, the test results were given to the researchers and the patients were recalled again and
asked to refer to the Diabetes Clinic of the Haft-e Tir clinic in order to receive their medications and diet form. At
the beginning of the intervention, individuals were randomly (based on random numbers obtained from the Excel
randomization software) divided into experimental and control groups. At this stage, the researcher presented the A
and B prepared packages containing 30 plant or placebo capsules to the research unit. The research units received
the necessary training on how to use the capsules, testing, the next visit, and side effects of medications and dietary
form that were previously prepared by the researcher. Based on the instruction for the capsules consumption, the
subjects were recommended to take one 500-mg capsule a day after breakfast or dinner. Patients were instructed
about the possible side effects (abdominal pain and diarrhea), so that in the case of having such symptoms, they can
use herbal Lomex Drop to resolve the abdominal pain and combination of low-fat yogurt and oak powder to treat the
diarrhea. To investigate the possible gastrointestinal side effects and adherence to diet and drug regimen, the
researcher contacted to the research units every other day, and reminded them to follow the diet and medication
regimen. Potential gastrointestinal side effects were recorded in research at a week after starting the intervention and
by the end of the intervention. During the days 25 to 28 of intervention, the participants were called and reminded to
refer to the diabetes clinic at the Haft-e Mehr clinic for blood sampling within 24 hours after taking the last
capsule. After data collection, data analysis was performed using SPSS version 18. Chi-square test was used to
assess the qualitative data, independent t-test was used to compare the difference in blood glucose between drug and
placebo groups and differences in blood glucose within a group was compare by paired t-test; if the variables had no
normal distribution, Wilcoxon and Mann-Whitney tests were used. The significance level was considered 0.05%.
RESULTS
At the beginning of the intervention, 51 out of 60 patients participated in the study remained in the study until the
end. Out of the 9 people who were excluded from the study, 5 patients were in the herbal capsules-receiving group

Annals of Tropical Medicine & Public Health-Special Issue Mar 2018 Vol V
S201-18
and 4 in the placebo group. The reason for excluding these peoples was the severe gastrointestinal complications in
herbal capsules group and absence at the second time of blood sampling in the placebo group.
Fig 1-CONSORT Flow Diagram
As seen in Table 1, there was no significant difference between the drug and placebo groups in terms of height, age
and physical activity duration, and the only significant differences between the two groups were the Body Mass
Index ( p =0.006) and weight ( p =0.03).
Control group (n =
30)
Placebo capsules and
diet
Experimental
group (n = 30)
Herbal capsules
and diet
Random
allocation
Lack of follow
up
(n=5)
Lack of follow
up
(n=4)
Analysis
(n=25)
Analysis
(n=26)
Selection of samples: 60
elderly patients aged 60-70
years referring to Haft-e Tir
diabetes clinic and Mehr
laboratory

Annals of Tropical Medicine & Public Health-Special Issue Mar 2018 Vol V
S201-18
Table 1-Comparison of quantitative demographic information of pre-diabetic elderly people between drug and placebo groups
Variables
Group
t P-Value
drug (Mean ± SD) Placebo (Mean ± SD)
Age 62.76 ± 3.19 62.12 ± 2.68 -0.78 0.43
Height 165.32 ± 7.81 166.73 ± 9.12 0.59 0.55
Weight 78.72 ± 11.52 71.88 ± 10.42 -2.22 0.03
Body Mass Index 28.77 ± 3.72 25.88 ± 3.48 -2.86 0.006
Activity duration 2.64 ± 0.69 2.80 ± 0.44 0.44 0.66
According to Table 2, 16 elderly people (64%) were female and 9 patients (36%) were male in the drug group and
the majority of them were housekeeper (64%), with less than high school education (56%) and without physical
activity (72%).In the placebo group, 15 of subjects (57.7%) were female, 11 (43.3%) were male and the majority of
them were housekeeper (53.8%) with less than high school education (34.6%) and without physical activity
(8/80%). There was no significant difference between the drug and placebo groups in terms of gender, occupation,
educational level and physical activity. There was only a significant difference in terms of body mass index between
the two groups (p=0.03).
Table 2-Comparison of qualitative demographic information of pre-diabetic elderly people between drug and placebo groups
Variables
Group
X2
P-value Drug
number (percentage)
Placebo
number (percentage)
Gender Female
Male
16 (64%)
9 (36%)
15 (57.7%)
11 (43.3%) 0.21 0.77*
occupation
Employee or retiree
Self-employed
housekeeper
4 (16%)
5 (20%)
16 (64%)
7 (26.9%)
5 (19.2%)
14 (53.8%)
0.93 0.62
Educational
level
Illiterate
High school diploma
Diploma
College education
6 (24%)
14 (56%)
3 (12%)
2 (8%)
6 (23.1%)
9 (34.6%)
7 (26.9%)
4 (15.4%)
3.33 0.34
BMI
Normal
Higher than normal
Obese
4 (16%)
14 (56%)
7 (28%)
12 (46.2%)
12 (46.2%)
2 (7.7%)
6.91 0.03
Physical activity Yes
No
7 (28%)
18 (72%)
5 (19.2%)
21 (80.8%) 0.545 0.52*
* Fisher's exact test
Annals of Tropical Medicine & Public Health-Special Issue Mar 2018 Vol V
S201-18
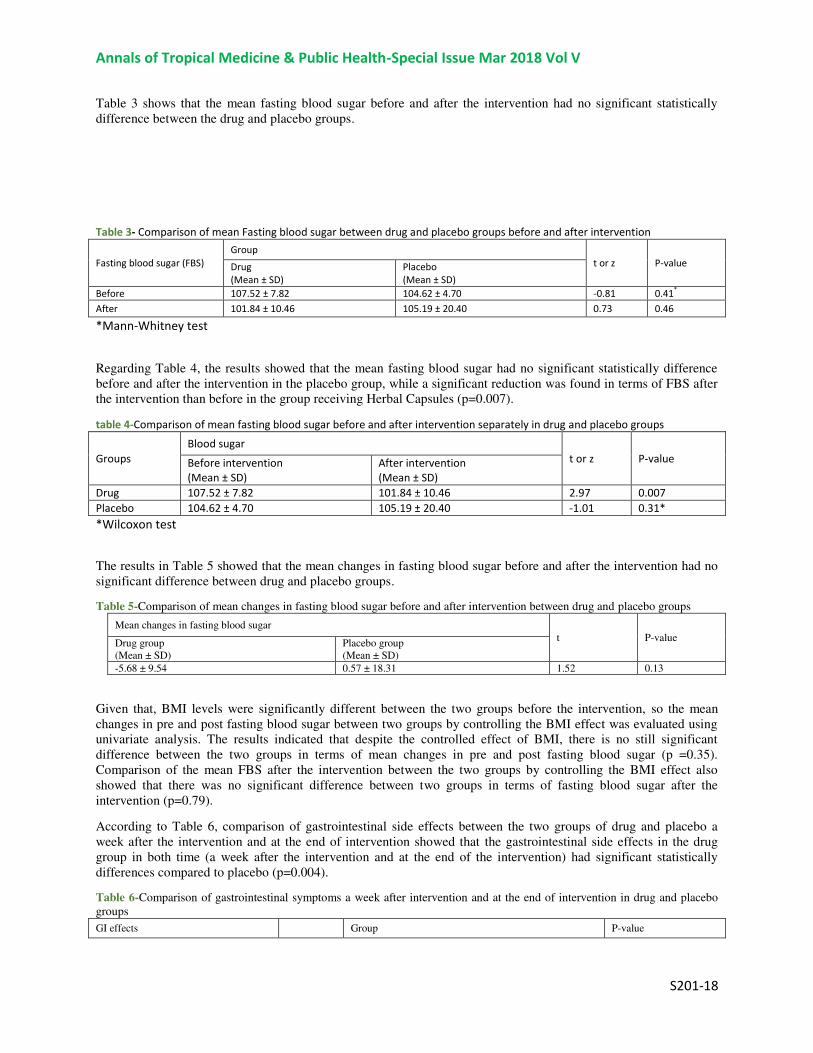
Table 3 shows that the mean fasting blood sugar before and after the intervention had no significant statistically
difference between the drug and placebo groups.
Table 3- Comparison of mean Fasting blood sugar between drug and placebo groups before and after intervention
Fasting blood sugar (FBS)
Group
t or z P-value Drug
(Mean ± SD)
Placebo
(Mean ± SD)
Before 107.52 ± 7.82 104.62 ± 4.70 -0.81 0.41*
After 101.84 ± 10.46 105.19 ± 20.40 0.73 0.46
*Mann-Whitney test
Regarding Table 4, the results showed that the mean fasting blood sugar had no significant statistically difference
before and after the intervention in the placebo group, while a significant reduction was found in terms of FBS after
the intervention than before in the group receiving Herbal Capsules (p=0.007).
table 4-Comparison of mean fasting blood sugar before and after intervention separately in drug and placebo groups
Groups
Blood sugar
t or z P-value Before intervention
(Mean ± SD)
After intervention
(Mean ± SD)
Drug 107.52 ± 7.82 101.84 ± 10.46 2.97 0.007
Placebo 104.62 ± 4.70 105.19 ± 20.40 -1.01 0.31*
*Wilcoxon test
The results in Table 5 showed that the mean changes in fasting blood sugar before and after the intervention had no
significant difference between drug and placebo groups.
Table 5-Comparison of mean changes in fasting blood sugar before and after intervention between drug and placebo groups
Mean changes in fasting blood sugar
t P-value Drug group
(Mean ± SD)
Placebo group
(Mean ± SD)
-5.68 ± 9.54 0.57 ± 18.31 1.52 0.13
Given that, BMI levels were significantly different between the two groups before the intervention, so the mean
changes in pre and post fasting blood sugar between two groups by controlling the BMI effect was evaluated using
univariate analysis. The results indicated that despite the controlled effect of BMI, there is no still significant
difference between the two groups in terms of mean changes in pre and post fasting blood sugar (p =0.35).
Comparison of the mean FBS after the intervention between the two groups by controlling the BMI effect also
showed that there was no significant difference between two groups in terms of fasting blood sugar after the
intervention (p=0.79).
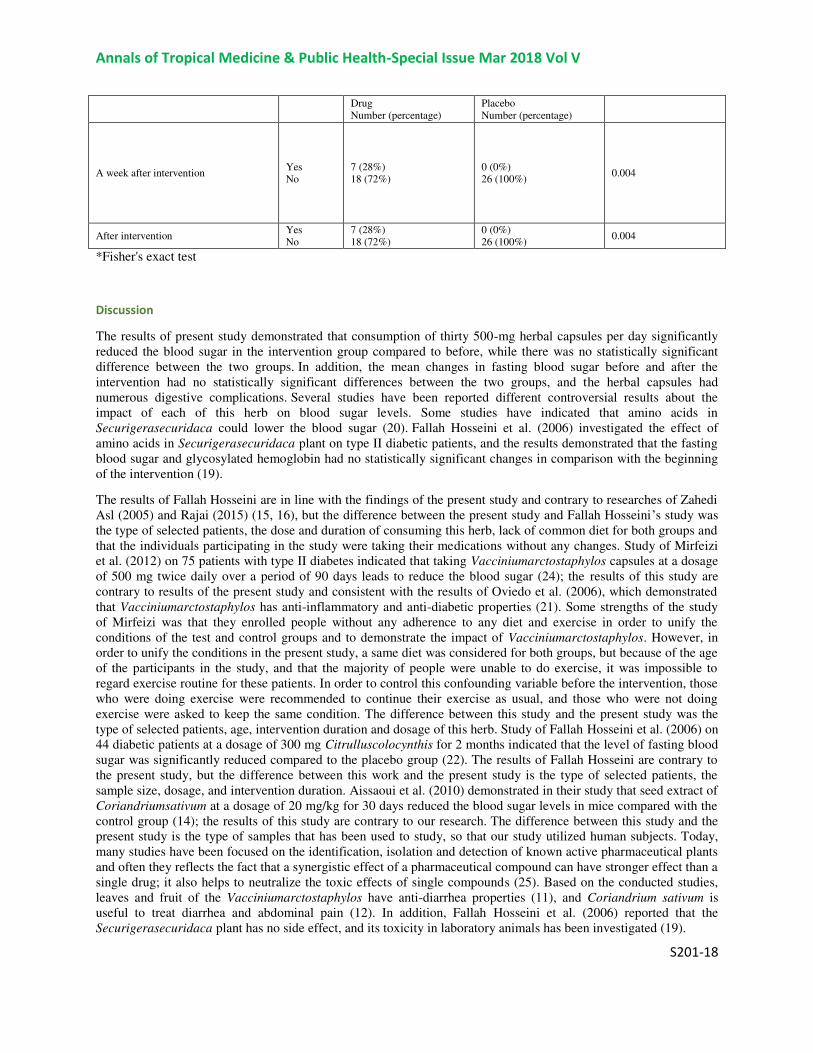
According to Table 6, comparison of gastrointestinal side effects between the two groups of drug and placebo a
week after the intervention and at the end of intervention showed that the gastrointestinal side effects in the drug
group in both time (a week after the intervention and at the end of the intervention) had significant statistically
differences compared to placebo (p=0.004).
Table 6-Comparison of gastrointestinal symptoms a week after intervention and at the end of intervention in drug and placebo
groups
GI effects Group P-value
Annals of Tropical Medicine & Public Health-Special Issue Mar 2018 Vol V
S201-18
Drug
Number (percentage)
Placebo
Number (percentage)
A week after intervention Yes
No
7 (28%)
18 (72%)
0 (0%)
26 (100%) 0.004
After intervention Yes
No
7 (28%)
18 (72%)
0 (0%)
26 (100%) 0.004
*Fisher's exact test
Discussion
The results of present study demonstrated that consumption of thirty 500-mg herbal capsules per day significantly
reduced the blood sugar in the intervention group compared to before, while there was no statistically significant
difference between the two groups. In addition, the mean changes in fasting blood sugar before and after the
intervention had no statistically significant differences between the two groups, and the herbal capsules had
numerous digestive complications. Several studies have been reported different controversial results about the
impact of each of this herb on blood sugar levels. Some studies have indicated that amino acids in
Securigerasecuridaca could lower the blood sugar (20). Fallah Hosseini et al. (2006) investigated the effect of
amino acids in Securigerasecuridaca plant on type II diabetic patients, and the results demonstrated that the fasting
blood sugar and glycosylated hemoglobin had no statistically significant changes in comparison with the beginning
of the intervention (19).
The results of Fallah Hosseini are in line with the findings of the present study and contrary to researches of Zahedi
Asl (2005) and Rajai (2015) (15, 16), but the difference between the present study and Fallah Hosseini’s study was
the type of selected patients, the dose and duration of consuming this herb, lack of common diet for both groups and
that the individuals participating in the study were taking their medications without any changes. Study of Mirfeizi
et al. (2012) on 75 patients with type II diabetes indicated that taking Vacciniumarctostaphylos capsules at a dosage
of 500 mg twice daily over a period of 90 days leads to reduce the blood sugar (24); the results of this study are
contrary to results of the present study and consistent with the results of Oviedo et al. (2006), which demonstrated
that Vacciniumarctostaphylos has anti-inflammatory and anti-diabetic properties (21). Some strengths of the study
of Mirfeizi was that they enrolled people without any adherence to any diet and exercise in order to unify the
conditions of the test and control groups and to demonstrate the impact of Vacciniumarctostaphylos. However, in
order to unify the conditions in the present study, a same diet was considered for both groups, but because of the age
of the participants in the study, and that the majority of people were unable to do exercise, it was impossible to
regard exercise routine for these patients. In order to control this confounding variable before the intervention, those
who were doing exercise were recommended to continue their exercise as usual, and those who were not doing
exercise were asked to keep the same condition. The difference between this study and the present study was the
type of selected patients, age, intervention duration and dosage of this herb. Study of Fallah Hosseini et al. (2006) on
44 diabetic patients at a dosage of 300 mg Citrulluscolocynthis for 2 months indicated that the level of fasting blood
sugar was significantly reduced compared to the placebo group (22). The results of Fallah Hosseini are contrary to
the present study, but the difference between this work and the present study is the type of selected patients, the
sample size, dosage, and intervention duration. Aissaoui et al. (2010) demonstrated in their study that seed extract of
Coriandriumsativum at a dosage of 20 mg/kg for 30 days reduced the blood sugar levels in mice compared with the
control group (14); the results of this study are contrary to our research. The difference between this study and the
present study is the type of samples that has been used to study, so that our study utilized human subjects. Today,
many studies have been focused on the identification, isolation and detection of known active pharmaceutical plants
and often they reflects the fact that a synergistic effect of a pharmaceutical compound can have stronger effect than a
single drug; it also helps to neutralize the toxic effects of single compounds (25). Based on the conducted studies,
leaves and fruit of the Vacciniumarctostaphylos have anti-diarrhea properties (11), and Coriandrium sativum is
useful to treat diarrhea and abdominal pain (12). In addition, Fallah Hosseini et al. (2006) reported that the
Securigerasecuridaca plant has no side effect, and its toxicity in laboratory animals has been investigated (19).

Annals of Tropical Medicine & Public Health-Special Issue Mar 2018 Vol V
S201-18
Citrulluscolocynthis out of these medicinal plant is the only plant that in case of using at the higher dosages of 400
mg/kg could cause gastrointestinal side effects (diarrhea and abdominal pain) (26). However, the dosage of
Citrulluscolocynthis in the present study was 125 mg, but it caused severe gastrointestinal side effects; while in the
study of Fallah Hosseini (22) and Rahbar (27), the used dosage of Citrulluscolocynthis was 300 mg, but no
gastrointestinal symptoms were reported. Therefore, it is likely that the combination of Citrulluscolocynthis and
Securigerasecuridaca plants has synergistic effects and causes severe gastrointestinal side effects. Overall, this
study provides evidence that taking these herbal capsules have no effect on blood sugar that several factors can be
involved in the cause of these results. The impact of each of these plants in different populations depending on
various races and even in different individuals with different genetic factors, which each of them can play a different
role in the development of prediabetes, are inconsistent with each other. In addition, in different studies depending
on the dosage of each herb, the intervention duration and different sample sizes, contrary results have been reported.
Probably, if the dosage of herbal ingredients used in the study were more or if the duration of intervention were
longer than 30 days, there would be statistically significant difference between the two groups.
In the current research, same diet was administered for both groups in order to unify the conditions of the study and
control of confounding variables, but there is possibility that none of the subjects were adhered to this regime. In
addition, due to the age of people, it was impossible to consider the same exercise routine to all of them. However,
there is a hypothesis that people in the control group have received training other than one given by the researcher,
which could underlie no significant difference between the two groups, and it could be considered as the limitations
of the study.
Conclusion
By comparing findings of this research with the results of other studies and mentioned restrictions in conducted
researches compared to the present study, it seems that the different dosage and usage duration of these medicinal
plants are effective on blood sugar.Because in the studies that were inconsistent with our results or used higher
dosage and longer usage duration, it appears that these herbal capsules may be effective in reducing blood sugar
levels if the drug dosage were higher or usage duration were longer.Therefore, due to limitations of the present study
and the different results reported in various studies, further investigations are needed on the glucose-lowering role
and gastrointestinal side effects of the herbal combination.
cknowledgment
The authors would like to appreciate and thank Deputy Research of BushehrUniversity of Medical Sciences in Iran,
authorities of Bushehr Faculty of Nursing and Midwifery, Clinical Research Development Center of Persian Gulf
Martyrs' Hospital of Bushehr and all the elderly people who helped us out to conduct the present study.
Deputy Research of Bushehr University of Medical Sciences in Iran funded the present study that was adapted from
MS thesis in nursing with a project code of 2652.
Conflict of interest
The authors declare that there is no conflict of interest.
References
1. Zahmatkeshan N, Bagherzade R, Akaberiyan SH,et al.Assessing Quality of Life and Related Factors in Bushehrs Eldery People.
J Fasa Univ Med Sci.2012;3)2(:53-58. (persian).
2. Totonchi P. Frequency of chronic diseases and disabilities associated with aging characteristics of the elderly under Emam
Khomeini Relief Committee of Tehran and its determinants. Payesh Health Monit. 2004; 3 (3): 225-234. (persian)
3. Mirfeizi M, Mehdizadeh Tourzani Z, Mirfeizi SZ,et al. Effect of cinnamon on controlling blood glucose and lipids in patient
with type2 diabetes mellitus:A double blind randomized clinical trail. Med J Mashad Univ Med Sci. 2014;57(3):533-541.(persian)
4. Yazdani A, Mansourian M, Faghihimani E,et al. The Effects of Macronutrient Intake on the Risk of Pre-Diabetes in First-Degree
Relatives of Patients with Type 2 Diabetes. J Isfahan Med Sch. 2014;32(301):1-12. (persian)
Annals of Tropical Medicine & Public Health-Special Issue Mar 2018 Vol V
S201-18
5. Rahmanian K, Shojaei M. Pre-diabetes and Pre-hypertension in healthy non smoking adults. Journal of zabol university of
medical sciences and health services. 2012; 4 (1) :66-80. (persian).
6. Bahmani A. Islamic fasting and its effect on pre-diabetic. Sci J Kurdistan Univ Med Sci. 2013;18(1):40-46. (persian)
7. Hosseini SH, Amoghli Tabrizi B, Mazlom Mogaddam SSR. Evaluation at Ginseng on Lipid Profiles, Liver and Renal Markers in
Diabetic Rats. J Zanjan Univ Med Sci. 2010;19(75):11-17. (persian)
8. Mirfeizi M, Mehdizadeh Tourzani Z, Rezvani HR,et al. The effects of whortleberry on controlling of blood glucose and lipids in
patients with type II diabetes: A randomized controlled trial.J Army Univ Med Sci I.R. Iran. 2012;10(3):225-231. (persian)
9. Aghili Khorasani M.Makhzan Aladvyeh.Editor: Mohammad Reza Shams ed. Tehran: Tehran university of medical sciencese,
Andisheh Zehour;2010.(Persian)
10. Emami M, Fasihi Sh, Mehrgan A.Reference books on medicinal plants. First Edition.Tehran: Andisheh Avar Publication(with
cooperation abzh publication);2010.(Persian)
11. Roghani M, Baluchnejadmojarad T, Taheri S. The Effect of Feeding With Aerial Part of Vaccinium myrtillus on Blood Glucose
and Lipids of Diabetic Rats. Iran J Diabetes Lipid Disord. 2007;7(2):151-158. (Persian)
12. Heidari M, Norouzzadeh R. Medicinal Plants(Nursing and patient education). Tehran: Jamea negar publication;
2014.(Persian)
13. Mahmoodi M, Sayyadi A, HosseiniZijoud S,et al. Survey on the Effects of Different Concentrations of Citrullus Colocynthis
Fruit Powder on some of the Blood Biochemical Factors in Normal and Diabetic Male Rats.J Rafsanjan Univ Med Sci.
2012;11(1):11-20. (persian)
.14 Aissaoui A, Zizi S, Israili ZH,et al. Hypoglycemic and hypolipidemic effects of Coriandrum sativum L. in Meriones shawi rats. J
Ethnopharmacol. 2011;(137):652-661.
15. Rajaei Z, Moradi R, Ghorbani A, et al. Antihyperglycemic and antihyperlipidemic effects of hydroalcoholic extract of
Securigera securidaca seeds in streptozotocin-induced diabetic rats. Adv Biomed Res. 2015;4(1):33.
16. Zahedi-Asl S, Marahel H, Zaree B. Study on the Effects of Chloroformic Extract of Securigera Securidaca on Serum Glucose
Level and Liver Glycogen Content of Mice.J Kerman Univ Med Sci.2005;12(1):32-38. (persian)
17. Fathi Azad F, Allaf Akbari N, Zakheri A, et al. Hypolipidemic and antioxidant effects of Securigera securidaca L. seed in high
fat fed rats. Iran J Pharm Sci.2010;15(4):293. (persian)
18. Kianbakht S, Hajiaghaee R. Anti-hyperglycemic Effects of Vaccinium arctostaphylosL. Fruit and Leaf Extracts in Alloxan-
Induced Diabetic Rats. J Med Plants. 2013;12(45):43-50.
19. Fallah Huseini H, Hooseini P, Heshmat R, et al. The Clinical Investigation of Securigera securidaca (L.) (Degen & Doerfler)
Seeds in Type II Diabetic Patients a Randomized, Double-Blind, Placebo-Controlled Study. J Med Plants ournal of Medical Plants.
2006; 4 (20) :75-79. (persian)
20. Sadat-Ebrahimi SE, Hassanpoor Mir M, Amin GR, et al. Identification of amino acids in Securigera securidaca, a popular
medicinal herb in Iranian folk medicine. Research Journal of Pharmacognosy (RJP)1. 2014;1:23-26
21. Abidov M, Ramazanov A, Jimenez Del Rio M, et al. Effect of Blueberin on fasting glucose, C-reactive protein and plasma
aminotransferases, in female volunteers with diabetes type 2: double-blind, placebo controlled clinical study. Georgian Med
News. 2006; (141): 66-72.
22. Fallah Huseini H, Zaree A, Heshmat R, et al. The effect of Citrullus colocynthis (L.) Schrad. fruit on oxidative stress
parameters in type II diabetic patients. J Med Plants. 2006; 1 (S2) :55-60. (persian)
23. Gray A, Flatt PR. Insulin-releasing and insulin-like activity of the traditional anti-diabetic plant Coriandrium
sativum(coriander). British Journal of Nutrition. 1999; 81(3): 203-209.
24. Mirfeizi M, Mehdizadeh Tourzani Z, Asghari Jafarabadi M,et al. The effects of whortleberry on controlling of blood glucose
and lipids in patients with type II diabetes: A randomized controlled trial. J Army Univ Med Sci IR Iran.2012;10(3):225-231.
(Persian)

Annals of Tropical Medicine & Public Health-Special Issue Mar 2018 Vol V
S201-18
25. Ahmed S, Anuntiyo J, Malemud CJ, et al. Biological basis for the use of botanicals in osteoarthritis and rheumatoid arthritis:
a review. Evidence-Based Complementary and Alternative Medicine. 2005;2(3):301-308.
26.Ahangarpour A, Oroojan A.A. Effect of Crust and Seed’s Aqueous Extract and Hydro-Alcoholic Extracts of Crust, Seed and
Pulp of Citrullus Colocynthis on Lipid’s Factors and Hepatic Enzyme in Fructose-Fed Male Rats. J Babol Univ Med Sci.
2012;14(4):53-60. (Persian)
27. Rahbar A.R , Nabipour I. The Hypolipidemic Effect of Citrullus on Patients with Hyperlipidemia. Pak J Biol Sci.
2010;13(24):1202-1207.

Annals of Tropical Medicine & Public Health-Special Issue Mar 2018 Vol V
S202-18
The Effectiveness of Acceptance and Commitment Therapy
on Mental Health and Psychological Well-being in Female
Breast Cancer Patients
Parvin Abbasi1, Mehnoosh Timareh
1, Marziyeh Kaboudi
2,* Fateme Dehghan
1, Elham Fakhri
3
.Department of Nursing, School of Nursing and Midwifery, Kermanshah University of Medical Sciences,
Kermanshah, IRAN 2. Department of Midwifery, School of Nursing and Midwifery, Kermanshah University of Medical Sciences, Kermanshah, IRAN
*Corresponding Author Email: [email protected] 3 .Department of Psychology, University of Mohaghegh Ardabili, Ardabil, Iran
Abstract
Introduction: Acceptance and commitment therapy (ACT) is a third generation behavior therapy in
treatment of mood and anxiety disorders. The purpose of this study was to investigate the effectiveness of
acceptance and commitment therapy onmental health and psychological well-beingin women with breast
cancer.
Method: In this study which was a Quasi-Experimental with pre-test, post-test and control group, the
sample group was selected by available sampling method from patients referred to the specialized cancer
treatment centers redundant in Kermanshah, Iran, were selected through the convenience sampling
method. Therefore, 40 female subjects were chosen randomly and assigned to two control & experimental
groups (each with 20 subjects). To assess the severity of mental the 28-item General Health Questionnaire
(GHQ), and psychological well-being short form Reef was used respectively in pre-test. The experimental
group experienced the treatment based on acceptance and commitment therapy in eight; two hours
sessions and the control group did not receive any treatment. These questionnaires again conducted on
both group in post-test.
Results: The results showed that mental health and psychological well-being scores of experimental group
significantly increased and in one-month fallow up did not significantly differ. So, treatment based on the
acceptance and commitment therapy caused significant changes in the treatment of mental health and
psychological well-being in women with cancer.
Conclusion: According to the findings, acceptance and commitment therapy is efficacious on increase of
mental health and psychological well-being of breast cancer patients. So it can be applied as useful method
of intervention for improving psychological symptoms in patients with breast cancer.
Keywords: Acceptance and Commitment Therapy, Mental Health, Psychological Well-being, Breast Cancer
Introduction
Cancer is caused by abnormal cells and their out of control reproduction. Cancer cells grow and reproduce rapidly.
This process usually begins when the genetic structure of cells is damaged (1). Breast cancer may spread in nearby
lymph nodes, lungs, pleurae (lining of the lungs), bone (especially the skull), pelvis and liver. This cancer is rare
before age 30, usually the maximum age for that is 65 years old. The breast cancer increases after menopause. After
skin cancer, breast cancer is the most common cancer in women and after lung cancer, it is the leading cause of
death for women in Western countries (2).
Cancer includes a group of more than 200 types of diseases (3),which can occur among people of any age, race,
cultural background, and economic status (4).Notwithstanding significant advances in medicine, cancer continues to
be known as one of the major diseases of the present century and the second leading cause of death after
cardiovascular diseases (5).According to the statistics published in the Cancer Journal for Clinicians in 2014,
1,665,540 new cases of cancers have been known, causing 40,430 fatalities (6).In Iran, breast cancer consists
22.26% cases of women’s cancers; it is the most common form of cancer among Iranian women (7). So far, the
Annals of Tropical Medicine & Public Health-Special Issue Mar 2018 Vol V
S202-18
researchers have implicated potential risk factors, such as heredity, hormonal, reproductive and environmental
factors such as lifestyle, especially psychological factors in breast cancer (8).
A cancer diagnosis can predispose patients and their families to deep emotional problems, such as stress, anxiety (9).
Some of the reasons for the occurrence of problems in the field of mental health ensue from the implied meanings of
this diagnosis in the minds of the patients and their families, such as the possibility of deformity, pain, financial
problems, dependency, interrupter of the family structure, and death (10). Studies have shown that between 50 and
85 percent of cancer patients suffer from a psychiatric disorder simultaneously (11).Breast cancer is the most
common cancer type and the second leading cause of cancer-related deaths in women in the United States (12). It
has also been reported as the most common type of cancer and the second cause of death among Iranian women
(13). The research results are indicative of the significant outcomes of breast cancer such as physical complications
(pain and fatigue), psychological problems (anxiety and depression) and other psychological-social problems, all of
which lead to the decrease in life expectancy especially with regard to the younger women (14).
Many treatments have been conducted for the health of the people with cancer such as group therapy, hope therapy,
life skills therapy, cognitive-behavior therapy and Acceptance and commitment therapy (ACT). Molavi et al. (2014)
say in their research that they have been able to reduce anxiety and depression (15). Iran, Doost et al. (2014) has also
succeeded to reduce the women’s chronic backaches. They also remark that the ACT has promoted the life quality
of the women with chronic pains(16). Chiesa and Serretti (2014) remark that both cognitive-behavioral and ACT
lead to anxiety reduction (17). Also Lin et al (2015) have shown in researches that ACT along with audio and visual
training and cyber texts are effective in physical pain reduction(18).Halliburton, Amanda and Lee (2015) remarked
that ACT is an emerging though different type of cognitive behavioral treatment(19).
Due to the vital roles that the psychological well-being plays in various mental-social and even physical aspects of
one’s life, numerous studies have been conducted about well-being and its components. Some scholars consider the
psychological well-being the equivalent of happiness and emotional interaction with others(Ryff, 1995).
Additionally, based on Ryff and Keyes’ pattern of psychological well-being, this construct comprises the six
components of purpose in life, positive relations, personal growth, self-acceptance, autonomy, and environmental
mastery. From this perspective, the health index is not defined as ‘lacking the disease,’ so that one’s well-being
rather than sickness is emphasized(20). The debilitating nature of multiple sclerosis, affecting one’s personal, social,
occupational, physical and mental life, is important from the viewpoints of both the patient due to the serious
concerns about the disease and specialists and researchers who are still overwhelmed by the theoretical and practical
ambiguities and failures regarding understanding this disease, especially its etiology, prevention, prognosis and
treatment. Hence, the identification of programs in the form of training interventions towards improving the
psychological well-being of these patients seems essential. So, the present study aimed to investigate the
effectiveness of acceptance and commitment therapy (ACT) on the mental health and psychological well-being of
women with breast cancer.
Materials and Methods
The present study also followed a pretest-posttest design with experimental and control groups, and the statistical
population comprised all women with breast cancer patients visiting the specialized cancer treatment centers
redundant in Kermanshah, Iran. Moreover, the simple random sampling was employed to select the breast cancer
patients -stricken subjects (20 in each of the experimental and control groups) from the registered members of Imam
Reza Hospital Kermanshah. It is worth noting that the number of subjects in the present study partially corresponded
to the appropriate number of subjects suggested in the clinical literature, ranging from seven to ten members and in
some other cases between ten and fifteen members. As for sample selection.
Inclusion factors: consent to participate in the program, 30 to 55 years of age, all people have chemotherapy and not
to have any other physical effects other than breast cancer; exclusion factors were absence of treatment over 2
sessions and physical inability due to the growing trend of cancer.
After sampling, the subjects were randomly assigned to two experimental and control groups, and then the pretest
was performed in both groups. After that, the experimental group was collectively provided with the independent
variable, i.e., acceptance and commitment therapy (ACT), in eight 90-minute sessions once a week. As for the
control group, no intervention was offered. Upon completion of the sessions, the posttest took place. The treatment
plan given to the experimental group is briefly shown in Table 1.

Annals of Tropical Medicine & Public Health-Special Issue Mar 2018 Vol V
S202-18
The ACT protocol, which was based on an unpublished manual used in a previous study (21) focused on changing
expectations from elimination of pain to living as well as possible with chronic pain. iscussions and experiential
exercises were used to demonstrate the futility of control-oriented strategies such as thought suppression and
attempts to eliminate pain, distress, and other negative experiences. Mindfulness strategies were taught in order to
develop the skill of allowing negative experiences such as muscle tension or discomfort, negative thoughts, and
emotional distress to pass through consciousness without requiring the expenditure of energy or psychological
resources to control or alter them (22). Participants were also encouraged to identify their personal values and set
and pursue short- and long-term goals consistent with those values in order to achieve improved quality of life and
functioning.
Table 1.Session outlines for acceptance and commitment therapy (ACT)
Session ACT
1 The limits of control (short and long-term costs and benefits; finger traps), focus on
experience (body scan)
2 Values (what you care about, how you want to live your life)
3 Cognitive defusion (observing thoughts without trying to evaluate or change
them)
4 Mindfulness (being in the moment, raisin exercise)
5 Committed action (‘‘road map’’ connecting values, goals, actions, obstacles,
and strategies)
6 Review and continued action in support of values
7 Review and continued action in support of values
8 Moving forward
General Health Questionnaire (GHQ-28)
The questionnaire contained 28 questions and four sub-scales. Questionnaire subscales included: somatization,
anxiety syndrome and insomnia, social dysfunction and depression syndrome. The overall score of each individual
was the sum of individual scores obtained on the four subscales.
Multiple-choice type questions were based on the Likert scoring methods and options were scored as zero, one, two,
and three. Rating of zero to 27was considered as a sign of good general health, 28 to 55 was average general health,
and 5 to 84 a sign of undesirable general health (23). In a study Palahang and colleagues who examined validation of
the 28-item General Health Questionnaire, the reliability (assessed through test) was reported to be 0.91(24).
Ryff's Psychological Well-being scale (PWB)
This scale was developed by Ryff in 1980. The original scale contained 120 questions, but in further studies done
afterwards, shorter forms of the scale were proposed with 84, 54, and 18 questions. In the present study, the 18-item
scale was utilized with six-point Likert Scaling (ranging from strongly disagree to strongly agree). In addition, the
validity and reliability of this scale has been reported in numerous preceding studies (20). In a study conducted by
Dierendonck (2005), the internal consistency of the subscales of the psychological well-being scale (PWB) was
appropriate, and their Cronbach's alpha was between 0.77 and 0.90. The correlations of the psychological well-being
scale (PWB) with life satisfaction scale, happiness inventory and Rosenberg self-esteem scale (RSES) were 0.47,
0.58, and 0.46, respectively. In a study performed byKhanjani and et al (2014), the reported internal consistency for
the entire psychological well-being scale (PWB) was 0.94, and between 0.63 and 0.89 for the subtests. Moreover, in
the present study, the correlation coefficient for the entire test through test-retest was 0.76, and between 0.67 and
0.73 for the subtests (p<0.001)(25).
Annals of Tropical Medicine & Public Health-Special Issue Mar 2018 Vol V
S202-18
To analyze the collected data and given the research questions, the univariate ANCOVA was employed in addition
to descriptive statistics. As for data analysis, the SPSS-23 was employed.
Results
Totally 40 women with the age range of 30-55 years were selected from the intended population and were included
in the research.
Table 2 shows mean and standard deviation for scores of psychological well-being test in the studied groups in
pretest-posttest and follow-up stages.
As seen in table 2, mean in the experimental group (Commitment and Acceptance Therapy) increased from 74.27 at
pre-test stage to 86.33 at post-test stage. But no significant change was observed in the control group in pretest and
posttest stages. Considering the difference observed in the mean of the study groups, average psychological well-
being in experimental group indicates the effectiveness of the aforesaid procedure. In the experimental group
(Commitment and Acceptance Therapy) decreased from 17.85 at pre-test stage to 14.69 at post-test stage. But no
significant change was observed in the control group in pretest and posttest stages. Considering the difference
observed in the mean of the study groups, average mental health in experimental group indicates the effectiveness of
the aforesaid procedure.
The Leven’s test was used to assess the equality of variances in mental health and psychological well-being scores.
The results of the Leven’s test are provided in Table 3.
In order to evaluate the presumptions of the analysis of covariance (ANCOVA), firstly the homogeneity of slopes of
pretests and posttest scores were calculated. Multivariate ANCOVA was used to compare experimental and control
groups with respect to mental health and psychological well-being scores. The results showed that the tests were
significant (P<0.01). This means that there was a significant difference at least between two groups. The results are
shown in table 4.
ANCOVA was conducted to find out the difference observed. Considering the calculated effect size, 76% of total
variances of experimental and control groups was the result of effectiveness of the independent variable. Moreover,
statistical power of the test was 0.76 which means that the test was able to reject the null hypothesis with a power of
76%. Table 5 only states that in one of the areas there is a significant difference between experimental and control
groups. Multivariate analysis of covariance (MANCOVA) was used to distinguish which area was significantly
different. The results are shown in Table 5.
Results of Table 5 show that there was a significant difference in psychological well-being dimensions including
independence, dominance over the environment, self-development, Positive relation with people, being targeted in
life, and self-acceptance between the two study groups. Overall psychological well-being with F=13.82 was
significant (P= 0.001). Considering the Eta square of 0.45, it can be said that 45% of the changes in the dependent
variable was due to effectiveness of the independent variable. In mental health between the two study groups.
Overall mental health with F=7.75 was significant (P= 0.001). Considering the Eta square of 0.69, it can be said that
69% of the changes in the dependent variable was due to effectiveness of the independent variable.

Annals of Tropical Medicine & Public Health-Special Issue Mar 2018 Vol V
S202-18
Table 2. Mean and standard deviation of psychological well-being and mental health scores
Follow-up Posttest Pretest Groups
psychological well-
being
Standard
deviation
Mean Standard
deviation
Mean Standard
deviation
Mean
8/15 85/25 13/89 86/33 10/85 74/27 Commitment and
Acceptance Therapy
8/12 73/77 5/45 74/83 10/18 74/32 Control
3/37 14/56 3/26 14/69 2/88 17/85 Commitment and
Acceptance Therapy
mental health
scores
4/41 17/54 4/37 17/21 4/50 17/75 Control
Table 3.Results of the Leven’s test to examine the equality of variances in psychological well-being scores
Sig df2 df1 F Variable
0/06 28 1 3/5 Psychological well-being
0/24 28 1 1/45 Mental Health
Table 4.Results obtained from multivariate analysis of covariance on mean scores of posttest of variables in two groups
Square Eta Sig Error df Hypothesis df F value
0/76 0/001 2 14 10/94 0/79 Pillai's trace
0/76 0/001 2 14 10/94 0/23 Wilks lambda
0/76 0/001 2 14 10/94 4 Hoteling's trace
0/76 0/001 2 7 10/94 4 Roy's largest rot

Annals of Tropical Medicine & Public Health-Special Issue Mar 2018 Vol V
S202-18
Table5.Results obtained from multivariate analysis of covariance (MANCOVA): mean scores of posttest of psychological well-being dimensions
in the experimental and control groups
Square Eta Sig F Degrees of
freedom
Mean Square Sources Change
0/65 0/001 25/71 1 70/13 Independence
0/45 0/001 5/92 1 17/14 Dominance over the environment
0/56 0/001 25./59 1 61/40 Self-development
0/28 0/021 7/18 1 23/72 Positive relation with people
0/32 0/005 10/53 1 21/35 Being targeted in life
0/42 0/001 15/34 1 102/74 Self-acceptance
0/45 0/001 13/82 1 1033/87 Total psychological well-being
0/69 0/001 7/752 1 75/571 Total mental health
Discussion
The present study aimed to investigate the effectiveness of acceptance and commitment therapy (ACT) on the
mental health and Psychological Well-being in Female Breast Cancer Patients. As the results of the present study
demonstrated, the acceptance and commitment therapy (ACT) significantly enhanced the psychological well-being
of patients with breast cancer patients in the experimental group compared to the control group. This result was
consistent with the results of a study conducted by Rajabi et al (2014). In which it was reported that the acceptance
and commitment therapy (ACT) influenced the treatment of anxiety and depression of women suffering from
MS(26). In addition, this finding of the present study was concurrent with the results of a study conducted by Izadi
et al. (2013), in which it was reported that the acceptance and commitment therapy (ACT) could lessen obsession,
depression, and anxiety in patients suffering from MS(27). In acceptance and commitment therapy (ACT), patients
are trained in mindfulness each session. By the same token, Brown & Ryan (2003) concluded that mindfulness and
presence of mind increase one’s well being (28). In line with the results of the present study, Arch and Craske
(2005) concluded that the participants that concentrated for 15 minutes experienced mental clarity and reduced
physical stress compared to those lacking such concentration(29). Given that it has been proven that psychological
stress can activate multiple sclerosis (30), thus, not only does the commitment and acceptance therapy increase the
psychological well-being, it also reduces stress in patients suffering from cancer, as a result of which the recurrence
rate of this disease is lessened in these patients. Therefore, it seems that the psychological interventions, including
the acceptance and commitment therapy, can play efficacious roles in increasing the psychological well-being and
overall mental health of patients suffering from cancer.
Several studies have concluded that based on acceptance and commitment therapy is effective in improving mild to
moderate depression (31), Obsessive – compulsive disorders (32), Psychosis or psychosis(32), psychological
adaptation(33), smoking (34), Tinnitus (35), epilepsy and emotional eating after gastric banding surgery (36). The
treatment has also been effective in non-clinical disorders such as stress in the workplace (37), mental health (38),
well-being(39) and weight loss (40).
In this therapy, the practices of behavioral commitment along with defusion and acceptance techniques as well as
detailed discussions about one’s values and goals and the need for specification of values all led to an increase in the
psychological well-being of women suffering from Breast Cancer. Further, in this treatment, the main goal of
placing greater emphasis on one’s inclination towards inner thoughts was to assist one to experience one’s
worrisome thoughts just as a thought, to become aware of the inefficient nature of one’s current programs, and to
handle what was of importance in one’s life in line with one’s values rather than responding to those thoughts. Here,

Annals of Tropical Medicine & Public Health-Special Issue Mar 2018 Vol V
S202-18
through replacing ego as background, clients could smoothly experience one’s unpleasant inner events in the present
and were able to restrain oneself from nasty reactions, thoughts, and memories. In fact, it aimed to affirm one’s
psychological flexibility. As the results of the statistical analysis showed, this approach led to a major rise in the
psychological flexibility of this group of patients. In practice, the central processes of ACT teach one how to desist
from worrisome deterrent thoughts, how to conceptualize such thoughts, how to affirm self–observation, how to
accept rather than control the internal events, and how to clarify one’s values. In this therapy, one learns how to
accept rather than desist from one’s feelings. It also raises awareness about one’s thoughts and thinking process and
links them towards the realization of goal-oriented activities. In short, ACTaims to teach one to experience rather
than obstruct one’sthoughts and feelings, and one is asked to do one’s utmost towards the realization of goals and
values(26).
ACT is a behavioraltreatment which utilizes mindfulness, acceptance, andcognitive departure skills to enhance
psychologicalflexibility. In ACT the psychological flexibility is theincrease in the visitors’ ability to establish
relationshipwith their experience in the present, and to choose to act ina way that is consistent with their adopted
values. Rajabi etal. (2014) state that ACT helps people become motivated,and that this motivation results in increase
in expectancy(26).Also Narimani et al. (2015) state that this treatment affectsthe individual’s hope through the
promotion of self efficiency and positive self-image (41). Despite the importanceof the third wave of cognitive-
behavioral treatmentsincluding the ACT approach as an important area ofemerging psychotherapy which is cited by
researchersto have an effective role on stress, anxiety disorders,depression, and other clinical conditions, and since it
hasproved to be effective in the promotion of the lifestyle ofthe people with chronic pains (42, 43), only a few
researches havedealt with the application of ACT techniques in treatingpatients with cancer. Hulbert- Williams ,
Esevri and Wilson(2015) are among the researchers who introduced ACTas an effective intervention in adaptability
with cancer (44).
Since getting cancer requires strategies to make patients maintain the power to adapt to the treatment process,
psychological education can play an important role in achieving this goal especially in the approach based on
Acceptance and Commitment Therapy which believes authorities are never considered as failed, damaged or
hopeless. Instead, the approach is always a form of empowerment that believes a meaningful life based on values,
wealth is available for all people (45). In general, the admission facilitates the main processes of ACT for
commitment (46). The implementation of group mindfulness-based intervention and acceptance and commitment
therapy, while providing a platform to accommodate emotions, control and eliminate negative emotions and
experiences deals and encourage the patients to follow the values and commitment to action based on values. As a
result, it can be said that this leads to increasing the psychological well-being and mental health in women with
breast cancer. Therefore, ACT can be applied as an appropriate intervention to improve the patients’ ability to cope
with crisis cancer and to lessen its psychological side effects. The goal of treatment is, therefore, to start training
based on knowledge and creative helplessness compared to previous solutions from the start and subjects’ (patients)
acceptance of this novel attitude. According to the findings of the study, since variable of psychological acceptance
increased before a significant decrease in indicators of mental health, it can be concluded that the variable of
acceptance and increased attention and action value act as mediators in change and are effective in improving the
indicators of psychological acute breast cancer.
One of the limitations of the present study was the limited number of the sample under study because the male
patients were not included in the studyM. Accordingly, it is recommended that larger groups that includes men be
investigated in future studies towards greater validity of this therapy with greater confidence. In addition, it is
suggested that this method of treatment be compared to other methods to determine how they are different from each
other.
Acknowledgments
The authors of the present study would like to extend their sincerest thanks and appreciation to the personnel of
Kermanshah University of Medical Sciences as well as the participants in the studyandall the people contributing to
this research
.

Annals of Tropical Medicine & Public Health-Special Issue Mar 2018 Vol V
S202-18
References
1. Rahbarian M, Tarkhan M, Jalali M. The effectiveness of cognitive-behavioral group therapy on self-concept and body
image in burnt women. Journal of Qazvin University of Medical Sciences. 2012;15(4):45-52. 2. Perez CA. Uterine cervix. Principles and practice of radiation oncology. 2008:1532-609. 3. Ely S, Vioral AN. Breast cancer overview. Plastic Surgical Nursing. 2007;27(3):128-33. 4. Manahan F, Sands J, Neigh Bors M, Mark J, Green C. phipps medical surgical nursing health and illness perspective
Europ/middle east and African. St Louismosby eleseviers. 2007. 5. Dow KH. Nursing care of women with cancer: Mosby Elsevier; 2006. 6. Riskind JH, Kleiman EM, Seifritz E, Neuhoff J. Influence of anxiety, depression and looming cognitive style on auditory
looming perception. Journal of anxiety disorders. 2014;28(1):45-50. 7. Esmaili R, Saiidi JA, Majd HA, Esmaieli M. A survey of the body image of mastectomies women referring to Imam
Khomeini and Imam Hussein hospitals in Tehran, Iran. Indian journal of psychological medicine. 2010;32(1):34. 8. Cokkinides V, Albano J, Samuels A, Ward M, Thum J. American cancer society: Cancer facts and figures. Atlanta:
American Cancer Society. 2005. 9. Akechi T, Okuyama T, Akizuki N, Azuma H, Sagawa R, Furukawa TA, et al. Course of psychological distress and its
predictors in advanced non‐small cell lung cancer patients. Psycho‐Oncology. 2006;15(6):463-73. 10. Vandekieft GK. Breaking bad news. American family physician. 2001;64(12.) 11. Pirl WF. Evidence report on the occurrence, assessment, and treatment of depression in cancer patients. Monographs-
National Cancer Institute. 2004;32:32-9. 12. Nakai K, Hung M-C, Yamaguchi H. A perspective on anti-EGFR therapies targeting triple-negative breast cancer.
American Journal of CancerResearch. 2016;6(8):1609. 13. Ghasemi F, Dehghan F, Farnia V, Tatari F, Alikhani M. Effectiveness of Acceptance and Commitment Therapy on Life
Expectancy of Female Cancer Patients at Tehran’s Dehshpour Institute in 2015. Asian Pacific Journal of Cancer
Prevention. 2016;17(8):4113-6. 14. Howard-Anderson J, Ganz PA, Bower JE, Stanton AL. Quality of life, fertility concerns, and behavioral health outcomes in
younger breast cancer survivors: a systematic review. Journal of the National Cancer Institute. 2012. 15. Molavi P, Mikaeili N, Rahimi N, Mehri S. The effectiveness of acceptance and commitment therapy based on reducing
anxiety and depression in students with social phobia. Journal of Ardabil University of Medical Sciences.
2014;14(4):412-23. 16. Irandoost F, Nadi MA, Safary S. The effectiveness of Acceptance and Commitment Therapy (ACT) on the rate of chronic
pain and pain catastrophizing in women with chronic low back pain. 2014. 17. Chiesa A, Serretti A. Are mindfulness-based interventions effectivefor substance use disorders? A systematic review of
the evidence. Substance use & misuse. 2014;49(5):492-512. 18. Lin J, Lüking M, Ebert DD, Buhrman M, Andersson G, Baumeister H. Effectiveness and cost-effectiveness of a guided and
unguided internet-basedAcceptance and Commitment Therapy for chronic pain: Study protocol for a three-armed
randomised controlled trial. Internet Interventions. 2015;2(1):7-16. 19. Halliburton AE, Cooper LD. Applications and adaptations of Acceptance and Commitment Therapy (ACT) for
adolescents. Journal of Contextual Behavioral Science. 2015;4(1):1-11. 20. Ryff CD, Singer BH, Love GD. Positive health: Connecting well-being with biology. Philosophical Transactions-Royal
Society of London Series B Biological Sciences. 2004:1383 -94.
21. Vowles KE, Wetherell JL, Sorrell JT. Targeting acceptance, mindfulness, and values-based action in chronic pain: findings
of two preliminary trials of an outpatient group-based intervention. Cognitive and Behavioral Practice. 2009;16(1):49-
58. 22. McCracken LM. Contextual cognitive-behavioral therapy for chronic pain. Progress in pain research and management.
2005. 23. Noorbala AA, Bagheri Yazdi SA, Asadi Lari M, Mahdavi V, Reza M. Mental health status of individuals fifteen years and
older in Tehran-Iran (2009). Iranian journal of psychiatry and clinical psychology. 2011;16(4):479-83. 24. Yaghubi N, Nasr M, Shahmohammadi D. Epidemiology of mental disorders in urabn and rural areas of Sowmaesara-
Gillan. Iranian Journal of Psychiatry and Clinical Psychology. 1995;1(4):55-60. 25. Khanjani M SS, Fathabadi G, Mazaheri M A, Shekari O. factor structure and psychometric features short-form teeth (18
items) measure psychological well-being of students. thought and behavior. 2014:32. 26. Rajabi S, Yazdkhasti F. The Effectiveness of Acceptance and Commitment Group Therapy on Anxiety and Depression in
Women with MS Who Were Referred to the MS Association. . Journal of Clinical Psychology. 2014;1(21):29-39. 27. Izadi R, AsGari K, Neshatdust H, Abedi M. Case Study of the Effectiveness of Acceptance and Commitment Therapy on
Frequency and Severity of Obsessive Symptoms in Obsessive- Compulsive Disorder. Zahedan J Res Med Sci.
2013;1(22):20-6.
Annals of Tropical Medicine & Public Health-Special Issue Mar 2018 Vol V
S202-18
28. Brown K RR. The benefits of being present: Mindfulness and itsrole in Psychological
well-being. J Personal & Soc Psychol. 2003;84:822-48. 29. Arch JJ, Craske MG. Mechanisms of mindfulness: Emotion regulation following a focused breathing induction. Behaviour
research and therapy. 2006;44(12):1849-58. 30. Buljevac D , Hop W, Reedeker W, Janssens A, Van Der Meché F, Van Doorn P, et al. Self reported stressful life events and
exacerbations in multiple sclerosis: prospective study. Bmj. 2003;327(7416):646. 31. Shawyer F, Farhall J, Mackinnon A, Trauer T, Sims E, Ratcliff K, et al. A randomised controlled trial of acceptance-based
cognitive behavioural therapy for command hallucinations in psychotic disorders. Behaviour research and therapy.
2012;50(2):110-21. 32. Gifford EV, Kohlenberg BS, Hayes SC, Pierson HM, PiaseckiMP, Antonuccio DO, et al. Does acceptance and relationship
focused behavior therapy contribute to bupropion outcomes? A randomized controlled trial of functional analytic
psychotherapy and acceptance and commitment therapy for smoking cessation. Behaviortherapy. 2011;42(4):700-15. 33. Yazdanbakhsh K, Kaboudi M, Roghanchi M, Dehghan F, Nooripour R. The Effectiveness Of Acceptance And Commitment
Therapy On Psychological Adaptation in Women with MS. Journal of Fundamental and Applied Sciences. 2016;8(3S)
2:767-77.
34. Westin VZ, Schulin M, Hesser H, Karlsson M, Noe RZ, Olofsson U, et al. Acceptance and commitment therapy versus
tinnitus retraining therapy in the treatment of tinnitus: a randomised controlled trial. Behaviour research and therapy.
2011;49(11):737-47.
35. Weineland S, Arvidsson D, Kakoulidis TP, Dahl J. Acceptance and commitment therapy for bariatric surgery patients, a
pilot RCT. Obesity Research & Clinical Practice. 2012;6(1):e21-e30. 36. Flaxman PE, Bond FW. A randomised worksite comparison of acceptance and commitment therapy and stress
inoculation training. Behaviour research and therapy. 2010;48(8):816-20. 37. Masuda A, Hayes SC, Fletcher LB, Seignourel PJ, Bunting K, Herbst SA, et al. Impact of acceptance and commitment
therapy versuseducation on stigma toward people with psychological disorders. Behaviour research and therapy.
2007;45(11):2764-72. 38. Lillis J, Hayes SC, Bunting K, Masuda A. Teaching acceptance and mindfulness to improve the lives of the obese: A
preliminary test ofa theoretical model. Annals of Behavioral Medicine. 2009;37(1):58-69. 39. Bayati A, Abbasi P, Bashiri H, Dehghan F, Yazdanbakhsh K. The Effectiveness Of Acceptance And Commitment Therapy
On Psychological Well-Being in Women with MS. IIOAB JOURNAL. 2017;8 (1:)82-6.
40. Clarke S, Kingston J, Wilson KG, Bolderston H, Remington B. Acceptance and Commitment Therapy for a heterogeneous
group of treatment-resistant clients: A treatment development study. Cognitive and Behavioral Practice.
2012;19(4):560-72. 41. Narimani M, Alamdari E, A. A. Assessing the effectiveness of acceptance and commitment therapy on quality of life in
infertile women. J Family Counseling Psychotherapy,. (2015);4: 387-404. 42. Kahl KG, Winter L, Schweiger U. The third wave of cognitive behavioural therapies: what is new and what is effective?
Current opinion in psychiatry. 2012;25(6):522-8. 43. Dionne F, Ngo T, Blais M. The psychological flexibility model: a new approach to mental health. Sante mentale au
Quebec. 2012;38(2):111-30. 44. Hulbert‐Williams NJ, Storey L, Wilson KG. Psychological interventions for patients with cancer: psychological flexibility
and the potential utility of Acceptance and Commitment Therapy. European journal of cancer care. 2015;24(1):15-27. 45. Bricker J, Tollison S. Comparison of motivational interviewing with acceptance and commitment therapy: a conceptual
and clinical review. Behavioural and cognitive psychotherapy. 2011;39(05):541-59. 46. Hayes SC, Levin ME, Plumb-Vilardaga J, Villatte JL, Pistorello J. Acceptance and commitment therapy and contextual
behavioral science: Examining the progress of a distinctive model of behavioral and cognitive therapy. Behavior therapy.
2013;44(2):180-98.

Annals of Tropical Medicine & Public Health-Special Issue Mar 2018 Vol V
S204-18
Prevalence Of Depression Among Hemodialysis Patients
Admitted In Gorgan (Iran) During 2014
Saeid Amirkhanlou 1, Anna Rashedi
2, Mozhdeh Akbari
3, Arash Rezai Shahmirzadi
4,5, Maryam Montazei
4,5 , Sina
Mostafavi 4,5
, Mohammad Hadi Molseghi3,5
*, Tahereh Bakhshi5
1Department of Nephrology, Clinical Research Development Unit (CRDU), Sayad Shirazi Hospital, Golestan
University of Medical Sciences, Gorgan, Iran. 2Department of Radiology, Clinical Research Development Unit (CRDU), Sayad Shirazi Hospital Golestan University
of Medical Sciences, Gorgan, Iran. 3Clinical Research Development Unit (CRDU), Sayad Shirazi Hospital, Golestan University of Medical Sciences,
Gorgan, Iran. 4Medical Student, School of Medicine, Golestan University of Medical Sciences, Gorgan, Iran.
5Student Research Committee, Golestan University of Medical Sciences, Gorgan, Iran
*Corresponding author: Mohammad Hadi Molseghi
Clinical Research Development Unit (CRDU) Sayad Shirazi hospital, Department of Internal Medicine, Golestan
University of Medical Sciences, Gorgan, Iran.
Phone: +989120452505
E-mail: [email protected]
ABSTRACT
Background: Hemodialysis, the main treatment for chronic kidney disease, is known as a stressful process
followed by a lot of mental, emotional and social pressures. The aim of present study was to examine the
prevalence of depression and related risk factors in hemodialysis patients.
Methods: In this cross-sectional study, all hemodialysis patients admitted to 5th
Azar Hospital in Gorgan
during 2014 were examined. Personal information including age, sex, ethnicity, educational level, marital
status, occupation, financial condition and information about renal disease, including the period of
hemodialysis, history of diabetes, hypertension, anemia and nutritional status were extracted from the
medical history of the patients. For the mental conditions, the Beck Depression Inventory (BDI) was used.
Results:Mental status of only 16.1% of the patients was normal; and 83.9 % of patients showed signs for
different levels of depression in their BDI test. The fact that 31.7% of the patients suffered from clinical
depression is a proof for the seriousness of this issue and the necessity of it. Also, results showed that in
these patients, the risk factors associated with depression were in relation with factors such as, marital
status, occupation, the number of dialysis sessions per week and other variables.
Conclusions:This study was done for the first time in northeast of Iran and based on the results of present
study recommended that the doctors and technicians should pay close attention to the patient’s mental
condition in addition to hemodialysis.
Keywords: Depression, Gorgan, Hemodialysis, Prevalence
Introduction:
End-stage renal disease (ESRD) is a progressive and irreversible kidney disorder in which the body loses its ability
to keep fluids and electrolytes in balance (1). In 2003 almost two million people suffered from kidney failure in the
United States (1). The statistics show that each year there is a 15 % increase in the number of people with kidney

Annals of Tropical Medicine & Public Health-Special Issue Mar 2018 Vol V
S204-18
disorders in the worlds (2, 4). Hemodialysis as the main treatment for chronic kidney disease is a stressful
procedure which is followed by a lot of emotional, psychological and social problems (5). Although hemodialysis
will improve life span of the patients, it causes a lot of hardships like mental problems for the patients (6). Dialysis
cannot compensate for the lack of metabolic activities, which is yet another reason for mental distress of the
patient (7). Therefore, it is necessary to intervene psychologically as a major part of treatment in these patients.
Some of the known most common mental disorders in ESRD patients are depression, organic mental disorder, drug
abuse and anxiety (8).There is no consensus about the severity of the emergence of psychiatric problems in dialysis
patients, but everyone agrees that depression, and after that, anxiety are the most common sign of mental
problem in these patients (9).Psychological disorders like depression may discourage the patient from following a
diet compatible with their dialysis condition. Weight gain due to refusal of following an appropriate diet, excess
fluid intake, malnutrition and sleep disorders are way more common in these patients than the patients who don’t suffer from psychological disorders (7, 8).
Although depression is very common among hemodialysis patients due to the similarity of its symptoms such as
appetite loss, fatigue, restlessness, loss of libido and sleep disorders, with those of some physical illnesses, it’s very
hard to diagnose (10). Therefore the epidemiology of depression induced by chronic kidney disease is still not very
well known. On the other hand depression is one of the disorders that are very costly. In the United States
depression is one of the top ten most costly diseases (11).This may be due to the fact that depression is an
important factor in the patient’s refusal of treatment and lack of cooperation by the patient will add to their
medical problems and endangers their health; eventually leading to premature death (12). Therefore an early
diagnosis and an effective treatment of depression can improve the patient’s prognosis, quality of life, and survival
rate (13-15).
For treatment, knowing the prevalence and risk factors of depression in any area is necessary; however, there is a
little research in this regard in North of Iran. So, the present study was designed to examine the prevalence of
depression and related risk factors in some Iranian hemodialysis patients.
Materials and Methods:
In this cross-sectional study, which done during 2014 in Gorgan northeast of Iran, 194 hemodialysis patients whom
were admitted to 5th
Azar hemodialysis center were examined. Inclusion criteria were: being on hemodialysis, the
age of over 18 years old and having the ability to answer the provided questionnaire. personal information
including age, sex, ethnicity, educational level, marital status, occupation and financial status, and the medical
information like the period of hemodialysis, history of dialysis, number of dialysis sessions per week, dialysis
efficiency, history of diabetes, hypertension, anemia, nutritional status, serum albumin level and vascular access
sites for dialysis were extracted from the patients’ medical files. For examining the mental condition, Persian
version of Beck Depression Inventory (BDI) was used. Beck depression inventory consists of 21 questions which
analyzes the severity of depression and rates it from 0 to 63; in addition to screening. If the score is above 10 in
healthy people and above 15 in dialysis patients it indicates depression. The severity of depression will be assessed
based on the scores as follows: (11-16) mild depression, (17-20) mild depression with a need for therapy, (21-30)
regular depression, (31-40) severe depression, (41-63) very severe depression.
The criteria for being excluded from the study were a known history of mental disorder and the use of
antidepressants in the previous month.
Statistical analysis:
For data analysis we used SPSS v.21. Continuous variables were presented by mean and standard deviation.
Spearman correlation coefficient, independent t-test and ANOVA were applied for correlation and comparison.P-
value less than 0.05 were considered as statistically significant.
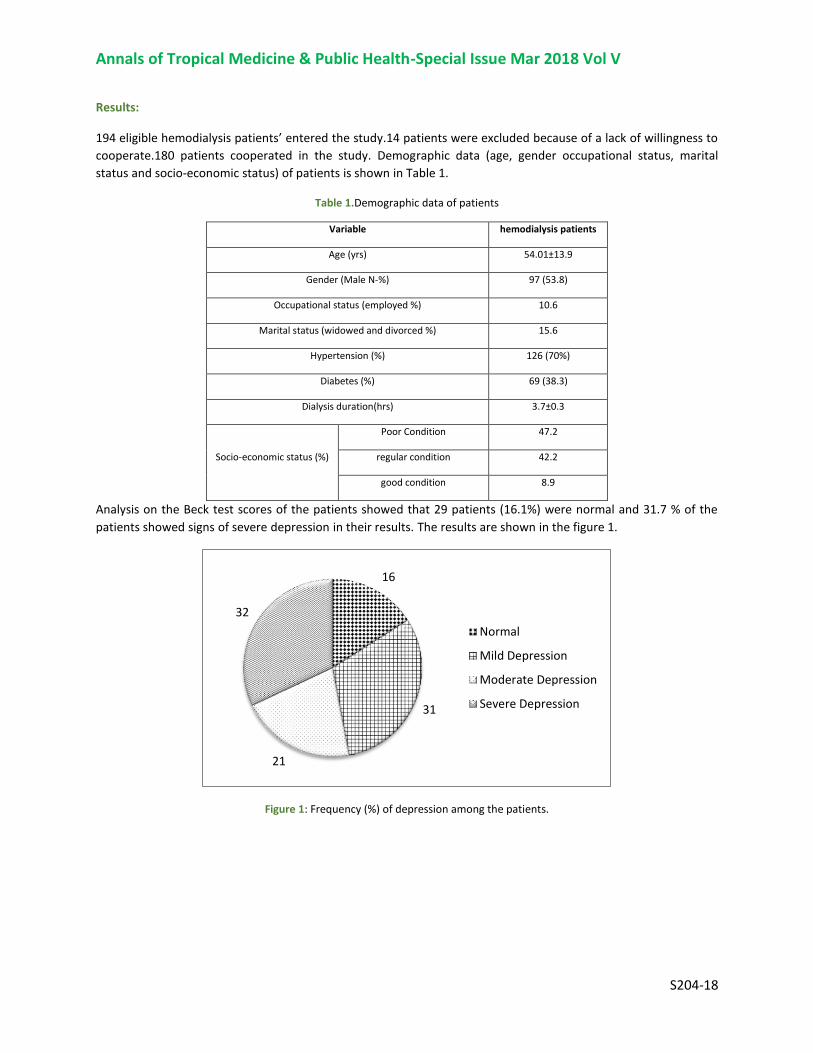
Annals of Tropical Medicine & Public Health-Special Issue Mar 2018 Vol V
S204-18
Results:
194 eligible hemodialysis patients’ entered the study.14 patients were excluded because of a lack of willingness to
cooperate.180 patients cooperated in the study. Demographic data (age, gender occupational status, marital
status and socio-economic status) of patients is shown in Table 1.
Table 1.Demographic data of patients
hemodialysis patients Variable
54.01±13.9 Age (yrs)
97 (53.8) Gender (Male N-%)
10.6 Occupational status (employed %)
15.6 Marital status (widowed and divorced %)
126 (70%) Hypertension (%)
69 (38.3) Diabetes (%)
3.7±0.3 Dialysis duration(hrs)
47.2 Poor Condition
Socio-economic status (%) 42.2 regular condition
8.9 good condition
Analysis on the Beck test scores of the patients showed that 29 patients (16.1%) were normal and 31.7 % of the
patients showed signs of severe depression in their results. The results are shown in the figure 1.
Figure 1: Frequency (%) of depression among the patients.
16
31
21
32
Normal
Mild Depression
Moderate Depression
Severe Depression

Annals of Tropical Medicine & Public Health-Special Issue Mar 2018 Vol V
S204-18
Mean depression score was higher in female patients than in male patients (31.3±8.1 vs. 21.8±5.4), the results of
independent t-test showed a statistically significant difference (P=0.05). Results also showed that there is a
relation between socio-economic status and depression. 94.11% of poor patients were more prone to severe
depression versus 48.2% of rich patients (P <0.001). Married patients were more prone to depression, according to
Beck test (69% with depression vs 31% normal, P<0.001), however, the differences in these test results were not
noticeable in the single patients. (P>0.05)
Table 2. Number and percentage of different level of depression among the hemodialysis patients
The results (Table 2) showed that employed patients had lower scores in the Beck test (P<0.001), increases in
dialysis duration cause an increase in the possibility of depression (P<0.001), patients who suffered from diabetes
had increased prevalence of depression (P=0.5), patients with hypertension showed signs of different degrees of
depression (P=0.6).
Discussion:
The aim of the present study was to determine the prevalence of depression and its related risk factors in
hemodialysis patients. According to the results of this study, 84% of hemodialysis patients reported some levels of
depression. Findings also showed that increases in dialysis duration cause an increase in the possibility of
depression.
In 2014 Afshaar et al, showed that there is a 70% prevalence of depression in hemodialysis patients in two
hemodialysis centers in Tehran. 26.7 % of them suffered from severe depression. These results were almost in sync
with this study. None of the variables including age, sex, underlying disease, dialysis duration, history of kidney
transplant, anemia, marital status, occupational status and serum albumin level had a meaningful correlation with
depression statistically. But in this study age, dialysis duration, marital status and occupational status had a
meaningful relation with Beck test results. This difference in the results is an indicative of the need to analyze this
subject deeper and more extensively. (9)
Normal Depressed P-value
occupational status
Employed 12 (63.15%) 7 (36.85%)
<0.001 Unemployed 19 (11.8%) 142 (88.2%)
duration of dialysis
<4 hours 19 (31.1%) 42 (68.9%)
<0.001 ≥4 hours 4 (3.4%) 115 (96.6%)
Diabetes
Diabetic 11 (15.9%) 58 (84.1%)
0.5
Non-diabetic 25 (22.5%) 86 (77.5%)
Hypertension
With hypertension 30 (23.8%) 96 (76.2%)
0.6
Without hypertension 10 (18.5%) 44 (81.5)

Annals of Tropical Medicine & Public Health-Special Issue Mar 2018 Vol V
S204-18
Mahmoody et al (2010) studied the level of depression in hemodialysis and kidney transplant patients. in their
study, There wasn’t a significant difference between the two groups statistically, that is similar with our study. The
degree of depression in women and men did not show any meaningful difference in comparison. In general, 93%
of the dialysis patients suffered from depression with different degrees (mild to severe) that was higher than the
finding of the present study. Regarding the relation of the depression level with age, sex, marital status and
educational level, there wasn’t a meaningful difference. The results showed that the level of depression in each
group is very high, and also the depression level is way higher in dialysis patients than transplant patients. By using
self-evaluation tests and Beck Depression Inventory we can avoid the confusionof the similarity of the symptoms
of ESRD and depression in diagnosis and screening of the depressed patients; which is a simple and low cost
method of early diagnosis and treatment in these patients (11). The results of this study also suggest that dialysis
patients should be under special attention for the possibility of depression.
In another study, Joshwa et al. examined the prevalence of depression, fatigue and sleep problems in hemodialysis
patients in India.16 They used BDI and found out the prevalence of depression equal to 73% (59.7% reported mild
and moderate level and 12.6% reported severe level) that was lower than the finding of the present study.(12)
Conclusion:
Overall, the findings of this study emphasize the prevalence of depression in hemodialysis patients; which is also
correlated with factors like marital status, occupational status, employment status, economic condition, number of
dialysis sessions per week, age, nutritional status and educational level of the patients.
With respect to the destructive impact of depression on the individual and their family, the doctors and
technicians must pay special attention to psychological disorders in the patients, in addition to hemodialysis.
Conflict of interest
The authors declare that they have no conflict of interests.
Acknowledgements:
The authors gratefully thank the patients for their cooperation and thoughtful responses.
References:
1. David B, Bresnaban, MD. Psychiatric Comorbidity in Epilepsy and End Stage Renal Disease.Wisconsin Medical Journal.
2004;103(6): 64-67. PMID: 15622822
2. Finkelstein FO, Watnick S, Finkelstein SH, Wuerth D. The treatment of depression in patients maintained on dialysis. J
Psychosom Res. 2002;53: 957-960. PMID: 12377309
3. Rosdahl CB, Kowalski MT. Textbook of Basic Nursing. 10 ed. Philadelphia: Wolters Kluwer Health & Lippincott Williams &
Wilkins; 2012: 1514-17.
4. Hu A, Xue Z, Mwansisya TE, Zhou A, Pu W, Chen X, et al. Major depressive disorder in hemodialysis patients in China. Asia Pac
Psychiatry. 2015 Mar;7(1):78-84. doi: 10.1111/appy.12110. Epub 2013 Nov 21.
5. Hamody AR, Kareem AK, Al-Yasri AR, Sh Ali AA. Depression in Iraqi hemodialysis patients. Arab J Nephrol Transplant. 2013
Sep;6(3):169-72. PMID: 24053743
6. Fukunishi I, Kitaoka T, Shirai T. Psychiatric disorders among patients undergoing hemodialysis therapy. Nephron. 2002;
91:344. PMID: 12053079
7. Saeed Z, Ahmad AM, Shakoor A, Ghafoor F, Kanwal S. Depression in patients on hemodialysis and their caregivers. Saudi J
Kidney Dis Transpl. 2012 Sep;23(5):946-52. doi: 10.4103/1319-2442.100869.

Annals of Tropical Medicine & Public Health-Special Issue Mar 2018 Vol V
S204-18
8. Cucor D, Coplan J, Brown C, Fridmans S. Depression and Anxiety in Urban Hemodialysis Patients. Clin J Am SocNephrol.
2007;2(3): 484-90. PMID: 17699455
9. Afshar R, Ghaedi GH, Sanavi S, Davati A, Rajabpour A. Depression and related factors in patients undergoing conventional
maintenance hemodialysis. Daneshvar, Scientific-research Journal of Shahed University. 2010;17(88): 59-66. [Persian]
10. Mogharab M, Hedayati H, Najafi R, Safari M, Amiri S, Adhami S. Prevalence of depression and life events in hemodialysis
patients in Vali-Asr hospital in Birjand (2010). Modern Care. 2011;8(3): 125-134. [Persian]
11. Mahmody S, Salhnegad G, Nazaryan S, Yaghobi M. A comparison study of depression between hemodialysis patients and
renal transplant recipients. Iranian Journal of Nursing Research. 2010;5(18): 73-80. [Persian]
12. Joshwa B, Khakha DC, Mahajan S. Fatigue and depression and sleep problems among hemodialysis patients in a tertiary care
center. Saudi J Kidney Dis Transpl 2012; 23(4):729-35. PMID: 22805385
13. Bayat A, Kazemi R, Toghiani A, Mohebi B, Tabatabaee MN, Adibi N. Psychological evaluation in hemodialysis patients. J Pak
Med Assoc. 2012; 62(3 Suppl 2):S1-5. PMID: 22768447
14. Tanvir S, ButtGH, TajR. Prevalence of depression and anxiety in chronic kidney disease patients on haemodialysis. Ann Pak
Inst Med Sci. 2013; 9(2):64-7.
15. Amira O. Prevalence of symptoms of depression among patients with chronic kidney disease. Niger J Clin Pract. 2011 Oct-
Dec;14(4):460-3. doi: 10.4103/1119-3077.91756.
Annals of Tropical Medicine & Public Health-Special Issue Mar 2018 Vol V
S209-18
Perspectives of Iranian mothers with cerebral palsy child
about family coping
Parkhide Hassani1, Parvin Abbasi
2 ,3, Mansoureh Zagheri Tafreshi
4 & Farid Zayeri
5
1 Associate Professor, Faculty of Nursing and Midwifery, Shahid Beheshti University of Medical Sciences, Tehran, Iran 2 Students Research Office, School of Nursing and Midwifery, Shahid Beheshti University of Medical Sciences, Tehran,
Iran 3 Faculty of Nursing and Midwifery, Kermanshah University of Medical Sciences, Kermanshah, Iran 4 PhD Associate Professor, Nursing Management Department, School of Nursing and Midwifery, Shahid Beheshti
University of Medical Sciences, Tehran, Iran 5 Proteomics Research Center and Department of Biostatistics, Faculty of Paramedical Sciences, Shahid Beheshti
University of Medical Sciences, Tehran, Iran
Correspondence: Parvin Abbasi, Students Research office, School of Nursing and Midwifery, Shahid Beheshti University
of Medical Sciences, ValiAsr (aj) and Niayesh intersection, Tehran, Iran. Tel: 98-918-830-4657. E-mail:
Abstract
Introduction: The child with cerebral palsy is a serious challenge to families. It is essential to determine
coping style adopted by these families.
Purpose: The aim of this study was to assess family coping and its dimension in Iranian mothers with
cerebral palsy children and the relationship between demographic characteristic and family coping.
Materials and method: This was a descriptive study on 208 mothers with cerebral palsy children who
referred to seven rehabilitation centers in Kermanshah, Iran. The subjects were selected through
convenience sampling. The instruments were the demographic characteristics and family crisis Oriented
Personal Evaluation Scales. The data was analyzed in SPSS (v16).
Results: The mean age of mothers was 32±6.4 years and mean age of children was 59±3.75 months. The
mean family coping score was 97±16.80. Reframing and passive appraisal were the most and least common
strategies used in the families from the mothers’ viewpoint. Age, job, education, type of cerebral palsy had
no significant correlation with family coping.
Conclusion: Assessment of family coping is important and useful for the development of nursing
intervention aimed at facilitating family adaption in families with a child with cerebral palsy.
Introduction
Parenting is a stressful job not to mention intensity of the stresses of having a child with a disability [1]. A child with
disability is a serious crisis in the family [2]. Cerebral palsy is the third prevalent developmental disability and the
top prevalent progressive motor disability that causes variety of motor-sensory problems, mental damages,
developmental disorders, and functional limitations[3, 4]. Different countries publish inconsistent statistics as to
prevalence of the problem; still, global prevalence of the problem is 2-2.5 per 1000 live births[5]. The statistics in
this regard in Iran are not reliable[6].
Cerebral palsy is a complicated condition that creates different challenges for the child and family so that these
families have to handle special stresses and needs[7]. Evidences hint that parents of these children experience stress
level higher than those with normal children[8]. Brehaut et al. (2004) found that psychological distress and physical
and emotional problems of care givers to cerebral palsy children (mothers in 95% of cases) were significantly higher
than those of other care givers[9].
Functional limitations caused by cerebral palsy influences self-care capability of the child so that they need more
attention. In many cases, these children live with the family and mothers are the main care givers[3, 10, 11].
Therefore, not only it affects the life of the child[12], the disabilities consume main portion of the energy of the
family and mother in particular[13]. In general, the special needs of a cerebral palsy child cause general changes in
the function of the family so that it leads to disassociation among family members in absence of a proper coping

Annals of Tropical Medicine & Public Health-Special Issue Mar 2018 Vol V
S209-18
strategy [14]. Researchers in coping field believe that the way people approach stresses may increase or decrease the
negative effects of life events and situations[15].
The main trend of papers about families with a disable child or children with chronic diseases once was to
emphasize on the negative outcomes for the family; however, recently the coping style and adaptation to the hard
situation have been accentuated[7]. Improvement of coping skills of the parents of children with chronic condition is
effective on attenuation of anxiety and depression[16] (Churchill, et al., 2010), adaptability of the parents and better
performance of children [17], and quality of life of the children[18].
Different families have their own unique and different coping strategy and system. Professionals need to know what
is the exact coping strategies used in a family and what approaches are most helpful for a family[1].
As providers of an efficient support services, nurses need to have insight into the family coping strategies with
disable children [19]. They can help the mothers to have better comprehension about their disabilities and strengths,
spot the problems, develop solutions, and learn about new coping strategies [1]. Mothers’ responses to the pressures
caused by having a disable children ranges from a variety of psychological distresses to a successful adaptation [4].
The extent of successful adaptation depends on using internal and external coping strategies. The internal family
coping strategies are rooted in the family and passive appraisal and reframing are among them[20]; while the
external family coping strategies are rooted in external sources. Families may also rely on the society and social
support[21]. Seeking support spiritual and acquiring social supports are of the external coping strategies[20]. The
families that use the both internal and external supports tend to be more efficient in adapting to stressful
situations[21].
Family coping strategies in families with cerebral palsy children have not been thoroughly examined[14]. As
recommended by the literature review, coping strategies and attitudes are functions of different factors such as
social, cultural, economic, and political backgrounds[22]. Cultural beliefs about disabilities are key factors in
family’s perceptions of children’s disability. Positive perceptions, on the other hand, have the key role in coping so
that they may lead to better coping with stressful events[23]. Determining how the parents use coping strategies to
manage problems[22] and knowing the differences are of clinical value for the professional practitioner[24]. When
the health providers learn that a family is dealing with adaptation problems, they can adopt most efficient
intervention depending on the situation [25]. The best way that health providers may ensure about efficiency of their
services is to evaluate family’s coping strategy as a whole[26]. The present study is an attempt to determine coping
style of family and its aspects from point of view of Iranian mothers with cerebral palsy children. Moreover, the
relationship between family coping and some of demographics of the mothers was examined.
Methodology
A descriptive cross-sectional study was carried out as a part of a PhD dissertation on nursing in Shahid Beheshti
University of Medical Sciences. Data gathering was done in a seven-month period from March 2015 to September
2015. Participants were 208 mothers with cerebral palsy child at the age range 1-12 years who referred to seven
rehabilitation centers in Kermanshah city. Inclusion criteria were definite diagnosis of cerebral palsy by a
pediatrician, the problem be diagnosed for more than one year, only one children with cerebral palsy or any other
disability in the family, the both parents live with the child, ability to speak Farsi, no mental disease in the mother.
The participants were selected through convenient sampling and the participants were briefed about the purpose and
process of the study before signing an informed letter of consent.
Data gathering tool included a demographics questionnaire (age, gender, type of cerebral palsy, duration of the
disease, gross motor function level, mother’s age/occupation/education, and number of children) and family crises
oriented personal evaluation scales (F-COPES) to determine family coping strategy and its aspects. F-copes was
designed by Olson, Larsen and McCubbin in 1981 including 30 statements designed based on Likert’s five-point
scale (1= completely agree,…, 5= completely disagree) with five subscales of passive appraisal, family mobilization
to acquire and accept help, seeking spiritual support, acquiring social support, and reframing. Maximum and
minimum scores are 150 and 30 respectively and the higher the score the better the coping behavior with stressful
situation.

Annals of Tropical Medicine & Public Health-Special Issue Mar 2018 Vol V
S209-18
Internal consistency of F-COPES (α = 0.86) is supported and α-value of the subscales ranges from 0.63 to 0.83.
Retest consistency coefficient with four weeks internal is 0.81, which is acceptable. Subscales consistency
coefficient was between 0.61 and 0.95 [20, 27].
The collected data was analyzed in SPSS (v.16) and the results were represented using descriptive and analytical
statistics such as mean, standard deviation (SD), frequency, percentage, quantitative variables, and tables. To
examine relationship between the variables, t-test, ANOVA, and post-hoc tests were used. Level of significant was
(p<0.05).
Results
The demographical findings are listed in Table 1; 88.5% of the mothers were 20-40 years old, 11.5% were older
than 40 years, 90.9% were housewives, and 83.6% had one or two children.
Table 1. Demographic characteristics of mothers of children with cerebral palsy, Kermanshah, Iran (2015)
Variable Cluster N %
Mothers’ age (year) 20-30
31-40
41>
93
91
24
44.7
43.8
11.5
Mothers’ education
Illiterate
Elementary
Junior high school
High school
Higher education
5
47
55
77
24
2.4
22.6
26.5
37
11.5
Occupation Housewife
Office employee
Others
189
16
3
90.9
7.7
1.4
Number of children 1
2
3
4≥
102
72
23
11
49
34.6
11.1
5.3
Child’s age (months) 12-36
37-83
84-144
79
77
52
38
37
25
Gender of the child Girl
Boy
99
109
47.6
52.4
Type of cerebral palsy Quadriplegia
Diplegia
Hemiplegia
Athetoid
Hypotonus
Ataxic
34
70
69
9
18
8
16.3
33.7
33.2
4.3
8.7
3.8
GMFCS
Level 1
Level 2
Level 3
Level 4
Level 5
41
30
52
53
32
19.7
14.4
25
25.5
15.4
Duration of disease (month) 12-24
25-36
47
48
22.6
23
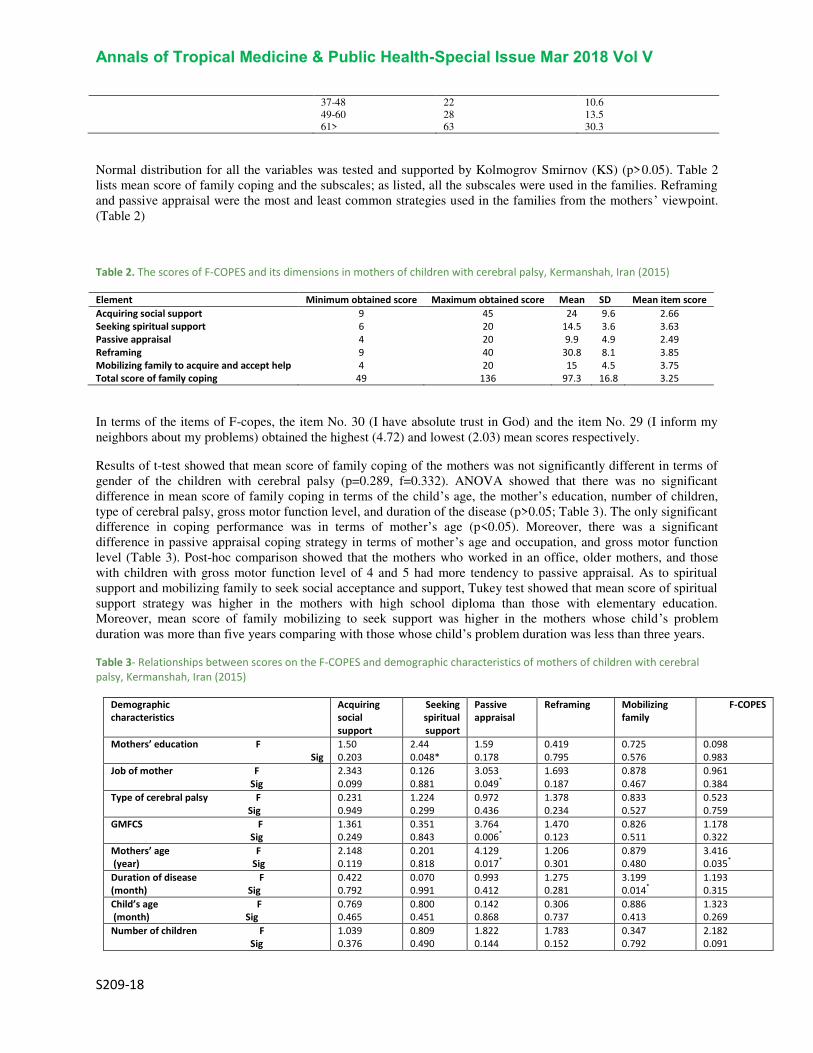
Annals of Tropical Medicine & Public Health-Special Issue Mar 2018 Vol V
S209-18
37-48
49-60
61>
22
28
63
10.6
13.5
30.3
Normal distribution for all the variables was tested and supported by Kolmogrov Smirnov (KS) (p>0.05). Table 2
lists mean score of family coping and the subscales; as listed, all the subscales were used in the families. Reframing
and passive appraisal were the most and least common strategies used in the families from the mothers’ viewpoint.
(Table 2)
Table 2. The scores of F-COPES and its dimensions in mothers of children with cerebral palsy, Kermanshah, Iran (2015)
Element Minimum obtained score Maximum obtained score Mean SD Mean item score
Acquiring social support 9 45 24 9.6 2.66
Seeking spiritual support 6 20 14.5 3.6 3.63
Passive appraisal 4 20 9.9 4.9 2.49
Reframing 9 40 30.8 8.1 3.85
Mobilizing family to acquire and accept help 4 20 15 4.5 3.75
Total score of family coping 49 136 97.3 16.8 3.25
In terms of the items of F-copes, the item No. 30 (I have absolute trust in God) and the item No. 29 (I inform my
neighbors about my problems) obtained the highest (4.72) and lowest (2.03) mean scores respectively.
Results of t-test showed that mean score of family coping of the mothers was not significantly different in terms of
gender of the children with cerebral palsy (p=0.289, f=0.332). ANOVA showed that there was no significant
difference in mean score of family coping in terms of the child’s age, the mother’s education, number of children,
type of cerebral palsy, gross motor function level, and duration of the disease (p>0.05; Table 3). The only significant
difference in coping performance was in terms of mother’s age (p<0.05). Moreover, there was a significant
difference in passive appraisal coping strategy in terms of mother’s age and occupation, and gross motor function
level (Table 3). Post-hoc comparison showed that the mothers who worked in an office, older mothers, and those
with children with gross motor function level of 4 and 5 had more tendency to passive appraisal. As to spiritual
support and mobilizing family to seek social acceptance and support, Tukey test showed that mean score of spiritual
support strategy was higher in the mothers with high school diploma than those with elementary education.
Moreover, mean score of family mobilizing to seek support was higher in the mothers whose child’s problem
duration was more than five years comparing with those whose child’s problem duration was less than three years.
Table 3- Relationships between scores on the F-COPES and demographic characteristics of mothers of children with cerebral
palsy, Kermanshah, Iran (2015)
F-COPES Mobilizing
family Reframing Passive
appraisal Seeking
spiritual
support
Acquiring
social
support
Demographic
characteristics
0.098
0.983 0.725
0.576 0.419
0.795 1.59
0.178 2.44
0.048* 1.50
0.203 Mothers’ education F
Sig 0.961
0.384 0.878
0.467 1.693
0.187 3.053
0.049*
0.126
0.881 2.343
0.099 Job of mother F
Sig 0.523
0.759 0.833
0.527 1.378
0.234 0.972
0.436 1.224
0.299 0.231
0.949 Type of cerebral palsy F
Sig 1.178
0.322 0.826
0.511 1.470
0.123 3.764
0.006*
0.351
0.843 1.361
0.249 GMFCS F
Sig 3.416
0.035*
0.879
0.480 1.206
0.301 4.129
0.017*
0.201
0.818 2.148
0.119 Mothers’ age F
(year) Sig 1.193
0.315 3.199
0.014*
1.275
0.281 0.993
0.412 0.070
0.991 0.422
0.792 Duration of disease F
(month) Sig 1.323
0.269 0.886
0.413 0.306
0.737 0.142
0.868 0.800
0.451 0.769
0.465 Child’s age F
(month) Sig 2.182
0.091 0.347
0.792 1.783
0.152 1.822
0.144 0.809
0.490 1.039
0.376 Number of children F
Sig

Annals of Tropical Medicine & Public Health-Special Issue Mar 2018 Vol V
S209-18
Discussion
Adaptation is not possible in the families with a cerebral palsy child without an efficient coping strategy. Since
mothers are the main care givers in Iranian families [28], their point view was assessed in the present study.
The results indicated that mean score of family coping was 97.3, which is close to the score obtained for the mothers
of autism children (95.5) [21]. Since the family coping score is comprised of five subscales and the three subscales
of reframing, seeking spiritual support, and mobilizing family to acquire support and acceptance were measured by
the present study and Twoy et al.’s study, the results of these two studies are comparable.
Additionally, the results indicated that reframing was the most commonly used strategy in families with cerebral
palsy child; this result in consistent with Twoy et al. (2007), Kristic and Oros (2012), and Churchill et al., (2010)[14,
16, 21].
Lin (2000) showed that successful adaptation was significantly related to using reframing in the mothers of cerebral
palsy child at school age [7]. Reframing helps the mothers in cognitive reformation of problems in painful and
unpleasant situations so that such situations become more acceptable [14]. Apparently, the families had come to an
understanding that the stressors were indispensable part of life and reframing enabled them to redefine the themes in
a positive manner. Through this, they can find a solution to deal with the problems.
The study showed that the subscale social support was less frequently used by the families; so that the item No. 29 (I
inform my neighbors about my problem; score = 2.02) and the item No. 8 (I accept my neighbors’ gifts and
supports; score = 2.20) obtained the lowest scores. Ayrault (2001) showed that some their participants tended to
keep their distance from their friends, neighbors, and relatives as the mothers were afraid that they might not
understand specific needs of their children [29]. Twoy (2007) reported that the neighbors’ score was low and 68% of
the participants tended to share their problems with their friends [21]. Lin (2000) reported that the item No.29 (mean
score=3.29) and the item No. 8 (mean score = 3.33) obtained the highest scores [7]. In addition, Pritzlaff (2001)
showed that gaining social support was a frequently used approach by the mothers [30]. Moawad (2012) maintained
that following reframing and seeking social support was the mostly used approaches by the families from the
mothers’ point of view. Given that seeking social support is defined in F-COPES with the elements friends,
neighbors, and relatives’ support, the inconsistent findings by different studies can be explained by families’ different attitudes and cultural differences about disabilities. At any rate, there is a need for further studies on
families’ attitudes and cultural differences as to disabilities and seeking social support.
Given the necessity of gaining social support, it seems that preventive plans need to be implemented for the families
with cerebral palsy children and it is imperative to design interventions to support seeking social support in these
families.
The results also showed that there was no significant relationship between family coping score based on
demographical specifications except for mothers’ age. The results were consistent with the studies that showed there
was no significant relationship between coping and education level [1, 21]. However, Kumar (2008) showed that the
mothers with higher education level tended to have higher coping score [31].
Passive appraisal score of the mothers of children with gross motor function level of 4 and 5 was higher than that of
the rest of participants. Since the higher motor problems mean that the child would have more problems, parents of
such children tend to adopt passive appraisal approach as a passive approach.
Post hoc test (Tukey) showed that the mothers older than 40 years had more tendency to use passive appraisal; so
that other aspect of life of these mother may change along with aging and lead to more tendency to passive
appraisal. There is a need for further studies in this field.
As to higher mean score of family mobilization to seek support and acceptance, increase of duration of disease
increases the necessity of seeking medical advices and to cover this need, families tend to consult with other families
in similar situation, social institutes, and physicians. Twoy et al. (2007) showed that 93% of the participants sought

Annals of Tropical Medicine & Public Health-Special Issue Mar 2018 Vol V
S209-18
information from other families in similar condition [21]. It is notable that the score of the item No.4 (“asking for
information from families in similar situation) was 4.10.
In terms of limitations of the present study, small study group and the fact that participants were selected only
among the mothers who had referred to rehabilitation centers are notable. Therefore, the results cannot be
generalized to other mothers with cerebral palsy children. Similar studies can be done on other family members such
as siblings. Comparative studies on mother and fathers at different stage of development of the child with cerebral
palsy is also recommended. A quantitative study may examined the different aspects of the phenomenon.
Conclusion
From mother’s perspective, different coping strategies are adopted to face the problems. Reframing was the most
common strategy used by families. The results can be used by healthcare givers for implementing better support
programs and improving coping skills of the parents and families. Without the support provided by healthcare
givers, families might be led toward using improper coping method, which is not constructive for long/short-term
adaptation to the disease of children. Moreover, psychological stresses of the caregivers of cerebral palsy children
decrease the chance of finding a proper coping strategy.
Acknowledgement
The study was a part of a PhD dissertation on nursing in Shahid Beheshti University of Medical Science (Tehran,
Iran). The authors wish to thank the officials of the Faculty of Nursing and Midwifery, Kermanshah Wellbeing
Organization, and all the officials and personnel of Kermanshah-based rehabilitation centers. We also thank all the
mothers who took part in the study.
References:
1. Moawad, G.E.N.A., Coping strategies of mothers having children with special needs. J Biol Agric Health c, 2012. 2(8): p.
77-84.
2. Huang, Y.P., U.M. Kellett, and W. St John, Cerebral palsy: Experiences of mothers after learning their child’s diagnosis. J
Adv Nurs, 2010. 66(6): p. 1213-1221.
3. Raina, P., et al., Caregiving process and caregiver burden: conceptual models to guide research and practice. BMC
Pediatr, 2004. 4(1): p. 1.
4. Begum, R. and O. Desai, A comparative study to evaluate psychological status of mothers of children with cerebral palsy
and mothers of normal children. IJOT, 2010. 42(2): p. 3-9.
5. Quinn, T. and C. Gordon, The Effects of Cerebral Palsy on Early Attachment: Perceptions of Rural South African Mothers.
. J. Hum. Ecol Delhi, 2011. 36(3): p. 191.
6. Alaee N, Mohammadi-Shahboulaghi F, Khankeh H, Mohammad Khan Kermanshahi S, Voiceless shout: Parents'
experience of caring for child with cerebral palsy. Hayat, 2013. 19(2): p. 51-66.
7. Lin, S.-L., Coping and adaptation in families of children with cerebral palsy. Except Child, 2000. 66(2): p. 201-218.
8. Glenn, S., et al., Maternal parenting stress and its correlates in families with a young child with cerebral palsy. Child Care
Health Dev, 2009. 35(1): p. 71-78.
9. Brehaut, J.C., et al., The health of primary caregivers of children with cerebral palsy: how does it compare with that of
other Canadian caregivers? Pediatrics, 2004. 114(2): p. e182-e191.
10. Brehaut, J.C., et al., Health among caregivers of children with health problems: findings from a Canadian population-
based study. Am J Public Health, 2009. 99(7): p. 1254.
11. Jeong, Y.-G., Y.-J. Jeong, and J.-A. Bang, Effect of social support on parenting stress of Korean mothers of children with
cerebral palsy. J Phys Ther Sci, 2013. 25(10): p. 1339.
12. Mobarak, R., et al., Predictors of stress in mothers of children with cerebral palsy in Bangladesh. J Pediatr Psychol, 2000.
25(6): p. 427-433.
13. Prudente, C.O.M., M.A. Barbosa, and C.C. Porto, Relation between quality of life of mothers of children with cerebral
palsy and the children's motor functioning, after ten months of rehabilitation. Rev Latinoam Microbiol, 2010. 18(2): p.
149-155.
14. Kristic, T. and M. Oros, Coping with stress and adaptation in mothers of childern with cerebral palsy. Med Pregl, 2012.
9-10(September-October): p. 373-377.
15. Skinner, E.A., et al., Searching for the structure of coping: a review and critique of category systems for classifying ways
of coping. Psychol Bull, 2003. 129(2): p. 216.

Annals of Tropical Medicine & Public Health-Special Issue Mar 2018 Vol V
S209-18
16. Churchill, S.S., et al., Parents of children with special health care needs who have better coping skills have fewer
depressive symptoms. Matern and Child Health J, 2010. 14(1): p. 47-57.
17. Manuel, J., et al., Stress and adaptation in mothers of children with cerebral palsy. J Pediatr Psychol, 2003. 28(3): p. 197-
201.
18. Shelly, A., et al., The relationship between quality of life and functioning for children with cerebral palsy. Dev Med Child
Neurol, 2008. 50(3): p. 199-203.
19. Sen, E. and S. Yurtsever, Difficulties experienced by families with disabled children. J Spec Pediatr Nurs, 2007. 12(4): p.
238-252.
20. Corcoran, K. and J. Fischer, Measures for Clinical Practice and Research, Volume 1: Couples, Families, and Children. Vol.
1. 2013: Oxford University Press.
21. Twoy, R., P.M. Connolly, and J.M. Novak, Coping strategies used by parents of children with autism. J Am Acad Nurse
Pract, 2007. 19(5): p. 251-260.
22. Li-Tsang, C.W.-P., M.K.-S. Yau, and H.K. Yuen, Success in parenting children with developmental disabilities: Some
characteristics, attitudes and adaptive coping skills. Brit J Dev Disabil, 2001. 47(93): p. 61-71.
23. Gupta, A. and N. Singhal, Positive perceptions in parents of children with disabilities. APDRJ, 2004. 15(1): p. 22-35.
24. Kuo, B.C., Culture’s Consequences on Coping Theories, Evidences, and Dimensionalities. J. Cross-Cult. Psychol, 2011.
42(6): p. 1084-1100.
25. Rentinck, I., et al., Parents of children with cerebral palsy: a review of factors related to the process of adaptation. .
Child Care Health Dev, 2007. 33(2): p. 161-169.
26. Wippermann, J.A., The Quality of Life of Families of Children with Cerebral Palsy. 2013.
27. Chui, W.Y.Y. and S.W.C. Chan, Stress and coping of Hong Kong Chinese family members during a critical illness. JCN,
2007. 16(2): p. 372-381.
28. Sajjadi, M., et al., Psychometric properties of the Persian version of the Mishel's Uncertainty in Illness Scale in Patients
with Cancer. Eur J Oncol Nurs, 2014. 18(1): p. 52-57.
29. Ayrault, E.W., Beyond a physical disability: the person within; a practical guide. 2001: Continuum.
30. pritzlaff, A., Examine the coping strategies of the parents who have children with disabilities 2001, University of
Wisconsin- Stout.
31. Venkatesh Kumar, G., Psychological stress and coping strategies of the parents of mentally challenged children. JIAAP,
2008. 34(2): p. 227-231.

Annals of Tropical Medicine & Public Health-Special Issue Vol V
S206-18
Assessment of musculoskeletal Disorders in Iranian
dentists
Safoura Ghodsi1, Javad Vatani2*, Maryam ghaljahi3
1) Assistant professor, dental research center, dentistry research institute and Department of prosthodontics, school of dentistry, Tehran University of Medical Sciences, Tehran, Iran 2*) Assistant Professor, Department of occupational health,Guilan Road Trauma Research Center, School of public health, Guilan University of Medical Sciences, Rasht, Iran 3- Department of occupational health, Zabol University of Medical Sciences, Zabol., Iran *Corresponding Author E-mail: [email protected]
Authors’ Contribution: Safoura Ghodsi, Javad Vatani, Maryam ghaljahi, writing the first draft and contribution to final draft and analysis; Safoura Ghodsi, Javad Vatani, Maryam ghaljahi, design of study, collection of data, contribution to final draft; Safoura Ghodsi, Javad Vatani, Maryam Ghaljahi, collection of data, supervision of group, contribution to first draft, final draft and supervision on analysis of data. Funding/Support: This work was conducted with the support of Tehran University of Medical Sciences (Grant# 24827).
Abstract:
The major work–related disorders in workplaces are musculoskeletal disorders, which are the main reasons for workers’ disability. This study was performed to evaluate the prevalence of contributing factors to musculoskeletal pain in dentistry. A descriptive analytical study was conducted on 200 dentists in Tehran, Iran. Nordic standard questionnaire was used to collect data about musculoskeletal disorders via interview; Postural evaluation was performed by direct observation during work; photos were taken; videos were recorded; and REBA (Rapid Entire Body Assessment) was used for data collection. Ethics statement: the study was authorized to use human subjects by the university human research ethics committee (Irct ID: IRCT2014051117649N1). The prevalence (95% confidence interval (CI)) of neck, shoulder, elbow, wrist, low back, and knee pains in the study sample were 22.0% (28.39 – 16.46), 25.5% (19.61 – 32.13 ), 8.5 (5.02 -13.26), 18.5 (13.37 – 24.59), 32.16 (25.72 – 38.60), and 32.5 (26.06 – 39.46), respectively. Based on multiple logistic regression results, the relationship between occurrence of musculoskeletal disorders in different parts of body and ergonomic factors such as working hours, height, work precedent, and demographic factors such as age, sex, marital status, and education was significant (P value≤0.05). Postural evaluation during work using REBA, indicated high risk of musculoskeletal disorders for the dentists. Most of the determinants of musculoskeletal pain including being forced to work, job dissatisfaction, and body posture during work can be controlled. Therefore, the managers and decision makers’ attention in improving the quality of working conditions is important along with specific occupational health education .
Keywords: Musculoskeletal pain, Nordic Questioner, Ergonomic, REBA Method
Introduction
High prevalence rates of work-related musculoskeletal disorders (WRMSDs) among dentists have been reported [1-8]. Dentists are at high risk of musculoskeletal disorders [MSD]. WMSDs are of the leading causes of disability and discomfort in dentists [9-14].
In general, Pain in dentists were associated with the following characteristics: awkward posture, and excessive tightening of the back during work; and the application of vibrating tools and equipment not designed ergonomically [4]. The musculoskeletal disorders that are on the rise worldwide has numerous
repercussions from serious ill-health effects at quality of life [9]. A poor ergonomic posture could make the dental students get habituated to the wrong working style which might lead to MSDs [10]. Professional Hazards are becoming an impending health problem in various specialties and dentists are no exception according to the nature of the stressful work they perform. Dentists are constantly exposed to a number of specific occupational hazards, which develop and intensify with years [8]. Musculoskeletal pain and injury (most often in the back, neck, shoulders, hands, wrists, and thumbs) are associated with minute and repetitive strains during work [11].

Annals of Tropical Medicine & Public Health-Special Issue Vol V
S206-18
The common painful areas of the body were reported as follows: neck (43.4%), back (35.8%), and shoulder and wrist (each 25%). A relatively high prevalence of musculoskeletal pain has been revealed among dentists. [3].
Dantas reported that the highest prevalence of complaints was related to the lower back (58.4%) and the lowest prevalence was found in the elbow (10.3%) [4].
In another study, 62% of dentists had at least one musculoskeletal complaint, 30% reported chronic complaints, 16% had spells of absence and, 32% sought medical care [6].
In Kurşun study the prevalence of musculoskeletal pain was 49% in postgraduate dental students. The lower back was found to be the most commonly affected area [34%]. [15].
The mentioned results reemphasize the need for ergonomic preventive cares in dentistry and the importance of training on ergonomic principles from the beginning of the clinical course. Furthermore, special attention should be paid to the design of working environment based on ergonomic principles [15].
Despite many studies on musculoskeletal disorders, there is still no clear and scientific method to evaluate risk factors of musculoskeletal disorders with REBA Method, and the ones available have some defects. The ultimate aim of the present study is to provide a new method to assess risk factors of musculoskeletal disorders in various phases of dental practice of 1) oral implantology and endodontics, 2) oral and maxillofacial surgery, 3) orthodontics and dentofacial orthopedics, 4) pedodontics, and 5) periodontics.
Materials and Methods
The present study is a descriptive analytical study on 200 dentists during dental practice in Tehran, Iran in 2015.
Data collection
Demographic/occupational and Nordic standard questionnaires were employed for data collection. Demographic questions consisted of age, marital status, number of children, working hours per week, work history, lifting 25 kilograms or more per day, working with hands above shoulder level, repetitive movements of wrist and fingers, rewards, staff and managers’ support, job satisfaction, and perceived occupational safety information; the Nordic standard questionnaire related to back, neck, shoulder, elbow, and wrist pains [1-2].
Working position
200 dentists were randomly selected and their posture during work was evaluated via observation, taking photo, recording video, and REBA (Rapid Entire Body Assessment).
Dentistry profession was divided into five tasks: oral implantology and endodontics, oral and maxillofacial surgery, orthodontics and dentofacial orthopedics, pedodontics, and Periodontics. Afterward, the risk level of each task was calculated using REBA software. This is one of the most recent techniques of analysis the body position during work to evaluate possible risks of MSDs. REBA is one of the observational methods in postural evaluation. This method, a quick way to evaluate body posture within a short time, was first introduced in 1995 by Lynn Mac Atamny and Hygnt [16].
REBA procedure
In this procedure, different parts of the body are divided into two groups, A and B for analysis:
A) Trunk, neck, and feet postures consist of 60 combined postures.
B) Arms, forearms, and wrists postures consist of 36 combined postures.
Considering factors such as range and direction of joint motion, rate of force exertion, the tool griping mode and activity, and the score of each limb was calculated. In the next stage, the total score was estimated using specific REBA tables. The final score represented the potential exposure to MSDs. The validity and reliability of the instrument are confirmed in numerous studies [16].
Ethics statement.
This trial was registered in Iranian Registry of Clinical Trials (Irct ID: IRCT2014051117649N1). The study was authorized to use human subjects by the university human research ethics committee.
Statistical analysis
Chi-square and multiple logistic regression analysis were used for data analysis.
Results and Discussion
Subjects’ average age was 31.38 ± 9.54 years with a range of 15-67 years. 78% of the subjects were male and 22% female. In terms of marital status, 62% were married, 37% single, and 1% were widows. Average height of the subjects was 170.23 ± 8.68 cm, and 45.5% of the subjects had a family history of MSDs.
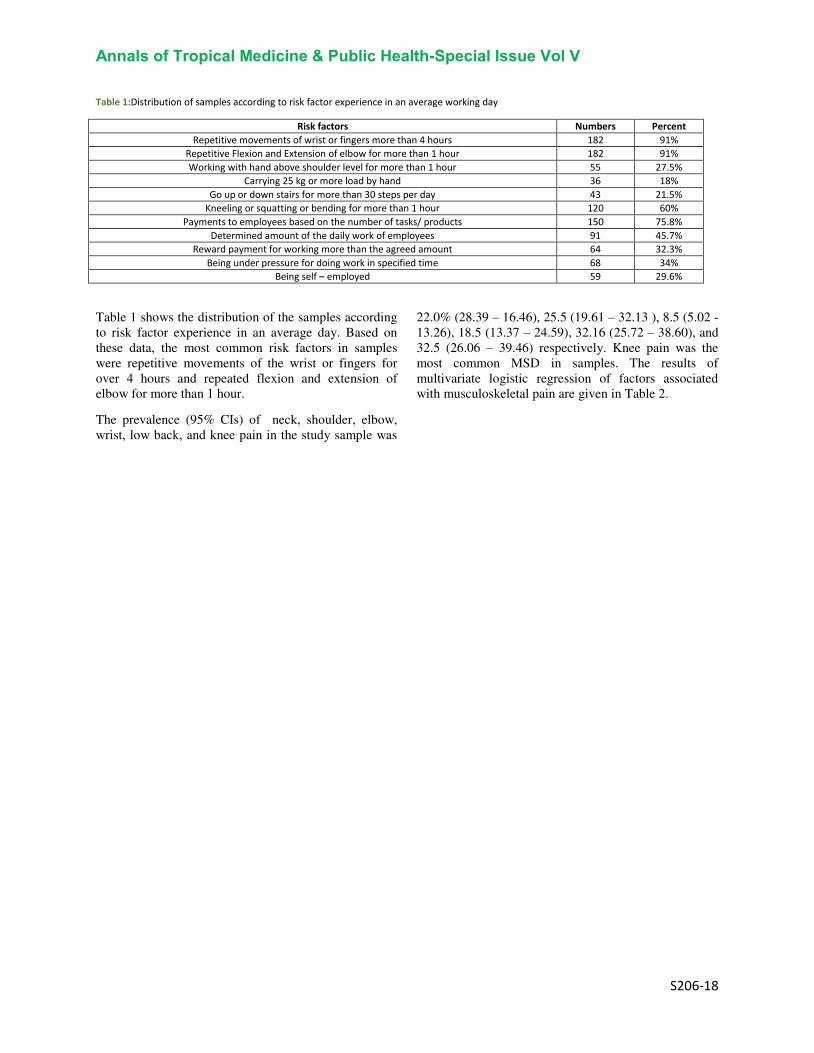
Annals of Tropical Medicine & Public Health-Special Issue Vol V
S206-18
Table 1:Distribution of samples according to risk factor experience in an average working day
Risk factors Numbers Percent
Repetitive movements of wrist or fingers more than 4 hours 182 91% Repetitive Flexion and Extension of elbow for more than 1 hour 182 91%
Working with hand above shoulder level for more than 1 hour 55 27.5% Carrying 25 kg or more load by hand 36 18%
Go up or down stairs for more than 30 steps per day 43 21.5% Kneeling or squatting or bending for more than 1 hour 120 60%
Payments to employees based on the number of tasks/ products 150 75.8%
Determined amount of the daily work of employees 91 45.7% Reward payment for working more than the agreed amount 64 32.3%
Being under pressure for doing work in specified time 68 34% Being self – employed 59 29.6%
Table 1 shows the distribution of the samples according to risk factor experience in an average day. Based on these data, the most common risk factors in samples were repetitive movements of the wrist or fingers for over 4 hours and repeated flexion and extension of elbow for more than 1 hour.
The prevalence (95% CIs) of neck, shoulder, elbow, wrist, low back, and knee pain in the study sample was
22.0% (28.39 – 16.46), 25.5 (19.61 – 32.13 ), 8.5 (5.02 -13.26), 18.5 (13.37 – 24.59), 32.16 (25.72 – 38.60), and 32.5 (26.06 – 39.46) respectively. Knee pain was the most common MSD in samples. The results of multivariate logistic regression of factors associated with musculoskeletal pain are given in Table 2.

Annals of Tropical Medicine & Public Health-Special Issue Vol V
S206-18
Table 2:Results of multivariate logistic regression of factors associated with musculoskeletal pain
P-value 95% CIs Odds
ratio Factors Limb
0.013 1.23-5.47 2.59 Family history of musculoskeletal pain Neck 0.001 1.80-8.53 3.92 Being under pressure for doing work at specified time
0.070 0.21-1.07 0.47 Reward payment for working more than the amount that was agreed
<0.001 6.35-42.35 5.18 Back pain
Shoulder <0.001 2.22-12.12 16.40 Neck pain 0.034 0.008-0.83 0.083 Being left-handed
0.027 0.13-0.87 0.34 Proportion of money received with the type of activity
0.010 1.76-68.74 10.98 Being self – employed
Elbow
<0.001 2.53-173.30 20.99 Shoulder pain
<0.001 4.44-161.22 26.80 Wrist pain
0.019 1.75-483.44 29.08 Being left handed
0.010 0.002-0.43 0.03 Repetitive movements of wrist or fingers for more than 4 hours
0.008 1.03-1.23 1.13 Age
0.008 1.351-7.226 3.124 Shoulder pain Wrist pain
0.000 2.761-29.969 9.097 Elbow pain
0.009 1.297-6.309 2.861 Sex
Back pain
0.000 1.29-6.30 4.02 Family history of musculoskeletal pain 0.013 1.22-5.30 2.54 Being under pressure for doing work at specified time 0.010 0.962-0.994 0.978 Working time per week 0.013 0.374-14.732 0.499 Lack of job security
0.051 0.19-1.004 0.44 Reward payment for working more than the amount that was agreed
0.002 1.672-9.986 4.086 Marital status
Knee pain
0.025 0.221-0.903 0.477 Education 0.044 0.927-0.999 0.962 Working time per week
0.002 1.216-2.314 1.678 Working time per day
0.043 0.0452-0.950 0.207 Working with hand higher than shoulder level for more than 1 hour 0.013 1.245-6.222 2.784 Kneeling or squatting for more than 1 hour in a day
- - - Often
Decision making about how to do the work 0.035 0.004-0.815 0.059 Some times
0.098 0.009-0.815 0.121 seldom 0.926 0.016-42.17 0.831 Never
- - - Often
Decision making about type of the work 0.016 0.016-42.17 25.15 Some times 0.006 2.874-473.03 36.87 Seldom 0.561 0.045-0.950 2.207 Never

Annals of Tropical Medicine & Public Health-Special Issue Vol V
S206-18
This table shows the factors significantly correlated with pain in the neck, and includes family history of musculoskeletal pain, pressure to do the job at a specified time, and getting reward for doing extra work. The first two variables were directly related to the risk of neck pain, but the third variable was reversely related.
The correlation between back pain, neck pain, being left-handed, and the balance between income and type of activity with shoulder pain was statistically significant. Back and neck pain increased the occurrence of shoulder pain, but the other two variables reduced it.
The correlation between self-employment, shoulder pain, wrist pain, being left-handed, repetitive movements of the wrist or fingers for more than 4 hours, and age with elbow pain was statistically
significant. Among different variables, the correlation between shoulder and elbow pain with wrist pain was significant.
The correlation between gender, family history of musculoskeletal pain, being pressured to do the job at the specified time, working hours per week, lack of occupational safety, and getting reward for doing extra work was significant with back pain. Among these variables, the last factor reduced the occurrence of back pain significantly.
The correlation between marital status, education, working hours per week and per day, being left-handed, kneeling or squatting more than an hour during the day, the decision on how to perform work, and making decisions about the type of work was statistically significant with knee pain.
Table 3:The results of evaluating working posture in dentists using REBA method
Left limb Right limb Task
Requirement of
practical action Danger level
Requirement of practical
action Danger level
Is required quickly Very high Is required quickly Very high Oral Implantology and Endodontics
Is required quickly Very high Is required quickly Very high Oral and maxillofacial surgery
Is required quickly Very high Is required quickly Very high Orthodontics and dentofacial orthopedics
Is required quickly Very high Is required quickly Very high Pedodontics
Is required as soon as possible
High Is required as soon as
possible High Periodontics
Evaluation of working posture in dentistry using REBA (Table 3) showed that oral implantology and endodontics, oral and maxillofacial surgery, orthodontics and dentofacial orthopedics, pedodontics and periodontics had very high scores of working position, and risk of MSDs in the right and left limbs of workers in these tasks was too high. Furthermore, the risk of MSDs in all dentistry fields was high, and the score of working position in this task, was high based on REBA. These results show that working posture has to improve.
The study Rabiei [3], Dantas [4], Cherniack [5], and Alexopoulos [6] showed that high prevalence of MSDs in dentists was related to time-worn, low rest, static working pressure, and repetitive movements. This findings are in agreement with the present study.
The present study showed that knee pain and back pain (trunk) were the most common musculoskeletal pains among dentists. Åkesson [7], Sakzewski [9], Dable [10] studies showed that the most common
MSDs in Dentistry were in the trunk, neck, and shoulders that is in agreement with a part of the present study’s results. But, it does not approve Kumar [12] that found a high prevalence of neck and shoulder pain in dentists. Harvin [11] suggested that MSDs were resulted from improper work station design which is consistent with the present study’s results.
Thanathornwong BS. [13], Kozak AS. [14], Kurşun ŞE. [15] Suggested a strong relationship between musculoskeletal pain (e.g. neck and shoulder pain) and stress in workplace that is resulted from being under pressure to do the work and lack of security in work. These studies confirmed the present study’s results. Evaluation of working position using REBA showed that dentistry had a very high score in 1. Oral Implantology and endodontics, 2. Oral and maxillofacial surgery, 3. Orthodontics and dentofacial orthopedics, 4. Pedodontics for MSDs. This result confirms Bennadi DK. [8] study who

Annals of Tropical Medicine & Public Health-Special Issue Vol V
S206-18
declared MSDs have a high prevalence in some works like Dentistry.
Conclusions
Several studies have been done on different industries employees to assess MSDs prevalence and management such as the study by Sadeghian [1] on Clinical Laboratory Workers and Oakmana [17], on non-nursing health care sector employees.
The present study suggests further epidemiological studies with the aim of modifying work stations and work time of dentists to reduce pressure on body limbs. Furthermore, it proposes ergonomic training with the aim of improving the existing situation and eliminating the static working status to reduce MSDs. The same suggestion is also emphasized by other
researchers such as Gupta [18] and Valachi [19]. The present study suggests further Evaluation economic of ergonomics studies with the aim of modifying work stations and reduce MSDs prevalence and control accident at work (20-21).
Acknowledgements
The authors would like to thank the vice-chancellery of Tehran University of Medical Sciences and health services, Tehran, Iran, for supporting the research (Grant# 24827).
Reference:
1- Sadeghian F, Noroozi P, Vatani J, Taiebi SH. Psychosocial and individual characteristics and musculoskeletal complaints among clinical laboratory workers. International Journal of Occupational Safety and Ergonomics. 2014; 20(2):355-361. 2- Chaman R, Sadeghian F, Vatani Shoaa J, Masoudi M. Psychosocial Factors and Musculoskeletal Pain Among Rural Hand-woven Carpet Weavers in Iran. Safety and Health at Work. 2015; 6:120-127. 3- Rabiei M, Dehghan Shahreza H, Talebzadeh M. Musculoskeletal Disorders in Dentists. International journal of occupational hygiene. 2012. 4: 36-40. 4- Dantas FFO, Lima KC. The relationship between physical load and musculoskeletal complaints among Brazilian dentists. Applied Ergonomics. 2015; 47: 93-98. 5- Cherniack MG, Bjor B. Musculoskeletal disease and disability in dentists. Work; 2010. 35(4): 411-418. 6- Alexopoulos EC, Stathi LC, Charizani F. Prevalence of musculoskeletal disorders in dentists. BMC Musculoskeletal Disorders; 2004. 5: 16. 7- Åkesson I, Balogh I, Hansson G. Physical workload in neck, shoulders and wrists/hands in dental hygienists during a work-day. Applied Ergonomics; 2012. 43(4): 803-811. 8- Bennadi DK, Kshetrimayum N, Reddy V. Occupational hazards in dentistry. Research Journal of Pharmaceutical, Biological and Chemical Sciences 2014. 5(3): 1605-1614. 9- Sakzewski L, Naser-ud-Din S. Work-related musculoskeletal disorders in dentists and orthodontists: A review of the literature. Work; 2014. 48(1): 37-45. 10- Dable RA, Wasnik PB, Yeshwante BJ, Musani SI, Patil AK, Nagmode SN. Postural Assessment of Students Evaluating the Need of Ergonomic Seat and Magnification in Dentistry. The Journal of Indian Prosthodontic Society. 2014; 14: 51-58. 11- Harvin G. Review of musculoskeletal injuries and prevention in the Endoscopy practitioner (Review). Journal of Clinical Gastroenterology; 2014. 48(7): 590-594.
12- Kumar DK, Rathan N, Mohan S, Begum M, Prasad B, Prasad ERV. Exercise prescriptions to prevent musculoskeletal disorders in dentists (Review). Journal of Clinical and Diagnostic Research. 2014; 8(7): 13-16. 13- Thanathornwong B, Suebnukam S, Songpaisan Y, Ouivirach K. A system for predicting and preventing work-related musculoskeletal disorders among dentists. Computer Methods in Biomechanics and Biomedical Engineering. 2014; 17(2): 177-185. 14- Kozak A, Schedbauer G, Peters C, Nienhaus A. Self-reported musculoskeletal disorders of the distal upper extremities and the neck in German veterinarians: A cross-sectional study. PLoS ONE. 2014; 9(2): e89362. 15- Kurşun Ş, Sehrazat E, Akbulut N, Oztas B, Vaizoglu SA. Work characteristics and musculoskeletal disorders among postgraduate dental students: A pilot study. Journal of Musculoskeletal Pain. 2014; 22(1): 62-67. 16.Higentt. Mcatamney lU. Rapid Entire Body Assessnt (REBA). Applied Ergonomics. 2000; 31: 201-5. 17- Oakmana J, Macdonald W, Wells Y. Developing a comprehensive approach to risk management of musculoskeletal disorders in non-nursing health care sector employees. Applied Ergonomics. 2014; 45(6): 1634-1640. 18- Gupta D, Bhaskar DJ, Gupta KR, Karim B. Use of complementary and alternative medicine for work related musculoskeletal disorders associated with job contentment in dental professionals: Indian outlook. Ethiopian journal of health sciences. 2014; 24(2): 117-124. 19- Valachi B, Valachi K. Mechanisms leading to musculoskeletal disorders in dentistry. The Journal of the American Dental Association. 2003; 10(134): 1344-1350 20- Javad Vatani, GebraeilNasl saraji, Abolghasem Pourreza, Mahmood Salesi, Iraj MohammadFam ., A Framework for the Calculation of Direct and Indirect Costs of Accidents and Its Application in the Accidents of Construction Industry at Iran in 2013., Trauma Monthly Journal. 22(1): e26117, DOI: 10.5812/traumamon.26117

Annals of Tropical Medicine & Public Health-Special Issue Vol V
S206-18
21- Javad Vatani, GebraeilNasl saraji, Abolghasem Pourreza, Mahmood Salesi, Iraj MohammadFam ., The Relation of Costs Accidents by Establishment of Health, safety and Environment Management System (HSE-MS) of Construction Industry in Tehran city., Iranian Red Crescent Medical Journal. 18(12): e27140, DOI: 10.5812/ircmj.27140

Annals of Tropical Medicine & Public Health-Special Issue Mar 2018 Vol V
S207-18
The Effect of Levothyroxine on Memory Impairment
Induced by Electroconvulsive Therapy in Bipolar Patients:
Clinical Trial 1*Seyyed Majid Hosseini Hoshiar,
2Hosein Javdani,
3Mozhgan Lotfi
1Sabzevar University of Medical Sciences, Sabzevar, Iran
2Qazvin University of Medical Sciences, Qazvin, Iran
3School of Behavioral Sciences and Mental Health (Tehran Institute of Psychiatry), Iran University of Medical Sciences,
Tehran, Iran
*Corresponding Author Email: [email protected]
Abstract
Introduction: Electric convulsive therapy (ECT) is an effective and fast acting treatment for bipolar disorder
particularly in acute cases. Considering the cognitive problems and especially memory deficits after the use
of electroconvulsive therapy, some patients refuse to accept it. This study aimed to investigate the effect of
levothyroxine on memory impairment induced by electroconvulsive therapy in bipolar patients.
Materials and Methods: This study was a clinical trial. The population study included patients with bipolar
disorder treated with ECT admitted to 22 Bahman hospital in Qazvin that among them taking into account
the criteria for inclusion and exclusion, 26 patients were recruited and randomly were assigned into two
groups: placebo and levothyroxine. The study tools included Mini-Mental State Examination (MMSE) and
the Wechsler Memory Scale which before and after the intervention were completed by the subjects. Data
were analyzed by paired t-test and independent t.
Results: The results showed that in the group who received levothyroxine in the orientation subscale
(p<0.002) and the memory total score (p<0.035) in the post-test compared pre-test there was a significant
increase. In addition, the comparison of scores between the two groups showed that in the group who
received levothyroxine compared with placebo in the orientation subscale (p<0.041) and the memory total
score (p<0.036) there was a significant difference.
Conclusion: Considering the results of this study, which shows the effectiveness of levothyroxine on total
memory performance and orientation of patients with bipolar disorder who has received ECT, this drug can
be used during sessions of ECT to prevent the creation of some memory problems in these patients.
Keywords bipolar disorder, electroconvulsive therapy, ECT, levothyroxine
Introduction
Mood disorder includes disturbance in emotional or mood state. People can experience this distress as severe
depression, extreme joy or a combination of these emotional states (Oltmanns and Emery, 2012, Association, 2013).
A highly debilitating disorder, complex and chronic in psychiatry which placed in the mood is bipolar disorder
(Mathews and Barch, 2006). Bipolar disorder (BD) is classified in disorders with the highest level of disability in
worldwide (Bowie et al., 2010) and can affect almost all age groups (Frangou et al., 2017). This disorder includes
depression and mania symptoms and according to the severity of symptoms is divided two types of bipolar disorder
type I and bipolar disorder type II. According to studies, this disorder affects on average 1 percent of the general
population and compared with other mood disorders followed by less improvement and more mortality rates
(Goodwin et al., 2003). Given the devastating symptoms of this disease and the severe effects on the lives of patients
and their family, many treatment options for bipolar disorder has been designed and implemented that one of them is
electroconvulsive therapy (ECT) (Milev, 2017, Perugi et al., 2017).
Electroconvulsive therapy (ECT) which sometimes referred to as shock therapy, usually run conducted for six to
twelve sessions for two to four weeks. In most cases of this treatment to reduce the possibility of injury to the
patient, muscle relaxant drug or anesthetic is used (Kearne and Trull, 2012). Several studies have shown that
electroconvulsive therapy in life-threatening conditions in mood disorders such as depression and bipolar disorder is

Annals of Tropical Medicine & Public Health-Special Issue Mar 2018 Vol V
S207-18
very effective and has rapid effect. So in some bipolar patients with threatening, risky or problematic behaviors or
their lives are in danger as a result of an acute attack, using this method causing a rapid reduction of patient's
symptoms is essential. Despite outstanding therapeutic effects of this method, some of the problems associated with
it, including convulsion duration and its effect on memory as well as effects on brain physiology caused caution in
using it (Prapotnik et al., 2006).
The most common side effects associated with ECT is memory loss (Kalat, 2009) that has been mentioned in many
studies. For example, in one study it was found that four weeks after completion of treatment in both groups of
patients who one group had received electroconvulsive therapy and the other group received dummy
electroconvulsive therapy, the electroconvulsive therapy group showed more weakness in memory performance
(Scott, 2005). In another study the effects of electroconvulsive therapy on cognitive functions of patients with three
disorders of depression, mania and schizophrenia was evaluated and the results showed that memory loss after
treatment is observed in patients of all three groups, but after one month, this memory loss has an improve process
(Vafaee and Ghadimi, 2005).
According to cognitive problems and especially memory deficits after the use of electroconvulsive therapy, some
patients refuse to accept it. So if using drug or non-drug methods, some part of the patient's memory problems
resolved after using this treatment, it can be use more when necessary. Among drugs that can be effective to reduce
memory problems induced by this treatment are Thyroid hormones such as levothyroxine. In various studies it has
been found that levothyroxine and liothyronine plays a role in reducing cognitive problems such as memory in
different patients (Krausz et al., 2004, Tan et al., 2008). It also has other advantages that its use is justified. For
example, Bauer and his colleagues found in their study that the use of levothyroxine has significant role in reducing
depressive symptoms in patients with bipolar disorder is (Bauer et al., 2016).
According to what was said, it seems if using an appropriate method, the memory problems after therapy is reduced,
steps can be taken to more use of this treatment. On the other hand the initial studies indicate the effects of
levothyroxine on cognitive functions. It also has other beneficial effects such as reducing symptoms of depression
and is more available in our pharmaceutical market and having more half-life by administering one time reaches a
more constant plasma level. Considering all of these cases and the lack of adequate research in this field, this study
aimed to investigate the effect of levothyroxine on memory impairment induced by electroconvulsive therapy in
bipolar patients.
Materials and Methods
The research method, population and sample
This study was a clinical trial. The study population consisted of patients with bipolar disorder treated with ECT
were admitted to 22 Bahman hospital in Qazvin. The subjects were selected using convenience sampling and
according to the criteria of inclusion and exclusion criteria. Inclusion criteria were: 1) Diagnosis of bipolar disorder
based on interviews by the psychiatrist; 2) indication for treatment with ECT, according to experts in psychiatry; 3)
age between 18 and 65 years; 4) informed consent from the patient's head. The exclusion criteria were as follows: 1)
the existence of any contraindications of levothyroxine; 2) organic disease of the brain and mental retardation (based
on history, physical examination and medical records) or any cognitive impairment (MMSE <= 22) at baseline; 3)
ECT less than 6 sessions 4) delirium caused by ECT; 5) not receiving at least one of the standard stabilizers (sodium
valproate, carbamazepine or lithium); 6) receiving more than one standard stabilizers drug (of sodium valproate,
carbamazepine or lithium); 7) receiving one shock in more than half of the sessions; 8) convulsions <25 seconds in
more than half of the sessions; 9) convulsions > 3 minutes even in one session· Given that phase of bipolar disorder
(in terms of mania, depression or mixed) may interfere in cognitive and memory state in patients, to control of this
potentially confounding variable, all patients were selected in the acute phase of mania.
Considering these criteria, 26 subjects were randomly divided into two groups: placebo and intervention. The two
groups in terms of memory status basis (based on the scores of the Wechsler Memory Scale), the manic phase /
depression, type and dose of mood-stabilizing medications (sodium valproate, carbamazepine or lithium), presence
or absence of first generation antipsychotic medication, presence or absence of second-generation antipsychotic
medications, presence or absence of anticholinergic drugs (Bipyridine or trihexyphenidyl), presence or absence of
benzodiazepines, presence or absence of antidepressants were measured. Then, the day before the start of the first
session of ECT until the last day of ECT sessions, the intervention group received 0.1 mg oral levothyroxine tablets
(given the minimum effective amount in the depression and mania) and the control group were given placebo (in

Annals of Tropical Medicine & Public Health-Special Issue Mar 2018 Vol V
S207-18
days patients received ECT the drug is given after receiving ECT treatment sessions, and in the days that the patient
hadn’t received ECT, the drug was giving in fasting mode). Levothyroxine manufactured by Iran hormone and
placebo was inert starch and to remove the psychological impact (suggestive), levothyroxine, and to create equal
conditions for assessing the effectiveness, the levothyroxine had been poured in capsules (both drug and placebo
both in capsules spilled) and duration of drug or placebo use considering a difference in the treatment period of
patients with electroconvulsive was varied, lasted from 2 to 4 weeks. After 2 weeks of completed ECT sessions,
again the memory of all patients with Wechsler memory Scale was evaluated and at the end, in addition to
comparing this test’s scores between the two groups, the Memory loss in each group during treatment with ECT was
determined and using appropriate statistical methods was compared.
Method of treatment and prescribing medication and placebo
ECT process was in a way that the first session of ECT, an electric shock with an intensity of 250-200 J was applied
and acceptable time of convulsion was 25 seconds to 3 minutes. In all sessions of the ECT, if a seizure lasted less
than 25 seconds, was deemed ineffective and wasn’t accounted in the number of ECT sessions and at the same
session, the electric shock again with an intensity of at least higher 100 joules was repeated only once. Program was
such a way that if the term of convulsion in patients lasted more than 3 minutes, the patient was referred to a
neurologist for evaluation that the patients in our study, this was not the case. ECT type had been scheduled as
single or double-sided (Bitemporal) and number of sessions were three times a week.
Research Tools
Mini-Mental State Examination (MMSE): mini mental state examination was designed in 1975, by Folsthine et al.
Mini mental state examination is the most common screening tool for cognitive disorders in the world and has been
translated in different languages translated and standardized in different cultures. This test assesses different
cognitive functions and provides an overall assessment of the cognitive situation of subjects. Performing this test
usually takes ten minutes (Foroughan et al., 2008). This test, which includes questions to assess orientation,
immediate and close memory, naming, reading and writing ability, attention (concentration), executive and visual-
spatial function, is scored in the range from 0 to 30 that according to standardization carried out on the Persian
version, the cutoff point of 22 to down, is considered as cognitive impairment and in the study conducted by
Seyedian and colleagues, this cutoff point has the sensitivity of 90% and specificity of 93.5 percent (Seyedian et al.,
2008).
Wechsler Memory Scale: Wechsler Memory Scale was designed in 1970 by Wechsler. Wechsler Memory Scale-
revised has 7 subscales (awareness, orientation, mental control, visual memory, logical memory, association and
repeat) that evaluate different aspects of memory. Iranian version of the Wechsler Memory Scale-revised in Iran and
Shiraz for people 16 to 64 years old has been standardized and confirmed; in this study retest coefficients for
subscales and compounds have been reported 0.28 to 0.98. Comparing the mean raw scores of two groups of clinical
and normal subjects to determine the validity of the Revised Wechsler Memory Scale showed that the mean raw
scores in clinical groups were significantly lower than the mean raw scores in normal group, therefore, this
acceptable scale can be used (Orangi et al., 2002).
Results
All statistical analyzes were performed with SPSS software version 20. For comparing the pre-test and post-test in
each group, paired t test and to compare scores between the placebo and levothyroxine group independent t-test was
used. In this study, 48 participants were present. The mean age of subjects in the placebo group was 36.26 with a
standard deviation of 13.3 and the mean age of levothyroxine group was 40.1 with a standard deviation of 7.70. As
well as information related other demographic variables in both the placebo group and levothyroxine are shown in
Table 1.

Annals of Tropical Medicine & Public Health-Special Issue Mar 2018 Vol V
S207-18
Table 1Demographic information of placebo group and levothyroxine group
Variables
Placebo
levothyroxine
Frequency Percent Frequency Percent
Education
Primary 10 38 10 41
Secondary 8 30 8 33
Diploma 4 15 3 12.5
Associate Degree 2 7.5 2 8
MA (Bachelor) 1 3.75 0 0
Master 1 3.75 1 4
Gender
Male 9 64.3 5 21
Female 17 47.2 19 79
Marital Status
Single 14 55 9 37.5
Married 9 34 9 37.5
Divorced 3 11 6 25
Location
City 21 81 18 75
Village 5 19 6 25
History of ECT
Yes 4 15 3 12.5
No 22 85 21 87.5
Substance use
Yes 9 35 7 29
No 17 65 17 71
Alcohol use
Yes 0 0 2 8
No 26 100 22 92
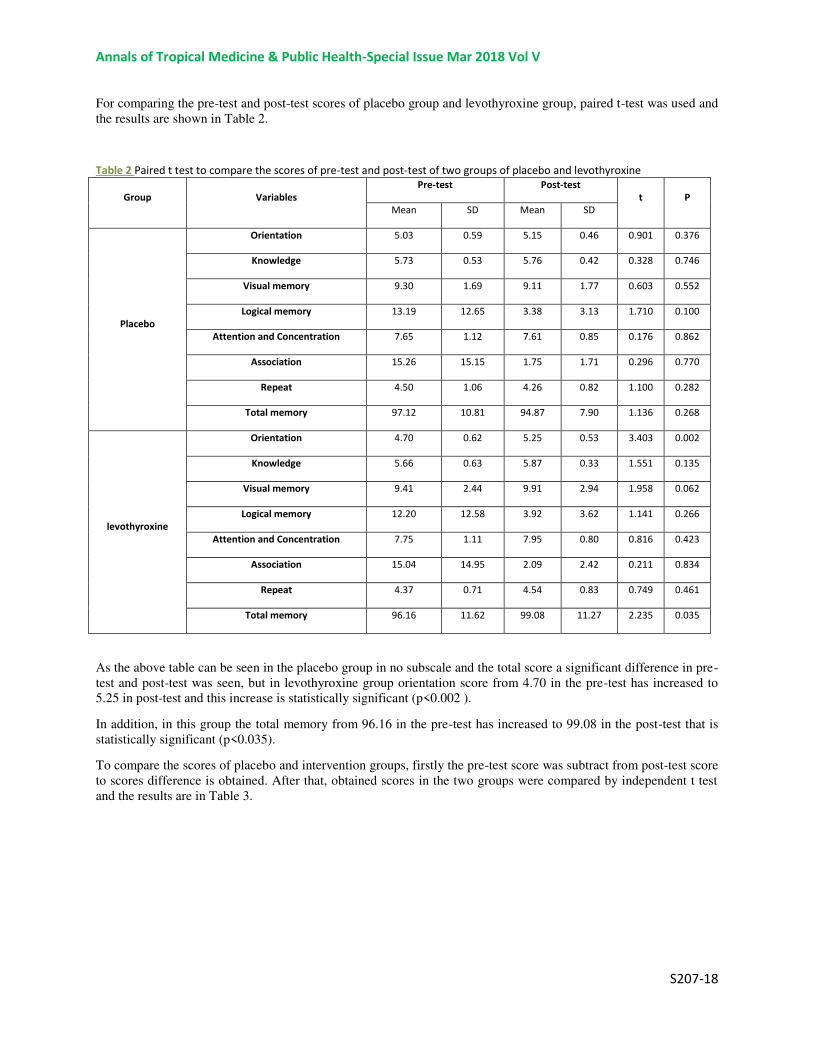
Annals of Tropical Medicine & Public Health-Special Issue Mar 2018 Vol V
S207-18
For comparing the pre-test and post-test scores of placebo group and levothyroxine group, paired t-test was used and
the results are shown in Table 2.
Table 2 Paired t test to compare the scores of pre-test and post-test of two groups of placebo and levothyroxine
Group Variables
Pre-test Post-test
t P
Mean SD Mean SD
Placebo
Orientation 5.03 0.59 5.15 0.46 0.901 0.376
Knowledge 5.73 0.53 5.76 0.42 0.328 0.746
Visual memory 9.30 1.69 9.11 1.77 0.603 0.552
Logical memory 13.19 12.65 3.38 3.13 1.710 0.100
Attention and Concentration 7.65 1.12 7.61 0.85 0.176 0.862
Association 15.26 15.15 1.75 1.71 0.296 0.770
Repeat 4.50 1.06 4.26 0.82 1.100 0.282
Total memory 97.12 10.81 94.87 7.90 1.136 0.268
levothyroxine
Orientation 4.70 0.62 5.25 0.53 3.403 0.002
Knowledge 5.66 0.63 5.87 0.33 1.551 0.135
Visual memory 9.41 2.44 9.91 2.94 1.958 0.062
Logical memory 12.20 12.58 3.92 3.62 1.141 0.266
Attention and Concentration 7.75 1.11 7.95 0.80 0.816 0.423
Association 15.04 14.95 2.09 2.42 0.211 0.834
Repeat 4.37 0.71 4.54 0.83 0.749 0.461
Total memory 96.16 11.62 99.08 11.27 2.235 0.035
As the above table can be seen in the placebo group in no subscale and the total score a significant difference in pre-
test and post-test was seen, but in levothyroxine group orientation score from 4.70 in the pre-test has increased to
5.25 in post-test and this increase is statistically significant (p<0.002 ).
In addition, in this group the total memory from 96.16 in the pre-test has increased to 99.08 in the post-test that is
statistically significant (p<0.035).
To compare the scores of placebo and intervention groups, firstly the pre-test score was subtract from post-test score
to scores difference is obtained. After that, obtained scores in the two groups were compared by independent t test
and the results are in Table 3.
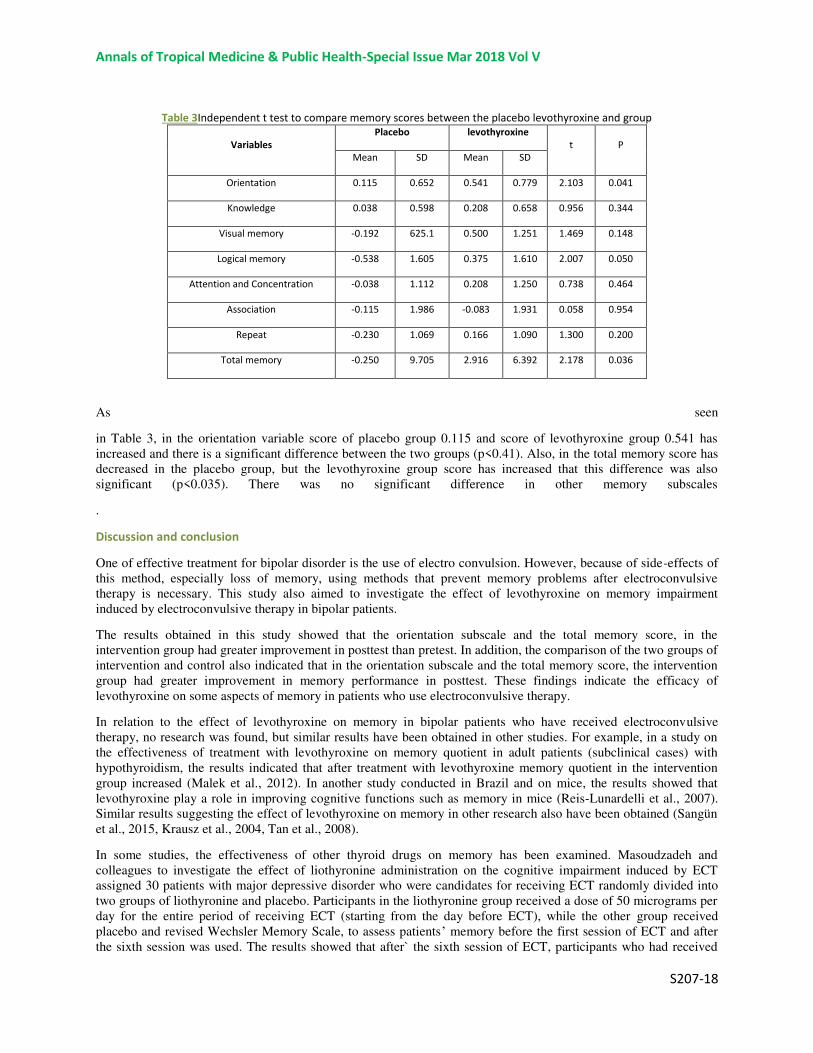
Annals of Tropical Medicine & Public Health-Special Issue Mar 2018 Vol V
S207-18
Table 3Independent t test to compare memory scores between the placebo levothyroxine and group
Variables
Placebo levothyroxine
t P
Mean SD Mean SD
Orientation 0.115 0.652 0.541 0.779 2.103 0.041
Knowledge 0.038 0.598 0.208 0.658 0.956 0.344
Visual memory -0.192 625.1 0.500 1.251 1.469 0.148
Logical memory -0.538 1.605 0.375 1.610 2.007 0.050
Attention and Concentration -0.038 1.112 0.208 1.250 0.738 0.464
Association -0.115 1.986 -0.083 1.931 0.058 0.954
Repeat -0.230 1.069 0.166 1.090 1.300 0.200
Total memory -0.250 9.705 2.916 6.392 2.178 0.036
As seen
in Table 3, in the orientation variable score of placebo group 0.115 and score of levothyroxine group 0.541 has
increased and there is a significant difference between the two groups (p<0.41). Also, in the total memory score has
decreased in the placebo group, but the levothyroxine group score has increased that this difference was also
significant (p<0.035). There was no significant difference in other memory subscales
.
Discussion and conclusion
One of effective treatment for bipolar disorder is the use of electro convulsion. However, because of side-effects of
this method, especially loss of memory, using methods that prevent memory problems after electroconvulsive
therapy is necessary. This study also aimed to investigate the effect of levothyroxine on memory impairment
induced by electroconvulsive therapy in bipolar patients.
The results obtained in this study showed that the orientation subscale and the total memory score, in the
intervention group had greater improvement in posttest than pretest. In addition, the comparison of the two groups of
intervention and control also indicated that in the orientation subscale and the total memory score, the intervention
group had greater improvement in memory performance in posttest. These findings indicate the efficacy of
levothyroxine on some aspects of memory in patients who use electroconvulsive therapy.
In relation to the effect of levothyroxine on memory in bipolar patients who have received electroconvulsive
therapy, no research was found, but similar results have been obtained in other studies. For example, in a study on
the effectiveness of treatment with levothyroxine on memory quotient in adult patients (subclinical cases) with
hypothyroidism, the results indicated that after treatment with levothyroxine memory quotient in the intervention
group increased (Malek et al., 2012). In another study conducted in Brazil and on mice, the results showed that
levothyroxine play a role in improving cognitive functions such as memory in mice (Reis-Lunardelli et al., 2007).
Similar results suggesting the effect of levothyroxine on memory in other research also have been obtained (Sangün
et al., 2015, Krausz et al., 2004, Tan et al., 2008).
In some studies, the effectiveness of other thyroid drugs on memory has been examined. Masoudzadeh and
colleagues to investigate the effect of liothyronine administration on the cognitive impairment induced by ECT
assigned 30 patients with major depressive disorder who were candidates for receiving ECT randomly divided into
two groups of liothyronine and placebo. Participants in the liothyronine group received a dose of 50 micrograms per
day for the entire period of receiving ECT (starting from the day before ECT), while the other group received
placebo and revised Wechsler Memory Scale, to assess patients’ memory before the first session of ECT and after
the sixth session was used. The results showed that after` the sixth session of ECT, participants who had received
Annals of Tropical Medicine & Public Health-Special Issue Mar 2018 Vol V
S207-18
liothyronine obtained higher scores on Wechsler Memory test (Masoudzadeh et al., 2013). In another study
conducted by Hamidiya Ghadirr and Afkhamz Ebrahimi, the effectiveness of using vitamin B12 and liothyronine on
memory impairment after ECT in depressed patients was studied. In this clinical trial, 40 women who were
nominated for ECT were divided randomly into two groups of intervention and control. The study results showed
that liothyronine could prevent memory loss after ECT, while in the group that had received vitamin B12 similar
findings weren’t observed (Hamidia et al., 2006).
About the reason for the effectiveness of levothyroxine and other thyroid drugs on memory function several
hypotheses have been proposed. Based one of these hypotheses, the reduction of T4 reduces nervous actin
polymerization. So it is possible that patients who receive liothyronine and T3 amount of their body is decreased, a
temporary disruption happen in cytoskeleton actin that this turmoil in neurons of the amygdala and hippocampus,
which are very sensitive to convulsion and have important role in memory and learning, maintain cells from the
ravages of convulsions (Hamidia et al., 2006). In addition, anti-convulsant effect of thyrotropin releasing hormone
(TRH) by co-administering of thyroid exogenous (liothyronine) hormones is reduced and this may decrease the
needed ECT dose and thus reducing damage and its adverse cognitive (Seyedian et al., 2008).
The results of this study showed that levothyroxine effects on overall memory function and orientation of bipolar
patients who received ECT disorder. In other words, levothyroxine prescription during sessions of ECT in patients
with bipolar enhanced the total memory and orientation in them. The findings of this study, support the positive
effect on cognitive impairment including memory impairment due to levothyroxine drug on cognitive impairments,
specially memory loss induced by ECT in bipolar patients.
This study had some limitations. One limitation of this study was that some potential confounding factors such as
"the severity of disorder" wasn’t examined. In addition this study has been conducted on a homogeneous sample
(bipolar disorder patients) and the study on the different samples that aren’t limited to bipolar patients also seems
necessary. Moreover, in the present study the convulsion (seizure) threshold in calculating the amount of effective
electrical charge ECT was not evaluated. Therefore, it is recommended that research be done regarding these
limitations. Also according to the results of this study, the practical recommendation that can be made is that
levothyroxine in patients who received electrical convulsion is applied to reduce the effects of this method on
memory.
Ethical considerations
This study has been registered in the database of clinical trial with IRCT2015071012018N3 Code and Ethics
Committee approval of Qazvin University of Medical Sciences with IR.QUMS.REC.1394.202 code has been
received. For ethical considerations of confidentiality of data (information) were explained to the participants and
written informed consent was obtained from parents (guardian) of studied patients (consent form is attached). If the
individual did not have the ability to read, the consent form was read by researchers to him, and in the case of
consent, his/her signature or fingerprint was taken. The participants were empowered at every stage of research
without having to appeal to reason, exclude from study. Additionally, ethical principles in using other sources were
respected, and in the case of using research results of other scientists, the sources have been noted.
References
1. ASSOCIATION, A. P. 2013. Diagnostic and statistical manual of mental
disorders (DSM-5®), American Psychiatric Pub. 2. BAUER, M., BERMAN, S., STAMM, T., PLOTKIN, M., ADLI, M., PILHATSCH, M.,
LONDON, E., HELLEMANN, G., WHYBROW, P. & SCHLAGENHAUF, F. 2016.
Levothyroxine effects on depressive symptoms and limbic glucose
metabolism in bipolar disorder: a randomized, placebo-controlled positron
emission tomography study. Molecular psychiatry, 21, 229-236. 3. BOWIE, C. R., DEPP, C., MCGRATH, J. A., WOLYNIEC, P., MAUSBACH, B. T.,
THORNQUIST, M. H., LUKE, J., PATTERSON, T. L., HARVEY, P. D. & PULVER, A.
E. 2010. Prediction of real-world functional disability in chronic mental
disorders: a comparison of schizophrenia and bipolar disorder. American
Journal of Psychiatry,167,1116-1124.
4. FOROUGHAN, M., JAFARI, Z., SHIRIN, B. P., GHAEM, M. F. Z. & RAHGOZAR, M.
2008. Validation of mini-mental state examination (MMSE) in the elderly
Annals of Tropical Medicine & Public Health-Special Issue Mar 2018 Vol V
S207-18
population of Tehran. Advances in Cognitive Science, 10, 29-37 (Text in
Persian). 5. FRANGOU, S ,.DIMA, D. & JOGIA, J. 2017. Towards person-centered
neuroimaging markers for resilience and vulnerability in Bipolar
Disorder. NeuroImage, 145, Part B, 230-237. 6. GOODWIN, F. K., FIREMAN, B., SIMON, G. E., HUNKELER, E. M., LEE, J. &
REVICKI, D. 2003. Suicide risk in bipolar disorder during treatment with
lithium and divalproex. Jama, 290, 1467-1473. 7. HAMIDIA, A., GHADIRI, M. & AFKHAM EBRAHIMI, A. 2006. Comparison of Memory
Impairment Due to Electroconvulsive Therapy in Depressed Patients
Receiving Liothyronine and Vitamin B12. Iranian Journal of Psychiatry and
Clinical Psychology, 12, 16-20 (Text in Persian). 8. KALAT, J. W. 2009. Biological Psychology, Belmont, CA, Wadsworth, Cengage
Learning. 9. KEARNE, C. A. & TRULL, T. J. 2012. Abnormal Psychology and Life:
ADimensional Approach, Belmont, Wadsworth, Cengage Learning. 10. KRAUSZ, Y., FREEDMAN, N., LESTER, H., NEWMAN, J., BARKAI, G., BOCHER, M.,
CHISIN, R. & BONNE, O. 2004. Regional cerebral blood flow in patients
with mild hypothyroidism. Journal of Nuclear Medicine, 45, 1712-1715. 11. MALEK, M., KHAMSEH, M., HADIAN, A., BARADARAN, H. R., EMAMI, Z. & AGHILI,
R. 2012. The effect of L-THYROXINE treatment on memory quotient in adults
with subclinical hypothyroidism: A Randomized double blind controlled
Trial. Iranian Journal of Endocrinology and Metabolism, 13, 577-581 (Text
in Persian). 12. MASOUDZADEH, A., YAHYAVI, S. T., RASHIDI, H., MOHAMMADPOUR, R. A. &
KIANI, R. 2013. Use of liothyronine in preventing electroconvulsive
therapy-induced memory impairment: evaluation. ThePsychiatrist Online,
37, 49-53. 13. MATHEWS, J. R. & BARCH, D. M. 2006. Episodic memory for emotional and
non-emotional words in individuals with anhedonia. Psychiatry Research,
143, 121-133. 14. MILEV, R. 2017. The role of electroconvulsive therapy in the treatment of
bipolar disorder. The Treatment of Bipolar Disorder: Integrative Clinical
Strategies and Future Directions, 408. 15. OLTMANNS, T. F. & EMERY, R. E. 2012. Abnormal Psychology, New Jersey,
Pearson Education, Inc. 16. ORANGI, M., ATEFVAHID, M. & ASHAYERI, H .2002 .Standardization of the
revised Wechsler memory scale in Shiraz. Iranian Journal of Psychiatry
and Clinical Psychology, 7, 56-66. 17. PERUGI, G., MEDDA, P., TONI, C., MARIANI, M. G., SOCCI, C. & MAURI, M.
2017. The role of electroconvulsive therapy (ECT )in bipolar disorder: effectiveness in 522 patients with bipolar depression, mixed-state, mania
and catatonic features. Current neuropharmacology, 15, 359-371. 18. PRAPOTNIK, M., PYCHA, R., NEMES, C., KöNIG, P., HAUSMANN, A. & CONCA, A.
2006. Adverse cognitive effects and ECT. Wiener medizinische
Wochenschrift (1946), 156, 200-208. 19. REIS-LUNARDELLI, E. A. D., RAMIREZ, M. R., CASTRO, C. C., COITINHO, A.
S., BAVARESCO, C., DA TRINDADE, L. S. S., PERRENOUD, M. F., WYSE, A. T.
D. S., SARKIS, J. J. F. & IZQUIERDO ,I. 2007. Effects of an acute
treatment with L-thyroxine on memory, habituation, danger avoidance, and
on Na+, K+-ATPase activity in rat brain. Current neurovascular research,
4, 259-267. 20. SANGUN, Ö., DEMIRCI, S., DUNDAR, N., PIRGON, Ö., KOCA, T., DOĞAN, M .
&DUNDAR, B. 2015. The Effects of Six-Month L-Thyroxine Treatment on
Cognitive Functions and Event-Related Brain Potentials in Children with

Annals of Tropical Medicine & Public Health-Special Issue Mar 2018 Vol V
S207-18
Subclinical Hypothyroidism. Journal of clinical research in pediatric
endocrinology, 7, 102. 21. SCOTT, A. I. 2005 .The ECT handbook: the third report of the Royal College
of Psychiatrists' Special Committee of ECT, RCPsych Publications. 22. SEYEDIAN, M., FALAH, M., NOUROUZIAN, M., NEJAT, S., DELAVAR, A. &
GHASEMZADEH, H. 2008. Validity of the Farsi version of mini-mentalstate
examination. Journal of Medical Council of I.R.I., 25, 408-414 (Text in
Persian). 23. TAN, Z. S., BEISER, A., VASAN, R. S., AU, R., AUERBACH, S., KIEL, D. P.,
WOLF, P. A. & SESHADRI, S. 2008. Thyroid function and the risk of
Alzheimer disease: the Framingham Study. Archives of internal medicine,
168, 1514-1520. 24. VAFAEE, B. & GHADIMI, B. 2005. A study on alterations of memory before
and after performing ECT. The Journal of Urmia University of Medical
Scinces, 15, 262-267 (Text in Persian).

Annals of Tropical Medicine & Public Health-Special Issue Mar 2018 Vol V
S208-18
“A Chance for a better life”: A thematic content analysis of the reason
for decision to perform face cosmetic surgery from the
perspective of Iranian men and women
Nahid Mozaffari Niya 1, Majid Kazemi
2, Farokh Abazari
*3 , and Fazlollah Ahmadi
4.
MScN, BScN (PhD Candidate) Nursing Research Center , Razi Faculty of Nursing and
Midwifery , Kerman University of Medical Sciences, Kerman, Ira 2 PhD, MScN, BScN (Associate Professor ) Nursing Department, Rafsanjan University of Medical Sciences,
Rafsanjan, Kerman, I.R. Iran 3 PhD, MScN, BScN (Assistant Professor ) Nursing Research Center , Razi Faculty of Nursing and
Midwifery Kerman University of Medical Sciences, Kerman, Iran. 4 PhD, MScN, BScN ) Professor ( , Nursing Department, Faculty of Medical Sciences, Tarbiat Modares
University, Tehran, Iran
*Corresponding author: Rafsanjan University of Medical Sciences, Modaress St. Rafsanjan, Iran Tel:
+98 391 5225900
Abstract
Background: Currently, becoming beautiful is a value in Iranian society. Although experts have suggested
several complications of cosmetic surgery but decision to have these surgeries has been dramatically
increased in recent years, which has imposed high workload and costs on the health care system. The aim
of this study was to explore the reasons why people perform cosmetic surgery in an Iranian context.
Methods: Twenty-one (21) male and female who were 52-22 year-old and had undergone face plastic
surgery between 1-5 years ago were selected by purposeful sampling and semi-structured data was
collected via open interviews, while qualitative content were analyzed utilizing conventional analysis
methods.
Results: Data analysis revealed the theme "A chance for a better life" which contains 2 subcategories of
“Gaining social opportunities" and” Gaining the approval and acceptance in society ".
Conclusion: The results revealed that participants consider cosmetic surgery as a blessing from God that
plays a major role in their future and so they have accepted the risks of the surgery. Therefore, health care
providers, particularly nurses can consult them through education before doing cosmetic surgery in order to
help individuals make right decisions.
Keywords: decision, cosmetic surgery, qualitative research, content analysis, Iran
Introduction
One of the essential needs of man in modern times is "being seen beautiful" (1). Modern society has determined a
high competitive standard for beauty (2). Therefore, becoming beautiful based on defined standards can frustrate
people who are not beautiful (1). So, changes in the modern society have caused people to draw more attention to
their bodies and how to manage and control it in the modern consumer society. One of the behaviors observed in
most societies is cosmetic surgery (3).
Accordingly, the willingness of men and women who are interested in having cosmetic surgery has increased
dramatically (4). Cosmetic surgery is a surgical procedure with the aim of improving the appearance by increasing
physical features (5). According to the reports of the American Society of Plastic Surgeons, cosmetic surgical
procedures in the United States have been increased to 98% from 2000 to 2012 while 72% of these surgeries have
been performed because of beauty and to improve the appearance and increase self-confidence (6).

Annals of Tropical Medicine & Public Health-Special Issue Mar 2018 Vol V
S208-18
At the moment, becoming beautiful is a value for the current Iranian society that has accelerated competition for
becoming beautiful (1). According to global studies on cosmetic surgery, Iran is the country with the highest rate of
cosmetic procedures, as reportedly, in terms of the ratio of people who carried out cosmetic surgeries rather than the
whole population. In 2013, Iran was ranked first in the world, while more than 175,000 surgical and non-surgery
operation have been carried out in Iran (7). In today's society of Iran, women give more importance to beauty,
although many men may attempt to perform cosmetic surgery in order to improve their appearance (1).
Researchers have shown that there are two types of motivation why people perform cosmetic surgeries: Social and
intrapersonal factors (8). Some studies have revealed that intrapersonal factors such as self-assessment,
attractiveness (9, 10), appearance-based rejection sensitivity (11, 12) and negative body image (13, 14, 15, 16) are
the primary stimulants for cosmetic surgery. Socio-cultural factors can also increase their interest in cosmetic
surgery, because people are increasingly exposed to cosmetic surgery via social networks (17, 18, 19, 16, 20).
Not only media but also parents and friends may also transfer messages about the importance of physical appearance
and the applied strategies for increasing the attractiveness (17, 21). These external and internal pressures which are
due to the physical appearance and body image lead to feelings of inadequacy and anxiety in women (22, 23).
Women are more concerned about how other people in the community may judge them based on their physical
appearance (2). According to socio-cultural perspective, people judge others based on their physical appearance and
behave differently towards them, so that attractive people are often more favorable than unattractive people (24).
Similarly, Rosen and Underwood (2010) showed that those who have less facial attraction are less favorable
compared with those that have higher facial attraction (25).
Most cosmetic surgeries are carried out for reasons and hope for higher satisfaction from their appearance, but the
main motivation for implementing cosmetic surgeries is to improve their mental performance (26). Though
performing cosmetic surgeries can be helpful in terms of both physical and psychological health aspects, but if it is
not properly implemented, it can bring many dangers for the consumers (27). Unofficial statistics have shown that
during the year almost 120 people were victims of these surgeries (28). On the other hand, excessive surgeries result
in financial burden on the economy of the community and the health care system. In 2012, it has been reported that
Iranian men spend more than 50 million dollars annually for rhinoplastic surgeries, while they spend almost two
times of that amount on Botox. However, women accounted for the majority of applicants for cosmetic surgeries
(29). Therefore, this issue should also be considered as a medical complication.
According to research, clinical services providers play a crucial role in decision-making and helping people to carry
out their actions (30). When cosmetic surgery is carried out only for cosmetic reasons, clinical services providers
should be particularly vigilant in assessing opportunities for surgery, because there are physical and psychological
risks involved (31). Currently, increase in the number of applicants for cosmetic surgery has created a lot of
questions and the fundamental question that is always asked despite the risks involved in it is that do patients
referred for cosmetic surgery consider the motivations and consequences?
According to the mentioned points, cosmetic surgery is a multi-faceted phenomenon that is associated with mental
and social parameters and many quantitative studies have revealed the reasons for cosmetic surgery, while there are
few numbers of qualitative researches that reveal attitude and personal experiences of individuals. Therefore, the
aim of this study was to recognize the motivations considered by men and women for cosmetic surgeries and also
explain their experience of cosmetic surgery based on their own narration.
Methods
Study Design
This study is a part of a doctoral thesis aimed at identifying and explaining the factors influencing the decision to
perform deep facial cosmetic surgeries. The study was carried out in West Tehran, Iran between the year 2014 and
2015 utilizing qualitative content analysis. Qualitative content analysis is a qualitative research method and also a
qualitative data analysis method (32). Content analysis method is subjective interpretation of the content of the text
that is carried out by the classification codes and identification of themes regularly (33). Content analysis was
appropriate for this research because it is a good method of analysis that can easily accommodate a large amount of
data (32).
Annals of Tropical Medicine & Public Health-Special Issue Mar 2018 Vol V
S208-18
Participants
In this study, purposive sampling was utilized to select participants. After obtaining the necessary permissions, the
researcher referred to the Medical Records Department of Cosmetic Surgery Center, then the lists of the names of
people who had undergone surgery at the center, and 21 participants who had cosmetic surgeries (7 men and 14
women) between one and five years ago were selected for this study. Thirteen (13) participants were between 22-30
years of age and the rest were over 30 years. Eleven (11) of them were employed and the rest were housewives or
students. Five (5) of the participants had diplomas and the rest had university education, 9 of the participants were
single, 11 of them were married and 1 of them was divorced. Inclusion criteria included cosmetic surgery carried out
under general anesthesia, at least three months after the surgery, possibility of accessing their addresses and phone
numbers, completely vigilant at the time of data collection and willing to participate in the study. This research tried
to qualify individuals with maximum diversity in terms of age, sex and type of cosmetic surgery.
Ethical considerations
The study was adopted by the Medical Research Ethics Committee at the School of Nursing and Midwifery, Kerman
University of Medical Sciences Number (K.93/241, 2014/ 10/ 04) . Informed consent was obtained from all
participants. Participants were assured that they will remain anonymous and they are free to stop the interview at any
time; in addition, they can refuse to answer any question.
Data Collection
Data was collected via semi-structured interviews which were implemented through face to face interview
techniques. First, the researchers explained the objectives of the study to participants. The interviews were carried
out mainly at work, home while few participants were in the park. Interviews lasted between 45 to 90 min, Data
were collected from 21 interviews.
Initial interview inquiries
At the beginning of the interview, the open-ended questions were asked in order to encourage participants on which
subjects they could freely speak about personal experiences. Examples of questions asked were as follows: how
were you feeling before the surgery? Why did you decide to perform this surgery? As well as considering the
experiences that the participants expressed, other probing questions were asked depending on each participant and
were suggested to fully understand the experiences. In order to increase the depth of the interviews, probing
questions like; what do you mean? Explain and give an example, were used.
Analysis
Data was analyzed with the approach of Landman and Granhaym (34). This means that all interviews were recorded
with an MP 3 player device. Interviews were listened several times and were typed using verbatim and the data were
studied in order to better understand the meaning, units in the interviews were identified and initial codes were
extracted. Codes were classified based on similarities in themes and sub-themes. When themes were emerged and
the data was saturated, interviews ended. The main theme including several themes and sub-themes was extracted.
The accuracy and robustness of data (validity, reliability, and the ability to transfer confirmation) were examined
utilizing the criteria proposed by Cuba and Lincoln (35). For data validation, interaction and closeness with
participants as well as peer review and comparison was fixed. Data reliability was assessed by evaluation experts
and appeals were made by the participants and outside observers. The researchers also tried to avoid previous
judgments and to achieve adequate compliance, their previous beliefs were ignored. To transfer the research results
to other people who were eligible for the study, findings were presented to them in order to approve the extracted
concepts with their experiences.
Findings
The main theme of this study was "A chance for a better life" which consisted of the two main categories including
“Gaining social opportunities" and “Gaining the approval and acceptance in society”. Finding the right person to
marry, finding job and high social status were classified as sub-categories of “Gaining social opportunities” and
Drawing public attention and drawing attention of the opposite sex were introduced as sub-categories of “Gaining
the approval and acceptance in society". The main categories and sub-categories are listed in Table (1).

Annals of Tropical Medicine & Public Health-Special Issue Mar 2018 Vol V
S208-18
Table (1): Main categories and sub-categories of opportunity for a better life theme
Themes Main categories
Sub-categories
A chance for
a better life
Gaining social opportunities
-Finding the right person to marry
-Finding job and high social status
Gaining the approval and acceptance
in society
- Drawing public attention
-Drawing attention of the opposite sex
Gaining social opportunities
Trying to obtain social opportunities was one of the reasons for cosmetic surgery. Marriage, employment, and
success was the most important reasons for men and women, especially women who were seeking for social
opportunities in the community and cosmetic surgery gave them that chance in this situation
Most interviewees believed that beauty is the main criterion for marriage in this era. Hence everyone must be
beautiful to be popular. Women are especially forced to have the right partner, in the face of competition; there are
different ways to enhance their beauty and one of them is cosmetic surgery. "I feel if I had no cosmetic surgery
maybe I could not marry with a suitable case" (A 24 year-old woman, married and student).
Another participant said that: "Many of us, whether boy or girl performs cosmetic surgeries to find someone better
for marriage" (A 22 year-old Man, single, and self-employed).
A participant in response to the question that: “what do you want to achieve from cosmetic surgery? She said:
"Finding a Proper person for marriage, to increase my suitors, so that I can choose the best one to marry" (A 24
year- old girl, single and student).
Some believe that since in our society, girls are more selected, then they should be completely flawless, meaning
that evaluative look leads them to pay attention to their facial beauty. “In our society, a girl can never proposed to a
man, so we have to wait, and we should be totally an ideal case for them to come to us, for example, we have to
carry out a series of surgeries to find our favorable person" (A 26-year old girl, single and graduate student).
The quest for achieving a perfect job position is another factor that tends to motivate them to perform cosmetic
surgery. "Well it was important for me to have a good image because when you have surgery, your self-confidence is
raise and influences the job that we want to have, or maybe you want to have a very high social position so you
should have a good face" (A 22- year old man, single, and self-employed).
"Now, even going to work and finding jobs are related to women beauty in our society. I went to many places to look
for job and I saw they only consider my beauty not veils and my behavior. They just look at you if you are beautiful
or not, then they let you enter the workplace"(a 26-year-old woman, single and student).
Some participants believe that cosmetic surgery is a blessing from God and think it is a science that has been given
to human, therefore performing this surgeries has no problem and sometimes they are necessary. “Cosmetic surgery
is a science ... if it is interfering with God's work then no operation should be implemented and no one should be
treated. There are many tools for saving the lives of people, whenever there is a problem, a solution should be

Annals of Tropical Medicine & Public Health-Special Issue Mar 2018 Vol V
S208-18
found. A lot of people are born with problems of physical appearance, then why shouldn’t cosmetic surgery be used
to solve this problem? "(A 42 year-old woman, married and practitioner)
"I say that cosmetic surgery is a blessing that God gave us... If God did not want it, then he shouldn’t have given this
knowledge ... If he gave this knowledge then humans can change him/herself a little for more beauty...". (A 22 year-
old man, married, diploma and soldier)
Gaining the approval and acceptance in society
According to the interviewees, they were seeking to have two types of attention by performing cosmetic surgery
including drawing public attention and drawing the attention of the opposite sex. When the body and the appearance
of a person is in violation of the appearance, weight, height and shape which are common social status then the
people might be noticed since they lack social position. Therefore members of a social group may convince and
force people to be socially acceptable through judgment, reward, and punishment of people. Acceptance in society is
another motivation for performing cosmetic surgery. "When I see someone who has a better appearance, I feel the
person is more acceptable in the society, when I see, I want to marry or I am looking for a job, people look at the if I
am beautiful or not, then I said to myself, why not perform cosmetic surgery?" (A 22 year-old man, single, and self-
employed).
"When I see that women who have cosmetic surgery are of most interest to the community, then I said to myself, why
don’t I do it?" (A 24 year-old woman, married and student).
The "face" is used as the most exposed body part in social communications. Facial attractiveness makes predictable
differences in the general and specific communication while the impacts and attractiveness of faces can be changed
and adjusted in combination with other features, status changes. For these people, cosmetic surgeries influence
communications and draws public attention to them. "As soon as you do cosmetic surgery, the group of people who
live with you in the workplace will change their behavior towards you, they somehow deal with you in a way I do not
understand, it seems as if you did not have that character before, after surgery they all behave well towards you and
more acceptable to you "(A 26-year old girl, single, and practitioner).
Women and men are socialized in such a way that they see themselves through the eyes of the opposite sex. They
have been socialized in such a way that they consider the view of opposite sex about themselves. "I always thought I
can attract a man ... be beautiful in his eyes... when you are more pretty, better men will give marriage proposal to
you and have a better position in the society" (A 24-year-old girl, single and student).
"... The opposite sex certainly had an impact… never a man does not catch own beauty
for his own sake, and just does it for the opposite sex... especially in Iran " (A year-old old man, married, diploma
and soldier).
Someone introduced failing to attract the opposite sex as motivation to perform cosmetic surgery. "I was a 19-20
years old a girl. At this age, the girls want to draw the attention of the opposite sex ... When I went out I felt men do
not pay any attention to me … I always thought it may be because of the my nose, That caused to be less my beauty.
I' m not saying I need them to look at me, but every girl feels that she wants to attract a man to herself ". (a 24-year-
old girl, single and student).
Therefore, it can be said that pretty face as a capital in this context for women and men, gives them the opportunity
to pursue a different approach for identification and desirable lifestyle and finally use these tools to convert this
capital into opportunities and advantages in personal and social life (attention, popularity, position, concessions in
the marriage etc.).
Discussion
In this study, it was demonstrated that “Gaining social opportunities" and” Gaining the approval and acceptance in
society” are the reasons why people decide to have cosmetic surgery. The experiences of participants indicated that
they were trying to achieve opportunities and privileges and finally socio - economic and social success by
performing cosmetic surgery. They think obtaining opportunities such as marriage and employment is related to the
use of cosmetic surgery. Most people expect that cosmetic surgeries give them a young and beautiful look, and
increase their chances of obtaining decent jobs, income, and better marriage. The results revealed that if people are
not willing to take the risk of cosmetic surgery, then they are more likely to lose their ideal career opportunities. On
Annals of Tropical Medicine & Public Health-Special Issue Mar 2018 Vol V
S208-18
the other hand, they believe that cosmetic surgery is a blessing from God and believe that it is a science given to
humans, accordingly interpreted that using this science is essential in their life and also they believe that a person
may lose a good chance in her life due to defects or physical appearance.
Since the social and professional opportunities, are unevenly distributed, then some people may not be beautiful in
terms of culture and fail to achieve the necessary facilities, and therefore be disappointed (1). In fact, women have
the expectations towards a desirable social position which lead them to attempt entertainments including superficial
and cosmetic surgery (36). Cosmetic surgery is an opportunity given to people so that they rebuild their body as
dictated by the media and society. Making such an identity is a dream that drove the people to accept the risk of
cosmetic surgery (1). Accordingly, having a cosmetic surgery regardless of the outcome is a determinant priority in
their lives.
Powell-Hicks, (2011) in his study suggests that physical attractiveness plays a crucial role in relationships.
Attractive people receive more job offers than unattractive applicants (37) Campana et al, (2012) concluded that
beauty is a product that can be sold, and women who don’t search for it cannot successfully achieve this product
socially (38). In another study carried out by Langliuz et al. using meta-analysis techniques, it was shown that
attractive people are more likely to be evaluated as qualified and competent professional. In a study carried out in 26
countries worldwide, both men and women have introduced attractive face as one of the most important criteria for
selecting a wife (39). Darisi et al (2005) in a qualitative research on people who had the desire to perform cosmetic
surgery reported that they thought they could act with social and emotional benefits to their own advantage (40).
Saucier (2004) , Didie & Sarwer, (2003) in their studies suggested that many social benefits of a beautiful young
appearance, such as employment and romantic prospects may be motivated more by women using this method
(41,42). Edmonds (2002) in an ethnographic study on Brazilian women, found that body dissatisfaction, achieving
acceptance of partner, fear of "being replaced" by a more attractive woman, and the desire to improve the chances of
achievement and friends are the main reasons for performing cosmetic surgeries (43). Ward, (1998) also stated that
achieving attractive face to acquire employment and social situations and also increase the chances of dating and
finding wife are factors involved in performing cosmetic surgery (44). The mentioned reasons have also been
introduced in the present study as priorities in terms of audience perspective. Concerns about their appearance lead
women to accept the option of performing cosmetic surgery as a means to increase their self-confidence and increase
their social and professional potential (8, 45, 46).
Some studies in Iran have demonstrated that cosmetic surgery may improve a person's self-esteem, sexual
attractiveness so that through cosmetic surgery, the individual in society will be accepted and allowed to move
upward economically and socially (1). Several studies have revealed that people take beauty as a factor that can
hinder them from having a successful social role in their interactions and therefore make all attempts in order to be
seen and accepted and can also make their body form similar to the social accepted pattern. They want to present
themselves for being seen and draw others attention especially the attention of the opposite sex. According to
Swami, (2009), the growing importance of attractiveness and its importance in success, leads to increased social
pressure to be attractive, and sometimes it seems that social acceptance and personal success depends to a large
extent on beauty (47), because appearance is important, and it is the key factor for success in life (48).
Stefanile et al, (2014) in their study concluded that surgery is a tool for being more attractive than others and it has
social rewards (49). Similarly, Sherry et al, (2004) demonstrated that cosmetic surgery is considered by some people
as a way of obtaining the expectations of other people and draw their attention (50). Mirsardoo et al., (2011) in his
research in Iran concluded that there is a significant relationship between social factors such as finding the right
partner, social recognition by others, finding better jobs, job promotion and trend toward cosmetic surgery in women
and the tendency to have cosmetic surgery has become a fashion and it is considered in determining social status
(51). Rastgar Khalid ,et al (2013) in a qualitative research aimed at evaluating the subjective reasons why Tehran
citizens resort to cosmetic surgery , have identified social acceptance as the reason they perform cosmetic surgery
(51).
Annals of Tropical Medicine & Public Health-Special Issue Mar 2018 Vol V
S208-18
Conclusion
In this study, face cosmetic surgery is taken into consideration as a group and community function in the context of
urban life in Tehran and Islamic Country Iran. In the new Iranian society, the importance of appearance has
increased as a measure of value because, appearance and beauty are considered as selection criteria for desirability
and are also even better tools to succeed and enter into higher societies. The findings of the present research
demonstrated that based on the participants' experiences, beauty and having it is important for people more than
anything else, most people like to look good and be involved in community because face is the most important
aspect in the person and individuals feel that beautiful face help them to have better social presence and also be
more successful in their interactions. Otherwise, they may be rejected by society and jobs and opportunities for a
better life. It can be said that the people resort to cosmetic surgery in order to show their identity and dignity and
promote the different stages of life, the continuation of this success, popularity, better positioning in marriage and
other concessions. It seems that the body attractions especially facial beauty, lead to human freedom and choice to
their fate and chance to a better life and this can be a reason why Iranian men and women crave for cosmetic surgery
despite the risks involved and to change their appearance for encouragement. However, the study results provide
valuable insight to healthcare providers. Understanding experiences of these individuals may help health care team
to provide better care and other individuals who might think about doing cosmetic surgery to help them make a
better decision.
Limitations and suggestions
In this study, despite the mechanisms applied to enhance the accuracy, Such as participation in the study with
maximum variation, had some limitations. The field was limited to a specific geographic location, other people may
experience other things than the ones mentioned in this study. It is therefore recommended to repeat the study in
other areas.
Acknowledgments
This study was part of a PhD dissertation supported by kerman University of Medical Sciences. We express our
sincere gratitude to the participants in the study, who generously provided their time and trust.
References
1. Zare B, Javadi F, Naseri S . Does It Make Me Beautiful? A Focus Group Discussion on Cosmetic Surgery International
Journal of Applied Sociology, 2014 : 4(5): 126-132
2. Rongmeung D. Regional Differences in Physical Appearance Identity Among Young Adult Women in Thailand, Journal of
Western Nursing Research , 2011 : vol. 33, no. 1, pp. 106-120
3. Koohi K, Alizadeh M. The Modelling of the Causes of Women's Tendency to Cosmetic Surgery Among Women Using
Lisrel Software. Scientific Journal of Ilam University of Medical Sciences. 2013; 21(8): 87-95
4. Herruer, J.M., Prins, J.B., van Heerbeek, N., Verhage-Damen, G.W. and Ingels, K.J . Negative Predictors for Satisfaction in
Patients Seeking Facial Cosmetic Surgery: A Systematic Review. Plastic and reconstructive surgery, 2015 : 135(6),
pp.1596-1605.
5. Tiggemann, M. Sociocultural perspectives on human appearance and body image. Body image: A handbook of science,
practice, and prevention, 2011 : 2, pp.12-501.
6. American Society of Plastic Surgeons. (2012). 2012 Plastic surgery statistic report.
http://www.Plasticsurgery.org/Newsand- Resources/Press-Released-Archives/2013.
7. International Society of Aesthetic Plastic Surgens . International Study on Aesthetic/ Cosmetic Procedures Performed in
2013. www.isaps.org.
8. Callaghan, G. M., Lopez, A., Wong, L., Northcross, J., & Anderson, K. R. Predicting consideration of cosmetic surgery in a
college population: A continuum of body image disturbance and the impor- tance of coping strategies. Body Image,
2011 : 8, 267-274. http://dx.doi.org/10.1016/j.bodyim.2011.04.002
9. Brown, A. Furnham, A. Glanville, L. Swami V. Factors that affect the likelihood of undergoing cosmetic surgery .
Aesthetic Surgery Journal, 2007 : 27, pp. 501–508

Annals of Tropical Medicine & Public Health-Special Issue Mar 2018 Vol V
S208-18
10. Swami V . Body appreciation, media influence, and weight status predict consideration of cosmetic surgery among
female undergraduates. Body Image, 2009 : 6:315–317
11. Markey C, Markey P. Correlates of young women’s interest in obtaining cosmetic surgery. Sex Roles, 2009 ; 61:158–66.
DOI 10.1007/s11199-009-9625-5
12. Park, L.E. Calogero, R.M. Harwin, M.J. DiRaddo A.M. Predicting interest in cosmetic surgery: Interactive effects of
appearance-based rejection sensitivity and negative appearance comments Body Image, 2009 : 6, pp. 186–193
13. Schmalz, D. L. I Feel Fat’: Weight-Related Stigma, Body Esteem, and BMI as Predictors of Perceived Competence in
Physical Activity. Obes Facts, 2010 : 3:15-21.
14. Swami, V., Campana, A.N.N.B., Ferreira, L., Barrett, S., Harris, A.S. and Fernandes, M.D.C.G.C., The Acceptance of
Cosmetic Surgery Scale: Initial examination of its factor structure and correlates among Brazilian adults. Body Image,
2011 : 8(2), pp.179-185.
15. Koyuncu, M., Tok,S., Canpolat, A.M., and Catikkas, F. Body image satisfaction and dissatisfaction, social physique
anxiety, self-esteem, and body fat ratio in female exercisers and nonexercisers. Social behavior and personality, 2010 :
38(4); pp: 561-570.
16. Swami, V., Hwang, C.S. and Jung, J. Factor structure and correlates of the acceptance of cosmetic surgery scale among
South Korean university students. Aesthetic Surgery Journal, 2012 : 32(2), pp.220-229.
17. Menzel, J.E.,Sperry,S.L.,Small,B.,Thompson,J.K.,Sarwer,D.B.,&Cash,T.F. Internalization of appearance ideals and cosmetic surgery attitudes : A test of the Tripar tite Influence Model of BodyImage. Sex Roles, 2011 : 65, 469–477.
http://dx.doi.org/10.1007/s11199-011-9983-7
18. Slevec S, Tiggemann M . Attitudes toward cosmetic surgery in middle-aged women: body image, aging anxiety, and the
media. Psychol Women Quart , 2010 : 34:65–74.
19. Sperry, S. Thompson, J.K. Sarwer, D.B. Cash T.F. Cosmetic surgery reality TV viewership: Relations with cosmetic
surgery attitudes, body image, and disordered eating Annals of Plastic Surgery, 2009 : 62 ,pp. 7–11
20. Nerini, A., Matera, C. and Stefanile, C. Psychosocial predictors in consideration of cosmetic surgery among women.
Aesthetic plastic surgery, 2014 : 38(2), pp.461-466.
21. Matera C, Nerini A, Stefanile C . The role of peer influence on girls’ body dissatisfaction and dieting. Eur Rev Appl
Psychol , 2013: 63:67–74
22. Derenne, J. L., & Beresin, E. V. Body image, media, and eating disorders. Academic Psychiatry, 2006: 30, 257-261.
http://dx.doi.org/10.1176/appi.ap.30.3.257
23. Veale, D. (2004). Advances in a cognitive behavioral model of body dysmorphic disorder. Body Image, 2004: 1, 113-125.
http://dx.doi.org/10.1016/S1740-1445(03)00009-3
24. Cash, T.F. and Pruzinsky, T. Future challenges for body image theory, research, and clinical practice. Body image: A
handbook of theory, research, and clinical practice, 2002: pp.509-516.
25. Rosen, L.H. and Underwood, M.K. Facial attractiveness as a moderator of the association between social and physical
aggression and popularity in adolescents. Journal of school psychology, 2010: 48(4), pp.313-333.
26. Soest T. von , Kvalem I.L. , Roald H.E. , Skolleborg K.C. The effects of cosmetic surgery on body image, self-esteem, and
psychological problems . Journal of Plastic, Reconstructive & Aesthetic Surgery , 2009 : 62, 1238e1244.
27. Saleh Ahmadi, Rafie.S.R . Factors Affecting Patients Undergoing Cosmetic Surgery in Bushehr, Southern Iran. World J
Plast Surg, 2012 ;1(2) :99-106.
28. Dorneles .DE , Andrade .D . On norms and bodies: findings from field research on cosmetic surgery in Rio de Janeiro,
Brazil. Reprod Health Matters , 2010 ;18(35) :74-83. Doi: 10.1016/S0968-8080(10)35519-4
29. Adib Hajbagheri , M. Houshmand ,M . Women’s experience of making decision to do liposuction surgery: A qualitative
study, Journal of Kermanshah university of Medical Science, 2013: VOL 17, NO 4
30. Cabness. J. The psychosocial dimensions of hysterectomy: Private places and the inner spaces of women at midlife. Soc
Work Health Care, 2010; 49(3): 211-26.
31. Markley Rountree M, Davis L. A dimensional qualitative research approach to understanding medically unnecessary
aesthetic surgery. Psychol Market , 2011: 28:1027–1043
32. Elo S, Kyngäs H. The qualitative content analysis process. Journal of Advanced Nursing. 2008 ; 62: 107-115.
33. Zhang Y, Wildemuth BM. Qualitative analysis of content. In: Wildemuth BM. Applications of Social Research Methods to Questions in Information and Library Science. USA: Greenwood Publishing Group, 2009: p. 308-19.
34. Graneheim U, Lundman, B. Qualitative content analysis in nursing research: concepts, procedures and measures to achieve trustworthiness. Nurse Education Today, 2004 ; 24: 105–112.
35. Lincoln YS, Guba EG. Fourth generation evaluation: Sage; 1989
36. Enayat H , and Mokhtari M. “The role of gender attitudes in women body image”, Journal of Woman in Development
and Politics , 2011: vol.9, pp.35-65, 2011
37. Powell-Hicks Allycin. Body Objectification and Elective Cosmetic Procedures in African American Women, Thesis
submitted in partial satisfaction of The requirements for the degree of Master of Arts in General Psychology School of
Science and Technology In conjunction with the Faculty of Graduate Studies, Loma Linda University,2011: 50 pages.

Annals of Tropical Medicine & Public Health-Special Issue Mar 2018 Vol V
S208-18
38. Campana A, Ferreira L , Tavares M. Associations and differences between men and women on the acceptance of
cosmetic plastic surgery in Brazil Rev Bras Cir Plást, 2012 ;27(1):108-14
39. Swami, Viren et al. “The Attractive Female Body Weight and Female Body Dissatisfaction in 26 Countries across 10
World Region: Results of the International Body Project 1", Personality and Social Psychology Bulletin, 2010: vol. 36, No.
3, P 309 _ 325.
40. Darisi T, Thorne S, Iacobelli C. Influences on decision-making for undergoing plastic surgery: a mental models and
quantitative assessment. Plast Reconstr Surg, 2005; 116(3):907-16.
41. Saucier, M. G. Midlife and beyond: Issues for aging women. Journal of Counselling & Development, 2004: 82, 420– 425.
42. Didie, E. R., & Sarwer, D. B. Factors which influence the decision to undergo cosmetic breast augmentation surgery. Journal of Women’s Health, 2003: 12, 241–253.
43. Edmonds A.( 2002) . No universo da beleza: notas de campo sobre cirurgia plástica no Rio de Janeiro. In: Goldenberg M,
ed. Nu & vestido. Rio de Janeiro, 2002: Record. p. 189-262.
44. Ward, C. M. Consenting and consulting for cosmetic surgery. Br J Plast Surg, 1998: 51, 547-50.
45. Calogero, R. M., Pina, A., Park, L., & Rahemtulla, Z. The role of sexual objectification in college women’s cosmetic
surgery atti- tudes. Sex Roles, 2010: 63, 32-41. http://dx.doi.org/10.1007/s11199-010-9759-5
46. Henderson-King, D., & Brooks, K. D. Materialism, sociocul- tural appearance messages, and parental attitudes predict
college women’s attitudes about cosmetic surgery. Psychology of Women’s Quarterly, 2009: 33, 133-142.
http://dx.doi.org/10.1111/j.1471-6402.2008.01480.x
47. Swami, V. Chamorro-Premuzic, T. Bridges, S. Furnham A. Acceptance of cosmetic surgery: Personality and individual
difference predictors Body Image, 2009: 6 , pp. 7–13
48. Kaweeki A. Beauty is Pain: The physical, psychological and emotional impact of female images in the media, Graduate
Thesis, Pacifia Graduate Institute, 2010.
49. Stefanile .Cristina, Nerini. Amanda , Materab. Camilla . The factor structure and psychometric properties of the Italian
version of the Acceptance of Cosmetic Surgery Scale.Body Image , 2014: 11 370–379
50. Sherry, S. B., Hewitt, P. L., Lee-Baggley, D. L., Flett, G. L., & Besser A. Perfectionism and thoughts about having cosmetic
surgery performed. Journal of Applied Biobehavioral Research , 2004: 9, 244–257.
51. Mirsardoo T, Kaldi A, Ataee B. )2011( .Relationship between sociocultural factors and women’s tendency toward beauty surgery among the women in Karaj.Woman& Study of Family, 2011; 3(10):145-164.
52. Rastegar khaled A, Kaveh M . women and beauty project (subjective meanings of cosmetic surgery) journal of woman
in development and politics (women's research)
Annals of Tropical Medicine & Public Health-Special Issue Mar 2018 Vol V
S210-18
Comparison of Serum Sodium And Potassium Levels; 1
Based On Two Methods Arterial Blood Gas And Automatic 2
Laboratory Analyzers 3
Saeid Amirkhanlou 1, Anna Rashedi
2, Soheil Heydarzadeh
3, Mohammad Hadi Molseghi
3,5, Arash Rezai 4
Shahmirzadi 4,5
*, Sina Mostafavi 4, 5
, Samira Eshghinia 6, Tahereh Bakhshi
5 5
1Department of Nephrology, Clinical Research Development Unit (CRDU), Sayad Shirazi Hospital, Golestan University 6 of Medical Sciences, Gorgan, Iran. 7 2Department of Radiology, Clinical Research Development Unit (CRDU), Sayad Shirazi Hospital Golestan University of 8 Medical Sciences, Gorgan, Iran. 9 3Clinical Research Development Unit (CRDU), Sayad Shirazi Hospital, Golestan University of Medical Sciences, 10 Gorgan, Iran. 11 4Medical Student, School of Medicine, Golestan University of Medical Sciences, Gorgan, Iran. 12 5Student Research Committee, Golestan University of Medical Sciences, Gorgan, Iran 13 6Metabolic Disorders Research Center, Golestan University of Medical Sciences, Gorgan, Iran. 14 Corresponding author: Arash Rezaei 15 Student Research Committee, Golestan University of Medical Sciences, Gorgan, Iran 16 Phone: +989112269189 17 E-mail: [email protected] 18 19
ABSTRACT: 20
Background: Electrolytes are substances carrying electric charge and are crucial for proper cellular function 21 in most of body tissues. Concerning the importance of quick measurement of electrolytes in emergency 22 cases, this study was designed to compare results from Arterial Blood Gas (ABG) analysis and laboratory 23 Automatic Analyzers (AA) test for determination of electrolytes in the patients. 24 Patients and Methods: In this cross-sectional study, 88 files from Sayyad Shirazi Hospital in Gorgan (Iran) 25 during 2015 were chosen using simple random sampling (44 for each group). Results from both AA and ABG 26 analyses for blood Na and K were recorded in these files. The results of AA and ABG tests for sodium and 27 potassium determination were compared. 28 Results: The mean sodium levels measured in the samples were 136.35±5.25 mmol/L by AA and 29 140.89±6.37 mmol/L by ABG test. The determined sodium levels were significantly correlated in the two 30 methods (Pearson correlation coefficient= 0.55 and P<0.001). Mean levels of potassium in the samples were 31 4.52±0.71 mmol/L in AA test and 3.52±0.75 mmol/L in ABG test. The determined potassium levels were 32 significantly correlated in the two methods (Pearson correlation coefficient= 0.53 & P<0.001). 33 Conclusion: In general, there is a significant correlation between the arterial blood gas analysis and the 34
laboratory auto-analysis in determination of sodium and potassium. 35
Keywords: Arterial Blood Gas, Analyzer, Laboratory Auto-Analyzer, Sodium, Potassium 36
Introduction 37
Electrolytes are substances carrying electric charge; and they’re crucial for proper cellular function in most of body 38 tissues (1). Electrolyte disorders may cause serious risks for man’s life. Levels of electrolytes are measured for every 39 critically ill emergency patient and also for patients hospitalized in the intensive care unit (ICU) (2). 40
Generally there are two methods for determination of serum electrolytes; direct and indirect. In both methods ion-41 selective electrodes are utilized. In the indirect method, which is the gold standard method for determination of 42 sodium and potassium, the samples usually get diluted and the procedure is done by the auto-analyzer (AA).(3-5) In 43 the direct method, the electrodes are fully in contact with no diluted blood sample. Arterial blood gas (ABG) 44 analyzer or points of care testing (POCT) are mostly used in this method (2). 45

Annals of Tropical Medicine & Public Health-Special Issue Mar 2018 Vol V
SSS
S210-18
AA method is carried out in a hospital central laboratory which may lead to long delay (several hours in some cases) 1 between the time of test application and receiving results (2). However, ABG and POCT methods help doctors do 2 the initial clinical treatments; and these methods are also clinically and economically cost-effective for the patients 3 (6). 4
Earlier studies that evaluated the accuracy of ABG analyzers in measuring electrolytes came to this conclusion that 5 the results of these two separate measurement technologies are meaningfully different for serum sodium and 6 chlorine concentration. This difference was notably calculated as anion gap (AG) and influenced ion levels (7-9). 7 Other studies have found significant differences between ABG analyzers and more advanced analyzers measuring 8 pH, potassium and hematocrit (10-15). Also some studies have mentioned a high degree of accordance between the 9 results of these two methods for determining blood gases and pH (16, 17). 10
Therefore, considering the importance of rapid analysis of electrolytes in emergency cases and the potential value of 11 ABG analyses for sodium and potassium in critical conditions, and the necessity of time and expense saving, for the 12 first time in north of Iran, this study was designed to compare the results from AA and ABG methods for sodium 13 and potassium determination in the patients admitted to Sayyad Shirazi Hospital in Gorgan (Iran). 14
Materials and Methods 15
The study population included all the patients admitted to Sayyad Shirazi Hospital in Gorgan (Iran) during 2015. In 16 the beginning, the files of patients, hospitalized in different departments of hospital, were assessed. The inclusion 17 criteria were if the results of both AA and ABG methods were recorded in the file and the exclusion criteria were 18 patients which had undergone interventions for treatment of fluid and electrolytes imbalance. The data including 19 age, sex and other variables were separately recorded in data forms for every patient. After checking 826 files, 88 20 samples were extracted and registered randomly. The patients were divided into two groups based on the median 21 age; middle-aged (< 50yrs) and old (≥50yrs). They were divided into three groups according to their blood pH 22 indicated by ABG analysis; normal pH (7.35≤pH≤ 7.45), acidosis (pH< 7.35) and alkalosis (pH> 7.45). Mean serum 23 sodium and potassium levels, by AA and ABG methods, were assessed both generally and individually in different 24 groups based on pH, age, sodium and potassium levels. 25
26
27
In the laboratory of hospital, a device named OPTI CCA-TS was used for ABG analysis, which measured serum 28 sodium and potassium level by photometry; and there was a Biolyte 2000 auto-analyzer too, that was only utilized 29 for determination of serum sodium and potassium. 30
Statistical analysis 31
The obtained data were analyzed by SPSS-18 software. Frequency, percentage, mean level and standard deviation 32 were used to describe the data; and to determine the correlation between the results from the two methods, Pearson 33 correlation coefficient was used. To measure the mean difference between the two methods in terms of sodium and 34 potassium levels in different groups, the independent t-test and ANOVA test were used. Differences were considered 35 significant at P<0.05. 36
Results 37
Among the 88 patients who participated in this study, demographic data was according to table 1. 38

Annals of Tropical Medicine & Public Health-Special Issue Mar 2018 Vol V
S210-18
Table 1. Demographic data of patients
Patients Variable
53.77±12.3 Age (yrs)
48 (54.5) Gender (Male N-%)
43 (48.9%) Middle aged (%) Group
45 (51.1%) Old (%)
16 (18.2%) acidosis
Blood acidity 56 (63.6%) normal range
16 (18.2%) alkalosis
The mean sodium levels determined by AA and ABG methods were significantly correlated. (P<0.001) Another
significant correlation was seen in mean potassium levels indicated by these two methods (table 2).
Table 2: Comparison of mean levels of sodium and potassium, in the entire sample and their correlation coefficient (N=88).
Electrolyte Analysis
method Mean level
Pearson’s
correlation
coefficient
Mean difference
in results of the
two methods
SD P value
Sodium(mmol/L) AA 136.35±5.2
0.55 5.4 2.7 0.001 >P ABG 140.89±6.3
Potassium(mmol/L) AA 4.52±0.7
0.53 1.7 0.61 0.001 >P ABG 3.52±0.7
The mean differences in sodium and potassium levels determined by AA and ABG analyses, also was evaluated. 1
In groups of normal pH, acidosis and alkalosis, mean sodium levels, measured by AA and ABG methods, were
significantly correlated (P<0.001); however, in terms of potassium level, the correlation was significant for normal
pH and alkalosis groups but not significant in acidosis group.(P>0.05)(table 3)
1
Table 3: Evaluation of correlation coefficients in sodium and potassium levels, determined by the two methods, in different pH 2 groups 3
Acidity Analysis method Mean Correlation
coefficient P value
Sodium
Normal acidity AA 136.32±5.4
0.53 0.001 >P ABG 141.61±7.2
Acidosis AA 135.25±6.2
0.78 0.001 >P ABG 139.19±4.5
Alkalosis AA 137.5±2.7
0.62 0.01 =P ABG 140±3.7
Potassium
Normal Acidity AA 4.44±0.7
0.54 0.001 >P ABG 3.37±0.6
Acidosis AA 4.88±0.6
0.23 0.39 =P ABG 4.18±0.9
Alkalosis AA 4.44±0.5
0.72 0.001 =P ABG 3.37±0.6

Annals of Tropical Medicine & Public Health-Special Issue Mar 2018 Vol V
SSS
S210-18
Discussion 1
Electrolyte abnormalities are one of the common reversible causes of morbidity and mortality in patients admitted in 2 hospitals. The levels of electrolytes need to be monitored on regular basis in the patients which are ordered in ABG 3 or serum sample as per the convenience of sampling and requirement. The results of both types of measurement are 4 used in inter exchangeable manner with the assumption that they are equivalent. There are a lot many controversies 5 in the reports of the estimation of electrolytes of serum and ABG from different hospitals. The Research Gate 6 Discussion on correlation between electrolytes in blood gases and serum electrolytes ensued that the serum 7 electrolytes are more reliable, while some argue accuracy depends on the machines. 8
In present study we suggest that ABG method shows higher results in sodium level and lower results in potassium 9 level. In the study of Quinn et al (2013), conducted on 100 patients, serum sodium and potassium levels did not 10 show any significant difference in the physiological range; however, in terms of hyperkalemia range (potassium > 5 11 mmol/L), the results of ABG analyses were noticeably different from the standard venous tests (difference = 0.44 12 mmol/L and P<0.0013). In our study, sodium levels reported by the two methods, had the least correlation 13 coefficient (P=0.105). Potassium levels reported by the two methods represent the most correlation coefficient 14 (P=0.002) in hyperkalemia cases unlike the above-mentioned study. In hypokalemia cases there was not any 15 significant correlation (P=0.505) while showing the least mean difference in measurement by the two methods. 16
The study of Chhapola et al. (2013), conducted on 59 patients, evaluated mean level of sodium in both methods and 17 found meaningful data comparing the results of ABG analyzers to AA. However, of the potassium level, this 18 difference was meaningful in hyperkalemia and normokalemia subgroups. This difference was not significant in 19 hypokalemia cases. In our study, mean sodium levels of the entire sample were 136.35 mmol/L and 140.89 mmol/L 20 calculated by auto-analyzer and ABG analyzer, respectively. The difference of the mean levels was 4.54; and these 21 values were significantly correlated (P<0.001). This correlation was minor in normonatremia group comparing to 22 hyponatremia. Mean levels of potassium determined for the entire sample were 4.52 and 3.52 by auto-analyzer and 23 ABG analyzer, respectively. The difference of the numbers was 1, and a significant correlation was seen in these 24 values (P<0.001). This correlation was less in hypokalemia cases comparing to normokalemia and hyperkalemia 25 groups. However as well as the mentioned study, in hypokalemia cases the difference between the results of the two 26 methods was 0.45 and non-significant. 27
About the study of Budak et al.(2012) on 84 patients, results indicated that sodium and potassium levels, measured 28 by ABG an AA methods, are not equal. The results of our study are confirmed concerning the inequality of AA an 29 ABG test results. 30
The study of Jain et al., which was done on 200 patients, indicated that there is a statistical difference between the 31 two devices measuring sodium; however, there was no meaningful difference in potassium levels determined by the 32 two devices. In our study, significant differences were observed between the two methods for measurement of both 33 sodium and potassium. 34
Conclusion 35
According to our findings, there is a significant correlation between the results of auto-analyzers and arterial blood 36 gas analyzers in determination of serum sodium and potassium levels. Acidosis, hypokalemia, hyperkalemia and 37 alkalosis groups had the highest sodium levels measured by both methods; and in terms of potassium level, 38 hyperkalemia and alkalosis groups were the highest. 39
Conflict of interest 40
The authors declare that they have no conflict of interests. 41
Acknowledgements: 42
The authors gratefully thank the patients for their cooperation and thoughtful responses. 43
Annals of Tropical Medicine & Public Health-Special Issue Mar 2018 Vol V
S210-18
References: 1
1. Murray MJ. In Michael James, American society of critical care anesthesiologists. Philadelphia, PA: Lippincott Williams & 2 Wilkins. 2002: 168-9. 3 2. Scott MG, LeGrys VA, Klutts JS. Electrolytes and blood gases. In Tietz textbook of clinical chemistry and molecular diagnostics. 4 4th edition. Edited by Burtis DE, Ashwood ER, Bruns DE. St Louis, MO: Elsevier. 2006: 983-1018. 5 3. Kendall J, Reeves B, Clancy M. Point of care testing: randomized controlled trial of clinical outcome. Br Med J 1998;316: 1052-6 7. 7 4. Kost GJ, Ihrmeyer SS, Chernow B, Winkelman JW, Zaloga GP, Dellinger PR, et al. The laboratory- clinical interface: Point-of-8 care testing. Chest 1999 115: 1140-54. 9 5. St-Louis P. Status of point-of-care testing: promise, realities, and possibilities. ClinBiochem 2000;33(6): 427-40. 10 6. Price CP. Medical and economic outcomes of point of care testing. ClinChem Lab Med 2002;40: 246-51. 11 7. Cox CJ. Acute care testing. Bood gases and electrolytes at the point of care. Clin Lab Med 2001 21(2): 321-35. 12 8. The United States Clinical Laboratory Improvement Amendments. 2006. 13 9. Morimatsu H, Rocktäschel J, Bellomo R, Uchino S, Goldsmith D, Gutteridge G. Comparison of point-of-care versus central 14 laboratory measurement of electrolyte concentrations on calculations of the anion gap and the strong ion difference. 15 Anesthesiology 2003;98: 1077-84. 16 10. Prichard JS, French JS, Alvar N. Clinical evaluation of the ABL-77 for point of care analysis in the cardiovascular operating 17 room. J Extra CorporTechnol 2006;38(2): 128-33. 18 11. Jacobs E, Ancy JJ, Smith M. Multi site performance evaluation of pH, bood gas, electrolyte, glucose and lactate 19 determinations with the GEM Premier 3000 critical care analyzer. Point of Care 2002;1:135-44. 20 12. Pecoraro V, Germagnoli L, Banfi G. Point-of-care testing: where is the evidence? A systematic survey.ClinChem Lab 21 Med. 2014;52(3): 313-24. 22 13. Quinn LM, Hamnett N, Wilkin R, Sheikh A. Arterial blood gas analysers: accuracy in determining haemoglobin, glucose and 23 electrolyte concentrations in critically ill adult patients. Br J Biomed Sci. 2013;70(3):97-100 24 14. Chhapola V, Kanwal SK, Sharma R, Kumar V. A comparative study on reliability of point of care sodium and potassium 25 estimation in a pediatric intensive care unit. Indian J Pediatr. 2013 Sep;80(9):731-5. doi: 10.1007/s12098-013-0977-z. Epub 26 2013 Feb 8. 27 15. Budak YU, Huysal K, Polat M. Use of a blood gas analyzer and a laboratory autoanalyzer in routine practice to measure 28 electrolytes in intensive care unit patients.BMCAnesthesiol. 2012;12: 17-28. 29 16. Jain A, Subhan I, Joshi M. Comparison of the point-of-care blood gas analyzer versus the laboratory auto-analyzer for the 30 measurement of electrolytes.Int J Emerg Med. 2009;2(2):117-20. 31

Annals of Tropical Medicine & Public Health-Special Issue Mar 2018 Vol V
SSS
S210-18

Annals of Tropical Medicine & Public Health-Special Issue Mar 2018 Vol V
S211-18
Depression and Internet Addiction in Students
Mahmood Rahmati1, Somayeh Hashemi Aliabadi
2*, Sharareh Ahmadi
3, Somayeh Azimi
4
1Psychiatric Nursing Department, School of Nursing and Midwifery, Kermanshah University of Medical Sciences
(KUMS), Kermanshah, Iran 2MSc Student of Psychiatric Nursing. Faculty of Nursing and Midwifery, Kermanshah University of Medical Sciences
(KUMS), Kermanshah, Iran 3MSc Student of Medical Surgical Nursing, Faculty of Nnursing and Midwifery, Kermanshah University of Medical
Sciences (KUMS), Kermanshah, Iran 4Department of Nursing, School of Nursing, Larestan University of Medical Sciences, Larestan, Iran
*Corresponding Author: Somayeh Hashemi Aliabadi
MSc Student of Psychiatric Nursing. Faculty of Nursing and Midwifery, Kermanshah University of Medical Sciences
(KUMS), Kermanshah, Iran. Tel: +98-83- 38279394, E-mail: [email protected]
Abstract
Background: depression is fourth leading cause of disease burden in both sex and it is the first cause of
disease burden in women in IRAN. Depression in college students is more common than the general
population and they are considered as high risk group for internet addiction. .This study examines the
relationship between internet addiction and depression in the students.
Materials and methods: In a cross sectional study, questionnaires included (BDI-II & Internet Addiction
Scale (IAS).) distributed among 150 students who intended to participate in the study. The relationships
between variables examined by SPSS 20 using t-test and Pearson's correlation coefficient.
Results: There was a significant correlation between internet addiction and depression (p<0/001; r=0/222).
21 of subjects have mild, 18/3 have moderate and 17/6 have severe depression.5.9 of samples have mild internet addiction. There was significant correlation between average number of hours of Internet usage
and BDI-II and IAS scores of students. Independent sample t-test revealed that there were no significant
differences in BDI-II and IAS scores in both sex and also marriage status of samples.
Conclusion: There was a significant correlation between internet addiction and depression scores, average
number of hours of Internet usage related to depression and internet addiction than students that have
some depression should be evaluated on internet addiction vice versa
Key words: depression, depressive disorders, university students, Internet Addiction
Introduction
Depression is the fourth top cause of burden of disease in Iran [1]. It is a prevalent health condition that afflicts 15%
of adult population once in their lifetime [2]. Depression rate among students, according to different studies, is in
10-85% range (mean = 30.6%) [3]. A study by Pourkiani et al. (2016) in Larestan University of Medical Sciences,
Iran showed that 49.7% of students were suspects for having health problems and 46.5% of them were suspect
depression cases [4]. The society incurs higher costs due to depression in the youth comparing with depression in
other age groups as the former group is supposed to be future of the society [5]. Depression leads to lower
performance in college [6], attempting suicide [7, 8], unstable interpersonal relationships [9], and lower productivity
at work [10]. Factors like life in dormitory, experiencing unpleasant life events, having fewer friends and less social
activity, and the effects of other students all increase risk of depression [11, 12]; while religion is a protective
variable against depression [13]. Depression might be a prognosis of Internet addiction and or a cause of
overdependence on the Internet. For many, the Internet is a key element in their lives. They use the Internet to do
shopping, seek information, and share their ideas with others. Studies on the Internet dependence were started by the
Kimberly Young’s (1998) work in the USA and soon the topic became part of the mainstream of research works all
around the world. This trend of studies was expanded in education field by the attempts to examine the effect of
Internet dependence on educational performance of students [14]. From clinical point of view, Internet caused
behavioral problems have different names such as Internet addiction, problematic use of the Internet, and ill-use of

Annals of Tropical Medicine & Public Health-Special Issue Mar 2018 Vol V
S211-18
the Internet and all of these refer to almost the same concept [15]. Internet addiction disorder is a multidisciplinary
phenomenon and challenges different fields of science such as medicine, computer, sociology, laws, ethics, and
psychology and each one of these disciplines approaches the problem from different aspect [16]. Internet addiction
is a mental dependence on the Internet that is characterized with a- Spending time and money on Internet-related
activities in an excessive manner; b- Unpleasant feeling when not connected to the Internet (e.g. anger); c- high
tolerance to the effects of internet connection; and d- denying the problematic behavior [17]. To carry out class
assignment, communicate with friends, and spend leisure time, the youth need to learn and use the Internet. The
problem appears when Internet addiction causes negative effects on educational performant, social relationships, and
emotions of the youth [18]. Juveniles who develop Internet dependence tend to show more aggressive behaviors
[19]; and Internet dependence results in negative physical, psychological, and social outcomes [20]. Students are of
the groups with high vulnerability to Internet dependence, which expresses itself in the form of withdrawal from
social activity, loneliness, and depression. Excessive use of the Internet negatively affects educational performance
in college and it has to do with drug abuse as well [21]. Some factors increase the risk of Internet addiction such as
psychological and growth factors at the late adolescence, easy access to the Internet, and expectations about using
computers and the Internet [18]. Improper use of the Internet and surfing the Net for the sake curiosity not only
distract the students from the main usage of the Internet for academic purposes, but also may negatively affect
students’ educational performance as such behaviors lead to development of a sort of Internet addiction so that the
student will spend the main portion of their leisure times on the Internet [22]. Akin and Iskender (2011) argued that,
although, the relationship between Internet addiction and social, educational, and physical variables has been
thoroughly surveyed, the strong relationship between Internet addiction and emotional variables (e.g. anger,
depression, and stress) has been barely examined [23]. There have been studies in Iran that, among the other things,
have dealt with the relationship between depression and Internet addiction; however, there has been no study
specifically on depression and Internet addiction. The present study, therefore, deals with the relationship between
depression and the level of Internet dependence in students.
Material and Methods:
A descriptive-correlative study was carried out in two medical sciences faculties in Fars Province, Iran. The
participants were selected through convenient sampling among the students interested in participation. Totally, 150
questionnaires were distributed and 125 were returned out of which 119 questionnaires were used in data analyses.
Data gathering tools
a. Internet Addiction Scale (IAS) (Young 1998): The scale was developed by Kimberly Young in 1998 [17]
with 20 five-alternative items. Different aspects of Internet addiction are measured by the scale and maximum
possible score is 100. Scores from 0 to 39 are interpreted as no dependence or normal user; scores from 40 to 69 are
interpreted as probable or trivial dependence, and scores from 70 to 100 are interpreted as Internet addict.
b. Beck Depression Inventory (BDI-II), with 21 questions each with four alternatives (0-3), measures
depression level and its maximum possible score is 63. Based on the score subjects are categorized in four groups of
no depression (score range: <13), trivial depression (score range: 14-19), mediocre depression (score range: 20-28),
and severe depression (score range: 29-63).
At first, face validity of the questionnaire was examined by five faculty board members of Shiraz University of
Medical Sciences. To examine reliability of the questionnaire, a pilot study and Cronbach’s alpha were used; α-
values for IAS and BDI-II were 0.93 and 0.91 respectively.
Results
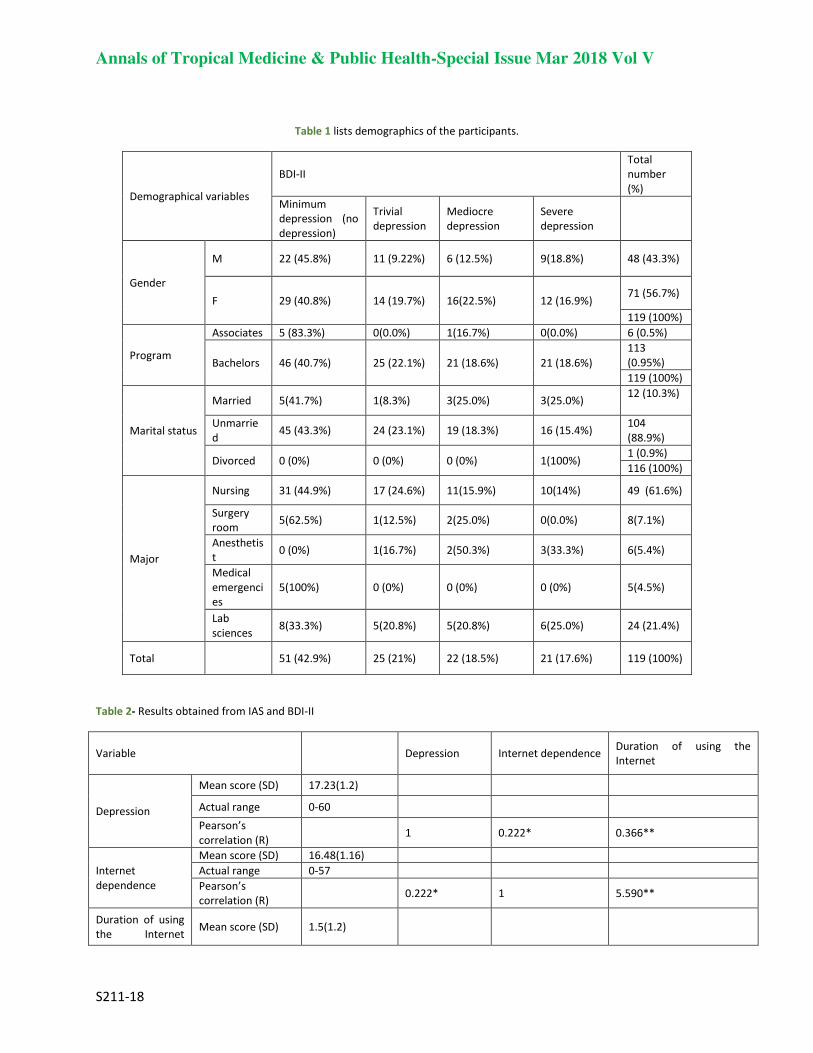
Annals of Tropical Medicine & Public Health-Special Issue Mar 2018 Vol V
S211-18
Table 1 lists demographics of the participants.
Total
number
(%)
BDI-II
Demographical variables
Severe
depression
Mediocre
depression
Trivial
depression
Minimum
depression (no
depression)
48 (43.3%) 9(18.8%) 6 (12.5%) 11 (9.22%) 22 (45.8%) M
Gender 71 (56.7%)
12 (16.9%) 16(22.5%) 14 (19.7%) 29 (40.8%) F
119 (100%)
6 (0.5%) 0(0.0%) 1(16.7%) 0(0.0%) 5 (83.3%) Associates
Program 113
(0.95%) 21 (18.6%) 21 (18.6%) 25 (22.1%) 46 (40.7%) Bachelors
119 (100%)
12 (10.3%)
3(25.0%) 3(25.0%) 1(8.3%) 5(41.7%) Married
Marital status 104
(88.9%) 16 (15.4%) 19 (18.3%) 24 (23.1%) 45 (43.3%)
Unmarrie
d
1 (0.9%) 1(100%) 0 (0%) 0 (0%) 0 (0%) Divorced
116 (100%)
49 (61.6%) 10(14%) 11(15.9%) 17 (24.6%) 31 (44.9%) Nursing
Major
8(7.1%) 0(0.0%) 2(25.0%) 1(12.5%) 5(62.5%) Surgery
room
6(5.4%) 3(33.3%) 2(50.3%) 1(16.7%) 0 (0%) Anesthetis
t
5(4.5%) 0 (0%) 0 (0%) 0 (0%) 5(100%)
Medical
emergenci
es
24 (21.4%) 6(25.0%) 5(20.8%) 5(20.8%) 8(33.3%) Lab
sciences
119 (100%) 21 (17.6%) 22 (18.5%) 25 (21%) 51 (42.9%) Total
Table 2- Results obtained from IAS and BDI-II
Variable Depression Internet dependence Duration of using the
Internet
Depression
Mean score (SD) 17.23(1.2)
Actual range 0-60
Pearson’s
correlation (R) 1 0.222* 0.366**
Internet
dependence
Mean score (SD) 16.48(1.16)
Actual range 0-57
Pearson’s
correlation (R) 0.222* 1 5.590**
Duration of using
the Internet Mean score (SD) 1.5(1.2)

Annals of Tropical Medicine & Public Health-Special Issue Mar 2018 Vol V
S211-18
(hr/week) Actual range 0.24
Pearson’s
correlation (R) 0.366** 0.590** 1
* (p<0.05), ** (p<0.01)
As listed in Table 2, mean scores of the subjects in IAS and BDI-II are 16.48±1.16 and 17.23±1.2 respectively. In
addition, Pearson’s correlation shows that there is a significant relationship between Internet addition and depression
(r=0.222, p<0.05). There are also significant relationship between using the Internet and score of depression
(r=0.366, p<0.01) and between duration of using the Internet and level of dependence on the Internet (r=0.590,
p<0.01).
Table 3- Frequency of Internet addiction and depression in the subjects
Variable Frequency (%)
Internet addiction
Normal users (no dependence) (score: 0-39) 107(89.6%)
Marginal users (trivial dependence) (score: 40-69) 11(9.6%)
Dependent users (addicted) (score:70-100) 1(0.8%)
Depression
No depression (score<13) 51 (42.9%)
Trivial depression (score: 14-18) 25(21.0%)
Mediocre depression (score: 20-28) 22 (18.5%)
Severe depression (score: 29-63) 21(17.6%)
As listed in Table 3, 9.6% of the subjects are at the edge so that they had trivial dependence on the Internet. In
addition, 89.6% of the subjects are normal Internet users and there is only one subject in the addicted group.
Table 4- Independent t-test on the variables gender and marital status in terms of total depression and internet dependence
scores
Mem Women t p-value Unmarried Married t p-value
Me
an
sco
re
SD
Me
an
sco
re
SD
Me
an
sco
re
SD
Me
an
sco
re
SD
Depressio
n 16.39 11.8 17.87 12.58 1.76 0.08 16.6 11.46 22.25 17 53.1 0.127
Internet
dependen
ce
21.72 14.34 16.82 15 -.619 0.537 19 15 12 7.9 62.1 0.107
Table 4 lists independent t-test results about the level of depression based on gender and as listed, there is no
significant difference in this regard (p-value=0.08, t=1.76). In addition, there is no significant difference between the
two genders in terms of Internet dependence (p-value=0.537, t=-0.619). Results of independent t-test also shows that
there is no significant difference between married and unmarried participants in terms of depression score (p-

Annals of Tropical Medicine & Public Health-Special Issue Mar 2018 Vol V
S211-18
value=0.127, t=1.53). Moreover, there is no significant difference between married and unmarried subjects in terms
of Internet addiction. (P-value=0.107, t=1.62)
Discussion
The term addiction refers to psychological and physical dependence and emergence of withdrawal syndrome when
the individual does not have access to the drug or item to which he/she is addicted. Clinically speaking, addiction
might refer to one’s attempt to control depression and anxiety and an indicator of deep sense of inner insecurity or
sense of emptiness [24]. In light of this, one of the objectives of the present study was to determine depression level
in the students. The results showed that the prevalence of depression was 42.9%; in addition 21% of the subjects had
minimum depression (no-depression), 18.3% had mediocre depression, and 17.6% had severe depression. Mean
BDI-II score of the subjects was 17.23±1.2. Pourkiani et al. (2016) showed that 46.5% of health problems of the
students was related to depression disorder [4]. The level of depression in the students was higher than that of the
public (9%) [3]; this means that students are in depression vulnerable group and need special attention.
Moreover, 5.9% of the subjects were at the edge and had trivial Internet dependence and 94.1% were normal
Internet users. No significant difference was found between men and women in terms of Internet addiction (t-test).
Alavi et al. reported that 10% of their respondents were Internet addicts [16] and Kim et al. (2006) studied 1537
high school students in South Korea and found that 1.6% were Internet addicts and 38% were suspected for Internet
dependence [24]. Nazi (2012) in Lebanon reported that Internet dependence rate was equal to 4.2% [14].
Moreover, t-test results revealed that there was no significant difference between men and women with regard to
Internet addiction. Consistently, Fortson et al. studied students in Virginia University and showed that there was no
significant difference between men and women as to mean time duration of Internet use [25]. Yen et al., on the other
hand, argued that there was a significant difference between men and women in terms of Internet addiction so that it
was more prevalent in the former group [26]. Alavi et al. in Iran showed that risk of Internet addiction in men was
1.8times higher than that of women [16]. This might be because of the difference between men and women with
regard to Internet access; however, our subjects were identical in this regard.
Mean score of IAS of the subjects in this study was 16.48±1.16. Kim et al. studied high school juveniles and
reported mean score of IAS of the subject equal to 37.58 [24]. Beigi et al. (2009) studied subjects with average age
of 20.95±1.41 (students of Arak University of Medical Sciences) and reported mean score of IAS of the subjects
equal to 32.74±14.52 [22]. Results of the present study showed that there was a significant relationship between
Internet addiction and depression (p<0.01, r=0.999). Larose et al. (2003) found that there was a positive correlation
between duration of using the Internet and depression [15]. Kimberly Young and Rodgers studied the relationship
between depression and Internet dependence and found that the relationship was significant [17]. The relationship
between depression and Internet dependence is a function of the purpose of using the Internet. For instance, Selfhout
et al. (2009) studied 307 adolescents in terms of using the Internet for communicational and non-communicational
purposes and its relationship with depression, social anxiety, and quality of friendship relationships. They reported
that the subjects who used the Internet for communicational purposes experienced less depression comparing with
those who used the Internet for non-communicational purposes. That is, depression and social anxiety were higher in
the subjects who used the Internet for non-communicational purposes [27]. It is notable that the Internet, in some
cases, is used for decreasing depression. In short, prevalence of depression in the subjects was higher than Internet
dependence, which means depression could a reason for higher tendency to use the Internet in the student. Using the
Internet leads to dependence when it is not purposeful. Although, the cross-sectional nature of the study makes it
unsuitable to make a definite conclusion that using the Internet leads to depression, the relationship between the two
variables indicates that the two issues can be correlative. Therefore, it would be more helpful to check Internet
dependence in the students with depression and vice versa.
Limitations
The study was carried out as a descriptive correlative work and it is not possible to explain the relationship between
the variables based on cause-effect relationships.
Conclusion
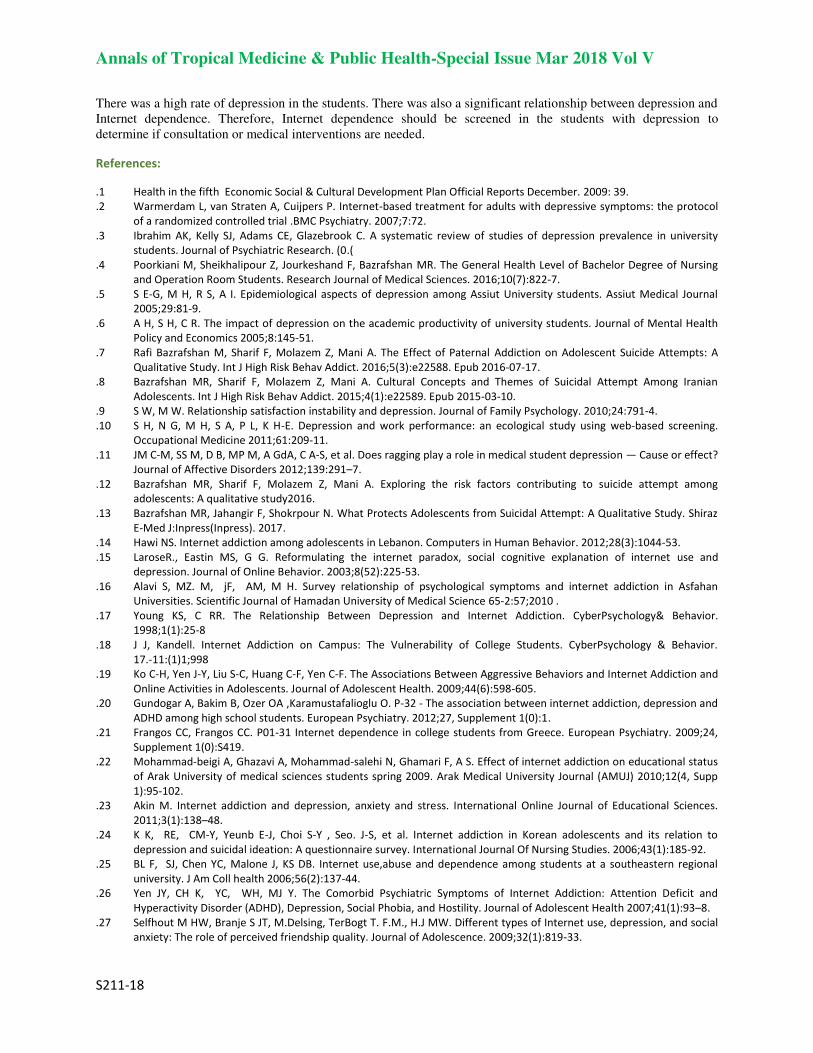
Annals of Tropical Medicine & Public Health-Special Issue Mar 2018 Vol V
S211-18
There was a high rate of depression in the students. There was also a significant relationship between depression and
Internet dependence. Therefore, Internet dependence should be screened in the students with depression to
determine if consultation or medical interventions are needed.
References:
1. Health in the fifth Economic Social & Cultural Development Plan Official Reports December. 2009: 39. 2. Warmerdam L, van Straten A, Cuijpers P. Internet-based treatment for adults with depressive symptoms: the protocol
of a randomized controlled trial .BMC Psychiatry. 2007;7:72. 3. Ibrahim AK, Kelly SJ, Adams CE, Glazebrook C. A systematic review of studies of depression prevalence in university
students. Journal of Psychiatric Research. (0.) 4. Poorkiani M, Sheikhalipour Z, Jourkeshand F, Bazrafshan MR. The General Health Level of Bachelor Degree of Nursing
and Operation Room Students. Research Journal of Medical Sciences. 2016;10(7):822-7. 5. S E-G, M H, R S, A I. Epidemiological aspects of depression among Assiut University students. Assiut Medical Journal
2005;29:81-9. 6. A H, S H, C R. The impact of depression on the academic productivity of university students. Journal of Mental Health
Policy and Economics 2005;8:145-51. 7. Rafi Bazrafshan M, Sharif F, Molazem Z, Mani A. The Effect of Paternal Addiction on Adolescent Suicide Attempts: A
Qualitative Study. Int J High Risk Behav Addict. 2016;5(3):e22588. Epub 2016-07-17. 8. Bazrafshan MR, Sharif F, Molazem Z, Mani A. Cultural Concepts and Themes of Suicidal Attempt Among Iranian
Adolescents. Int J High Risk Behav Addict. 2015;4(1):e22589. Epub 2015-03-10. 9. S W, M W. Relationship satisfaction instability and depression. Journal of Family Psychology. 2010;24:791-4. 10. S H, N G, M H, S A, P L, K H-E. Depression and work performance: an ecological study using web-based screening.
Occupational Medicine 2011;61:209-11. 11. JM C-M, SS M, D B, MP M, A GdA, C A-S, et al. Does ragging play a role in medical student depression — Cause or effect?
Journal of Affective Disorders 2012;139:291–7. 12. Bazrafshan MR, Sharif F, Molazem Z, Mani A. Exploring the risk factors contributing to suicide attempt among
adolescents: A qualitative study2016. 13. Bazrafshan MR, Jahangir F, Shokrpour N. What Protects Adolescents from Suicidal Attempt: A Qualitative Study. Shiraz
E-Med J:Inpress(Inpress). 2017. 14. Hawi NS. Internet addiction among adolescents in Lebanon. Computers in Human Behavior. 2012;28(3):1044-53. 15. LaroseR., Eastin MS, G G. Reformulating the internet paradox, social cognitive explanation of internet use and
depression. Journal of Online Behavior. 2003;8(52):225-53. 16. Alavi S, MZ. M, jF, AM, M H. Survey relationship of psychological symptoms and internet addiction in Asfahan
Universities. Scientific Journal of Hamadan University of Medical Science .2010;2:57-65
17. Young KS, C RR. The Relationship Between Depression and Internet Addiction. CyberPsychology& Behavior.
1998;1(1):25-8 18. J J, Kandell. Internet Addiction on Campus: The Vulnerability of College Students. CyberPsychology & Behavior.
1 998;1(1:)11-7.
19. Ko C-H, Yen J-Y, Liu S-C, Huang C-F, Yen C-F. The Associations Between Aggressive Behaviors and Internet Addiction and
Online Activities in Adolescents. Journal of Adolescent Health. 2009;44(6):598-605. 20. Gundogar A, Bakim B, Ozer OA ,Karamustafalioglu O. P-32 - The association between internet addiction, depression and
ADHD among high school students. European Psychiatry. 2012;27, Supplement 1(0):1. 21. Frangos CC, Frangos CC. P01-31 Internet dependence in college students from Greece. European Psychiatry. 2009;24,
Supplement 1(0):S419. 22. Mohammad-beigi A, Ghazavi A, Mohammad-salehi N, Ghamari F, A S. Effect of internet addiction on educational status
of Arak University of medical sciences students spring 2009. Arak Medical University Journal (AMUJ) 2010;12(4, Supp
1):95-102. 23. Akin M. Internet addiction and depression, anxiety and stress. International Online Journal of Educational Sciences.
2011;3(1):138–48. 24. K K, RE, CM-Y, Yeunb E-J, Choi S-Y , Seo. J-S, et al. Internet addiction in Korean adolescents and its relation to
depression and suicidal ideation: A questionnaire survey. International Journal Of Nursing Studies. 2006;43(1):185-92. 25. BL F, SJ, Chen YC, Malone J, KS DB. Internet use,abuse and dependence among students at a southeastern regional
university. J Am Coll health 2006;56(2):137-44. 26. Yen JY, CH K, YC, WH, MJ Y. The Comorbid Psychiatric Symptoms of Internet Addiction: Attention Deficit and
Hyperactivity Disorder (ADHD), Depression, Social Phobia, and Hostility. Journal of Adolescent Health 2007;41(1):93–8. 27. Selfhout M HW, Branje S JT, M.Delsing, TerBogt T. F.M., H.J MW. Different types of Internet use, depression, and social
anxiety: The role of perceived friendship quality. Journal of Adolescence. 2009;32(1):819-33.

Annals of Tropical Medicine & Public Health-Special Issue Mar 2018 Vol V
S211-18

Annals of Tropical Medicine & Public Health-Special Issue Mar 2018 Vol V
S212-18
Investigating the Relation between Anxiety, Stress, 1
Depression and Hemodialysis Adequacy in Patients 2
Hospitalized in Hemodialysis Center of Dezful Grand 3
Hospital in 2014 4
Ahmad Mahmoudi Kouhi1, Mahmoud Mazali
2, Narjes Kazemi
3, Hamideh Mashalchi
4, Shahzad Mehranfard
5, 5
Sadegh Ahmadi Mazhin6, Somaieh Bosak*
7 6
1Student of BSc of Laboratory Sciences. Faculty of Paramedical Sciences, Dezful University of Medical Sciences, 7 Dezful, Iran. 8
BSc of Nursing. Faculty of Nursing, Dezful University of Medical Sciences, Dezful, Iran 9
3,4,5,6MSc of nursing. Academic member of faculty of nursing, Dezful University of Medical Sciences, Dezful,Iran. 10
7MSc of Psychiatric Nursing. Academic member of Nursing Department&Research Manager. Dezful University of 11 Medical Sciences, Dezful, Iran. Address: 2nd flour, Nursing Department, Dezful University of Medical Sciences. 12 Azadegan, Dezful, Khuzestan, Iran 13
*Corresponding Author Email: [email protected] 14
Abstract 15 16 Background: as the main treatment of chronic renal failure hemodialysis is associated with numerous 17 different psychosocial problems for patients. Depression, anxiety and stress are among these mental 18 disorders. 19 Objectives: This study aimed to determine the relationship between stress, anxiety and depression with 20 dialysis adequacy in hospitalized patients. 21 Patients and Methods: This is a descriptive and analytical study that was conducted on 78 patients that 22 were selected using convenience sampling method. To determine the hemodialysis adequacy (URR, KT / V) 23 scale and to evaluate the level of anxiety, depression and stress DASS21 questionnaire was used. Finally, 24 data were analyzed using SPSS version 16. 25 Results: 75 patients (30 females and 45 males) entered the study. 44% of the studied individuals (63.6% of 26 men and 36.3% women) according to KT/V criteria, and 36% (66.6% of men and 33.3% of women) according 27 to standard URR had adequacy of dialysis. No significant relationship was observed in terms of age and sex 28 between the KT/V and URR (P<0.05). The prevalence of depression in patients was found 54.6% (53.6% in 29 men and 46.3% in women), anxiety 66.7% (50.3% in men and 49.7% in women) and stress 58.7% (54.9% in 30 men and 45.1% in women). There was a significant relationship between the rates of depression, anxiety 31 and stress, with KT/V and URR (P <0.05). 32 Conclusion: Given the inverse relationship between depression, anxiety and stress in patients and dialysis 33 adequacy it is suggested that counseling centers and mental health centers are created or strengthened to 34 reduce these disorders. 35 36 Keywords: dialysis adequacy, depression, anxiety, stress 37
38
Background
Today, chronic kidney disease is a growing problem that affects about 10 percent of the world's population (1).
Chronic renal failure is at the forefront of kidney problems as a health problem, as Turkish Society of Nephrology
reported in 2010, almost 62 903 patients with kidney failure exist that 49,505 of them are receiving hemodialysis
(2). The End stage renal diseases ((ESRD) is the most advanced stage of renal failure, in which the irreversible loss
of kidney is observed. The main treatments of ESRD include kidney transplant and temporary treatment, that due to
limitations of kidney transplant, hemodialysis is the most common method of treatment around the world (3).

Annals of Tropical Medicine & Public Health-Special Issue Mar 2018 Vol V
S S212-18
Although hemodialysis increases survival of patients with ESRD, however, it can lead to psychological problems
such as depression (4). Patients who are treated with hemodialysis show a higher rate of anxiety and stress than
patients who receive peritoneal dialysis, because undergoing hemodialysis is associated with limiting daily activities
and loss of independence, and increases the desire for suicide in these patients (5). Depression is also proposed as
the most common psychiatric illness among dialysis patients and its prevalence is reported 1.1+15 among men and
1.8-23 among women (6). Studies report the prevalence of depression in patients with chronic kidney disease using
Beck questionnaire about 20-25 percent (7). Cukor in 2013 stated the rate of clinical anxiety has been up to 45% (8).
Although proving the effects of depression and anxiety on hospitalization and mortality rates of dialysis patients is
difficult but Kimmel et al. (2000), conducted a cohort comprehensive analysis on patients that filled out Beck
Depression Inventory every six months, this analysis showed a significant relationship between the intensity of
depression and mortality in dialysis patients (9).
At the same time improving the adequacy of hemodialysis reduces mortality from chronic renal failure (10).
Adequacy of Dialysis can be effective on survival, quality of life, complications of dialysis, and also the length of
staying in hospital (11). Currently, the most common measures of dialysis adequacy include URR: urea reduction
ratio, and kt/V where K is the clearance dialyzer (ml/min), T dialysis time (min), and V is the volume of distribution
urea (12).
According to the policies of kidney Disease Outcomes Quality Foundation (KDOQI), in KT/V method the minimum
effective dose of dialysis for patients who are on dialysis twice or more a week is 1.2, and according to URR the
minimum effective dose for dialysis patients who are on dialysis less than 5 hours per session is 65% (13). The
evaluation of hemodialysis adequacy is one of the key factors in country's healthcare system services, however, even
in some European countries the dialysis centers does not calculate the KT/V (14).
There are several references that point to the relationship between some of the symptoms caused by inadequate
dialysis such as mortality and morbidity with depression and anxiety (15). Given the prevalence of mental disorders
among hemodialysis patients as well as the possible impact of the disorder on the adequacy of hemodialysis, this
issue is probably correlated with patient survival. On the other hand, due to unawareness of health care system from
the impact of mental health on improving the patients, this study aimed to determine the relationship between stress,
anxiety and depression with dialysis adequacy in hemodialysis patients in Dezful Grand Hospital in 2014.
Patients and Methods
This study is a descriptive and cross-sectional study with a sample size of 75 patients who were selected by
convenience sampling. The population consisted of all hemodialysis patients who were admitted to the hemodialysis
center of Dr.Ganjavian Hospital in Dezful. Inclusion criteria included permanent membership in the list of dialysis
center, at least 18 years of age, no history of mental illness, doing dialysis at least twice a week. The exclusion
criteria consisted of consuming anti-anxiety and anti-depression drugs, pregnancy and lack of received previous
training in the control and treatment of anxiety, stress and depression. In order to remove emergency and acute renal
failure cases, dialysis patients over the past three months were chosen. Kidney dialysis patients to remove their
holidays in the second session of the week were examined. After obtaining written informed consent, the
demographic information including age, gender, onset of dialysis, the number of hours of dialysis per week, duration
of dialysis session in hours and minutes, the weight before and after dialysis, BUN before and after dialysis was
collected using questionnaire. In order to assess dialysis adequacy two criteria of KT/V and URR were used. It
should be noted blood samples were taken 15 minutes after dialysis cutoff and turning off the pump. The KT/V and
URR were calculated according to the formula in Table 1.
Adequacy of dialysis in this study was applied to the KT/V greater than or equal to 1.2 or URR greater than or equal
to 65% (16).
Anxiety, stress and depression were assessed based on DASS_21 questionnaire taken from psychological,
personality and mental health test book. The questionnaire contains 21 questions that each of the subscales of this
questionnaire includes 7 questions, the final score of each subscale is obtained by summing the total scores of all
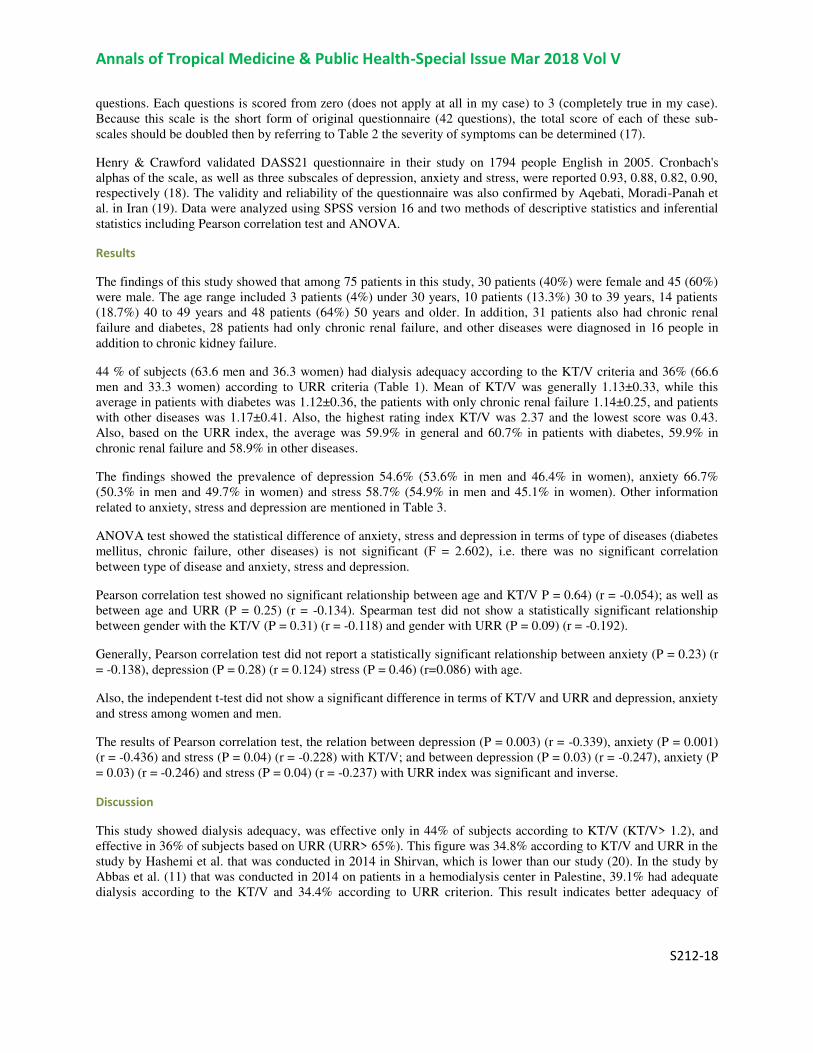
Annals of Tropical Medicine & Public Health-Special Issue Mar 2018 Vol V
S212-18
questions. Each questions is scored from zero (does not apply at all in my case) to 3 (completely true in my case).
Because this scale is the short form of original questionnaire (42 questions), the total score of each of these sub-
scales should be doubled then by referring to Table 2 the severity of symptoms can be determined (17).
Henry & Crawford validated DASS21 questionnaire in their study on 1794 people English in 2005. Cronbach's
alphas of the scale, as well as three subscales of depression, anxiety and stress, were reported 0.93, 0.88, 0.82, 0.90,
respectively (18). The validity and reliability of the questionnaire was also confirmed by Aqebati, Moradi-Panah et
al. in Iran (19). Data were analyzed using SPSS version 16 and two methods of descriptive statistics and inferential
statistics including Pearson correlation test and ANOVA.
Results
The findings of this study showed that among 75 patients in this study, 30 patients (40%) were female and 45 (60%)
were male. The age range included 3 patients (4%) under 30 years, 10 patients (13.3%) 30 to 39 years, 14 patients
(18.7%) 40 to 49 years and 48 patients (64%) 50 years and older. In addition, 31 patients also had chronic renal
failure and diabetes, 28 patients had only chronic renal failure, and other diseases were diagnosed in 16 people in
addition to chronic kidney failure.
44 % of subjects (63.6 men and 36.3 women) had dialysis adequacy according to the KT/V criteria and 36% (66.6
men and 33.3 women) according to URR criteria (Table 1). Mean of KT/V was generally 1.13±0.33, while this
average in patients with diabetes was 1.12±0.36, the patients with only chronic renal failure 1.14±0.25, and patients
with other diseases was 1.17±0.41. Also, the highest rating index KT/V was 2.37 and the lowest score was 0.43.
Also, based on the URR index, the average was 59.9% in general and 60.7% in patients with diabetes, 59.9% in
chronic renal failure and 58.9% in other diseases.
The findings showed the prevalence of depression 54.6% (53.6% in men and 46.4% in women), anxiety 66.7%
(50.3% in men and 49.7% in women) and stress 58.7% (54.9% in men and 45.1% in women). Other information
related to anxiety, stress and depression are mentioned in Table 3.
ANOVA test showed the statistical difference of anxiety, stress and depression in terms of type of diseases (diabetes
mellitus, chronic failure, other diseases) is not significant (F = 2.602), i.e. there was no significant correlation
between type of disease and anxiety, stress and depression.
Pearson correlation test showed no significant relationship between age and KT/V P = 0.64) (r = -0.054); as well as
between age and URR (P = 0.25) (r = -0.134). Spearman test did not show a statistically significant relationship
between gender with the KT/V (P = 0.31) (r = -0.118) and gender with URR (P = 0.09) (r = -0.192).
Generally, Pearson correlation test did not report a statistically significant relationship between anxiety (P = 0.23) (r
= -0.138), depression (P = 0.28) (r = 0.124) stress (P = 0.46) (r=0.086) with age.
Also, the independent t-test did not show a significant difference in terms of KT/V and URR and depression, anxiety
and stress among women and men.
The results of Pearson correlation test, the relation between depression (P = 0.003) (r = -0.339), anxiety (P = 0.001)
(r = -0.436) and stress (P = 0.04) (r = -0.228) with KT/V; and between depression (P = 0.03) (r = -0.247), anxiety (P
= 0.03) (r = -0.246) and stress (P = 0.04) (r = -0.237) with URR index was significant and inverse.
Discussion
This study showed dialysis adequacy, was effective only in 44% of subjects according to KT/V (KT/V> 1.2), and
effective in 36% of subjects based on URR (URR> 65%). This figure was 34.8% according to KT/V and URR in the
study by Hashemi et al. that was conducted in 2014 in Shirvan, which is lower than our study (20). In the study by
Abbas et al. (11) that was conducted in 2014 on patients in a hemodialysis center in Palestine, 39.1% had adequate
dialysis according to the KT/V and 34.4% according to URR criterion. This result indicates better adequacy of

Annals of Tropical Medicine & Public Health-Special Issue Mar 2018 Vol V
S S212-18
dialysis in the studied center compared to other centers; however it is lower than the global level. It is thought that
the causes of low efficiency of dialysis may be the inadequate time and number of sessions of dialysis per week, the
use of non-standard filter and inadequate pump revolutions. Results showed that depression exists in 54.6% of
subjects, anxiety in 66.7% and stress in 58.7%; and men are more depressed than women in our study and have more
anxiety and stress, although this difference was not statistically significant. Hashemi et al. reported this value as
39.2% (20). Bautovich et al. (1) in a review study in 2014 concluded that the prevalence of depression in kidney
patients is 20.3%. Also in the study by Stasiak et al. that was conducted in Brazil, the prevalence of depression and
anxiety in hemodialysis patients is reported 22.6% and 25.7%, respectively which is lower than present study (5). In
the study by Greenwood et al. on 131 patients, depression prevalence is reported as 29% (21). Hosseini et al.
reported the prevalence of depression and anxiety at 67 and 69.3 percent, respectively (22). High levels of anxiety,
stress and depression in the center examined in our study could indicate a lack of attention to mental issues of
patients. The reasons for anxiety and high stress and depression in dialysis patients can be related to complications
beside dialysis such as diabetes and high blood pressure. As in this study, diabetic patients were more depressed.
Another reason for the high rate of depression and anxiety in these patients is the incurable and sexual problems; as
in the study by DIKICI et al. in 2014, a positive correlation between anxiety and sexual dysfunction were reported in
hemodialysis patients (23). Of course, the prevalence of these disorders can be described with cultural and social
issues.
On the other hand, mental disorders are more prevalent among men compared to women because in the Iranian
culture the financial responsibility of the family is on the man and hemodialysis limits the physical activities and
doesn’t practically allow them to work physically; thus, in the resulting financial dependence men show more
mental disorders.
This study showed that there is a statistically significant inverse relationship between depression, anxiety, stress, and
dialysis adequacy (KT/V and URR), those who have more dialysis adequacy experience less depression, anxiety and
stress. This is consistent with finding of Hashemi et al. that was conducted on 42 patients undergoing dialysis (20).
In the study by Hosseini et al. in 2003, a significant relationship between depression and anxiety with some effective
markers of dialysis adequacy such as blood pressure, weight and creatinine concentrations was shown (22). This
result could be due to the direct effect of small molecules such as ammonia and urea and calcium in nerve transfer.
However, this argument is only a theory but it is incredibly controversial and needs further research in this field.
The study also did not show a significant association between emotional protests with disease, while in a study of
Hosseini et al., patients with diabetes and hepatitis C had significantly more anxiety and stress (22). This can happen
because of certain mental circumstances of the patients.
This study showed no statistically significant relationship between age and sex with dialysis adequacy. In a study by
Abbas et al. there was no statistically significant difference between dialysis adequacy of men and women (11).
While in some other studies dialysis adequacy of men has been reported lower than women (24, 25). This could be
due to physiological and psychological differences between men and women.
Our research findings did not show a significant relationship between anxiety, stress and depression with age and
sex of the subjects. In the study of Sanavi et al. also no significant relationship between age and sex with depression
was found; that is consistent with our study (4). While Ahmadzadeh et al. conducted a study in 2011 in Isfahan and
found that behavioral disorders increase with age (26). This could be due to the particular situation of the elderly
when faced to this disease, and also the fact that these people are touchier compared to the others.
Conclusion
Based on the results obtained in this study, dialysis adequacy in this center less than the standard rate. Therefore, it
is recommended that the adequacy of hemodialysis for the patients is continually evaluated and try to improve it.
It was also found that anxiety, stress and depression in these patients are very high as a result, implies the need for
psychiatrists or psychologists in dialysis centers. Although in this study the relationship between stress, anxiety and

Annals of Tropical Medicine & Public Health-Special Issue Mar 2018 Vol V
S212-18
depression with dialysis adequacy was significant, but the need for further research in this area is felt. Therefore, it
is suggested to other researchers to study about other factors affecting the adequacy of dialysis.
Acknowledgments
This article is extracted from approved project of Dezful University of Medical Sciences and ethical number
DURS116. The researchers are bound to express the utmost thanks and appreciation for financial and moral support
from Dezful University of Medical Sciences, the entire patients and personnel and management of the hemodialysis
Centre of Dr. Ganjavian Hospital of Dezful and all those who helped us in conducting this research project, as well
as Mr. Ehsan Bahrampour for statistical advice.
References
1- Bautovich A, Katz I, Smith M, K Loo C, B Harvey S. Depression and chronic kidney disease: A review for clinicians.
Australian & New Zealand Journal of Psychiatry 2014; 48(6):530–541.
2- Cantekin I, Tan M. The Influence of Music Therapy on Perceived Stressors and Anxiety Levels of Hemodialysis Patients.
Renal Failure 2013; 35(1): 105–109.
3- Hui Juan Ng, Wei Jie Tan, Nandakumar Mooppil, Stanton Newman, Konstadina Griva. Prevalence and patterns of
depression and anxiety in hemodialysis patients: A 12-month prospective study on incident and prevalent populations.
British Journal of Health Psychology 2015; 20:374–395
4- Sanavi S, Afshar R. Depression in patients undergoing conventional maintenance hemodialysis: The disease effects on
dialysis adequacy. Dial Traspl. 2012;33(1):13-16.
5- Stachera Stasiak C, Singh Bazan K, Stoeberl Kuss R, Fatima Menegat Schuinski A, Baroni G. Prevalence of anxiety and
depression and its comorbidities in patients with chronic kidney disease on hemodialysis and peritoneal dialysis. J Bras
Nefrol 2014;36(3):325-331.
6- Heng-Jung Hsu, Chiung-Hui Yen, Chih-Ken Chen, I-Wen Wu, Chin-Chan Lee, Chiao-Yin Sun, et al. Association between
uremic toxins and depression in patients with chronic kidney disease undergoing maintenance hemodialysis. General
Hospital Psychiatry 2013; 35:23–27.
7- Hedayati SS, Yalamanchili V, Finkelstein FO. A practical approach to the treatment of depression in patients with chronic
kidney disease and end stage renal disease. Kidney Int 2012; 81:247-55.
8- Cukor D, Ver Halen N, Fruchter Y. Anxiety and quality of life in ESRD. Seminars in Dialysis 2013; 26: 265–268.
9- Kimmel P, Peterson R, Weihs K, simmens S, Boyle F, Verne D, et al. Multiple measurement of depression predict
mortality in a longitudinal study of chronic hemodialysis out pationts. Kidney International 2000; 5 (10): 2093-2098.
10- Jae Heon Kim, Seung Whan Doo, Won Jae Yang, Soon Hyo Kwon, Eun Seop Song, Hong Jun Lee. Association between the
hemodialysis adequacy and sexual dysfunction in chronic renal failure: a preliminary study. BMC Urology 2014;4:1-6.
11- Adas H, Al-Ramahi R, Jaradat N, Badran R. Assessment of Adequacy of Hemodialysis Dose at a Palestinian Hospital.
Saudi J Kidney Dis Transpl 2014;25(2):438-442.
12- Daugirdas JT, Depner TA, Greene T, Kuhlmann MK, Levin NW, Chertow GM, et al. Surface-area-normalized Kt/V: a
method of rescaling dialysis dose to body surface area-implications for different-size patients by gender. Semin Dial.
2008; 21(5):415-421.
13- The National Kidney Foundation Disease Outcomes Quality Initiative (KDOQI) guidelines: Clinical Practice Guidelines and
Clinical Practice Recommendations 2006 Updates. 2006. Available from: http://www.kidney.org/
professionals/KDOQI/guideline_upHD_PD_V A/hd_guide4.htm [Last accessed on January 2013].
14- Couchoud C, Kooman J, Finne P, et al. From registry data collection to international comparisons: Examples of
haemodialysis duration and frequency. Nephrol Dial Transplant 2009; 24:217-24.
15- Cassem NH, General hospital psychiatry, 3th ed. Missouri Mosby Inc 1994:401-70.
16- Harrison TR, Kasper DL, Harrisons principles of internal medicine,16 ed .New yourk :MC Graw-hill;2005. 17- Chenault L. The DASS-21 system of diagnostic depression, stress and anxiety. Aust J Psychol. 2008; 2(1):435-8.
18- Henry JD, Crawford JR. The short form version of the Depression Anxiety Stress Scales (DASS-21): Construct validity and
normative data in a large non-clinical sample. British Journal of Clinical Psychology. 2005; 44 (2), 227-239.
19- Rahimi A, Ahamadi F, Gholiaf M. Effects of applying Continuous Care Model (CCM) on stress, anxiety and depression in
hemodialysis patients. J Shahid Beheshti Univ Med Sci 2007;4(30):353-9 [in Persian].
20- Hashemi M, Garshad A, Mirzaei SH, Kazemi F. Relationship between adequacy of dialysis and Depression hemodialysis
patients in Imam Khomeini Hospital (RAH) Shirvan city. Journal of North Khorasan University of Medical Sciences
2013;5(4):861-866[ inPersian].

Annals of Tropical Medicine & Public Health-Special Issue Mar 2018 Vol V
S S212-18
21- Greenwood SA, Lindup H, Taylor K, et al. (2012) Evaluation of a pragmatic exercise rehabilitation programme in chronic
kidney disease. Nephrology, Dialysis, Transplantation 2012; 27(3):126–134.
22- Sqalli-Houssaini T, Ramouz I, Fahi Z, Tahiri A, Zahra Sekkat F, Ouzeddoun N, et al. Effects of anxiety and depression on
haemodialysis adequacy. Nephrology Transplantation 2005; 1:31-37.
23- DIKICI S, BAHADIR A, BALTACI D, ANKARALI H, EROGLU M, ERCAN N, et al. Association of anxiety, sleepiness, and sexual
dysfunction with restless legs syndrome in hemodialysis patients. Hemodialysis International 2014; 18:809–818.
24- Stankuvienė A, Ziginskienė E, Kuzminskis V, Bumblytė IA. Impact of hemodialysis dose and frequency on survival of
patients on chronic hemodialysis in Lithuania during 1998-2005. Medicina (Kaunas) 2010; 46:516-21.
25- Teixeira Nunes F, de Campos G, Xavier de Paula SM, et al. Dialysis adequacy and nutriational status of hemodialysis
patients. Brazil Hemodial Int 2008; 12:45-51.
26- Ahmadzadeh G, Mehdi M. The Prevalence of Depression, Anxiety and Psychosis among Hemodialysis patients in Nour
and Ali Asghar Hospitals in Isfahan. Journal of Isfahan Medical School 2012;162(29):1280-1288
Table 1: formula related to the adequacy of hemodialysis.
URR BUN1-BUN2/BUN1 BUN1=before dialysis session
BUN2=after dialysis session
KT/V -In(R -0.008*t) + (4 – 3.5R) +UF /V
-In= Negative natural logarithm
R= After dialysis BUN / pre-dialysis BUN
T= Dialysis duration in hours
UF= Weight reduction (kg) during dialysis
W= weight (kg) after dialysis
Table 2: the intensity of each subscale
Natural Mild Moderate Severe Very severe
Depression 0-4 5-6 7-10 11-13 +14
Anxiety 0-3 4-5 6-7 8-9 +10
Stress 0-7 8-9 10-12 13-16 +17

Annals of Tropical Medicine & Public Health-Special Issue Mar 2018 Vol V
S212-18
COST-EFFECTIVENESS OF SPINAL ANESTHESIA VERSUS
GENERAL ANESTHESIA IN CESAREAN SECTION
Maryam Atrebaghkar1, Effat Jahanbani
1, Kambiz Ahmadi-Angali
2, Amin Torabipour
1, 3*
1. Department of Health Services Management, School of Health, Ahvaz Jundishapur University of Medical Sciences, Ahvaz, Iran
2. epartment of Biostatistics and Epidemiology, School of Health, Ahvaz Jundishapur University of Medical Sciences, Ahvaz, Iran 3. Social Determinants of Health Research Center, Ahvaz Jundishapur University of Medical Sciences, Ahvaz, Iran *Corresponding Author: Amin Torabipour Email: [email protected] Tel: +98 61-33738269
Abstract
Introduction: Spinal anesthesia (SA) and general anesthesia (GA) are two anesthetic procedures that
used in Cesarean section surgery. Postoperative direct cost and effectiveness of each are different. The
aim of this study was to compare the cost-effectiveness between Spinal anesthesia and general
anesthesia in cesarean section.
Methods: The study included 120 patients with caesarian section. These patients divided into patients
with spinal anesthesia (n=60) and general anesthesia (n=60). Data of direct hospital costs were gathered
using medical record and hospital information system (HIS). Effectiveness of anesthesia methods was
assessed by Heidelberg questionnaire (a valid tool to assess satisfaction after Cesarean section).
Results: The average cost of spinal anesthesia was lower than that of general anesthesia (21080583 vs.
23197530 Rail; P=0.002). The costs of the surgical services and the anesthesia services were the main
costs for two methods of cesarean section. There was a significant difference between the two groups in
the costs of operating room drugs, operating room consumable goods, and the hospital beds, nursing
services, sonography (P<0.05). The effectiveness (satisfaction after the surgery) under spinal anesthesia
was more than that of general anesthesia (77.65 vs. 66.71; P=0.001). The cost effectiveness rate was
about 193505 Rails and the results of the one- way sensitivity analysis showed that a 15% increase or
decrease in the total costs of general and spinal anesthesia would not lead to a significant change in the
cost effectiveness results of two methods.
Conclusion: The present study showed that cesarean section under spinal anesthesia was more cost
effective than cesarean section under general anesthesia.
Keywords: Cesarean section, General anesthesia, Spinal anesthesia, Direct cost, Cost-Effectiveness.
INTRODUCTION
Over the past several years an increase in cesarean sections has occurred all over the world (1). In worldwide, the rate of cesarean section which was 6.7% in 1990 rose up to 19.1% in 2014, which represents a 12.4 percent growth. In Iran the rate of cesarean section has increased from 16% to 60% in 2014 (2). According to a study in Iran, cesarean section was 2 to 3 times higher than the global standard (10%-15% of total normal deliveries) (3). One of the major risks in cesarean section is anesthesia methods. Anesthesia after cesarean section is responsible for 10% of mother's mortality and it is the sixth cause of death in the United States of America (4). Based on various studies cesarean section can be done by two methods: general anesthesia and spinal anesthesia. General anesthesia is conducted using a variety of drugs, analgesics, anxiolytics and anesthetics. Spinal anesthesia and general anesthesia are common methods for cesarean section, both of which are effective and reliable for cesarean section. Spinal anesthesia is simple and low side effect method in the elective cesarean sections spinal anesthesia was used, but in emergency cases general anesthesia is a better method (5). Spinal anesthesia method

Annals of Tropical Medicine & Public Health-Special Issue Mar 2018 Vol V
S212-18
recently has gained popularity for elective cesarean section (6). In cesarean sections for patients with severe airway disorder, a history of malignant hyperthermia and severe asthma, spinal anesthesia is required (7). Cesarean section procedure with different methods of anesthesia includes deferent costs and resources. Various studies have showed that spinal anesthesia is a more cost effective method in cesarean section, hernia and cholecystectomy (8, 9).
The cost effectiveness is a useful and the most common economic technique. This type of study is very important for health managers in decision making and prioritizing the health- related programs and interventions. Cost effective analysis can be used for different kinds of health programs that have the same implications. In this kind of economic analysis, we measure the costs with monetary units and the health implications with natural health units which show the health improvements such as treated cases or decreased blood pressure.(10). There are a lot of methods to measure the effectiveness of health and medical interventions. For example, the quality of life index (QL index) is used to measure the effectiveness. In this study, we used the patient satisfaction scale to assess effectiveness of anesthesia method (11, 12, 13, 14). The aim of this study was to compare the cost-effectiveness between spinal and general anesthesia in cesarean section.
METHODS
In this is cross-sectional and cost-effectiveness study, 120 women underwent caesarian section surgery were assigned to have spinal anesthesia (SA) (n=60) or general anesthesia (GA) (n=60). These patients were hospitalized in two general hospitals (Nezam Mafi hospital and Ganjavian hospital) in Kuzestan, Iran. In this study, patients with the lack of psychological, medical and midwifery problems, age of 20 to 45 years, having prenatal care record and having second or more elective cesarean indications were included into study. Data including inpatients’ costs, out patients’ costs, and demographic characteristic of patients was collected in a 6 month period retrospectively using medical records and hospital information system (HIS). We considered only direct costs to calculate patients’ costs. We used a bottom-up approach to calculate inpatient and outpatient costs. Direct hospital costs were included drugs, anesthesia services, surgeon payment, operating room consumables materials, nursing services, sonography, radiology, pathology, diagnostic tests. The direct outpatient costs including the costs of pediatrician visit, gynecologist visit, medicine, laboratory tests, travels and so on were added to the direct costs of the patient. To measure the effectiveness of anesthesia methods, 24 hours after applying spinal anesthesia or general anesthesia, the patients were given a questionnaire designed to evaluate their satisfaction with the anesthetic services (based on Heidelberg questionnaire). Validity and reliability of tools was confirmed according to the previous studies (15,16). The two groups were asked for their opinions about the type of anesthesia they had received. This questionnaire includes 24 questions and various dimensions to assess the patient's satisfaction specifically. These dimensions include: waiting time to obtain informed consent, waiting time to visit anesthesiologist, fear of anesthesia and surgery, complications of the two kinds of anesthesia, sore throat and husky voice, having nausea and vomiting, having a sense of urgent urination and feeling cold and chill. The responses were ranked based on four- point Likert scale from 1 to 4 (High, medium, low, never). The average scores for the two patients’ groups, was considered as the effectiveness of the two methods of anesthesia. Finally, the incremental cost-effectiveness ratio (ICER) was calculated using following formula:
B essEffectivenA essEffectiven
BCost At cosICER
To reduce the computational errors and increase the accuracy of calculation, one-way sensitivity analysis was applied to determine the effect of cost changes on the results of the equation. All of the costs were counted in Rails monetary unit. Also, the costs were converted to US dollar ($) on the basis of the inflation rate of the study year.
RESULTS
The median of length of stay in general anesthesia group and spinal anesthesia group was 2 days and 3 days respectively. According to table 1, there was a significant difference between the average of the total hospitalization costs in the two patients’ groups of general anesthesia and spinal anesthesia (21344073 ±
4171828 Rail VS. 19716589 2982099 Rail; P=0.002). The highest unit cost was related to surgery services and anesthetist and surgeon fee. There was a significant difference between the two patients’ groups in the costs of operation room drugs and consumables goods, hoteling (bed day), nursing services, laboratory tests, and sonography (P<0.05).

Annals of Tropical Medicine & Public Health-Special Issue Mar 2018 Vol 6
S212-18
Table1-The average of the inpatient direct costs in the patients underwent spinal (n=60) and general anesthesia (n=60)
Unit costs General anesthesia
(Mean± SD)
Spinal anesthesia
(Mean± SD)
P-value
Operation room drugs 448155 80067 296854 55730 0.001
Operation room consumable goods 1534534 299603 1363394 140578 0.001
Drug and consumables goods of
inpatient department 1610482 743038 1368689 655849 0.06
Hoteling 3130050 2078541 2396003 989426 0.015
Baby bed 2107946 497110 2107913 715471 0.99
Baby visit 701556 180130 700700 216056 0.98
Nursing services 289758 128522 346496 94038 0.007
Laboratory test 223229 314893 111605 83620 0.009
Surgeon's share 5191340131216 5174400 0.001 0.329
Radiology 16216 82050 7312 34739 0.44
Sonography 175926 625207 12889 76819 0.04
Recovery services 93970 ± 11927 92400 ± 0.001 0.31 Other costs
458035 366975 429624 306583 0.64
Total mean cost 21344073 4171828 19716589 2982099 0.002
According to table 2, the average of surgery fee was no significant difference between the two groups (P=0.319). But the average of anesthesia fee was significant deference between the two groups (P=0.001). The mean cost of anesthesia fee in general anesthesia group was higher than spinal anesthesia group (1683200± 142955 vs. 1607760 ± 0.001).
Table2-The average of the surgery and anesthesia fee costs in the two patients groups
Service General anesthesia(n=60)
(Mean± SD)
Spinal anesthesia(n=60)
(Mean± SD)
P-Value
Surgical procedure fee 3679676 161000 3700550 35244 0.319
Anesthesia procedure fee 1683200142955 1607760 0.001 0.001
According to table 3, there wasnt a significant difference in the average of the total outpatient direct costs between the general anesthesia group and the spinal anesthesia group (P=0.05). The average of the total outpatient direct costs in general anesthesia was 1,853, 457 Rail and in spinal anesthesia it was 1,364, 264 Rails. The highest cost of outpatient treatment in the two groups was related to medicines (519783 ± 619758 Rails vs. 343350 ± 351564 Rails; P=0.05). A significant difference there was between the two patients’ groups in the costs of the gynecologist visit cost and the pediatrician visit cost, but no significant difference was found between the two patients’ groups in the cost related to the outpatient laboratory tests, outpatient’ medicines, and travel services.
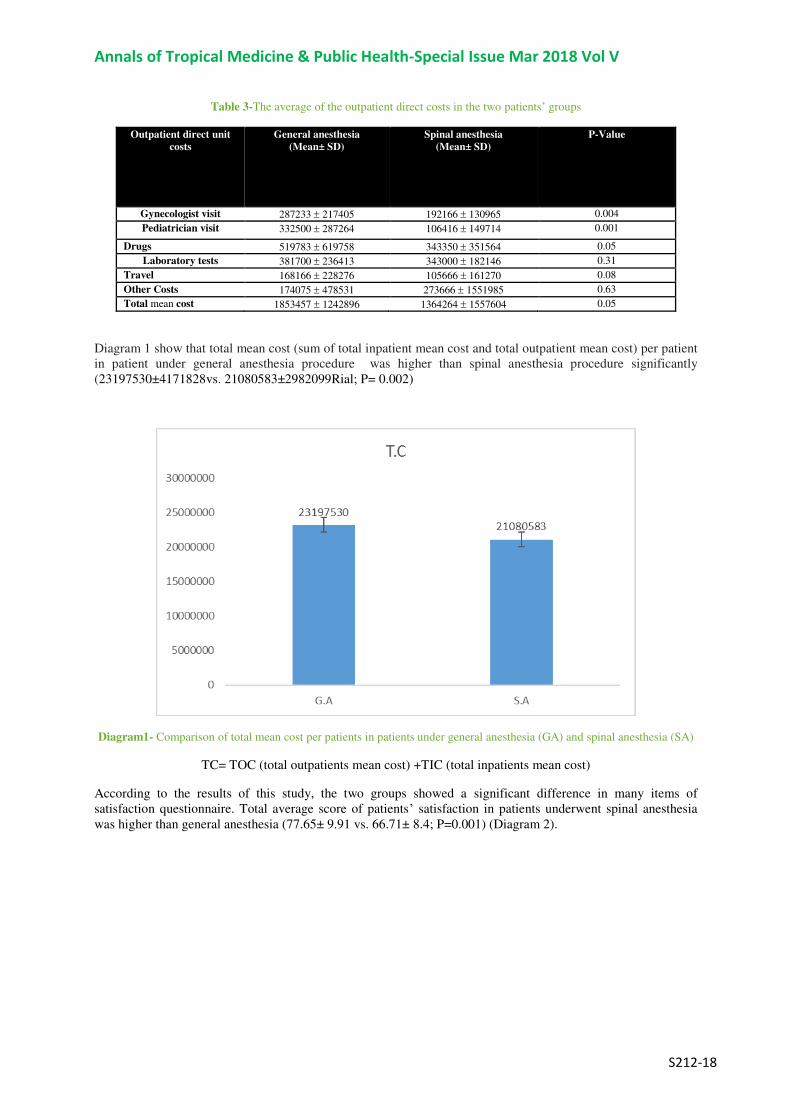
Annals of Tropical Medicine & Public Health-Special Issue Mar 2018 Vol V
S212-18
Table 3-The average of the outpatient direct costs in the two patients’ groups
Outpatient direct unit
costs
General anesthesia
(Mean± SD)
Spinal anesthesia
(Mean± SD)
P-Value
Gynecologist visit 287233 217405 192166 130965 0.004
Pediatrician visit 332500 287264 106416 149714 0.001
Drugs 519783 619758 343350 351564 0.05
Laboratory tests 381700 236413 343000 182146 0.31
Travel 168166 228276 105666 161270 0.08
Other Costs 174075 478531 273666 1551985 0.63
Total mean cost 1853457 1242896 1364264 1557604 0.05
Diagram 1 show that total mean cost (sum of total inpatient mean cost and total outpatient mean cost) per patient in patient under general anesthesia procedure was higher than spinal anesthesia procedure significantly (23197530±4171828vs. 21080583±2982099Rial; P= 0.002)
Diagram1- Comparison of total mean cost per patients in patients under general anesthesia (GA) and spinal anesthesia (SA)
TC= TOC (total outpatients mean cost) +TIC (total inpatients mean cost)
According to the results of this study, the two groups showed a significant difference in many items of satisfaction questionnaire. Total average score of patients’ satisfaction in patients underwent spinal anesthesia was higher than general anesthesia (77.65± 9.91 vs. 66.71± 8.4; P=0.001) (Diagram 2).

Annals of Tropical Medicine & Public Health-Special Issue Mar 2018 Vol 6
S212-18
Diagram 2- Comparison of the average scores of patient’s satisfaction after general anesthesia (GA) and spinal anesthesia (SA)
Cost-effectiveness ratio is the proportion of the total average cost to the average effectiveness. This proportion was 347.736for general anesthesia and 271.482 for spinal anesthesia; therefore, spinal anesthesia procedure was more cost-effective than general anesthesia after cesarean section. The incremental cost-effectiveness ratio (ICER) was about 193505. This is meaning that increase each unit of patient’s satisfaction (effectiveness) equal to193505 Rails (Table 4).
19350565.7771.66
2108058323197530
B essEffectivenA essEffectiven
B CostA CostICER
Table 4-Cost effectiveness rate and incremental cost-effectiveness ratio (IECR) of two anesthesia methods
Procedures Total cost Effectiveness C/E ICER
General anesthesia 23197530 66.71 347736 193505
Spinal anesthesia 21080583 77.65 271482
According to table 5, the results of the one-way sensitivity analysis showed that with a 15% decrease or increase in the total cost no considerable change would occur in incremental cost-effectiveness results, therefore, our calculations were not sensitive to cost variations (± %15).
Table 5- One-away sensitivity analysis according to ±15% of total cost
anesthesia Group
Original results
15% increase in
total cost
15% decrease in
total cost
Sensitivity rate
General 23197530 26677159 19717901 0.2
Spinal 21080583 24242670 17918496 0.2
ICER 193505 222530 205029 -
DISCUSSION
Economic evaluation through comparing the costs and the consequences of different health interventions provides the requisite information for prioritizing the health interventions and optimizing the allocation of

Annals of Tropical Medicine & Public Health-Special Issue Mar 2018 Vol V
S212-18
resources (17). In these studies, all costs of interventions including total outpatient and inpatient direct and indirect costs should be carefully calculated and also the effectiveness of them should be measured in a proper way (18). In current study, the cost analysis of the two anesthetic interventions showed that the average of the total inpatient direct costs (hospitalization cost) with general anesthetic was higher than spinal anesthesia, and this difference was statistically significant. Also according to the results, the average total cost of the outpatient services was higher in general anesthesia than in spinal anesthesia. Out of the direct costs of inpatient services, the costs of operating room drugs, operating room consumables goods, hospitalization, nursing services, laboratory tests, sonography and the anesthetist's share were meaningfully different between the two patients groups under anesthesia. All the unit costs in general anesthetic method (except the cost of nursing services) were more than spinal anesthetic method. Imbelloni et al. reported that the cost of the spinal anesthesia was significantly lower than that of the general anesthesia (19). Also, according to the results, most of the outpatient costs in the two anesthetic methods dedicated to the drugs. Various studies showed that the direct and indirect costs and the total cost incurred by general anesthesia were more than spinal anesthesia. Using spinal anesthetic method resulted in reducing the medical costs. Also, the patients in spinal anesthesia group needed fewer drugs to control pain after surgery and also showed that the satisfaction score in spinal anesthesia group was meaningfully higher than in general anesthesia group (20).
According to this study, the costs of the operating room drugs and consumables goods in spinal anesthesia group were less than general anesthesia group. A study showed that the total cost of spinal anesthesia was lower than general anesthesia and the medicine costs and the providers fee in spinal method were lower as well (21). In comparison with spinal anesthesia method which it was used only one type of anesthetic drug, in general anesthetic method was used more drugs. Also, spinal anesthesia include shorter anesthesia duration, decreased nausea, antiemetic and analgesic requirements, and fewer complications also in study showed that spinal anesthesia was as safe and effective as general anesthesia for patients undergoing lumbar laminectomy (22)
The median of length of stay in patients with general anesthesia and spinal anesthesia was 2 days and 3 days respectively. Neuman et al. showed that regional anesthesia was associated with a 0.6-day shorter length of stay than general anesthesia (23). A study showed that the general anesthesia was associated with slightly increased operating time and a shorter LOS in patients with a fracture of the hip (24).The result of this research showed that the amount of pain in the surgery area after operation and also the pain in the areas of the head and the back in spinal anesthesia was lower than in general anesthesia (just 18.3% of the patient with spinal anesthesia method reported pain). a study showed that the post-operative pain after spinal anesthesia was less than the pain after general anesthesia, and the patients with spinal anesthesia had shorter length of stay (25). According to the results of the present research, the rate of sore throat and coughing in general anesthesia group was more because of the endotracheal tubes used to deliver oxygen to the patients (26). Based on the present study, the incidence of nausea and vomiting was not meaningfully different in the two groups. The present study showed that the average patient’s satisfaction score of the spinal anesthesia group was significantly more than the general anesthesia group (P=0.001). Finally, Spinal anesthesia method was more cost-effective than general anesthesia after cesarean section. Mehrabi et al. reported that spinal anesthesia with combined bupivacaine and fentanyl is a safe, effective, and cost-effective method for performing PCNL in adult patients (27). Effective, low cost, and successful surgery can be performed using an effective and safe anesthesia type.
CONCLUSION
According to the results of this study, the cost of cesarean section under spinal anesthesia was less than the cost of cesarean section under general anesthesia.
Also the amount of pain in the surgery area, headache, backache and sore throat was lower in spinal anesthetic method than in general anesthetic method. Both groups had no meaningful difference in terms of nausea and vomiting after surgery. The general anesthesia group reported more respiratory problems after the operation than the spinal anesthesia group. Consequently, spinal anesthesia was a more cost-effective strategy for cesarean section surgery.
ACKNOWLEDGMENTS
This study is part of M.Sc. thesis for Maryam Atrebaghkar. This Work was financially supported by the Vice- Chancellor for research affairs of Ahvaz Jundishapur University of Medical Sciences (Ethical code: IR.AJUMS.REC.1395.704). The authors would like to thank all participants in this research.
Conflict of Interest: none declared

Annals of Tropical Medicine & Public Health-Special Issue Mar 2018 Vol 6
S212-18
REFERENCES
1. Sabet F, Shahshahan Z, Akbari M, Heshmati B. Caesarean section in Iran. The Lancet. 2016 Jul 2; 388(10039):30-29.
2. Dadipour S, Madani A, Alavi A, Roozbeh N, Moradabadi A. A Survey on the Growing Cesarean Rate in Iran and the
World: Review Article. Iranian Journal of Obstetrics, Gynecology and Infertility.2016 Sep 22;19 (27):17-8. [In Persian]
3. Moayed MS, Sohrabi Z. Do anticipate an increase in the cesarean rate has been realized? Payesh 2008; 11: 271-6. [In
Persian]
4. Jahani Shoorab N, Mirzakhani K, Hasan Zadeh M. Comparison of the side effects of general and spinal anesthesia in
cesarean section of women referring two hospitals in Torbate Heidaryyeh, Iran in 2004. J Sabzevar Univ of Med Sci
2005; 12(2): 48-54. [In Persian]
5. Foroozeshfard m, et al. choosing the type ofanesthesia for cesarean section in the first childbirth by mothers and it's
related factors in aselected hospital centres in the year 2013 Journal of midwifery and women's infertility. 2013 ;15(39)
:8-1.
6. Riley ET, Cohen SE, Macario A, Desai JB, Ratner EF. Spinal versus epidural anesthesia for cesarean section: a
comparison of time efficiency, costs, charges, and complications. Anesth Analg. 1995 Apr; 80(4):709-12
7. Akhavan Akbary Gh, Akhavan Akbary P, Kahanmoui F,Entezariasl M. comparison effect general anesthesia with
sodium thiopental and propofol versus spinal anesthesia on fetal apghar in ceasarean section .Journal of Tabriz
University of Medical Sciences. 2010; 32 (1) :11-7. [In Persian]
8. Borendal Wodlin N, Nilsson L, Carlsson P, et al. Cost-effectiveness of general anesthesia vs spinal anesthesia in fast-
track abdominal benign hysterectomy. Am J Obstet Gynecol. 2011; 205:326.e1-7. DOI:
http://dx.doi.org/10.1016/j.ajog.2011.05.043
9. Vaz FA, Abreu RA, Soárez PC, Speranzini MB, Fernandes LC, Matos D. Cost-effectiveness analysis on spinal
anesthesia versus local anesthesia plus sedation for loop colostomy closure. Arquivos de gastroenterologia. 2010
Jun;47(2):159-64. http://dx.doi.org/10.1590/S0004-28032010000200008
10. Zucco F, Ciampichini R, Lavano A, Costantini A, De Rose M, Poli P, et al. Cost‐EffectivenessandCost‐UtilityAnalysisofSpinal Cord Stimulation in Patients with Failed Back Surgery Syndrome: Results from the PRECISE Study.
Neuromodulation. 2015 Jun; 18(4):266-76; discussion 276. doi: 10.1111/ner.12292. Epub 2015 Apr 16.
11. Zahir J, Syed Sh, Jabeen N, Anjum Q, Rehman SU. Maternal and neonatal outcome after spinal versus general
anaesthesia for caesarean delivery. Ann Pak Inst Med Sci. 2011;7(3):115-8.
12. Siddiqi R, Jafri SA. Maternal satisfaction after spinal anaesthesia for cesarean deliveries. J Coll Physicians Surg Pak.
2009 Feb 1; 19(2):80-77.
13. Gholami fesharaki M, Akbari H, Akbari H, Mohammadian M. Inpatient Satisfaction and Effecting Factors: Findings
from a Large Sample Size Cross Sectional Study. hrjbaq. 2016; 1 (1) URL: http://hrjbaq.ir/article-1-24-fa.html DOI:
10.20286/hrj-010124
14. Ve Genel LD, Hasta A. Comparison of patient satisfaction and cost in spinal and general anesthesia for lumbar disc
surgery. Turk Neursurg. 2014; 24(3):384-380. DOı:10.5137/1019-5149.JTN.8575-13.0
15. Emani F, Gavanmard F, Najafi A, Atesady F, Bratlo S, Moharreri R, Khajavi M. Satisfaction of patients from anesthesia
services. Journal of Anesthesiology and Pain, 2012; 3(2): 103-97.
16. Moura AC, Ferreira MA , Barbosa J. Patient satisfaction with anesthesia care. Acta Med Port 2014 Jan-Feb;27(1):41-
33.
17. Mosadeghrad AM, Jaafaripooyan E, Zamandi M. Cost-Benefit Analysis of Health Interventions:A Critical Review.
SJSPH. 2017; 14 (4) :109-97 . URL: http://sjsph.tums.ac.ir/article-1-5453-fa.html
18. Adib Hajbagheri M, Abbasi Nia M. Evaluation of health-related quality of life in the elderly with fractures of the neck
with two instruments SF36, EG5D Nursing Research. 2010; 4(15) :79-71. [In Persian]
19. Imbelloni LE, Fornasari M, Fialho JC, Sant'Anna R, Cordeiro JA. General anesthesia versus spinal anesthesia for
laparoscopic cholecystectomy. Rev. Bras. Anestesiol. 2010 June; 60 (3): 227-217.
20. Agarwal P, Pierce J, Welch WC. Cost Analysis of Spinal Versus General Anesthesia for Lumbar Diskectomy and
Laminectomy Spine Surgery. World neurosurgery. 2016 May 31;89:266-71. DOI:
http://dx.doi.org/10.1016/j.wneu.2016.02.022
21. Chakladar A, White SM. Cost estimates of spinal versus general anaesthesia for fractured neck of femur surgery
.Anaesthesia. 2010Aug 1;65(8): 4-810.doi:10.1111/j.1365-2044.2010.06382.x
22. McLain RF, Kalfas I, Bell GR, Tetzlaff JE, Yoon HJ, Rana M. Comparison of spinal and general anesthesia in lumbar
laminectomy surgery: a case-controlled analysis of 400 patients. J Neurosurg Spine. 2005 Jan;2 (1):22-17.
23. Neuman MD, Rosenbaum PR, Ludwig JM, Zubizarreta JR, Silber JH. Anesthesia Technique, Mortality, and Length of Stay
After Hip Fracture Surgery. JAMA. 2014; 311 (24):2517–2508. doi:10.1001/jama.2014.6499.
24. Basques BA, Bohl DD, Golinvaux NS, Samuel AM, Grauer JG. General versus spinal anaesthesia for patients aged 70
years and older with a fracture of the hip. Bone Joint J. 2015 May;97 (5):689-95. doi: 10.1302/0301-620X.97B5.3504
25. Turkestani A, Ibraheim O, Khairy G, Alseif A, Khalil N, Anesth AB. Spinal versus general anesthesia for laparoscopic
cholecystectomy: A cost effectiveness and side effects study. Anaesth Pain & Intensive Care. 2009; 13 (1):14-9.

Annals of Tropical Medicine & Public Health-Special Issue Mar 2018 Vol V
S212-18
26. Bagheri H, Noorian J, Ebrahimi H, Maghsood-Taleghani Z, Atashsokhan G. Prevalence and Characteristics of Throat
Pain After General Anesthesia by Endotracheal Tube in Surgical Patients. Journal of Knowledge and Health. 2007 Oct 2;
2 (2): 6-10. [In Persian]
27. Mehrabi S, Mousavi Zadeh A, Akbartabar Toori M, Mehrabi F. General versus spinal anesthesia in percutaneous
nephrolithotomy. Urol J. 2013; 10 (1):756-61. [In Persian]
Annals of Tropical Medicine & Public Health-Special Issue Mar 2018 Vol V
S218-18
The effect of home self-care on quality of life in 1
hemodialysis patients who are referred to Bu Ali 2
educational and treatment center, Ardabil, Iran 3
Dr. Nader Aghakhani1, Soulmaz Habibzadeh Niari
2*, Dr. Rahim Baghaei
3 and Hosein Jafarizadeh4 4
1PhD in Nursing, Assistant professor, Patient Safety Research Center, Urmia University of Medical Sciences, Urmia, Iran 5 2MSc in Nursing, Patient Safety Research Center, Urmia University of Medical Sciences, Urmia, Iran* 6
3PhD in Nursing, Associate professor, Patient Safety Research Center, Urmia University of Medical Sciences, Urmia, 7 Iran 8
4MSc in Nursing, Patient Safety Research Center, Urmia University of Medical Sciences, Urmia, Iran 9 * Corresponding Author, MSc in Nursing, Patient Safety Research Center, Urmia University of Medical Sciences, Urmia, 10
Iran 11 Email: [email protected] 12
13
Abstract 14 15 Background and Goal: Due to development and complications of chronic diseases such as chronic renal 16 failure, the quality of life is often lower than normal for the patients and the complications of disease will be 17 more controllable by patient and his/ her family comprehension about the treatment process and new 18 patient education methods by nurses. This study is designed and conducted to determine the effect of self-19 care at home on the quality of life in hemodialysis patients refered to Buali educational and treatment 20 center, Ardebil in 2016. 21 Materials and Method: The present study was a quasi-experimental in which 60 male and female patients 22 were divided in two experimental and control. The statistical society of this study age range were 18 to 65 23 who refered to hemodialysis ward of Buali educational and treatment center, and at least 6 months have 24 elapsed from their first dialysis. The samples were categorized into groups with the size of 30 people. The 25 data collection tools included a questionnaire about their demographic characteristics and another 26 questionnaire about quality of life of KDQOL-SF of renal disease. Quality of life scores was recorded as a 27 pre-test, and after the intervention, quality of life questionnaire was completed again as the post-test by 28 two groups and the data were analyzed by SPSS22 software and using descriptive statistics and ANOVA 29 methods. 30 Findings: After self-training at home, all dimensions of quality of life except employment, social protection 31 and patient satisfaction were significantly increased in the experimental group (P<0.005). Also the total 32 mean of quality of life was promoted from 43.9 percent to 53.77 percent after application of self-care at 33 home training and showed significant difference (P<0.001). However this difference was not significant in 34 the control group (P<0.005). 35 Discussion and conclusion: The results show the positive effect of self-care training at home in improving 36 the quality of life for hemodialysis patients. Thus, it is possible to enhance the quality of life for these 37 patients with application of method as a new training pattern. 38
39
Introduction 40
Chronic Kidney Disease (CKD), also known as chronic renal failure, is a progressive and irreversible disorder in 41 kidney in which the body's ability to keep balances of fluids and electrolytes are disturbed and eventually leads to 42 uremia. [1] Its degree of prevalence around the world includes 242 cases per million people and annually 43 approximately 8 percent is added to this amount. [2] In Iran, the incidence of chronic renal failure included the 44 234.49 people per million people in 2000 which increased to 357.63 people per one million inhabitants in 2006. [3] 45
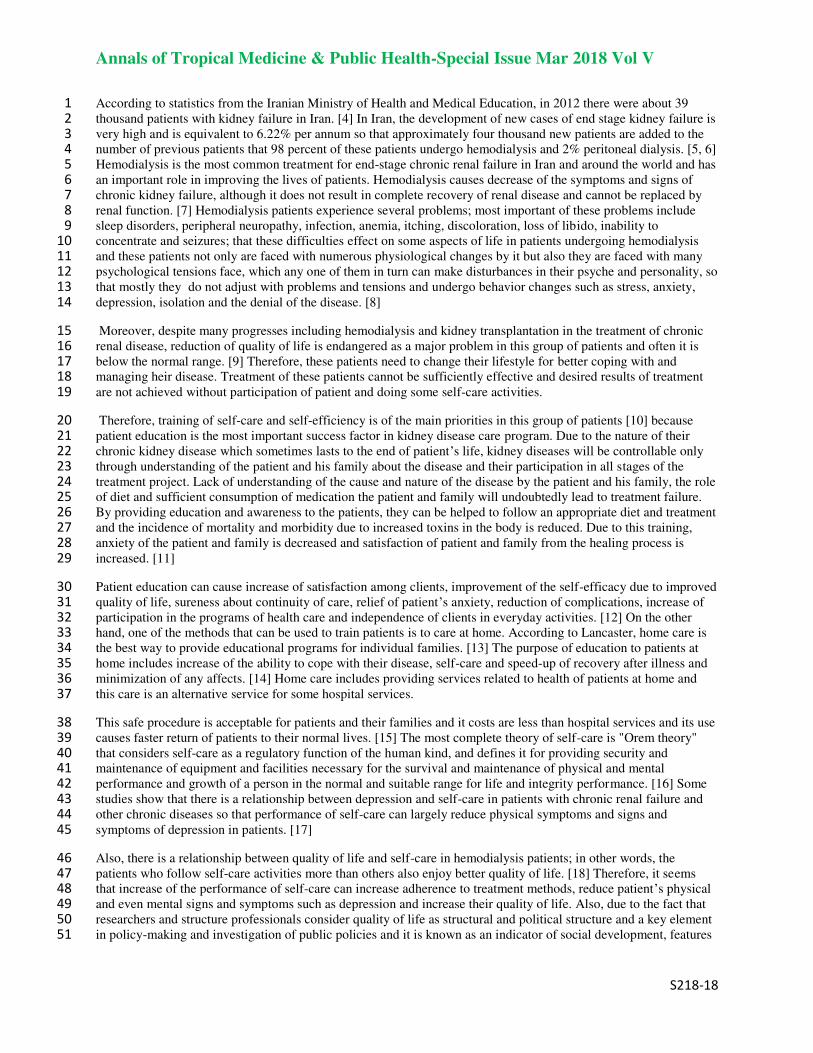
Annals of Tropical Medicine & Public Health-Special Issue Mar 2018 Vol V
S218-18
According to statistics from the Iranian Ministry of Health and Medical Education, in 2012 there were about 39 1 thousand patients with kidney failure in Iran. [4] In Iran, the development of new cases of end stage kidney failure is 2 very high and is equivalent to 6.22% per annum so that approximately four thousand new patients are added to the 3 number of previous patients that 98 percent of these patients undergo hemodialysis and 2% peritoneal dialysis. [5, 6] 4 Hemodialysis is the most common treatment for end-stage chronic renal failure in Iran and around the world and has 5 an important role in improving the lives of patients. Hemodialysis causes decrease of the symptoms and signs of 6 chronic kidney failure, although it does not result in complete recovery of renal disease and cannot be replaced by 7 renal function. [7] Hemodialysis patients experience several problems; most important of these problems include 8 sleep disorders, peripheral neuropathy, infection, anemia, itching, discoloration, loss of libido, inability to 9 concentrate and seizures; that these difficulties effect on some aspects of life in patients undergoing hemodialysis 10 and these patients not only are faced with numerous physiological changes by it but also they are faced with many 11 psychological tensions face, which any one of them in turn can make disturbances in their psyche and personality, so 12 that mostly they do not adjust with problems and tensions and undergo behavior changes such as stress, anxiety, 13 depression, isolation and the denial of the disease. [8] 14
Moreover, despite many progresses including hemodialysis and kidney transplantation in the treatment of chronic 15 renal disease, reduction of quality of life is endangered as a major problem in this group of patients and often it is 16 below the normal range. [9] Therefore, these patients need to change their lifestyle for better coping with and 17 managing heir disease. Treatment of these patients cannot be sufficiently effective and desired results of treatment 18 are not achieved without participation of patient and doing some self-care activities. 19
Therefore, training of self-care and self-efficiency is of the main priorities in this group of patients [10] because 20 patient education is the most important success factor in kidney disease care program. Due to the nature of their 21 chronic kidney disease which sometimes lasts to the end of patient’s life, kidney diseases will be controllable only 22 through understanding of the patient and his family about the disease and their participation in all stages of the 23 treatment project. Lack of understanding of the cause and nature of the disease by the patient and his family, the role 24 of diet and sufficient consumption of medication the patient and family will undoubtedly lead to treatment failure. 25 By providing education and awareness to the patients, they can be helped to follow an appropriate diet and treatment 26 and the incidence of mortality and morbidity due to increased toxins in the body is reduced. Due to this training, 27 anxiety of the patient and family is decreased and satisfaction of patient and family from the healing process is 28 increased. [11] 29
Patient education can cause increase of satisfaction among clients, improvement of the self-efficacy due to improved 30 quality of life, sureness about continuity of care, relief of patient’s anxiety, reduction of complications, increase of 31 participation in the programs of health care and independence of clients in everyday activities. [12] On the other 32 hand, one of the methods that can be used to train patients is to care at home. According to Lancaster, home care is 33 the best way to provide educational programs for individual families. [13] The purpose of education to patients at 34 home includes increase of the ability to cope with their disease, self-care and speed-up of recovery after illness and 35 minimization of any affects. [14] Home care includes providing services related to health of patients at home and 36 this care is an alternative service for some hospital services. 37
This safe procedure is acceptable for patients and their families and it costs are less than hospital services and its use 38 causes faster return of patients to their normal lives. [15] The most complete theory of self-care is "Orem theory" 39 that considers self-care as a regulatory function of the human kind, and defines it for providing security and 40 maintenance of equipment and facilities necessary for the survival and maintenance of physical and mental 41 performance and growth of a person in the normal and suitable range for life and integrity performance. [16] Some 42 studies show that there is a relationship between depression and self-care in patients with chronic renal failure and 43 other chronic diseases so that performance of self-care can largely reduce physical symptoms and signs and 44 symptoms of depression in patients. [17] 45
Also, there is a relationship between quality of life and self-care in hemodialysis patients; in other words, the 46 patients who follow self-care activities more than others also enjoy better quality of life. [18] Therefore, it seems 47 that increase of the performance of self-care can increase adherence to treatment methods, reduce patient’s physical 48 and even mental signs and symptoms such as depression and increase their quality of life. Also, due to the fact that 49 researchers and structure professionals consider quality of life as structural and political structure and a key element 50 in policy-making and investigation of public policies and it is known as an indicator of social development, features 51

Annals of Tropical Medicine & Public Health-Special Issue Mar 2018 Vol V
S218-18
of this structure such as being dynamic, multidimensional and various assumptions have caused this structure which 1 originally was used in the area of health, gradually be applied to other areas of studies. [19] 2
So, reform of quality of life not only is useful and valuable for dialysis patients but also decreases costs of health 3 and medical care associated with them. In other words, for the dialysis patients can care themselves well, they 4 should be trained sufficiently about their disease are and enhance their knowledge and skills about the disease, hence 5 the rehabilitation and support of self-care through education is the key to control dialysis patients. [20] 6
In general, given that today in medical care, management of chronic diseases is of particular importance, in this 7 context the objective of health care, is to improve quality of life so that improvement of quality of life should be 8 considered as a result of medical research. Today, patients expect greater participation in decision-making about 9 treatment, so knowing the quality of life in these patients is of particular importance, so thereby according to the 10 obtained results, appropriate planning will be conducted in order to improve the quality of life of the patient. Given 11 that different countries and WHO have suggested some programs to reduce risk factors of non-communicable 12 diseases, also in Iran it is necessary to conduct appropriate experimentals to improve lifestyles and control of risk 13 factors of non-communicable diseases. [21] 14
So the nurse as one of the most important members of the health team can lead patients to life balance through 15 probable experimentals such as training self-care programs and directly affect their quality of life. Without training 16 patients and their participation in self-care, health care can be more costly and quality of life can be largely 17 diminished. Thus, with respect to the stated subjects, the purpose of this study is preparation of and assistance to 18 patients to care themselves in order to improve the quality of life and it is not possible as long as nurses can provide 19 a trusted relationship between nurse and patient to support and train the patient and this is achieved when the patient 20 is allowed to actively participate in decision-making and planning for himself. And since most people prefer their 21 homes to hospitals, so hemodialysis patients should be followed by nurses at home to continue care and treatment 22 process and rehabilitation programs, including receiving the necessary training. According to the above, this study 23 aimed to determine the effect of training self-care at home on the quality of life in hemodialysis patients referred to 24 Ardabil bu Ali’s Therapeutic and Educational Center in 2016. 25
Research Methodology 26
This is a quasi-experimental study in which the post-test and control and experimental groups were used. Population 27 of the study included the patients with first 6 months dialysis in Ardabil bu Ali’s Therapeutic and Educational 28 Center. Volume of samples of the research included 60 patients who met the inclusion criteria and were selected 29 through convenience sampling from the target population. Of these people, 30 patients were randomly assigned to 30 the experimental group and 30 patients in the control group by the same method. In the pilot researches, minimum 31 sample size has been reported 15 persons for each group [22] that due to increase of ability to generalize the results, 32 30 people were considered for each group of. 33
Inclusion criteria included the patients who 1) with at least two or three times a week hemodialysis were at least 6 34 months under hemodialysis, 2) were able to understand and learn the presented lessons, 3) had good physical 35 condition, 4) were willing to cooperate in the study, 5) allowed presence of the researcher at their home during the 36 experimental and tutorial programs, 6) did not want to transplant kidney, 7) had never seen before formal education 37 about self-care, and 8) aged 18 to 65 years old. Also, the exclusion criteria for this study included the patient's 38 unwillingness to continue cooperation, transfer to other centers, care discontinuation due to medical reasons and 39 death of patient. Data collection tools included demographic questionnaire and short form questionnaire to consider 40 quality of life of kidney disease KDQOL-SF. This questionnaire is the most common proprietary tool to measure 41 quality of life for renal patients and for the first time it was standardized in 2012 in the United States and by Kruvar 42 and then it was standardized in other countries such as China, France, Germany, Italy, the Netherlands, Denmark, 43 Korea and Portugal and was widely tested for its validity and reliability. [23] 44
The questionnaire has 80 items in 19 dimensions and is composed of two parts. One part of the questionnaire 45 includes SF-36 which is about health in general, which includes 8 dimensions (physical functioning, limitations 46 caused by physical problems, limitations caused by emotional problems, bodily pain, general health perception, 47 social functioning, mental health, vitality, and health status compared with the previous year). The second part of the 48 questionnaire is related to the quality of life in relation to kidney disease which contains 11 dimensions (symptoms 49 and a list of problems, effect of kidney disease, burden of disease, cognitive function, quality of social relationships, 50

Annals of Tropical Medicine & Public Health-Special Issue Mar 2018 Vol V
S218-18
sexual function, sleep, social support, job performance, general state of health, patient satisfaction, and support 1 staff). Score of each dimension is from 0 to 100, that a higher score indicates better quality of life. [24] To assess the 2 reliability of the short form questionnaire of quality of life for renal patients, test-retest and intra-class correlation 3 coefficient were used. Intra-class correlation coefficient of specific aspects of the questionnaire indicated reliable 4 stability between two assessments with a ten days interval and correlation coefficients were from 0.77 for the 5 physical pain dimension to 0.92 for symptoms and problems dimension. However, the intra-class correlation 6 dimension of the general dimensions in the questionnaire ranged from 0.79 to 0.92. 7
Also, to internally measure the dimensions of the questionnaire, Cronbach's alpha was used. Cronbach's alpha 8 coefficient for the specific dimensions of the questionnaire ranged from 0.71 for the working conditions dimension 9 to 0.96 for sexual function dimension. Cronbach's alpha for the general aspects of the questionnaire, ranged from 10 0.73 for freshness and vitality to 0.93 for the physical function. [25] In the present study, data were collected in two 11 phases. In the first stage, the relevant tests conducted in both groups as pre-test, and after collecting the 12 questionnaires, the experimental group received home education for their rehabilitation. That is, one day after 13 dialysis of patients in the hospital because of having appropriate mental preparation and physical strength to receive 14 content, by prior arrangement it was referred to patients’ homes to educate them. 15
The training was conducted for 4 sessions based on educational needs. Training sessions lasted almost one-hour 16 twice a week. Educational contents were based on the needs assessment, including diet, daily body weight control, 17 proper use of medications, adapting to new conditions of life and care of fistula etc. At the same time, the manual 18 was given to them. But the control group was not given any training and the control group received only routine 19 training of the unit. The second phase of research was for experimental group one month after the last training 20 session at home, during which for the second time patients were tested with the questionnaire of quality of life of 21 kidney patients. The control group was re-evaluated with the same forms in the hemodialysis units. Also for the 22 benefit of the control group, after the completion of the study, they also were provided training manual. After data 23 collection, statistical analysis was performed using SPSS version 22. T-tests were used to compare the properties of 24 participants in two groups. Statistical analysis was performed based on the objectives of the study so that to compare 25 of average score of investigation of quality of life for hemodialysis patients and investigation of its dimensions, 26 ANCOVA analysis of covariance was used. 27
Findings 28 In this study, of the 60 considered patients, 30 patients were placed in the experimental group and 30 patients in the 29 control group randomly, that the results descriptive statistics of demographic variables are as follows. 30
Table 1 Mean and standard deviation of quantitative demographic variables separated in experimental and control groups
Variable
Mean of control group average of
rating
Mean of experimental group Average of
rating P-value
mean Standard
deviation mean
Standard
deviation
Number of children 3.9697 2.1 - 3.133 2.17 - 0.138
Disease duration 3.6 2.55 - 4.62 2.85 - 0.153
Dialysis duration 3.733 0.28 30.78 3.55 0.87 30.22 0.887
Previous weight 77.3 10.69 32.55 74.73 9.88 28.45 0.363
Next weight 73.8 10.32 4.22 34.007 28.62 18.8 0.0001
Result of creatine 12.35 2.26 25.2 40.904 33.32 35.8 0.019
Result of hemoglobin 1.603 4.17 17.6 46.246 30.31 34.4 0.0001
Dialysis history 3.6 2.55 21.85 39.762 30.46 39.15 0.0001
Disease history 0.467 0.57 18.38 38.43 29.72 42.62 0.0001
According to the results of the t-tests and Mann-Whitney tests, among the evaluated variables, next weight, result of
creatine, result of hemoglobin, dialysis and dialysis history were not the same in the two groups. Therefore, in this
study, the response variable analyses should be analyzed by considering the effect of confounding these variables.
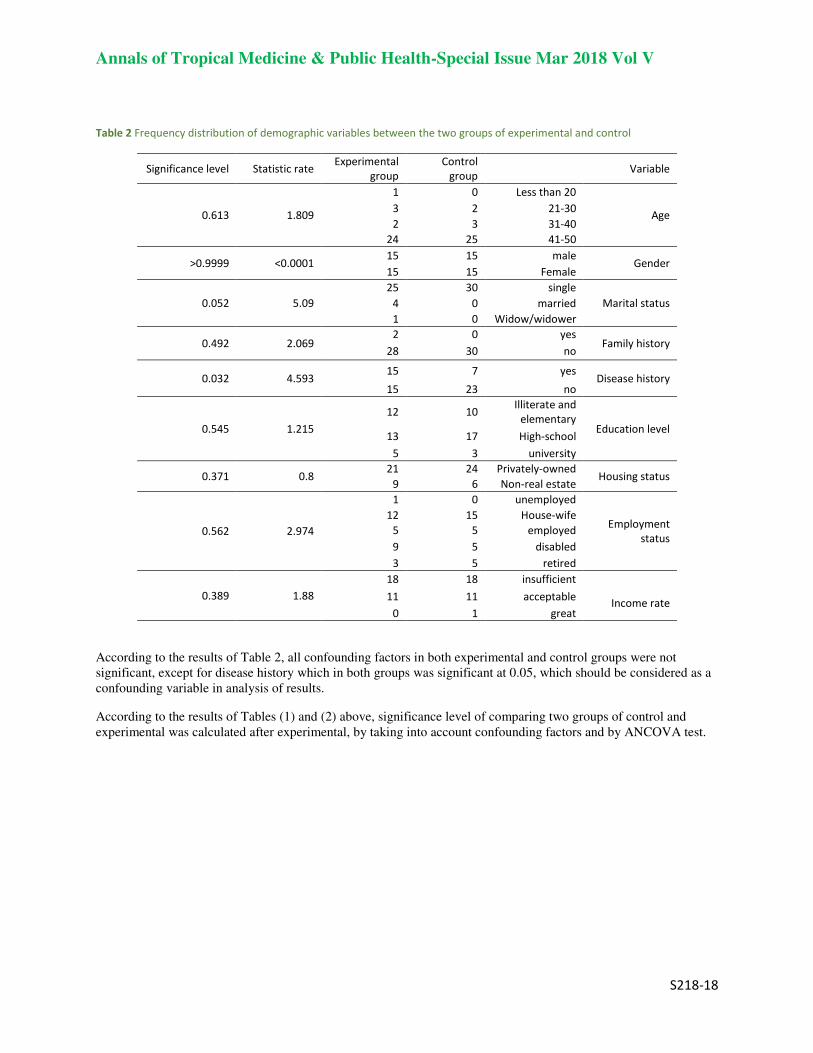
Annals of Tropical Medicine & Public Health-Special Issue Mar 2018 Vol V
S218-18
Table 2 Frequency distribution of demographic variables between the two groups of experimental and control
Variable Control
group Experimental
group Statistic rate Significance level
Age
Less than 20 0 1
1.809 0.613 21-30 2 3 31-40 3 2 41-50 25 24
Gender male 15 15
0.0001> 0.9999< Female 15 15
Marital status single 30 25
5.09 0.052 married 0 4 Widow/widower 0 1
Family history yes 0 2
2.069 0.492 no 30 28
Disease history yes 7 15
4.593 0.032 no 23 15
Education level
Illiterate and
elementary 10 12 1.215 0.545
High-school 17 13 university 3 5
Housing status Privately-owned 24 21
0.8 0.371 Non-real estate 6 9
Employment
status
unemployed 0 1
2.974 0.562 House-wife 15 12
employed 5 5 disabled 5 9
retired 5 3
Income rate
insufficient 18 18 1.88 0.389 acceptable 11 11
great 1 0
According to the results of Table 2, all confounding factors in both experimental and control groups were not
significant, except for disease history which in both groups was significant at 0.05, which should be considered as a
confounding variable in analysis of results.
According to the results of Tables (1) and (2) above, significance level of comparing two groups of control and
experimental was calculated after experimental, by taking into account confounding factors and by ANCOVA test.

Annals of Tropical Medicine & Public Health-Special Issue Mar 2018 Vol V
S218-18
Table 3 Mean and standard deviation of score of disease symptoms between the two groups of experimental and control
Component group Before experimental After experimental
P-value Mean Standard deviation mean Standard deviation
Symptoms of disease experimental 65.55 17.22 68.13 15.28 0.0001
control 57.46 19.84 63.95 17.07 0.037 P-value P-value =0.097 P-value ANCOVA =0.044
Effect of disease experimental 48.11 19.75 59.6 16.57 0.0001
control 53.82 22.82 53.63 20.33 0.943 P-value P-value =305 P-value ANCOVA =0.908
Burden of disease experimental 30.62 23.46 42.29 18.03 0.0001
control 42.5 21.98 41.04 22.72 0.335 P-value P-value =0.048 P-value ANCOVA =0.262
Job status experimental 10 3.3 7.5 2.97 0.083
control 13.33 3.11 12.5 3.12 0.326 P-value P-value =0.466 P-value ANCOVA =0.753
Cognitive function and quality
of social relations
experimental 48.9 18.93 58.91 14.62 0.0001 control 66.77 20.96 64.88 21.29 0.0001 P-value P-value =0.001 P-value ANCOVA =0.292
Sexual function experimental 31.71 6.83 42.5 6.946 0.002
control 55.72 6.92 42.11 6.947 0.005 P-value P-value =0.017 P-value ANCOVA =0.06
Function of sleep experimental 59.72 17.38 67.44 13.3 0.0001
Control 63.16 25.11 62.15 25.11 0.052 P-value P-value =0.539 P-value ANCOVA =0.277
Social support experimental 70.21 23.82 70.05 29.65 0.839
control 75.18 21.47 74.85 21.43 0.326 P-value P-value =0.4 P-value ANCOVA =0.594
Patient’s satisfaction with life experimental 58.7 24.94 75 57.66 0.16
control 66.83 21.51 69.96 22.44 0.161 P-value P-value =0.182 P-value ANCOVA =0.992
General health experimental 42.82 17.83 55.48 15.22 0.0001
control 50.56 21.97 48.27 21.41 0.0001 P-value P-value =0.139 P-value ANCOVA =0.0001
Especial health experimental 44.75 16.47 52.42 13.49 0.0001
control 53.53 17.13 50.7 17.32 0.0001 P-value P-value =0.048 P-value ANCOVA =0.023
Total score experimental 43.9 16.37 53.77 13.35 0.0001
control 52.22 18.82 49.63 18.71 0.0001 P-value P-value =0.073 P-value ANCOVA =0.0001
According to the results obtained from table 3, difference of mean of the disease symptoms score is not significant
between the two groups of experimental and control before the experimental while this difference is significant
between the two groups after experimental. Also, the difference between before and after experimental in two
experimental and control groups is reported significant. The percentage of changes in the experimental group is 3.93
percent, while the percentage of changes for the control group is 11.29 percent. Also, mean difference of the score of
kidney disease on the lives of patients between the two groups of experimental and control before the experimental
is not significant. And also this difference between the two groups after the experimental is not significant. Also the
difference before and after experimental in experimental group is significant whereas in the control group it is not
reported significant.
Results about burden of kidney disease is in this way that the mean difference of burden of kidney disease score
between the two groups of experimental and control before the experimental is significant and this difference is not
Annals of Tropical Medicine & Public Health-Special Issue Mar 2018 Vol V
S218-18
significant between the two groups after the experimental. Also, the difference is not significant before and after
experimental in experimental group while in the control group it is reported significant. About job status results
showed that the mean difference of employment status score between the two groups of experimental and control
before the experimental is not significant and this difference after the experimental between the two groups is not
significant, as well. Also, before and after experimental in control group the difference is not significant and in the
experimental group it is reported insignificant. About cognitive function and social relationships quality, results
suggest that the mean difference in cognitive function and quality of social relations between the two groups of
experimental and control before the experimental is significant while this difference is not significant between the
two groups after the experimental. Also the difference is reported significant before and after the experimental
between two groups of control and experimental. Percentage of changes in the experimental group increases to
20.47% while the percentage of changes decreases to 2.83% for the control group that shows more changes due to
experimental in the experimental group.
Also the mean difference in sexual function between the two groups of experimental and control before the
experimental is significant while this difference is not significant between the two groups after the experimental.
The difference before and after the experimental in two control and experimental groups is reported significant and
percentage of changes in the experimental group increases to 34.03% while the percentage of changes decreases to
24.42% in control group. This shows more changes due to experimental in the experimental group. Results about
sleep function reflects that according to the results obtained from the tables above, mean difference of sleep function
score between the two groups of experimental and control before the experimental is not significant and this
difference between the two groups after the experimental is not significant, as well. Also, the difference before and
after the experimental in control group is not significant while in the experimental group is reported significant. Also
mean difference of the score of social support between two experimental and control group before experimental is
not significant and also this difference after experimental between the two groups is not significant again. Also, after
and before experimental in the control group the difference is not significant and in the experimental group is
reported insignificant, too.
On the other hand, mean and standard deviation of satisfaction of patient with life indicates that mean difference of
the score of patient’s satisfaction with life is not significant between two groups of experimental and control before
experimental and it is not significant again after experimental between the two groups. Also, the difference is
insignificant before and after experimental in control group and is not reported significant in experimental group.
Also, results concerning the component of general health reflect that mean difference of general health score
between two experimental and control groups is not significant before the experimental whereas this difference has
become significant after experimental between the two groups. Also the difference is reported significant before and
after experimental in two control and experimental groups. In experimental group, percentage of changes increases
29.56% while in the control group it decreases to 4.53%.
Results indicate that more changes were because of experimental in the experimental group. Also, based on the
results obtained from Table 3, difference of mean for special health score is significant between the two groups of
experimental and control before experimental and this difference is significance again after experimental. Also, the
difference is reported significant before and after experimental in two experimental and control groups. In
experimental group, percentage of changes increases to 17.14% while in control group it decreases to 5.29% that
shows more changes due to experimental in experimental group. Finally, the results regarding mean and standard
deviation of the total score in both experimental and control groups indicates that the mean difference of the total
health score is not significant between two groups of experimental and control before experimental while it becomes
significant after experimental between the two groups. Also, the difference is reported significant after and before
the experimental in two experimental and control groups. In experimental group, percentage of changes increases to
22.48% while in control group it decreases to 4.96% which indicates more changes due to experimental in the
experimental group.
Discussion
Given that hemodialysis patients experience multiple problems, the most important problems include sleep
disorders, peripheral neuropathy, infection, anemia, itching, discoloration, loss of libido, inability to concentrate and
seizures. These problems affect the different dimensions of life quality of hemodialysis patients, and it causes not
only these patients face with multiple physiological changes but also they face with many psychological stresses
Annals of Tropical Medicine & Public Health-Special Issue Mar 2018 Vol V
S218-18
which each of them, in turn, can cause mental or personality disorders in them so that often they are not compatible
with the problems and tensions and suffer from behavioral changes such as stress, anxiety, depression, isolation, and
denial of diseases. Hence, teaching self-care strategies can have a significant impact on empowering them because
empowerment is considered a functional strategy in health.
The results showed that there is not a significant difference between the two experimental and control groups in
terms of demographic variables such as age, marital status, family history, medical history, education level, housing,
employment status and income rate; in other words, the two groups were homogenous in terms of the mentioned
variables. In the study of Taheri and his colleagues (1392), which examines the quality of life for hemodialysis
patients, it was reported that there is a positive and significant relationship between level of education and quality of
life (P = 0.003) and between the income and quality of life (P = 0.0001). [26]
Also Payab and his colleagues’ (1394) study to investigate the relationship between quality of life for dialysis
patients and individual characteristics of patients referred to dialysis unit of Golpaygani Hospital in city of Qom in
1394, it was reported that there is not a significant correlation between education level and income with their quality
of life, so this result is consistent with the results of this study. [27]
The results showed that overall mean of quality of life in this study increased which this indicates use of self-care
education at home has a positive effect. But in other countries, scores of quality of life in hemodialysis patients are
higher than in our study. For example, in the study conducted by Levendoglu in Turkey, total average of scores of
life quality in hemodialysis patients was 65.75% after utilizing self-care pattern by using SF-46 scale that compared
to the patients of the present study it is high. [28] These findings compared with Fujisawa (2000), in which the total
average of quality of life of the patients undergoing hemodialysis was 68.38 percent, shows that the overall average
of quality of life in Iran is low. [29]
In this study, except for the dimensions of "job status, social support, patient’s satisfaction with life", there was not a
significant difference in other dimensions, and the results generally indicate improvement of quality of life in
patients after training. In other words, it can be stated that training self-care programs in the home increases the
quality of life in hemodialysis patients. This result is consistent with previous studies. For example, Narimani (1387)
investigated the effect of training self-care on quality of life in hemodialysis patients and reported that due to the
significant level it can be said that there is a meaningful relationship between mean of quality of life before and after
training and awareness level in relation to self-care care before and after training. [30]
Narvayi and his colleagues (1389) in their study considered the effect of applying the self-care model on quality of
life in hemodialysis patients and reported that after the implementation of self-care pattern, all aspects of quality of
life re significantly enhanced. Also, the total mean of quality enhanced from 46.90% to 56.65% after application of
the self-care model and showed a significant difference. [31]
One of the motivations for conducting this research is using its results to improve the quality of patients and clients.
And given that nurses are the most important and influential people in health staff, they are able to use the results of
the present study to improve care services. Thus, the findings of this study could be used in the field of nursing,
especially nursing hemodialysis patients because nurses with respect to their education can have the most influence
on the level of self-care capability in the patients with chronic renal failure.
Finally, according to the findings of this study, it is suggested that the experimental done in a longer time and
investigation of quality of life of the hemodialysis patients is implemented in two time periods; meaning firstly
immediately after experimental and then in a time period with much distance. Also, it is recommended that this
research will be performed in other cities and hospitals to increase the power of generalizing its results.

Annals of Tropical Medicine & Public Health-Special Issue Mar 2018 Vol V
S218-18
Reference
1- Plantinga LC, Tuot DS, Powe, NR. Awareness of chronic kidney disease among patients and providers. Adv Chronic Kidney Dis.
2010; 17(3): 225-236.
2- Jha V1, Garcia-Garcia G, Iseki K, Li Z, Naicker S, Plattner B, Saran R, Wang AY, Yang CW. Chronic kidney disease: global
dimension and perspectives. Lancet. 2013 ;1 (20); 382: 260-72.
3- Arefzade A, Lesan M, Seyfi S, Khatami M. The cost of hemodialysis in Iran. Saudi J kidney dis transpl 2009; 20(2): 307-11.
4- Habibzadeh H, Davarpanah M, Kalkhali H. Effect of Self Care Orem Model on self-efficacy of hemodialysis patients in hospital
of Urmia. J of Nurs and Midw Urmia Univ Medi Sci. 2012; 10(2): 190- 90
5- Mohammadi Z. Comparative of bolus and infusion of heparin on coagulation in set of hemodialysis. [Dissertation].
Kermanshah: Kermanshah University Medical Science. 2012;11(3):22-31.
6- Fatemeh R, Farhad R B, Nikzad F. A survey of the Impact of using Orem self-care model on Adequacy of dialysis in
Hemodialysis Patients. Bull. Env.Pharmacol. Life Sci. 2015; 4(4). 19-23.
7- Griva K, Goh C, , Kang W, Chan, M. Quality of life and emotional distress in patients and burden in caregivers: a comparison
between assisted peritoneal dialysis and self-care peritoneal dialysis. Quality of Life Research. 2016; 25(2): 373-384.
8- Helou N, Talhouedec D, Shaha, M, Zanchi, A. The impact of a multidisciplinary self-care management program on quality of
life, self-care, adherence to anti-hypertensive therapy, glycemic control, and renal function in diabetic kidney disease: A Cross-
over Study Protocol. BMC nephrology. 2016;17 (1): 88-96.
9- Naroii S, Naji S. The effect of Applying Orem Self Care Model (Orem) on the quality of life for hemodialysis patients. Journal
of Research in Medical Sciences Zahedan, 2010;14 (1): 8-12.
10- Cowen PS, Moorhead S. Current issues in nursing. 7thEd. Edinburgh: Elsevier Mosby. 2006;8(3):240-255.
11- Khorami A, Saheli S, Sakhaei SH, Khalkhali HR. Assessment the effect of family centered care educational program on home
care knowledge among care givers of patients with chronic renal failure under hemodialysis. The journal of urmia nursing and
midwifery faculty. 2015; 13(5):500-512.
12- Mardanian A, Salahshorian J, Mohammad Alayha F. Nurse’s perception of patient teaching, Enhancingand inhibiting IJN.
2005; 17 (40):18-27. (Persian)
13- Stanhope Marcia. Lancaster Jeanette. Public Health Nursing. Populatio-Centered Health Care in the community. Mosby,
2008.
14- Saberian M. Planning principles for patient education. Tehran: Human, 2007. (Persian)
15- Isenberg KB, Trisolini M. Information needs and roles for family members of dialysis patients. Dialysis transplantation 2008;
37(2):50-57.
16- Seica A, Segall L, Verzan C. Factors affecting the quality of life of hemodialysis patients from Romania: A multicenter study.
Nephrol Dial Transplant; 2009: 24(2): 626-639.
17- Rahimi F, Gharib A, Beyramijam M, Naseri O. Effect of self-care education on self-efficacy in patients undergoing
hemodialysis. 2014;11 (1): 136-40.
18- Delaney C, A postolidis B, Bartos S, Morrison H, Smith L, Fortinsky R. A randomized trial of telemonitoring and self-care
education in heart failure patients following home care discharge. Home Health Care Management & Practice.2013;25 (5): 187-
195.
19- Iyasere O, Brown E, Johansson L, Huson L, Smee J, Maxwell A, Davenport A. Quality of life and physical function in older
patients on dialysis a comparison of assisted peritoneal dialysis with hemodialysis. Clinical Journal of the American Society of
Nephrology. 2015; 15(2):57-69.
20- Golper, T, Mehrotra, R, Schreiber M. Is Dorothy correct? The role of patient education in promoting home dialysis.
InSeminars in dialysis ، 2013 ;26 (2): 138-142.
21- Ardena GJ, Paz-Pacheco E, Jimeno CA, Lantion-Ang FL, Paterno E, Juban N. Knowledge community- based diabetes self-
management education program in san juan, tangas, Philippines diabetes res clin pract. 2010;20 (6):87-93.
22- Delavar A. advanced research methods. 2007; publications of Science and Research. (Persian)
23- Korevaar JC, Merkus MP, Jansen MA, Dekker FW, Boeschoten EW, Krediet RT. Validation of the KDQOL-SF: a dialysis-
targeted health measure. Qual Life Res 2002; 11(5): 437-47.
24- Fardinmehr O, Farajzadegan Z, Emami A, Mortazavi M, Gholamrezaei A. The validity and reliability of the Persian of kidney
disease quality of life questionnaire short form in Iranian patients. Journal of Isfahan medical school. 2012; 1(29):165. (Persian)
25- Akyol AD, Cetinkaya Y, Bakan G, Yarali S, Akkus S. Self-care agency and factors related to this agency among patient with
hypertention. Journal of clinical nursing. 2007; 16(4):87-679.
26- Tahery N, Kamangar S, Cheraghian B, Mousavi S, Solaimanzadeh, M. Life Quality of Hemodialysis Patients, Knowledge &
Health 2013;8(3):119-124. (Persian)
Annals of Tropical Medicine & Public Health-Special Issue Mar 2018 Vol V
S218-18
27- Payabm Kh, Nevisizadeh F, Aghazadeh F, Bagheri Z, Azizi M. Examine the relationship between demographic characteristics
of quality of life for dialysis patients in dialysis patients referred to the hospital in the city of Qom Gulpaigani. Shahrekord
University of Medical Sciences Journal 2014; 9(4):67-74. (Persian)
28- Levendoglu F, Altintepe L, Okudan N, et al. A twelve week exercise program improves the psychological atatus, Quality of
life and work capacity in hemodialysis patient. J Nephrol 2004; 17(6): 826-832.
29- Fujisawa M, Ichikawa Y, Yoshiya K, et al. Assessment of health-related quality of life in renal transplants using the SF-36
health survey. J Urol 2000; 26(2): 210-6.
30- Narimani K. A Study of the Effect of Self-Care Training on the Hemodialysis Patients’ Quality of Life . daneshvarmed. 2009;
16 (79): 63-70.
31- Naroie S, Naji SA, Abdeyazdan GH, Dadkani E. Effect of applying selfcare Orem model on quality of life in the patient under
hemodialysis. Zahedan J Res Med Sci
(ZJRMS) 2012; 14(1): 8-12.

Annals of Tropical Medicine & Public Health-Special Issue Mar 2018 Vol V
S214-18
The Prevalence of Depression and Some Related Factors in 1
Caregivers of Patients with Bipolar Disorder 2
Zarei F1,Darvishi Z
2, Pendar R
3,kazemi N
4, Mashalchi H
5,Ahmadi Mazhin S
6,Mehranfard SH
7, 3
Aghababaeian HR8, Bosak S
9* 4
1,2Bsc of nursing. EMS center of Dezful. Dezful University of Medical Sciences, Dezful, Iran. 5 3MSc of psychiatric nursing, Academic member, Research center for non-communicable diseases. Jahrom University of 6
Medical Sciences. Jahrom. Iran. 7 4,5,6,7,8MSc of nursing, Academic member , Faculty of nursing . Dezful University of Medical Sciences, Dezful, Iran. 8 9Correspondence: MSc of psychiatric nursing, Academic member and Research manager, Faculty of nursing. Dezful 9
University of Medical Sciences, Dezful, Iran. 10 11
*Corresponding Author Email: [email protected] 12
Abstract 13 14 Introduction: The presence of a sick person in the family usually results in depression in family members. 15 The present study was conducted to determine the prevalence of depression and some of its determinants 16 in the caregivers of patients with bipolar disorder. 17 Materials and Methods: In this cross-sectional descriptive analytical study, 45 caregivers of bipolar patients 18 were recruited via random sampling. The participants completed the Beck Depression Inventory and a 19 demographic questionnaire. Descriptive statistics were obtained and data were analyzed using Pearson's 20 correlation, coefficient, ANOVA, and Duncan using SPSS version 15. 21 Results: The mean depression score was 33.9% in the participants and most of them had moderate 22 depression. There was a significant inverse relationship between depression and educational level (p=0.03, 23 r=-0.321). No significant relationship was observed between depression and the caregiver’s income (p=0.4), 24 sex (p=0.52), and marital status (p=0.56). 25 Discussion and Conclusion: Taking care of bipolar patients due to depression in family caregivers. 26 Therefore, it can be said that depression imposed by such patients threatens caregivers' mental health, 27 hence reduction in quality of care and support. Consequently, family centered programs are recommended 28 for decreasing depression incurred by bipolar patients. 29 30 Key words: Depression, Caregiver, bipolar disorder, Demographic factors 31
32
Introduction
All experts in the fields of psychology and psychiatry believe that family is the first and most important institution in
every society because it is the place where births occur. Family is in the center of attention in psychopathology and
also in prevention and treatment of mental disorders because it is the principal institution for the socialization of
children (1). The function of family is associated with the mental health of its members, and family aspirations and
self-assertiveness are good predictors of mental health (2).
Evidence suggests that family caregivers have limited information, resources, and supports to prepare themselves for
such a role. In response to mental disorder signs and symptoms and as a result of continuous and long-term care for
the patient with mental health difficulties, family caregivers experience and express a great deal of sorrow, grief,
loss, anger, depression, shame, tension, and combinative pressure (3).
The variety and severity of caregiving roles may result in psychological problems in family caregivers of the
patients (4).

Annals of Tropical Medicine & Public Health-Special Issue Mar 2018 Vol V
S214-18
The illness of a family member affects the family system because it requires the adaptation of the patient and family
members. Finally, the presence of an illness in the family results in depression in family members and their
detachment from one other (5).
Previous research has found that Caring for a patient exhausts the family’s energy and causes frustration, despair,
depression, and development or exacerbation of psychosomatic disorders in other family members, especially the
patient’s parents and spouse. Many studies have shown that the family members of mental patients usually feel weak
and experience distress, anxiety, depression, and financial problems (6).
In 2010, Haresabadi et al conducted a study to evaluate burden of family caregivers of patients with schizophrenia
admitted in IMAM REZA hospital- Bojnurd 2010 and concluded that the family burden imposed by such patients
threatened the mental health of the caregivers (7). The family burden, including physical, mental, psychological,
social and economic experienced by caregivers (8). Treatment costs, stigmatization, family sadness for symptoms
and behaviors of patients, upset of job and social roles of caregivers are the most important factors influencing
patient and especially caregivers and cause of higher rate of depression in them(9,10).
In the United States, Steele et al reported a rate of 40-50% for signs of depression and anxiety in the family
caregivers of chronic psychiatric patients (11).
Omranifard et al. (2006) conducted a study exploring “Prevalence of depression and anxiety in caregivers of patients
in psychiatric wards” in Noor Hospital, Isfahan. Findings have shown 71% of caregiver had depression and 7.9%
affected by anxiety (12).
Today most patients with mood disorder live at home with their family and care and treatment programs will
continue in the family (2). Patient caregivers are at risk for illness such as depression (13).
Psychiatric distress in samples of caregivers of persons/patients with BD was measured in few studies (14-17). Few
studiesmeasured mood symptoms in caregivers of persons/patients with BD, especially depressive symptoms
(18,19,17,20).
Considering the low number of studies conducted on mental disorders, especially depression, in the affected families
and the importance of statistics and information in this regard, we decided to perform this study to determine the
prevalence of depression in the family members of psychiatric patients attending the Psychiatric Ward of Dr.
Ganjavian Hospital, Dezful, and Shams Abad Psychiatric Hospital in 2015-2016 The results of this study could be
used to enhance the care quality of the patients through acquiring more information in this regard and improving the
mental health of their family members.
Materials and Methods
In this cross-sectional descriptive analytical study, 50 participants were approched from Psychiatric Ward of Dr.
Ganjavian Hospital, Dezful, and Shams Abad Psychiatric Hospital and 45 agreed to participate. The inclusion
criteria were being the main caregiver of type I bipolar inpatient according to medical records and psychiatrist
diagnosis, negative history of any psychiatric diseases, and negative history of taking psychiatric medications
through question about drug history, having consent to participate in the study. Exclusion criteria are so elderly
caregivers who can't participate in this study, Caregivers that their patients have other mental diagnosis in addition
of mood disorder or physical disorders.
A demographic questionnaire and the Beck Depression Inventory (BDI) were completed for each participant by the
researcher through interview.
We used simple random sampling in this study. The participant selected among bipolar caregivers according to
inclusion and exclusion criteria by use of file number of their patient. All of participants filled Informed consent
form.
Demographic questionnaire consist of sex, marital status, income, educational level.

Annals of Tropical Medicine & Public Health-Special Issue Mar 2018 Vol V
S214-18
The BDI has 21 questions, each one about one aspect of the mental state. Each question has four responses, rising in
intensity from the mildest to the most severe depressive symptom. Each answer is scored on a value scale of 0-3:
each answer is scored on a value scale of 0-3, with scores of 0 indicating no endorsement of the depressive symptom
and scores of 1, 2 and 3 implying the presence of depressive symptoms of increasing severity". If the patient marks
more than one answer for a given question, only the question with the highest score is considered for the final
calculation. The standard cut-off scores for determining the overall depression severity are as follows: 0-15: normal,
16-31: mild depression, 32-47: moderate depression, 48-63: severe depression (21, 22).
Most studies have shown that the BDI has a high internal consistency with a Cronbach’s alpha of 0.55-0.96,
indicating its high construct validity. The Cronbach’s alpha of the BDI is 0.91 in Iran (23).
The data were analyzed with descriptive statistics, Pearson’s correlation coefficient, ANOVA, and Duncan by using
the SPSS software version 12.
Results
Forty-five caregivers of bipolar patients were included in this study of whom 31.1% (n=14) were men and 68.9%
(n=31) were women. Regarding the educational level, 35.6% (n=16), 22.2% (n=10), 37.8% (n=17), and 4.4% (n=2)
of the participants had incomplete high school education, high school diploma, bachelor’s degree, and master’s
degree, respectively. The income was less than 5,000,000; 5,000,000-10,000,000; 10,000,000-15,000,000; and more
than 15,000,000 Rial (Iran's currency) in 17.8% (n=8), 51.1% (n=23), 24.4% (n=11), and 6.7% (n=3) of the
participants, respectively. Moreover, 33.3% (n=15) of the participants were single and 67.7% (n=30) were married
(Table1).
The mean BDI score was 33.9% in the participants; for 2.2% of participants, BDI scores pertained to no depressive
symptoms, 35.6% had mild, 60% had moderate, and 2.2% had severe depressive symptoms.
There was a significant inverse relationship between depression and educational level (p=0.03, r=-0.321). No
significant relationship was observed between depression and the caregiver’s income (p=0.4), sex (p=0.52), or
marital status (p=0.56)
Table1: demographic characteristics
demographic characteristic frequency percentage
sex
Male
Female
14 31
31.1
68.9
Marital
status
Married
Single
30
15 67.7
33.3
Educational
level
Under diploma
Diploma
Bachelor’s degree
Master’s degree
16
10
17
2
35.6
22.2 37.8 4.4
income
less than 5,000,000
5,000,000-10,000,000
10,000,000-15,000,000
and more than 15,000,000
8
23 11
3
17.8
51.1
24.4
6.7
Discussion
Living with a family member with mental health difficulties has negative impacts on the physical and mental health
of the family members, and caregivers of these patients suffer psychological and mental problems like anxiety and
depression (24).
The mean BDI score was 33.9% in the participants; for 2.2% of participants, BDI scores pertained to no depressive
symptoms, 35.6% had mild, 60% had moderate, and 2.2% had severe depressive symptoms. Caregivers of
persons/patients with BD, similar to caregivers of persons/patients with other major affective or chronic psychiatric
disorders, report high levels of stress and poorer general health, increased visits to their primary care physicians, and

Annals of Tropical Medicine & Public Health-Special Issue Mar 2018 Vol V
S214-18
higher numbers of symptoms of physiological and psychological conditions, including depressed mood, when
compared to caregivers who report less stress (25).
The mean BDI score was 33.9% in the participants. Steele and et al in their study shown 46% of bipolar caregivers
reporting depression (11). According to Dick states Perlick said up to 40% of mental illness caregivers have
depressive symptoms. He said stigma experienced by bipolar caregivers were associated with significantly higher
levels of depressive symptoms (26).
The results of the present study are not in line with the results of the studies by Jordan, Solomon, Waysman,
Manteghi et al, and Bahreynian et al (27-31). In the above-mentioned studies, the prevalence of mild and severe
depression was higher and the prevalence of moderate depression was lower than our study. The reason for the
difference could be that the studies mentioned earlier were conducted with veterans' spouses and people with PTSD
following war and as a result, injury of the husbands in the war made their wives prone to more severe forms of
depression. Also the difference in the number of participants and cultural issues can be due to these differences.
The results of our study showed that the majority of caregivers were women. This finding is in line with the results
of the studies conducted by Pahlavanzadeh et al (4), Zargar et al (2), Nasr et al (32), Gulseren et al (33), and Awad
et al (34). In the Iranian culture, girls and women who do not work or study usually take care of children, patients,
and the elderly or physically injured as part of housekeeping and housework. Studies in other societies also show
that girls and women are the primary caregivers in the house. According to these studies, middle-aged women aged
below 60 years comprise the majority of the caregivers, and most of the elderly patients’ caregivers are their
daughters or spouses (4, 35, 36).
The results of our study showed that the prevalence of depression was lower in female caregivers than their male
counterparts although the difference was not significant (p=0.52). This finding is similar to the results reported by
Omranifard et al and Heru et al who found no significant relationship between depression and the caregiver’s sex
(p>0.05) (12, 37).
A significant inverse relationship was found between depression and educational level (p=0.03, r=-0.321); in other
words, the prevalence of depression was higher in caregivers with a lower educational level. On the other hand,
studies conducted by Hingz, Janatan, and Raymond indicate that educated people have better capabilities to face
stressful events, and can employ effective coping strategies to plan for, control, and manage difficult situations and
seek for support with more certainty. Therefore, they have a more positive attitude and experience less mood
changes (23, 38). The results of a research by Sharif et al shows that the highest and lowest prevalence of psychiatric
disorders is seen in illiterate people and those with academic education, respectively (39).
We found no significant relationship between depression and marital status of the caregivers (p=0.56), which is in
line with the results of the study by Rahmani et al but does not agree with a report by Amjadi et al who investigated
depression in women; according to Amjadi et al, the prevalence of depression is far higher in single versus married
women (p<0.001) (23). The reason for the difference could be that all participants in Amjadi's study were women
who were not necessarily caregivers; however, our sample exclusively comprised caregivers, of both sexes.
No significant relationship was observed between depression and income (p=0.4). This finding is not in line with the
results of other studies, and the reason for the difference could be different sampling methods and characteristics of
the participants. The results of many studies indicate that income adequacy is associated with better mental health
and socioeconomic indexes. Moreover, research shows that the prevalence of mental disorders is associated with
low Social validity and income. A study by Nazari revealed that tension was higher in low-income families (40).
Naturally, the expenses and limitations increase when there is a great demand for care, which not only restricts the
social freedom of the family members but also disturbs their peace and serenity. This association was significant in
our study, confirming this relationship.
Limitations of this study include sample size because in our area there are 2 hospitals with psychiatric wards.
Additionally the use of one self-report measure (the BDI) to measure depression only is another limitation in this
study thus we recommend using interview addition of BDI in future study.
Conclusion

Annals of Tropical Medicine & Public Health-Special Issue Mar 2018 Vol V
S214-18
Taking care of bipolar patients due to depression in family caregivers. Therefore, it can be said that depression
imposed by such patients threatens caregivers' mental health, hence reduction in quality of care and support.
Consequently, family centered programs are recommended for decreasing depression incurred by bipolar patients.
Governments can decrease the depression and increase the quality of care in care givers through providing financial
supports such as subsidy and so on, educational opportunities, and consultation services for family caregivers in
state and free special health center for caregivers. This study highlighted the need to better understand caregivers’ views and personal perceptions of the depression and demands arising from caring for someone with BD in order to
develop practical appropriate interventions and to improve the training of caregivers. Considering the relatively high
prevalence of depression in caregivers and its effects on the performance of the family and quality of care, more
studies are warranted in this regard.
Acknowledgement
This study was part of a research project approved by Dezful University of Medical Sciences (Ethics Committee
Code: DURS114). The authors wish to thank the Vice-Chancellor for Research of Dezful University of Medical
Sciences for their financial support, Mr. Ehsan Bahrampour for statistical analysis, all the personnel and patients of
the Psychiatric Ward of Dr. Ganjavian Hospital and Shams Abad Psychiatric Hospital, and the caregivers who
participated in the study.
References
vt:
1. Koushan M.Vagheie S.psychiatric nursing: mental health nursing1.6th
Ed,Tehran,Andishe Rafi,2010:28. [In Persian]
2. Zargar F, Ashouri A, Asgharipoor N, Aghebati A. The Comparison of Family Functioning in Patients with Major Depressive
Disorder and Physically Ill Patients with no-Psychiatric Disorder in Isfahan. Journal of Research in Behavioral Sciences.2007;
5(2):99-106.[in Persian]
3. Kristjanson L, Aoun S. Palliative care for families: remembering the hidden patients. Canad J Psychia 2004; 49(3): 359-65.
4. Pahlavanzadeh S,Navidian A, Yazdani M. The effect of psycho-education on depression, anxiety and stress in family caregiver
of patients with mental disorders.biomonthly journal of Kermanshah university of medical sciences (BEHBOOD).2010;
3(14):228-236. [In Persian]
5. Peyman N, Bahrami M, Setayesh Y, Vahedian M .Assessing the family problems and the rate of their tendency to admitting
and keeping mentally – Ill patients at home after discharging from Mashhad Hospitals (1380-1382). Fundamentals of Mental
Health. 2005; 8:25-26. [In Persian]
6 .Shamsaei F,Mohammadkhan Kermanshahi S, Vanaki Z. Survey of family caregiver needs of patients with bipolar disorder. Sci J
Hamadan Univ Med Sci.2010; 17(3):57-63. [In Persian]
7. Haresabadi M, Bibak B, Hosein zadeh E, Bayati M, Arki M, Akbar. Assessing burden of family caregiversof patients with
schizophrenia Admitted in IMAM REZA hospital- Bojnurd 2010. Journal of North Khorasan University of Medical Sciences.2012;
4(2):165-171. [In Persian]
8. Alison M, Heru M.D, Christine E. Ryan Ph.D. Family functioning in the caregivers of recently hospitalized patients with
chronic/ recurrent mood disorders family. Int J Psycho Rehabilit.2002; 7, 53-60.
9. CHIEN W-T, CHAN SWC & MORRISSEYJ. The perceived burden among Chinese family caregivers of people with schizophrenia.
Journalof Clinical Nursing 2007: 16, 1151–1161.
10. Rungreangkulkij S & Gilliss CL .Conceptual approaches to studying family caregiving forpersons with severe mental illness.
Journal of Family Nursing 2000366–341 ,6 ؛.
11. Steele A, Maruyama N, Galynker I. Psychiatric symptoms in caregivers of patients with bipolar disorder. J Affect Disord 2010;
121(1):10-21.
12. Omranifard V, Masaeli N, Emami Ardestani P. Prevalence of depression and anxiety in caregivers of patients in psychiatric
wards (2006). Journal of Semnan University of Medical Sciences.2008; 9(3):223-29. [In Persian]
13. Chou KR .Caregiver burden: a concept analysis. Journal of Pediatric Nursing 2000. 15,398–407.
14. Lam D, Donaldson C, Brown Y, Malliaris Y. Burden and marital and sexual satisfaction in the partners of bipolar patients.
Bipolar Disord. 2005; 7:431–440. 42.
15.Goossens PJ, Van Wijngaarden B, Knoppert-van Der Klein EA, Van Achterberg T. Family caregiving in bipolar disorder:
caregiver consequences, caregiver coping styles, and caregiver distress. Int J Soc Psychiatry. 2008; 54:303–316

Annals of Tropical Medicine & Public Health-Special Issue Mar 2018 Vol V
S214-18
16. Hill RG, Shepherd G, Hardy P. In sickness and in health: the experiences of friends and relatives caring for people with manic
depression. J Ment Health. 1998; 7:611–20.
17. Tranvåg O, Kristoffersen K. Experience of being the spouse/cohabitant of a person with bipolar affective disorder: a
cumulative process over time. Scand J Caring Sci. 2008; 22:5–18.
18. Perlick DA, Rosenheck RA, Miklowitz DJ, Chessick C, Wolff N, Kaczynski R, Ostacher M, Patel J, Desai R. Prevalence and
correlates of burden among caregivers of patients with bipolar disorder enrolled in the Systematic Treatment Enhancement
Program for Bipolar Disorder. Bipolar Disord. 2007; 9:262–273.
19. Perlick DA, Rosenheck RA, Miklowitz DJ, Kaczynski R, Link B, Ketter T, Wisniewski S, Wolff N, Sachs G. Caregiver burden and
health in bipolar disorder: a cluster analytic approach. J Nerv Ment Dis. 2008; 196:484–491.
20. Bernhard B, Schaub A, Kümmler P, Dittmann S, Severus E, Seemüller F, Born C, Forsthoff A, Licht RW, Grunze H. Impact of
cognitive-psychoeducational interventions in bipolar patients and their relatives. Eur Psychiatry. 2006; 21:81–86.
21. Bosak s. The influence of massage therapy on depression, anxiety and severity of nausea and vomiting undergoing
chemotherapy patient with breast cancer [dissertation].Ahvaz: nursing and midwifery faculty, Ahvaz joundishapour university
of medical sciences.2012:51-2.[in Persian]
22. Hasanzadeh Taheri M.M. Mogharab M. Akhbari S.H. Raeisoon M.R. Hasanzadeh Taheri E. Prevalance of depression among
new registered student in Birjand university of medical sciences in the academic year 2009-2010. Journal of Birjand University of
Medical Sciences. 2011; 18(2):109-116
23.Amjadi A, Moghomimi-Azari M.B, Hashemi T. Epidemiology of depression and its relationship with demographic properties
among Marand's women population.Quarterly Journal of Psychology(Tabriz University). 2011; 5(20):1-20. [In Persian]
24.Navidian A, Salar AR, Kikhaei A. Study of burden experienced by family caregivers of patients with mental disorder in
mentally ill hospital and psychiatric center. The journal of Urimia university of medical sceiences 2001; 12(3):206-214. [In
Persian]
25. Maurizio Pompili, Désirée Harnic, Xenia Gonda, Alberto Forte, Giovanni Dominici, Marco Innamorati, Konstantinos N
Fountoulakis, Gianluca Serafini, Leo Sher, Luigi Janiri, Zoltan Rihmer, Mario Amore, and Paolo Girardi World J Psychiatry. Impact
of living with bipolar patients: Making sense of caregivers’ burden. 2014 Mar 22; 4(1): 1–12.
doi: 10.5498/wjp.v4.i1.1
26. Perlick DA, Miklowitz DJ, Link BG,Struening E, Kaczynski R, Gonzalez J,
Manning LN, Wolff N, Rosenheck RA. Perceived stigma and depression among caregivers of patients with bipolar disorder.
British Journal of Psychiatry. 2007; 190: 5 35-6.
Doi: 1 0 .11 9 2 / bjp. bp .1 0 5 . 0 2 0 8 2 6
27. Jordan BK, Marmar CR, Fairbank JA, Schlenger WE, Hough RL, Weiss DS. Problems in families of Vietnam veterans with
posttraumatic stress disorder. J Consult Clin Psychol 1992; 60: 916-26.
28. Solomon Z, Waysman M, Levy G, Fried B, Mikulincer M, Benbenishty R, et al. From front line to home front: A study of
secondary traumatization. Fam Proc 1992; 31: 289-302.
29. Waysman M, Mikulincer M, Solomon Z, Weisenberg M. Secondary traumatization among wives of PTSD combat veterans: A
family typology. J Fam Psychol 1993; 7(1): 104-18.
30. Manteghi A, Hebrani P, Samari A-A, Heydari A-S. Level of expressed emotion, depression and caregiver burden in wives of
veterans admitted in psychiatric ward and their relationship with readmissions. Journal of Fundamentals of Mental Health,
Spring 2010; 12(1):409-10. (In Persian)
31. Bahreynian A, Borhani H. [Psychologic evaluation in the Qom combat veteran's wives]. Journal of research in medicine 2004;
27(4): 305-12. (In Persian)
32. Nasr T, Kausar R. Psychoeducation and the family burden in schizophrenia: a randomized controlled trial. Ann Gen
Psychiatry 2009, 8:1-6.
33. Gulseren L, Cam B, Karakoc B, Yigit T,Danci A, Cubukcuopglu Z, Tas C, etal. The Perceived Burden of Care and its Correlates
in Schizophrenia. Turkish Journal of Psychiatry.2010:1-8.
34. Awad AG, Voruqanti LN. The burden of schizophrenia of caregivers: a review. Pharmacoeconomics 2008; 26(2):149-62.
35. Smith A, Schwirian PM. The relationship between caregiver burden and TBI survivor’s cognition and functional ability after
discharge.Rehab Nur 1998; 22(4): 252-7.
36. Lopelowicz A, Zarit R, Smith VG, Mintz J, Liberman RP. Disease management in latinos with schizophrenia: a family – assisted
skills training approach. Schizo Bull. Washington: 2003; 29(2): 211.
37. Heru AM. Ryan CH. Depressive symptoms and family functioning in the caregivers of recently hospitalized patients with
chronic recurrent mood disorders. [Cited 2008 Feb 28].
Availablefrom: http://www.psychosocial.com/IJPR_7/depressive.html.
38. Raymond J. mood and behavior. Journal of mood disorders.2005; 51:322-331.
39.Sharif F, Joulaei H, Kadivar MR, Rajaeefard A. Mental health status and its related demographic variable of families referring
to Shiraz health centers2002.Armaghan-e-Danesh.2004;9(3);75-84.
25

Annals of Tropical Medicine & Public Health-Special Issue Mar 2018 Vol V
S214-18
40. Nazari SH. The evaluation of epileptic children's parents' idea about tension factors and their adaptation with this factor
among persons referred to Tehran chosen remedial center [dissertation]. Tehran: Nursing and Midwifery Faculty, Tehran
Medical University; 2003. [Persian]

Annals of Tropical Medicine & Public Health-Special Issue Mar 2018 Vol V
S215-18
Influence of sufentanil intrathecal administration on 1
Second-stage labor duration 2
Dr.Maryam hashemnejad*1
, Dr.Banafsheh Mashak2, Dr.Seyed Mohsen Pouryaghobi
2, Dr.Mohammad Vaseie
3 3
1. Department of Obstetrics & Gynecology, medical faculty, Alborz University of medical sciences, baghestan Blvd, 4 Karaj, Iran 5
2. Department of anesthesiology, medical faculty, Alborz University of medical sciences, baghestan Blvd, Karaj, Iran 6 3. Department of emergency medicine, medical faculty, Tehran University of medical sciences, Tehran, Iran 7
*corresponding author: [email protected] 8 9 Abstract 10
Background: Labor is a painful physiological process. Many techniques have being proposed for reducing 11
this pain. Intrathecal administration is a strategy to labor pain reducing. 12
Methods: In this study 200 pregnant women with enough information were selected and divided into two 13
groups (n=100) randomly. In first group labor, pain reduction by use of sufentanil and in second group not 14
used any techniques. Total volume of 3 ml of Sufentanil was injected into intrathecal space. During the 15
second stage of labor, delivery tools using, birth weight and Apgar score were investigated. 16
Result: The result showed that age, weight, height, parity, Garavity, gestational age, Vacuum and BMI were 17
similar in the groups. However, duration of second stage of delivery was different in the groups (p<0.05). 18
Conclusion: According to the findings of this study using of sufentanil in labor pain reducing in vaginal labor 19
pain reducing is recommended. 20
Keywords: spinal anesthesia, sufentanil, second stage of labor 21
Introduction
Labor is a painful physiological process (1). Various techniques have been proposed to reduce this type of pain (2).
Stress and anxiety in the pain, can be causes the release of stress hormones; such as cortisol, beta-endorphins and
dramatic increase of catechol amines that this may have a disadvantage effect on uterine activity and uterine-
chorionic blood flow (3, 4). Labor pain reducing techniques divided to two major categories, including Non-
pharmacological and pharmacological methods (5). Non-pharmacological approaches are included training
breathing techniques, psychological support and exercise (6). While pharmaceutical techniques are including of
inhalation anesthesia (nitrous oxide), analgesics and various inhibitors in neuronal area (7). Different ways for
regional analgesia in labor pain relief can be done (8). The elimination of pain sensation by keeping consciousness
mother regional analgesia is basis of contribute to fetus exit.
The most commonly method of Regional analgesia Are included spinal, epidural and spinal-epidural techniques (9,
10). Although, epidural analgesia in many countries is the best strategies to labor pain reducing (11, 12). General
and spinal anesthesia procedure has technically more fans in Iran. Only one stage intrathecal injection into the
cerebrospinal fluid are done, in this technique. Medication and staffing reducing are the advantages of this technique
(13). Other advantages of this technique are including of work in the short term, sedation, rapid and high rate of
success, which will be beneficial, especially in the second stage of labor (14, 15).
Due to the opioid receptors presence in the spinal cord gelatinous material, intrathecal injection into the spinal
neural pathways in different places will be blocked (16).
In general, pregnant women divided into three stages: first stage is starting with regularly contractions and painful
uterine and leads to full dilatation of the cervix. Second stage begins with full dilation of the uterus and Finally
ended by birth. Third phase begins with birth and with expulsion of the placenta will be completed (17).
As regards, duration of labor is the most important issue of spinal analgesia. In the absence of regional analgesia,
first and second stages takes nine hours in nulliparous women and 6 hours in multiparous women (18, 19). Duration

Annals of Tropical Medicine & Public Health-Special Issue Mar 2018 Vol V
S215-18
of the second stage of labor was stratified into hourly intervals: 0-1 hour, 1-2 hours, 2-3 hours, and 3 hours or longer
(20). Effect of intrathecal sufentanil administration on during the second stage of labor and amount of vacuum
application were the main purposes of this study.
Material and method
After a written permission approval, from the ethics committee, researchers referred to Kamali Hospital of Karaj-
Iran. A cephalic presentation or head presentation by obstetricians and lack of contraindications for vaginal delivery
were mother's entry requirements into the present study. These patients had not contraindications for spinal
analgesia. Blood tests including platelet count, hemoglobin and hematocrit were performed. Lack active bleeding,
organ failure and paralysis of the extremities, coagulation disease and no prior history of anesthesia and numbness
were other conditions of pregnant women entry requirements in this study.
200 pregnant women with enough information, were selected and then divided into two groups (n=100), randomly.
The intervention of intrathecal administration was used as an only way to labor pain reducing, in first group. Any
pain reduction method is not used in as second group (control group). After hydration with lactate ringer (500-1000
ml), mothers were placed in sitting position and spinal analgesia was performed in 6 cm of cervical dilatation, by an
anesthesiologist.
At first, analgesia location (between the vertebrae L2 and L3) was disinfected with a percent completely betadine.
Median local analgesic method by using of spinal needle number (25 or 27), attempted to intrathecal space
achieving, in sitting position.
After the needle entry proving in intrathecal space or cerebrospinal fluid flowing from the needle hub, total volume
of 3 ml (50 to 75 micrograms sufentanil in 1 ml normal saline) was inserted under sterile conditions and then the
needle was removed.
Vital signs were controlled 10 to 20 minutes after the pain. Fetal heart rates every 10 to 15 minutes and second labor
stage every five minutes were monitored. During the labor's second stage, using of delivery tools, birth weight and
Apgar in groups were recorded.
Statistical analysis
The data via the chi-square tests, t-test and covariance to compare the significant differences among the treatments
(P<0.05) was applied by use of SPSS version 18 (SPSS Inc., 176 Chicago, IL, USA). All data are presented as mean
± standard deviation (SD) unless indicated otherwise.
Results
This study shows that none of the mothers in trial groups had not any underlying disease. More than 99 percent of
the mothers in pregnancy preparation courses and gestational age between difference groups was not statistically
significant (table. 1).
The result showed that age, weight, height, parity, Garavity, Vacuum and BMI were similar in the groups (table 1).
However, duration of second stage of delivery was different in trial groups (p<0.05) (table 1).
There was no significant difference between Apgar at first and fifth minutes the groups. In addition, no significant
difference was showed in Birth weight between the groups (table, 2).
Discussion
intrathecal administration is an efficient and uncomplicated anesthesia technique that if the proper training to
mothers and reducing their fear, it can be so effective in pain reducing (21). Sufentanil and fentanyl, to be widely
used as an analgesic in the spinal cord at labor. Small doses of a short-acting narcotics adding such as fentanyl or
sufentanil, analgesics improve performance and the other hand prevents the motor blockage (22).
By using of sufentanil intrathecal administration, in present study, major features of the labor pain during delivery
were not affected. The effect of labor pain management method with the use of Epidural anesthesia very well

Annals of Tropical Medicine & Public Health-Special Issue Mar 2018 Vol V
S215-18
studied and recorded but about the relationship between spinal anesthesia and duration of the second stage of labor
there are differences of opinion.
However, several studies reported that epidural analgesia leads to longer delivery time (22, 23). With the use of
sufentanil intrathecal administration significant increasing at duration of second phase of labor was observed, in the
present study
In a similar study 45µg of Sufentanil to aim of pain decreasing in a laboring women was done. in the study was
given sufentanil intrathecal in the course of combined spinal-epidural analgesia. This research effective analgesia
during the second stage of labor showed that (24). In another study, 44 pregnant women with intrathecal fentanyl
administration for labor analgesia, between the ages of 20-31 years was used. The results showed that labor duration
was longer in the target group (25) that the result was similar to the present study (26).
In another study 60 Pregnant women selected and randomly divided to sufentanil and control groups. 10 micrograms
sufentanil in the sufentanil group was injected in intrathecal space. The result showed that duration of the labor
second stage in sufentanil and control groups was 37 and 33 minutes. The results showed that the duration of labor
in the groups was not statistically significant that was different with the present study, but Mother vital signs, FHR
and Apgar score were not significantly different between the two groups that was similar to our study (27).
In another study with the aim of analgesic effect of fentanyl labor process and infants born after injection into the
spinal space in pregnant women as a candidate for natural delivery evaluated, In the control group did not use any
method of analgesia. Finally, in two groups amount intervals of analgesia, first and fifth minute of newborns Apgar
score were compared. Average delivery time showed statistically significant differences between trials groups (in
experimental and control groups was 211 and 181 minutes, respectively) (25)the result was similar to present study.
Nelson et al (2002) reported that, by using of sufentanil and fentanyl in pregnant women with the aim of pain
reducing. Pain relief, side effects, block-level maternal hemodynamic status, length of labor and FHR variables were
studied in two groups.
Duration of analgesia in sufentanil group was significantly higher than fentanyl group (104 vs. 79 minutes).
But demographic characteristics, hemodynamic status, duration of labor, type of delivery, motor block, mentally
weakness of the legs, itching, nausea, pinprick numbness level, VAS, fetal bradycardia and Apgar scores were
similar in both groups. Based on these results the relative strength of sufentanil compared to fentanyl was 4.4 to one.
Sufentanil analgesia also lead to a longer period and has no more side effects (28).
Opioids are Most common drugs that are used to relieve pain and often by injection methods. All opioids cross the
placenta and the fetal heart rate happen (29). Onset of lipophilic opioids action (fentanyl and sufentanil) in the
intrathecal administration is quickly and respiratory depression from the cerebrospinal fluid (25).
In a study effect of fentanyl to labor pain reducing in the second stage of labor increased and postpartum was better
patient satisfaction (30). In the study, no significant difference between age, parity, body mass index was observed
in this study, that this is similar with the present study.
Nevertheless, shortage information regarding mother and newborn child during second stage of labor prolonged (20,
31).
Investigators have mentioned that at the time of application of epidural anesthesia during the second stage of labor
increases (32). Previous experiments have shown that by use of epidural anesthesia the duration of the second stage
of labor significantly, was increased (32-34).
In our study, vacuum extraction was not statistically significant in two groups. Junichi et al 2012, demonstrated that
vacuum extraction in pregnant women under spinal anesthesia in compared to the control group 6.5% vs. 2.9%,
respectively, reported (35), that this results is different with the present study (1.9 vacuum extraction in both
groups).
The purpose of using intrathecal is pain relief with fewest side effects in the mother and newborns child. As
described in the results, maternal and new birth child variables included weight, height, age, gravity, parity,

Annals of Tropical Medicine & Public Health-Special Issue Mar 2018 Vol V
S215-18
gestational age, BMI, birth weight and Apgar in first and fifth minutes) In two groups in present study was not
statistically significant. That present research was similar with Rimaitis et al, investigation (36). That this represents
maximum similarity and minimum and errors in trial groups.
In another study, 60 healthy pregnant women receive epidural Analgesia with the use of Epidural sufentanil was
prescribed. Mothers and newborn child parameters containing of age, height, weight, birth weight, gestational age,
Apgar at 1 and 5 minutes showed no significant difference between the trial groups (37), that this is similar to our
study.
Analgesia and epidural analgesia complications in different studies same composition have been reported. Recently,
with the improvement of spinal analgesia techniques, the use of these methods for analgesia continuous in labor is
taken into consideration (22).
Conclusions
A common complication of neuraxial analgesia can be noted lasted hypotension, upper spinal blocks, headache,
seizure attacks, bladder dysfunction and arachnoiditis and meningitis. In intrathecal administrations these symptoms
are limiting factors. In the present study no effect was observed with the use of sufentanil. So this technique as a
conclusion by using of sufentanil in vaginal delivery pain reducing in pregnant women is recommended.
References
1. Melzack R. The myth of painless childbirth (the John J. Bonica lecture). Pain. 1984;19(4):321-37.
2. Simkin P, Bolding A. Update on nonpharmacologic approaches to relieve labor pain and prevent suffering. Journal of
midwifery & women’s health. 2004;49(6):489-504.
3. Klaus MH, Kennell JH, Klaus PH. The doula book: How a trained labor companion can help you have a shorter, easier,
and healthier birth: Da Capo Press; 2012.
4. Benfield RD, Newton ER, Tanner CJ, Heitkemper MM. Cortisol as a Biomarker of Stress in Term Human Labor
Physiological and Methodological Issues. Biological research for nursing. 2014;16(1):64-71.
5. Rooks JP. Labor pain management other than neuraxial: what do we know and where do we go next? Birth.
2012;39(4):318-22.
6. Simkin PP, O'Hara M. Nonpharmacologic relief of pain during labor: systematic reviews of five methods. American
journal of obstetrics and gynecology. 2002;186(5):S131-S59.
7. Hjelmstedt A, Shenoy ST, Stener-Victorin E, Lekander M, Bhat M, Balakumaran L, et al. Acupressure to reduce labor
pain: a randomized controlled trial. Acta obstetricia et gynecologica Scandinavica. 2010;89(11):1453-9.
8. Howell C. Epidural versus non‐epidural analgesia for pain relief in labour. The Cochrane Library. 1999. 9. Wong CA. Advances in labor analgesia. Int J Womens Health. 2009;1:139-54.
10. El-Wahab N, Robinson N. Analgesia and anaesthesia in labour. Obstetrics, Gynaecology & Reproductive Medicine.
2011;21(5):137-41.
11. Goodfellow C, Hull M, Swaab D, Dogterom J, Buijs R. Oxytocin deficiency at delivery with epidural analgesia. BJOG: An
International Journal of Obstetrics & Gynaecology. 1983;90(3):214-9.
12. Jonas W, Johansson L, Nissen E, Ejdebäck M, Ransjö-Arvidson A, Uvnäs-Moberg K. Effects of intrapartum oxytocin
administration and epidural analgesia on the concentration of plasma oxytocin and prolactin, in response to suckling
during the second day postpartum. Breastfeeding Medicine. 2009;4(2):71-82.
13. Noyan AM, Sadeghi A, Azarbakht Z, Salehi S, Hamediseresht E. Evaluation of intravenous hydrocortisone in reducing
headache after spinal anesthesia: a double blind controlled clinical study [corrected]. Middle East journal of
anaesthesiology. 2007;19(2):415-22.
14. Eltzschig HK, Lieberman ES, Camann WR. Regional anesthesia and analgesia for labor and delivery. New England Journal
of Medicine. 2003;348(4):319-32.
15. Osterman MJ, Martin JA. Epidural and spinal anesthesia use during labor: 27-state reporting area, 2008. National vital
statistics reports: from the Centers for Disease Control and Prevention, National Center for Health Statistics, National
Vital Statistics System. 2011;59(5):1-13, 6.
16. Campagnolo DI, Kirshblum S, Nash MS, Heary RF, Gorman PH. Spinal cord medicine: Lippincott Williams & Wilkins; 2011.
17. Svärdby K, Nordström L, Sellström E. Primiparas with or without oxytocin augmentation: a prospective descriptive
study. Journal of clinical nursing. 2007;16(1):179-84.
18. Zhang J, Troendle J, Mikolajczyk R, Sundaram R, Beaver J, Fraser W. The natural history of the normal first stage of labor.
Obstetrics & Gynecology. 2010;115(4):705-10.

Annals of Tropical Medicine & Public Health-Special Issue Mar 2018 Vol V
S215-18
19. Bloom SL, McIntire DD, Kelly MA, Beimer HL, Burpo RH, Garcia MA, et al. Lack of effect of walking on labor and delivery.
New England Journal of Medicine. 1998;339(2):76-9.
20. Cheng YW, Hopkins LM, Laros RK, Caughey AB. Duration of the second stage of labor in multiparous women: maternal
and neonatal outcomes. American journal of obstetrics and gynecology. 2007;196(6):585. e1-. e6.
21. Najafi TF, Asgari M, Mazloum R. Efficacy of spinal analgesia on atages of labor in 17 Shahrivar hospital of Mashhad.
medical journal of Azad university of Mashhad. 2005.
22. Cunningham F, Leveno K, Bloom S, Spong CY, Dashe J. Williams obstetric: McGrawHill; 2014.
23. Lalouei A, Teymouri M, Javadipour M. comparision the various type of analgesia on stage of labor in Najmieh hospital,
Tehran. scintific journal of Nezam pezeshki. 2011;29(1):38-42.
24. Coleman L, Carvalho B, Lipman S, Schmiesing C, Riley E. Accidental intrathecal sufentanil overdose during combined
spinal-epidural analgesia for labor. International journal of obstetric anesthesia. 2009;18(1):78-80.
25. Beyzaei H, Babapour N, Raeisi M, kianfar M, Babapour M. the effect of spinal analgesia with fentanyl on labor and
delivery medical journal of Azad university of Mashhad. 2010;3(23):187-94.
26. Pascual-Ramirez J, Haya J, Pérez-López FR, Gil-Trujillo S, Garrido-Esteban RA, Bernal G. Effect of combined spinal–epidural analgesia versus epidural analgesia on labor and delivery duration. International Journal of Gynecology &
Obstetrics. 2011;114(3):246-50.
27. Bakhshaei MH, Manuchehrian N, Khoshraftar E, Mohamadipour-Anvary H, Sanatkarfar M. Analgesic effects of
intrathecal sufentanil added to lidocaine 5% in elective cesarean section. Acta Medica Iranica. 2010;48(6):380.
28. Nelson KE, Rauch T, Terebuh V, D’Angelo R. A Comparison of Intrathecal Fentanyl and Sufentanil for Labor Analgesia.
anesthesiology. 2002;96:1070-3.
29. Shoorab NJ, Zagami SE, Mirzakhani K, Mazlom SR. Th Effct of Intravenous Fentanyl on Pain and Duration of the Active
Phase of First Stage Labor. Oman Medical Journal. 2013;28(5):306-10.
30. Pirbudak L. The effect of adding bupivacaine to single intrathecal use of fentanyl for analgesia in the second stage of
labor: 184. Regional anesthesia and pain medicine. 2003;28(5):50.
31. Albers LL. The duration of labor in healthy women. Journal of Perinatology. 1999;19(2).
32. Zhang J, Yancey MK, Klebanoff MA, Schwarz J, Schweitzer D. Does epidural analgesia prolong labor and increase risk of
cesarean delivery? A natural experiment. American journal of obstetrics and gynecology. 2001;185(1):128-34.
33. Halpern SH, Leighton BL, Ohlsson A, Barrett JF, Rice A. Effect of epidural vs parenteral opioid analgesia on the progress
of labor: a meta-analysis. Jama. 1998;280(24):2105-10.
34. Anim-Somuah M, Smyth R, Jones L. Epidural versus non-epidural or no analgesia in labour. Cochrane database syst rev.
2011;12.
35. Hasegawa J, Farina A, Turchi G, Hasegawa Y, Zanello M, Baroncini S. Effects of epidural analgesia on labor length,
instrumental delivery, and neonatal short-term outcome. Journal of anesthesia. 2013;27(1):43-7.
36. Rimaitis K, Klimenko O, Rimaitis M, Morkūnaitė A, Macas A. Labor epidural analgesia and the incidence of instrumental assisted delivery. Medicina. 2015;51(2):76-80.
37. Saleh RH, Ebade AA, Ibrahim M, Tomerek RH. Transplacental transfer and neonatal influences of sonophoretically
administered sufentanil versus epidural sufentanil in labor peridural analgesia: A randomized prospective double-blind
contemplate. Egyptian Journal of Anaesthesia. 2014;30(4):387-92.
Table 1 – Maternal, pregnancy and second stages of labor characteristics in study groups
variable Spinal analgesia (n=100) Control (n=100)
Age 24.5±4.3 26.5±5.6
Weight 73.7±11.06 74.7±13.4
height 154.41±32.2 160.2±16.8
Gravity 1.4±0.6 1.4±0.6
Parity 0.3±0.4 0.3±0.4
Gestational age 274.5±8.7 270.5±24.9
second stages of labor 48.3±44.8 38.3±23.1
vacuum 1.9±0.2 1.9±0.1
BMI 27.2±6.7 28.5±4.9
Data are expressed as mean standard deviation (means ± SD)
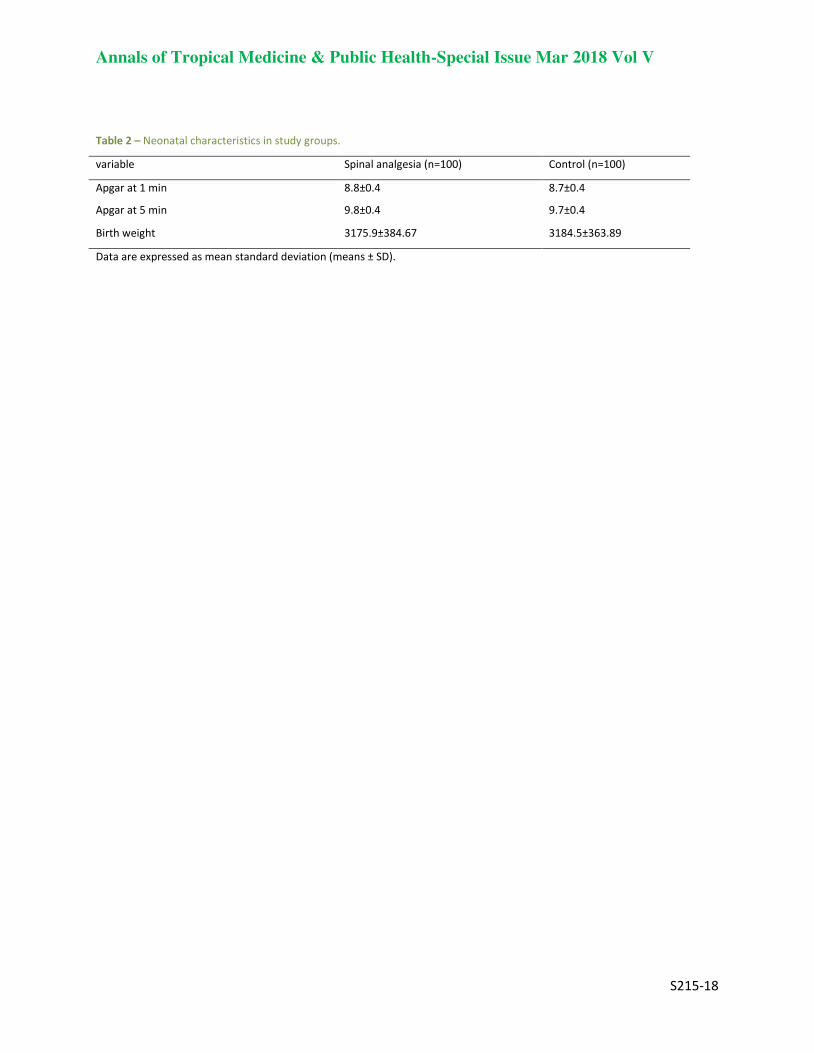
Annals of Tropical Medicine & Public Health-Special Issue Mar 2018 Vol V
S215-18
Table 2 – Neonatal characteristics in study groups.
variable Spinal analgesia (n=100) Control (n=100)
Apgar at 1 min 8.8±0.4 8.7±0.4
Apgar at 5 min 9.8±0.4 9.7±0.4
Birth weight 3175.9±384.67 3184.5±363.89
Data are expressed as mean standard deviation (means ± SD).

Annals of Tropical Medicine & Public Health-Special Issue Mar 2018 Vol V
S216-18
Results of Ponseti Casting On Residual Clubfoot In 1
Patients Referred To Shahid Motahari Clinic Between 2
2011 And 2014 3
Mohammad Reza Azarpira1, Yousef Zarekhafri
2 , Mohammad Javad Farahani
3* 4 5
Bone and Joint Diseases Research Center, Shiraz University of Medical Sciences, Shiraz, Iran 6 *corresponding Author: Mohammad Javad Farahani, 7
Email: [email protected] 8 9
ABSTRACT 10
Background: The Ponseti method has revolutionized the treatment of patients with idiopathic clubfeet and 11
more recently used for treatment of residual or recurrent clubfoot. The purpose of this study was to 12
describe the use of the Ponseti method in the treatment of patients with residual clubfoot. 13
Methods: Records of 32 children with residual deformity treated by the Ponseti technique were reviewed 14
retrospectively. The mean follow-up was 18.4 months (range, 14 to 45 months). Initial and final Pirani 15
scores and DSI score of the patients were determined as outcomes. 16
Results: The initial success rate was 84.4% and Pirani score was more than 1 in 5 patients after treatment. 17
Pirani score improved significantly after treatment from 5.5±0.8 to a post treatment value of 0.7±1.5 18
(P<0.0001). The total DSI score was 91.6±11.9 of 100 points with a satisfaction subscale of 87.3±15.6 and a 19
function subscale of 96.1±9.1 points. 20
Conclusion: In conclusion, the Ponseti method can be successfully used to correct recurrent clubfoot 21
deformity in children. 22
Keywords: Clubfoot, Ponseti method, Pirani score 23
Introduction
Congenital talipes equinovarus (CTEV), or clubfoot, is one of the most common musculoskeletal abnormalities in
childhood which affect the lower limb. Its incidence is approximately 1-2 per 1000. The deformity has four
components: equinus, forefoot adductus, hindfoot varus, and cavus (1).
The traditional treatment of congenital clubfoot has been mainly performed through complex surgical release
procedures (2). Common complications related to this extensive surgery included recurrence of the deformity,
overcorrection, long-term joint stiffness, and pain (3, 4). The disappointing long term results inspired some to seek
out less invasive, more conservative treatments typified by the Ponseti method (5). The Ponseti method has become
the gold standard for the treatment of idiopathic clubfoot. Its safety and efficacy has been demonstrated extensively
in the literature, leading to increased use around the world over the last two decades (6, 7). The technique consists of
an initial phase of serial casts with progressive abduction of the foot while maintaining counterpressure over the
head of the talus. In the first cast the first metatarsal must be raised which means supinating the forefoot to align the
forefoot with the hindfoot and to decrease cavus. The equinus is the last deformity to correct and in many cases this
is done by a calcaneus tendon percutaneous tenotomy and a new cast for 3 weeks. The second phase consists of the
use of a foot abduction brace, initially for 3 months, 23 hours a day, followed by use for 14 hours a day until the
child is 4 years old (8).
Numerous researchers have reported a high initial correction rate and excellent long-term results using the Ponseti
method (9-13). However, good results were not replicated by some authors who reported higher relapse or surgical
rates (14-17). Although the Ponseti method is simple, careful attention must be paid to the details in this method.
Failure to adhere to details, such as manipulation, type of brace, bracing protocol, and relapse management, might
affect whether one obtains a good outcome.
Annals of Tropical Medicine & Public Health-Special Issue Mar 2018 Vol V
S216-18
Treating recurrent clubfoot after surgery puts the physician in a quandary. It is known that initial surgery leads to
poor outcomes with significant pain, stiffness and fatigue. Repeated surgery has the potential to worsen these
symptoms by further postoperative scar formation.
However, because the Ponseti technique has been successful in treating all kinds of difficult-to-treat clubfeet, some
study reported using the Ponseti method in patients with recurrences. For example, in a retrospective review of all
children treated since 2002, using the Ponseti method for recurrent clubfoot following posteromedial release,
showed that the Ponseti method can be successfully used to correct recurrent clubfoot deformity in children treated
with previous extensive soft tissue release. In addition, this treatment protocol prevents complications of stiffness,
pain and difficulty in ambulating associated with multiple soft tissue releases for clubfeet (18). Moreover, a cohort
study by Nogueira and Colleagues with the aim of treatment of recurrent clubfoot following failed surgery,
demonstrated that plantigrade and fully corrected feet were obtained in 71 feet (86%); 11 feet obtained partial
correction; one patient failed treatment and underwent another posteromedial release. Recurrences occurred in nine
patients (12 feet or 14%). Initial Pirani scores improved in all except one patient (19).
The purpose of this study was to report the results of a 4-year experience of using Ponseti casting in residual and
recurrent clubfoot after surgery at the referral university hospital.
Materials & Methods
Between March 2011 and February 2014, thirty two patients with a residual, fixed clubfoot deformity were reviewed
who were treated according to the Ponseti treatment protocol. This is a retrospective study approved by the
institutional review board (IRB) and the University Institutional Ethical Committee (92-01-01-6889).
The inclusion criteria just included the patients with idiopathic clubfeet and recurrence was defined as residual
deformity in each major component of clubfoot including equinus, heel varus, forefoot adduction, cavus, and Pirani
score > 1. Patients with any of the following criteria were excluded from the current study: positional, syndrome-
associated, neurological clubfeet and patients younger than 1 year. Clinical determination of a residual clubfoot was
made by the orthopedic attendings.
Ponseti method of serial manipulation and casting at weekly intervals was conducted by pediatric orthopaedic
attending (8). The general order of deformity correction by this method is cavus, adductus, varus, and equinous. All
corrections were performed by gentle manipulation and maintained with a plaster cast, extending from the toes to
the upper thigh with the knee at 90 degrees of flexion. A percutaneous tendon achilles tenotomy (TAT) was
performed under local anesthesia to address any residual equinus (<20 degrees of dorsiflexion), after the forefoot
correction was complete (70 degrees of abduction) and the hindfoot was in valgus. After the tenotomy, the foot was
cast in the fully corrected position for 3 weeks. After the removal of the posttenotomy cast or directly after full
correction was achieved without a tenotomy, the patient was fitted with a foot abduction orthosis (open-toed, high-
top, straight last boots and Denis-Browne bar), with the affected side(s) set at 70 degrees of external rotation and the
unaffected side at 45 degrees. The brace was prescribed full time for 3 months in the patients under walking age and
at night in them at walking age until 4 years of age. In addition, specific exercises were recommended.
Data Collection
The patients' records were reviewed to obtain information including age, sex, severity of deformity base on the
Pirani score, laterality, family history, parents' education, number of casts for correction of deformity, need for TAT,
and brace compliance.
The Pirani score can detect the degree of correction. It scores 6 clinical signs: 3 for midfoot (MS) and 3 for hindfoot
(HS) grading the amount of deformity between 0 and 3. The Pirani score 0 means normal foot, the Pirani score 3
means moderately abnormal foot, the Pirani score 6 means severely abnormal foot. When Pirani score became 0, it
was graded as excellent, when it became 0.5 to 1, it was graded as good and poor outcome occurs when the score
became more than 1. Excellent and good outcomes obviously reflected to successful management. Poor outcome
reflected treatment failure.
At follow up, outcomes of clubfoot treatment with Ponseti method reevaluated using a simple disease-specific
instrument (DSI). The 10-item clubfoot DSI is an overall measure of clubfoot treatment outcomes with two distinct

Annals of Tropical Medicine & Public Health-Special Issue Mar 2018 Vol V
S216-18
five-item subscales: satisfaction and function (33). The satisfaction subscale items are (1) satisfaction with status of
foot; (2) satisfaction with appearance of foot; (3) teasing; (4) problems with shoes fitting; and (5) problems finding
shoes the child likes. The function subscale consists of (1) whether the child ever complains of foot pain; (2)
limitations in walking; (3) limitations in running; (4) pain during heavy exercise; and (5) pain during moderate
exercise. The total score includes all 10 items. Scores are computed by reverse-coding, summing the responses, and
then dividing the result by the number of items completed, ie, scores are a mean of the responses (Table 1). For ease
of interpretation, the scores are linearly transformed to a 0 to 100 scale with 100 being best, so that 1 = 0, 2 = 33.3, 3
= 66.7, and 4 = 100 for questions with four possible answers. The one yes-or-no item (ever complains of pain in
affected foot) was coded yes = 0 or no = 100 (reference??).
Statistical analysis
Data were analyzed using SPSS ver.17 (SPSS Inc., Chicago, IL, USA). Values were expressed as mean ± standard
deviation (SD) for the quantitative variables and percentages for the categorical variables. Data were compared
using the Student's t-test for the continuous variables and the chi-square test (or Fisher's exact test if required) for the
categorical variables. A p-value of less than 0.05 was considered significant.
Table 1: Disease-specific instrument for patients with clubfoot
Results
Demographics
Thirty two patients (54 feet) with a residual idiopathic clubfoot treated with the Ponseti method were evaluated
retrospectively. Baseline characteristics of patients showed that twenty four (75%) patients were male and 8 (25%)
were female with a male female ratio of 3:1. Twenty two (68.8%) patients had bilateral involvement and 10 (31.2%)
patients were unilateral. The mean age of the patients at the beginning of treatment was 39.1±26.2 months (range, 12
to 120 months). Among the mothers of patients, 43.8% (n=14) had high-school education or less and also 12
(37.5%) fathers had high-school education or less. Of these 32 patients, 19 (59.4%) patients were following failed
surgery, and 13 (40.6%) of them had history of previous Ponseti casting.

Annals of Tropical Medicine & Public Health-Special Issue Mar 2018 Vol V
S216-18
Initial outcomes
The mean number of casts applied to achieve complete correction was 3.6±1.3 (range, 2 to 7). A total of 24 (44.4%)
feet of the 54 feet had to undergo percutaneous tenotomy. No complication was seen after percutaneous tenotomy.
After applying the Ponseti method, 27 patients were completely corrected and in 9 feet (5 patients) had failed
treatment. Therefore, the initial success rate was 83.3% and Pirani score was more than 1 in 5 patients after
treatment. The mean Pirani score at the beginning of treatment for all subjects was 5.5±0.8 with minimum of 3 and
maximum of 6. It improved significantly after treatment from 5.5±0.8 to a post treatment value of 0.7±1.5
(P<0.0001). The 84.4% of families reported complete compliance with the brace and stretching exercises and a total
of 5 patients (15.6%) had brace noncompliance (Table 2).
Follow up
The mean follow-up after treatment course, in 27 patients with complete correction was 18.4 months (range, 14 to
45 months). The total DSI score was 91.6±11.9 of 100 points with a satisfaction subscale of 87.3±15.6 and a
function subscale of 96.1±9.1 points. In this study it was found that the DSI reflected several areas of parental
concern regarding outcomes of their children: 55.5% reported being “very satisfied” with results, and none of them
being “very dissatisfied.” Some 78% of patients were “never teased” about their foot (according to their parents),
whereas 22% were sometimes teased; 81.5% had no limitations in walking, whereas 18.5% of patients had moderate
limitations in walking. Similarly, 74% of patients reported “no problem” finding shoes that fit properly, and 81.5%
of the patients reported "no problem" finding shoes that kids liked. The presence or absence of pain was another
important issue, whereas none of them experienced pain.
Discussion
CTEV or clubfoot is one of the commonest congenital deformities. It is a complex deformity comprises of equinus,
varus, adductus and cavus, which are difficult to correct. It requires meticulous and dedicated effort on the part of
treating physician and parents for the correction of the deformity (20). The goal of treatment is to reduce or
eliminate these deformities so that patient has a functional, pain free, plantigrade foot with good mobility without
calluses and does not need to wear modified shoes (21).
Many studies have shown poor long-term function after surgical treatment of clubfoot (3, 4, 36-38). They are
frequently stiff, painful and have limited range of motion. Recurrences are usually treated with further surgery;
however, this only worsens long-term functional outcomes. Dobbs described a cohort of 45 patients with long-term
follow-up after surgical treatment of clubfoot (4). Number of surgical procedures was associated with significantly
worse functional and radiographic outcomes in patients with clubfeet. Although it is tempting to surgically revise the
failed clubfoot after posteromedial release, this evidence suggests that surgery only leads to further functional
compromise.
Prior literature has described successful use of the Ponseti method in neonates and older infants (22-24). The Ponseti
casting technique of correction of CTEV deformity requires serial corrective casts with long term brace maintenance
of the correction. The treatment needs to be started as soon as possible and should be followed under close
supervision (22). The Ponseti casting technique yielded satisfactory anatomical and functional result with simple,
effective, minimally invasive, inexpensive and ideally suited for all countries and cultures (22).
A recent series from Iowa reported on the use of the Ponseti method in neglected clubfeet in children who were
ambulatory. The average age in their series was 3.9 years and 16 of 24 feet were able to be corrected without soft
tissue release (24). It was observed that the Ponseti technique for treating clubfoot has been popularized for
idiopathic clubfoot and more recently several syndromic causes of clubfoot.
In the present study 32 patients with recurrent clubfoot were attempted to correct with the Ponseti technique. In our
study, 84.4% patients were managed successfully without any complication and they had Pirani score less than 1
after complete treatment course. The initial success rate 84.4% was in accordance to the international figures.
Nogueira et al. (19) reported 86% fully corrected feet in 71 out of 83 clubfeet. In another study, Garg et al. (18)
utilized the Ponseti method of manipulation and casting and when indicated, tibialis anterior tendon transfer, instead
of revision surgery for these cases. Their results demonstrated that complete success was achieved in 81.8% of the
patients.

Annals of Tropical Medicine & Public Health-Special Issue Mar 2018 Vol V
S216-18
The mean number of casts required per feet in the present study was 3.6±1.3 (range, 2 to 7), similar as compared to
the other series (20, 21, 23). Moreover, percutaneous tenotomy was required in 14 (43.8%) of the patients, much less
as compared to the other series. In a study by Saif Ullah et la. (23) 86.2% feet required percutaneous tenotomy.
Also, tenotomy was needed in 95% of Gupta’s patients (20) and 91% of Dobbs’s patients (4). All the studies show
that tenotomy was required in those patients who initially have severe deformity. Bor et al quoted, “A foot that
requires many casts for the initial correction is more likely to require future additional surgery” (25).
In this study an improvement of all feet evaluated by the score of Pirani et al. was observed; a finding observed in
many different treatment centers considering idiopathic clubfeet treated by the Ponseti method (2, 6). In addition, it
improved significantly after treatment from 5.5±0.8 to a post treatment value of 0.7±1.5 (P<0.0001). Consistently
with our results, other study on recurrent clubfoot reported significantly improvement in Pirani score after Ponseti
method (18, 19).
The DSI score was introduced by Roye et al. (26) and was validated by Dietz et al. (27). In the present study the DSI
score was of 91.6±11.9 of 100 points. This is similar what was reported by Radler et al. (28) which was reported
midterm results of the Ponseti method in the treatment of congenital clubfoot. The DSI score in their series was of
85.3±13 of 100 points.
There were a number limiting factors diminishing the impact of results, including a relatively small sample size as a
main limitation. Additionally, the short period of follow-up is another one. Moreover, this method is very
individual-dependent and the skill of the person to perform it affect outcomes.
Conclusion
Although less evidences has described using the Ponseti method for residual feet, the present results demonstrate
that it is possible to use its principles to improve or correct relapsed or uncorrected clubfeet presenting after a
previous surgery or previous casting. The knowledge of the biomechanics and kinematics of the subtalar joint (11) is
helpful in understanding the pathology and treatment of clubfoot. It is believed that the scars and fibrotic tissues are
stretched, allowing the motion and remodeling of bones and cartilage.
Acknowledgment:
The present article was extracted from the thesis written by Yousef Zarekhafri M.D in collaboration with Bone and
Joint Diseases Research Center and was financially supported by Vice Chancellor of Research, Shiraz University of
Medical Sciences (Grant No. 6889).
References
1- Gibbons PJ, Gray K. Update on clubfoot. J Paediatr Child Health. 2013;49(9):434-7.
2- Dobbs MB, Morcuende JA, Gurnett CA, Ponseti IV. Treatment of idiopathic clubfoot: an historical review. Iowa Orthop
J. 2000; 20(1):59-64.
3- Ippolito E, Farsetti P, Caterini R, Tudisco C. Long-term comparative results in patients with congenital clubfoot treated with
two different protocols. J Bone Joint Surg Am. 2003;85-A(7):1286-94.
4- Dobbs MB, Nunley R, Schoenecker PL. Long-term follow up of patients with clubfeet treated with extensive soft tissue
release. J Bone Joint Surg Am. 2006;88(5):986-96.
5- Ponseti IV, Smoley EN. The classic: congenital club foot: the results of treatment. 1963. Clin Orthop Relat Res.
2009;467(5):1133-45.
6- Shabtai L, Specht SC, Herzenberg JE. Worldwide spread of the Ponseti method for clubfoot. World J Orthop. 2014;5(5):585-
90.
7- Laaveg SJ, Ponseti IV. Long-term results of treatment of congenital club foot. J Bone Joint Surg Am. 1980;62(1):23-31.
8- Ponseti IV. Treatment of congenital clubfoot. J Bone Joint Surg Am. 1992;74(3):448-54.
9- Cooper DM, Dietz FR. Treatment of idiopathic clubfoot: a thirtyyear follow-up note. J Bone Joint Surg Am. 1995;77(10):1477-
89.
10- Dobbs MB, Rudzki JR, Purcell DB, Walton T, Porter KR, Gurnett CA. Factors predictive of outcome after use of the Ponseti
method for the treatment of idiopathic clubfeet. J Bone Joint Surg Am. 2004;86-A(1):22-7.

Annals of Tropical Medicine & Public Health-Special Issue Mar 2018 Vol V
S216-18
11- Ponseti IV, Zhivkov M, Davis N, Sinclair M, Dobbs MB, Morcuende JA. Treatment of the complex idiopathic clubfoot. Clin
Orthop Relat Res. 2006;451(1):171-6.
12- Richards BS, Faulks S, Rathjen KE, Karol LA, Johnston CE, Jones SA. A comparison of two nonoperative methods of idiopathic
clubfoot correction: the Ponseti method and the French functional (physiotherapy) method.
J Bone Joint Surg Am. 2008;90(11):2313-21.
13- Spiegel DA, Shrestha OP, Sitoula P, Rajbhandary T, Bijukachhe B, Banskota AK. Ponseti method for untreated idiopathic
clubfeet in Nepalese patients from 1 to 6 years of age. Clin Orthop Relat Res. 2009;467(5):1164-70.
14- Park SS, Kim SW, Jung BS, Lee HS, Kim JS. Selective soft tissue release for recurrent or residual deformity after conservative
treatment of idiopathic clubfoot. J Bone Joint Surg Br. 2009;91(11):1526-30.
15- Park SS, Lee HS, Han SH, Park JW, de Peralta MJ. Gastrocsoleus fascial release for correction of equinus deformity in residual
or relapsed clubfoot. Foot Ankle Int. 2012;33(12):1075-8.
16- Haft GF, Walker CG, Crawford HA. Early clubfoot recurrence after use of the Ponseti method in a New Zealand population. J
Bone Joint Surg Am. 2007;89(3):487-93.
17- Clarke NM, Uglow MG, Valentine KM. Comparison of Ponseti versus surgical treatment in congenital talipes equinovarus. J
Foot Ankle Surg. 2011;50(5):529-34.
18- Garg S, Dobbs MB. Use of the Ponseti method for recurrent clubfoot following posteromedial release. Indian J
Orthop. 2008;42(1):68-72.
19- Nogueira MP1, Ey Batlle AM, Alves CG. Is it Possible to Treat Recurrent Clubfoot with the Ponseti Technique After
Posteromedial Release? Clin Orthop Relat Res. 2009;467(5):1298-305.
20- Gupta A, Singh S, Patel P, Patel J, Varshney MK. Evaluation of the utility of the Ponseti method of correction of clubfoot
deformity in a developing nation. Int Orthop. 2008;32(1):75-9.
21- Morcuende JA, Dolan LA, Dietz FR, Ponseti IV. Radical reduction in the rate of extensive corrective surgery for clubfoot using
the Ponseti method. Pediatrics. Pediatrics. 2004;113(2):376-80.
22- Bor N, Herzenberg JE, Frick SL. Ponseti management of clubfoot in older infants. Clin Orthop Relat Res. 2006;444(1):224–8.
23- Saif Ullah M, Md Noor-U, Ferdous K, Shahjahan M, Abu Sayed S. Management of Congenital Talipes Equino Varus (CTEV) by
Ponseti Casting Technique in Neonates: Our Experience. J Neonatal Surg. 2013;2(2): 17.
24- Lourenco AF, Morcuende JA. Correction of neglected idiopathic club foot by the Ponseti method. J Bone Joint Surg
Br. 2007;89(3):378-81.
25- Bor N, Coplan JA, Herzenberg JE. Ponseti treatment for idiopathic clubfoot: minimum 5-year follow up. Clin Orthop Relat
Res. 2009;467(5):1263-70.
26- Roye BD, Vitale MG, Gelijns AC, Roye DP Jr. Patient-based outcomes after clubfoot surgery. J Pediatr Orthop. 2001;21(1):42-
9.
27- Dietz FR, Tyler MC, Leary KS, Damiano PC. Evaluation of a disease-specific instrument for idiopathic clubfoot outcome. Clin
Orthop Relat Res. 2009;467(5):1256-62.
28- Radler C, Mindler GT, Riedl K, Lipkowski C, Kranzl A. Midterm results of the Ponseti method in the treatment of congenital
clubfoot. Int Orthop. 2013;3
7(9):1827-31.

Annals of Tropical Medicine & Public Health-Special Issue Mar 2018 Vol V
S217-18
The Effects of Short-Term Caffeine Supplementation on 1
the Isocapnic Buffering and Hypocapnic Hyperventilation 2
Phases in Sedentary Men 3
Ebrahim Nourian1*
, Davoud Malekzadeh2, Abdorreza Eghbal Moghanlou
3 and Akram Ebadi
4 4
1Department of Physical Education and Sport Sciences, Payame Noor University, Tehran, Iran. 5 2MSc of Biochemistry, Payame Noor University, Tehran, Iran. 6
3Department of Physical Education and Sport Sciences, Payame Noor University, Tehran, Iran. 7 4PhD Student of Sport Physiology, Tabriz University, Tabriz, Iran. 8
*Corresponding Author: Ebrahim Nourian 9
Abstract 10
Purpose of this study was to investigate the effects of acute supplementation with caffeine on the isocapnic 11 buffering and hypocapnic hyperventilation phases in sedentary young men. Thirty male healthy non-athletic 12 students (Age 20.78 ±1.66 years, Height 173.83±8.06 cm, Weight 70.44±9.76 kg) were randomly divided 13 into supplementary and placebo groups. The study was conducted in two stages with an interval of one 14 week.in pre-test the subjects of both groups performed the protocol on a computerized treadmill without 15 taking any drugs. In the post-method one hour before the main test, the supplementary group subjects 16 were provided with 6mg of caffeine per kilogram of body weight and the placebo group were provided with 17 the same amount of starch. V-Slope was measured with the respiratory gas analysis system for estimating 18 the isocapnic buffering and hypocapnic hyperventilation phases. Under curve surface area was estimated 19 using of integration function. Analysis of covariance (ANCOVA) aimed to control the pre-test scores as a 20 covariate was used to analysis the data. Results indicated that acute caffeine supplementation despite of 21 positive effects on the aerobic and anaerobic thresholds as well as the peak values, has no a significant 22 effect on isocapnic buffering and hypocapnic hyperventilation phases. Based on the results we can conclude 23 that presumably acute supplementation of caffeine shifts the isocapnic buffering and hypocapnic 24 hyperventilation area to the right side and delay fatigue which has to be studied in the future. 25
Key Word: Caffeine, Isocapnic Buffering, Hypocapnic Hyperventilation, Sedentary Men. 26
Introduction:
Today, participation in sports activities, in addition to being a proper activity between athletes, as well as in
individuals of different age’s advice in order to raise the level of health and fitness. One of the most effective parts
of body in sports activities is cardio respiratory system. In fact, the function is defendant to main function of
respiratory, the cardiovascular system, and skeletal muscle (Rodney et al, 2007). Many people with different
motivation use variety of nutritional supplements, oral or inject medications ,even forbidden materials from the
World Anti-Doping Agency (WADA), which can be affect the fitted their activities. One of these supplements that
nowadays used in the world by many amateur and professional athletes is caffeine to improve sport performance.
Caffeine is similar to Crystal, has white color and taste bitter called 1, 3 and 7 (3-Methyl-13C) with C8 H10 N4 O2
formula. This material is found in coffee, tea, chocolate and some drinks. Caffeine as an energize agent are advised
to act on the liberation mechanism of catecholamine in sports activities to improve the level of sport performance of
athletes (Whitham, 2006). The researchers concluded that supplement use of caffeine increase free fatty acids and
decrease Glycol sis and blood lactate and subsequently delayed physical fatigue in heavy and overwhelming
activities (Peker et al, 2005).
The anaerobic threshold, due sudden increase in the lactate amount of blood, or increase the ratio of lactate define
Private used widely in designing and compiling of the endurance program (Neal, 2011). This index used as a tool to
predict the performance of endurance athletes (Coen, 2001). A number of research determined that there are two
ventilation threshold or lactate threshold (LTs) during training until lag. . From the physiological point of view, we
Annals of Tropical Medicine & Public Health-Special Issue Mar 2018 Vol V
SSS217-18
S217-18
can define three-stage powering and two-point of defeat with increasing intensity of the workout. A lot of the
terminology described for the first and the second threshold of lactate. According to Skinner and Maclean, the first
threshold named aerobic threshold and the second threshold named the" anaerobic threshold (Binder et al, 2008).
The distance between the aerobic thresholds to anaerobic thresholds called Isocapnic buffering phase and the
distance between the aerobic phases up to the stall called hypocapnic hyperventilation phases. In other words, it has
been shown that increasing physical activity along with increased levels of blood lactate, pressure volume of dioxide
carbon at the end of present volume (PETCO2) at working loads beyond LT up to compensation point of breath
(RCP) remained constant or increased a slight. This smooth stage PETCO2from LT to RCP defined as Isocapnic
buffering (Wasserman, 1980; Whipp, 1998). On the other hand, in hypocapnic hyperventilation phase, with increase
of ventilation after the RCP, the amount of PETCO2 reduced gradually until the occurrence of fatigue and in
contrast, oxygen pressure increase at the end of this volume (PETO2) (Binder et al, 2008). These phases designed for
sports application with the appropriate intensity. It seems that training intensity is the most important factor in the
training program. The evidence suggested that in some people, training with 45% intensity of aerobic power or less,
has significant effects, but suitable intensity is at least 60% VO2max for most people (Wilmore, 1994). Endurance
training requires manipulating the intensity, duration and frequency of training sessions during the day, week and
month. Slow trainings on long distance, training the lactate threshold, high intensity training (HIT) are all familiar
terminology of training in different areas of intense scale. . The relative impact of various combinations, from
intensity and duration of exercise, have studied and discussed in recent decades among athletes, coaches and
scientists (Seiler, 2010).
Neal and his colleagues (2011) in a study surveyed distribution of training intensity and physiological adaptations
during a 6-month period on iron men (before tournament). Ten athletes take part in three training courses (A, B, C)
that everyone lasted for two months. They used lactate threshold and lactate threshold point (LTP) to determine the
training intensity areas. The average percentage time spent in regions 1, 2, 3, are 69±%, 25±8 % and, 6± 2%
respectively. Its results show that the average physiological compatibility can be created during the six month
training period with low to moderate effect. They result that the distribution of exercise intensity has low effect
during period (Neal, 2011).
In a revision that Larsen had done (2010) suggested, the polarized approach to practice be done, in nearly 75% of
the total volume with low intensity and10-15% be done with maximum intensity that intensity distribution may be
good training for elite athletes who compete in endurance events (Larsen, 2010).
According to the inadequate research about short time supplementing impact of caffeine on isocapnic buffering and
hypocapnic hyper ventilation phases on one hand and the lack of adequate scientific data, as well as being an
important study in the designing training program with effective intensity for athletes, the present study aimed to
determine the effect of short-term supplement caffeine on isocapnic buffering phases and hypocapnic hyper
ventilation of sedentary men.
Methodology:
The samples of present research consists of 30 sedentary (with a age mean of 20.78± 1.66 years, 173.83±8.06 cm
height and 70.44±9.76 kg weight). After signing satisfaction form by the subjects measured preliminary
measurement. The subjects 72 hours before all the tests, avoided to do any severe activities. The test performed by
subjects in two-stages with a week interval. At the pre-test stage, subjects of two groups without taking any kind of
drug ran on treadmill under computer control of the Bruce Protocol and at the post-test stage, one hour before the
main test, the subjects of supplement Group received 6 mg caffeine per kilogram of weight, and concurrent their
placebo group received the same amount starch in the uniform jelly capsule along with 200 mm liter water and For
maximum caffeine concentrations on blood an hour sat an hour on the Chair and after 5 minutes warming, they
repeat exactly the same test. Before and after taking the caffeine pill, through sports activity on a treadmill, were
measured V-Slope of subjects.

Annals of Tropical Medicine & Public Health-Special Issue Mar 2018 Vol V
S217-18
The graph of V-Slope shows the volume of dioxide carbon to oxygen that in this diagram vertical axis represents the
volume of produced dioxide carbon and horizontal axis represents the volume of consumed oxygen. Based on the
curve set points of aerobic, anaerobic threshold as well as stall points, and with it, the level below the curve of the
Isocapnic buffering phases(the threshold of aerobic up aerobic threshold) and hypocapnic hyper vitalization (a
distance of aerobic threshold to stall) measured by integral operation.
From the beginning of the test until stalling, the respiratory gases of subjects collected through the mask of Germany
Power Cube– ergo device. Such that this device registered, automatically, the amount of oxygen consumption,
dioxide carbon production and ventilation, on average, at intervals of 10 seconds throughout the duration of the test.
In the end, the cooling program will run for 5 minutes (GaisI, 1990).
Statistical method:
To check normal distribution of data used Shapiro-wilk test. To calculate the level below curve chart used V-Slope
to estimate buffering isocapnic phases, hypocapnic hyperventilation used integral operation and used ANCOVA
statistical test to compare the results of the post-test with pre-test as covariance. Significant difference of variables
was considered at the level of P≤ 0.05 and used SPSS software for data analysis.
Results:
Preliminary results related to the physical variables and body combination using Shapiro-wilk test showed
homogeneous and non-significant difference between the two groups. Physical characteristics and body
combinations of subjects are represented in table 1.
Table 1: Subjects’ physical characteristics for all groups
Mean±SD Variable
20.78 ± 1.66 Age (year)
173.83 ± 8.06 Height (Cm)
70.44 ± 9.76 Weight (Kg)
14.21 ± 4.77 Fat (%)
Covariance analysis results to compare the size of the curve below buffering isocapnic phases and hypocapnic hyper
ventilation showed, although the volume of consumed oxygen and produced dioxide carbon on the aerobic
threshold, the anaerobic threshold and maximum increased in the supplement group, but the volume below the curve
of buffering isocapnic phases and hypocapnic hyper ventilation phases show any significant difference in the two
groups of placebo and supplement (tables 2 and 3). On the graph 1 is shown buffering isocapnic and hypocapnic
hyperventilation phases of a study.
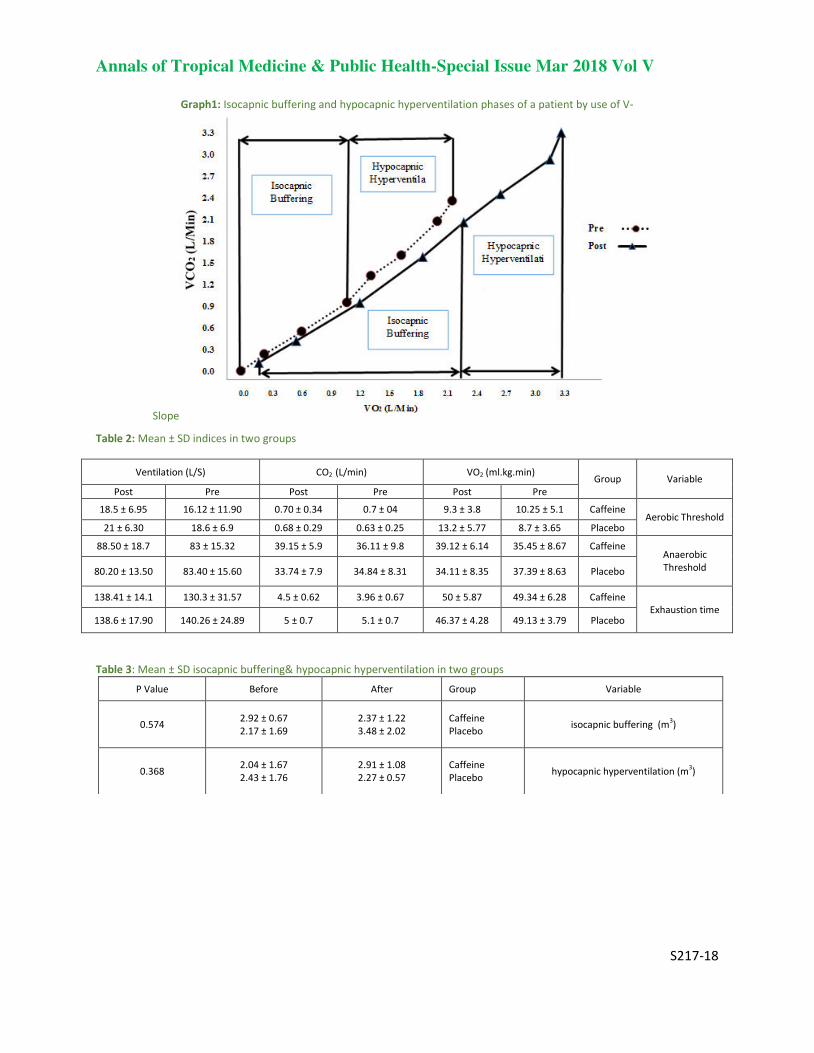
Annals of Tropical Medicine & Public Health-Special Issue Mar 2018 Vol V
SSS217-18
S217-18
Graph1: Isocapnic buffering and hypocapnic hyperventilation phases of a patient by use of V-
Slope
Table 2: Mean ± SD indices in two groups
Ventilation (L/S) CO2 (L/min) VO2 (ml.kg.min) Group Variable
Post Pre Post Pre Post Pre
18.5 ± 6.95 16.12 ± 11.90 0.70 ± 0.34 0.7 ± 04 9.3 ± 3.8 10.25 ± 5.1 Caffeine Aerobic Threshold
6.30 ±21 18.6 ± 6.9 0.68 ± 0.29 0.63 ± 0.25 13.2 ± 5.77 8.7 ± 3.65 Placebo
88.50 ± 18.7 83 ± 15.32 39.15 ± 5.9 36.11 ± 9.8 39.12 ± 6.14 35.45 ± 8.67 Caffeine Anaerobic
Threshold 80.20 ± 13.50 83.40 ± 15.60 33.74 ± 7.9 34.84 ± 8.31 34.11 ± 8.35 37.39 ± 8.63 Placebo
138.41 ± 14.1 130.3 ± 31.57 4.5 ± 0.62 3.96 ± 0.67 50 ± 5.87 49.34 ± 6.28 Caffeine
Exhaustion time 138.6 ± 17.90 140.26 ± 24.89 5 ± 0.7 5.1 ± 0.7 46.37 ± 4.28 49.13 ± 3.79 Placebo
Table 3: Mean ± SD isocapnic buffering& hypocapnic hyperventilation in two groups
Variable Group After Before P Value
isocapnic buffering (m3)
Caffeine
Placebo
2.37 ± 1.22
3.48 ± 2.02
2.92 ± 0.67
2.17 ± 1.69 0.574
hypocapnic hyperventilation (m3)
Caffeine
Placebo
2.91 ± 1.08
2.27 ± 0.57
2.04 ± 1.67
2.43 ± 1.76 0.368
Annals of Tropical Medicine & Public Health-Special Issue Mar 2018 Vol V
S217-18
Conclusion:
The present study evaluates the effect of caffeine on isocapnic buffering and hypocapnic hyperventilation phases of
sedentary men in helpless protocol. The results of the covariance analysis of two groups placebo and supplement
showed there is no significant differences in the below curve level of buffering isocapnic and hypocapnic
hyperventilation phases, even though shown a significant increase in the volume of consumed oxygen and
manufactured dioxide carbon on the aerobic, anaerobic and maximum threshold.
Caffeine increase catecholamine levels and has several physiological effects, including speeding the uptake process
of oxygen and muscle Glycol sis (Goldstein and et al, 2010; Tarnopolsky, 1994), but improved performance of
caffeine is due to direct oppose with A1, A2a receiver on skeletal muscle membrane that improves the contractile
couples stimulation (Tarnopolsky, 1989) through releasing more calcium of the Sarcoplasmic network (Tallis et al,
2012) or improving sodium potassium pump activity of dependent energy (NA +/K + ATPase).
As you see in the present study, the volume of consumed oxygen and manufactured dioxide carbon increased on
aerobic threshold, anaerobic and the maximum threshold, therefore, as a result of such measures can be fitted that
caffeine expanded the x-axis (Vo2) and the Y axis (Vco2) of -V Slope curve, but according to the estimation of the
total below curve level of buffering isocapnic and hypocapnic hyper ventilation phases, was observed any
significant change in the post-test and pre- test of two supplement and placebo groups. To justify this lack of
difference, according to rise and drop of V- Slope curve in performance time of helpless protocol and probably
because of low or shift to the right side of the curve, in buffering isocapnic phases and hypocapnic hyper ventilation
despite raise of maximum amount an of VO2 and VCO2 after caffeine supplementation, observed any incremental
under the curve area. As diagram 1, these phases after complementation shift to the right and down side and this
likely express fixed level below the curve of buffering isocapnic phases and hypocapnic hyper ventilation. In fact,
this suggests that probably increased the tampon power of the body in the supplement group and delayed fatigue in
supplement group against to the placebo group.
In accordance with this research, Chicharro et al (2000) yielded a study about professional cyclists and observed a
similar shift in the ventilator threshold (equivalent of aerobic threshold) and point of breath compensation
(equivalent to anaerobic threshold), which both reflect the range of buffering isocapnic, this action throughout the
season represents the lack of change, in terms of area under the curve, in the buffering isocapnic phases during
season.
In contrast of our findings, a study conducted by Rocker and et al (1994) which show that the buffering isocapnic
phases of 400 meter elite runners is larger than endurance runners (Non-elite) and non-athlete subjects. It is possible
that severe seasons like anaerobic metabolism (like what happens in 400 meters run) improve buffering capacity and
the same makes larger buffering isocapnic phases than endurance athletes that can be studied in the future.
On the other hand, in a study by Agostoni et al (2008), disappearance of buffering isocapnic phases represents a
subsequent increase of sport activity in high altitudes, decrease of ventilation, VO2 and PETCO2 amount, and
subsequently disappearing or shorting buffering isocapnic phases.
Some of the evidence show caffeine in non-toxic physiological concentrations creates energize effects through
inhibition of adenosine receptors (Fredholm et al, 1999). The findings of the Mousavi et al (2011) showed that
caffeine consumption has no significant impact on maximum oxygen consumption, heart rate and blood pressure at
the end of the practice.
Damirchi and et al (2009) after studying the effect of caffeine on blood pressure during maximum activity and rest
in overweight people, showed that 13 minutes running on the treadmill with 63% maximum oxygen consumption
increase significantly systole, diastole and the average blood pressure at rest time. At the end of the activity, the
differences between the experimental group and placebo were not statistically significant. Also, the significant
difference wasn’t observed in heart rate of two groups. At present it is difficult to compare previous findings with
present one, because in different studies used different doses of caffeine, different type and intensity of the exercise
Annals of Tropical Medicine & Public Health-Special Issue Mar 2018 Vol V
SSS217-18
S217-18
and various subjects. As well as the impact of caffeine varies from one person to another, so more research is
necessary in the field.
Reference
1. Agostoni P, Valentini M, Magri D, Revera M, Caldara G, Gregorini F, et al. Disappearance of isocapnic buffering period
during increasing work rate exercise at high altitude. European Journal of Cardiovascular Prevention & Rehabilitation
2008;15(3):354-358. 2. Binder RK, Wonisch M, Corra U, Cohen-Solal A, Vanhees L, Saner H, et al. Methodological approach to the first and
second lactate threshold in incremental cardiopulmonary exercise testing. European Journal of Cardiovascular
Prevention & Rehabilitation 2008;15(6):726-734. 3. Chicharro JL, Hoyos Js, Luca A. Effects of endurance training on the isocapnic buffering and hypocapnic hyperventilation
phases in professional cyclists. British journal of sports medicine 2000;34(6):450-455. 4. Coen B, Urhausen A, Kindermann W. Individual anaerobic threshold: methodological aspects of its assessment in
running. International journal of sports medicine 2001;22(01):8-16. 5. Damirchi, A., Rahmani-nia, F., Mirzaei, M., Hasan-nia, S., Ebrahimi, M. 2009. Effect of caffeine on blood pressure during
exercise at rest in overweight men, Iranian Journal of Endocrinology & Metabolism, Vol , 10. No, 6.
6. Fredholm, BB., Battig, K., Holme, ´n J., Nehlig, A., Zvartau, EE., 1999. Actions of caffeine in the brain with special
reference to factors that contribute to its widespread use. Pharmacol Rev 51: 83–133.
7. GaisI G, Hofmann P. Heart Rate Determination of Anaerobic Threshold in Children. Pediatric Exercise Science 1990;2(1).
8. Goldstein, ER., Ziegenfuss, T., Kalman, D., Kreider, R., Campbell, B., Wilborn, C., Taylor, L., Willoughby, D., 2010.
International Society of Sports Nutrition position stand: caffeine and performance. J Int Soc Sports Nutr 7: 5,
9. Laursen PB. Training for intense exercise performance: high intensity or high volume training? Scandinavian journal of
medicine & science in sports 2010;20(s2):1-10. 10. Mousavi, A., Koushki Jahromi, M., Salesi, M., Daryanoush, F., Khoshnam, E., Nikseresht, A., Hemati, M. 2011. Impact of
Caffeine consumption on heart rate and blood pressure during rest and exercise, Journal of Jahrom University of
Medical Science, Vol. 9, No. 1.
11. Neal CM, Hunter AM, Galloway SDR. A 6-month analysis of training-intensity distribution and physiological adaptation in
Ironman triathletes. Journal of sports sciences 2011;29(14):1515-1523. 12. Peker, I., Goren, Z., Ciloglu, F., Karacabey, K., Ozmerdivenli, R., Saygin, O., 2005. Effect of caffeine on exercise
performance, lactate, F.F.A, triglycerides, prolactin, cortisol and amylase in maximal aerobic exercise. Biotechnol. &
Biotechnology, 8: 18-28.
13. Rocker K, Striegel H, Freund T, Dickhuth HH. Relative functional buffering capacity in 400-meter runners, long-distance
runners and untrained individuals. European journal of applied physiology and occupational physiology 1994;68(5):430-
434. 14. Rodney, A.K., A.G. Colin, H.M. Marie, S.Y. Ian and M. Nanette, 2007. Evaluating the effects of low volume stair climbing
program on measure of health-related fitness in sedentary office workers. J. Sports Science and Medicine, 6: 445-48.
15. Seiler S. What is best practice for training intensity and duration distribution in endurance athletes? International
Journal of Sports Physiology & Performance 2010;5(3):276-291. 16. Tallis, J., James, RS., Cox, VM., Duncan, MJ., 2012. The effect of physiological concentrations of caffeine on the power
output of maximally and submaximally stimulated mouse EDL (fast) and soleus (slow) muscle. Journal of applied physiology 112: 64–71.
17. Tarnopolsky, MA. 1994. Caffeine and endurance performance. Sports Med 18: 109–125.
18. Tarnapolsky, N.A, Atkinson, S.A. 1989. Physiological responses to caffeine during endurance running in habitual caffeine
users. Med. Sci. Sport . Exer. Vol:21(2). pp:418-424.
19. Wasserman K, Whipp BJ ,Davis JA. Respiratory physiology of exercise: metabolism, gas exchange, and ventilatory
control. International review of physiology 1980;23:149-211. 20. Whitham, M., Walker, G., Bishop, N., 2006. Effect of caffeine Supplementation on the extracellular heat shock protein72
response to exercise. J Appl Physio, 101: 1222-1227.
21. Whipp BJ, Ward SA. Determinants and control of breathing during muscular exercise. British journal of sports medicine
1998;32(3):199-211. 22. Wilmore JH, Costill DL. Physiology of sport and exercise: Human Kinetics Publishers; 1994.
Annals of Tropical Medicine & Public Health-Special Issue Mar 2018 Vol V
S218-18
Mean Perineal Length in Iranian women 1
1FiroozehVeisi,
2Negin Rezavand,
3Maryam Zangeneh 2
1MD. Associated professor of Ob &Gyn Department¹.¹, Kermanshah University of Medical Sciences, 3 Kermanshah, Iran 4 2MD. Associated professor of Ob &Gyn Department¹.¹, Kermanshah University of Medical Sciences, 5 Kermanshah, Iran 6 3Associated professor of Ob &Gyn Department¹¹, Kermanshah University of Medical Sciences, Kermanshah, 7 Iran. 8 *Corresponding Author Email: [email protected] 9
Where the work was done: 10 Imam Reza Hospital, Kermanshah University of Medical Sciences, Kermanshah, Iran. 11 Presented at a meeting: Presented at the journal club in Imam Reza Hospital. 12 Department Affiliation: 13 Imam Reza Hospital, Kermanshah University of Medical Sciences, Kermanshah, Iran. 14 Phone: 00989183367165 and 00984276310 15 E-mail: [email protected] 16 Academic e-mail: [email protected] 17 18
ABSTRACT 19
Introduction. Perineal length has an important role in the diagnosis and classification of pelvic organ 20 prolapse. There are few studies on the length of perineum in different races in adults. Some studies have 21 shown that perineal length is correlated with incidence of episiotomy and severe perineal tears. The aim of 22 this study was to investigate the mean perineal length and its relationship with third- and fourth-degree 23 perineal tears in nulliparous women. 24 Materials & Methods. In this descriptive-analytical and cross-sectional study, 310 nulliparous women 25 admitted to labor wards of Imam Reza and Motazedi Hospitals in Kermanshah from between 2013 to 2015 26 were investigated. For all women, measuring the length between fourchette and anus was performed in 27 lithotomy position. If necessary, a midline or mediolateral episiotomy was performed. Degree of perineal 28 tear was determined by observation. Collected data were analyzed by SPSS-21 statistical software, Mann-29 Whitney U test and logistic regression analysis 30 Results. The mean age of women was 25.54±3.46 years and the mean perineal length was 3.21±1.11 cm. No 31 third- or fourth-degree perineal tear was observed. 261 subjects (84.2%) needed for episiotomy and their 32 mean perineal length was 2.95±0.87 cm. 49 subjects (15.8%) didn’t need for episiotomy and their mean 33 perineal length was 4.58±1.24 cm, that the difference between them was statistically significant (P<0.0001). 34 there was a significant relationship between perineal length and the need for episiotomy (P<0.0001). 35 Conclusions. The results of this study showed mean perineal length in Iranian women was 3.21±1.11 cm 36 and there was a significant relationship between perineal length and the need for episiotomy, so that 37
increasing the length of perineum reduced need for episiotomy. 38
Key Words. Mean Perineal Length, Perineal Tears, Nulliparous Women 39
40
INTRODUCTION 41
Perineal length has an important role in the diagnosis and classification of pelvic organ prolapse. In the new 42 terminology, to define the standards of pelvic organ prolapse and pelvic floor dysfunction, the length of perineum is 43

Annals of Tropical Medicine & Public Health-Special Issue Mar 2018 Vol V
S218-18
used. Perineal tears in different races are different. In one of the studies have shown that the incidence of second- 1 and higher degree tears in black women was lower than white women and most of them, at the time of delivery had 2 intact perineum [2]. The measured values of perineal length in newborns have been well calculated and recorded, 3 but in adults, there are few studies on the length of perineum in different races [3]. In another study, it was found 4 that the average length of perineum in Asian women was about one centimeter less than Caucasian women and the 5 incidence of third-degree perineal tears was more in the women with shorter perineum [4]. Other researchers in their 6 study have also reported that the incidence of third-degree and severe perineal tears was higher in Asian women 7 [5.6]. 8
Episiotomy is an incision of the perineum done by a physician or midwife to complete the second stage of labor. If 9 episiotomy is done too late, vaginal and deep perineal muscles tears occurs and if it is done too early, bleeding 10 occurs [7]. Several maternal, fetal and surgical factors affect the incidence of perineal tears. There is little 11 information about the relationship between perineal tears with perineal length as a strong risk factor [8]. The 12 incidence of episiotomy and perineal tear of posterior perineum is higher in women with perineal length less than 4 13 cm [9]. 14
In recent years, health care managers in Iran in accordance with international standards recommend the adjustment 15 of episiotomy during childbirth, but there is a fear among physicians and midwives that the lack of episiotomy may 16 cause unfavorable outcomes for mother and even baby. The aim of this study was to determine the average length of 17 the perineum in nulliparous women and its relationship with perineal tears. The rate of episiotomy in labor and type 18 of episiotomy were also noted. 19
MATERIALS & METHODS 20
In this descriptive-analytical and cross-sectional study, 310 nulliparous women admitted to labor wards of Imam 21 Reza Hospital in Kermanshah from August 2013 to August 2015 were investigated. The samples were selected by 22 non-randomized and convenience sampling. At first, the informed consent was obtained from the mothers for 23 participating in the study and measuring the length of perineum. Maternal demographic characteristics were 24 recorded. Then, in the lithotomy position, the length between fourchette and anus was measured. The measurements 25 were done by two trained medical students using the disposable paper tapes. Episiotomy was performed by a trained 26 resident of gynecology and the type of episiotomy (midline or mediolateral) was recorded. Degree of perineal tear 27 was determined by observation. Grading of perineal tears was defined as follows: In first-degree tear, fourchette, 28 perineal skin and vaginal mucosa is torn. In second-degree tear, in addition to the skin and vaginal mucosa, perineal 29 fascia and body muscles are torn. In third-degree tear, in addition to the rupture spreads to the skin, vaginal mucosa 30 and perineal body, anal sphincter is torn, and in fourth-degree tear, the rectal mucosa is torn and rectal lumen is 31 appears [10]. 32
The inclusion criteria included nulliparous women with term gestational age (greater than or equal to 37 weeks). 33 Exclusion criteria included pre-term labor, elective cesarean section, vacuum or forceps delivery, non-cephalic 34 presentation and multiple birth, history of connective tissue disease such as Ehler-Danlos, Marfan syndrome and 35 dermatomyositis, epithelial disorders of vulva, vulvar lesions such as carcinoma, herpes infection involving the 36 perineum and perineal giant condyloma. 37
Collected data were analyzed by SPSS-21 statistical software. The frequency, percentage, mean and standard 38 deviation were used to describe the data. Tables and charts were drawn to display data distribution. Mann-Whitney 39 U test was used to analyze quantitative data. Logistic regression analysis was used to analyze the relationship 40 between perineal length and the need for episiotomy and calculate Odds Ratio (OR). A significance level of 0.05 41 was considered for all tests. 42
RESULTS 43
A total of 310 nulliparous women were studied in perineal length, perineal tears and episiotomy. The mean age of 44 women was 25.54±3.46 years (range: 17-35) and the mean perineal length was 3.21±1.11 cm (range: 1-6.5). No 45 third- or fourth-degree perineal tear was observed. 46
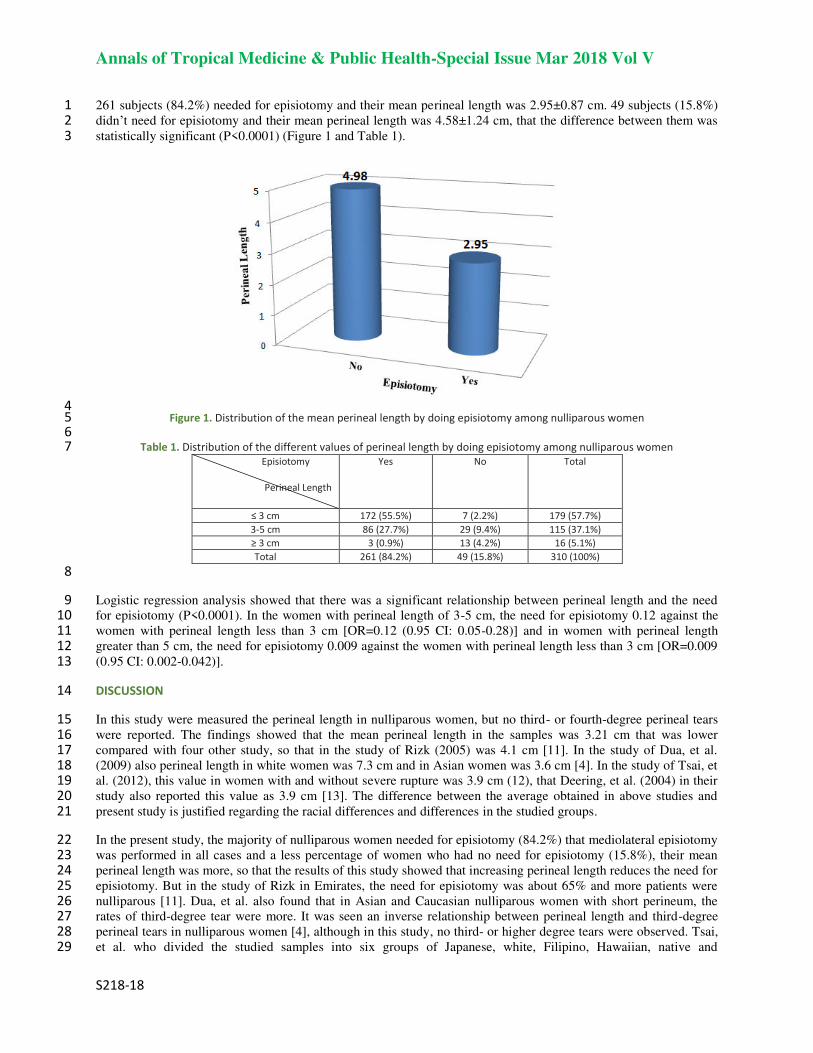
Annals of Tropical Medicine & Public Health-Special Issue Mar 2018 Vol V
S218-18
261 subjects (84.2%) needed for episiotomy and their mean perineal length was 2.95±0.87 cm. 49 subjects (15.8%) 1 didn’t need for episiotomy and their mean perineal length was 4.58±1.24 cm, that the difference between them was 2 statistically significant (P<0.0001) (Figure 1 and Table 1). 3
4 Figure 1. Distribution of the mean perineal length by doing episiotomy among nulliparous women 5
6 Table 1. Distribution of the different values of perineal length by doing episiotomy among nulliparous women 7
Total No Yes Episiotomy
Perineal Length
179 (57.7%) 7 (2.2%) 172 (55.5%) ≤ 3 cm
115 (37.1%) 29 (9.4%) 86 (27.7%) 3-5 cm
16 (5.1%) 13 (4.2%) 3 (0.9%) ≥ 3 cm
310 (100%) 49 (15.8%) 261 (84.2%) Total
8
Logistic regression analysis showed that there was a significant relationship between perineal length and the need 9 for episiotomy (P<0.0001). In the women with perineal length of 3-5 cm, the need for episiotomy 0.12 against the 10 women with perineal length less than 3 cm [OR=0.12 (0.95 CI: 0.05-0.28)] and in women with perineal length 11 greater than 5 cm, the need for episiotomy 0.009 against the women with perineal length less than 3 cm [OR=0.009 12 (0.95 CI: 0.002-0.042)]. 13
DISCUSSION 14
In this study were measured the perineal length in nulliparous women, but no third- or fourth-degree perineal tears 15 were reported. The findings showed that the mean perineal length in the samples was 3.21 cm that was lower 16 compared with four other study, so that in the study of Rizk (2005) was 4.1 cm [11]. In the study of Dua, et al. 17 (2009) also perineal length in white women was 7.3 cm and in Asian women was 3.6 cm [4]. In the study of Tsai, et 18 al. (2012), this value in women with and without severe rupture was 3.9 cm (12), that Deering, et al. (2004) in their 19 study also reported this value as 3.9 cm [13]. The difference between the average obtained in above studies and 20 present study is justified regarding the racial differences and differences in the studied groups. 21
In the present study, the majority of nulliparous women needed for episiotomy (84.2%) that mediolateral episiotomy 22 was performed in all cases and a less percentage of women who had no need for episiotomy (15.8%), their mean 23 perineal length was more, so that the results of this study showed that increasing perineal length reduces the need for 24 episiotomy. But in the study of Rizk in Emirates, the need for episiotomy was about 65% and more patients were 25 nulliparous [11]. Dua, et al. also found that in Asian and Caucasian nulliparous women with short perineum, the 26 rates of third-degree tear were more. It was seen an inverse relationship between perineal length and third-degree 27 perineal tears in nulliparous women [4], although in this study, no third- or higher degree tears were observed. Tsai, 28 et al. who divided the studied samples into six groups of Japanese, white, Filipino, Hawaiian, native and 29
Annals of Tropical Medicine & Public Health-Special Issue Mar 2018 Vol V
S218-18
Micronesians, concluded that there was not any difference between perineal length and severe perineal tears in 1 different groups [12]. Deering, et al. in USA found that patients with perineal length shorter than or equal to 2.5 cm, 2 in particular had more third- and fourth-degree tears and in patients with perineal length shorter than or equal to 3.5 3 cm, the rate of delivery by cesarean section was higher [13]. In other studies on women in East Asia such as Japan, 4 Korea and China, it was found that rate of severe perineal injuries was higher in these women and hence, Asian race 5 is as a risk factor for severe perineal tears. It seems that shorter length of the perineum in Asian women leads to 6 more perineal tears [15,14]. On the other hand, the study of Kalis, et al (2005) in UK showed that short length of the 7 perineum was not a risk factor for episiotomy or perineal tears [16] that finding is not consistent with the present 8 study. 9
CONCLUSION 10
The results of this study showed that there was a significant relationship between perineal length and the need for 11 episiotomy, so that increasing the length of perineum reduced need for episiotomy. Most nulliparous women who 12 needed for episiotomy had perineal length of about 3 cm and mean perineal length in this population is also 3 cm, 13 hence, the need or lack of need for episiotomy should be responsible for performing the delivery (physician or 14 midwife) to make their decisions according to the patient's condition 15
Although Asian race is one of the risk factors for episiotomy and in those with short perineum without doing 16 episiotomy, irregular tears occur that their repair is more difficult than regular incision of episiotomy and increase 17 the probability of third- or fourth-degree tears, But that routine episiotomy in nulliparous women who have rigid 18 perineal than multiparous women, also does not seem logical. Due to complications of episiotomy after delivery in 19 women and postpartum pain and discomfort, delaying the return to sexual intercourse, probability of opening of the 20 sutures, infection and genital prolapsed, it is suggested that it’s decided about episiotomy according to the mother's 21 mental condition, maternal height and weight and birth weight. Also, given that in this study only nulliparous 22 women with Asian descent were evaluated, it’s recommended that further studies with larger sample size were 23 performed to confirm the results of this study. 24
Acknowledgment 25
With regards to midwiferies of labor ward, Imam Reza hospital. 26
CONFLICT OF INTEREST 27
None declared. 28
REFERENCES 29
1. Bump RC, Mattiasson A, Bø K, Brubaker LP, DeLancey JO, Klarskov P, et al. The standardization of terminology of female 30 pelvic organ prolapse and pelvic floor dysfunction. Am J Obstet Gynecol 1996; 175:10-17. 31 2. Howard D, Davies PS, DeLancey JO, Small Y. Differences in perineal lacerations in black and white primiparas. Obstet Gynecol 32 2000; 96(4):622-4. 33 3. Reisner SH, Sivan Y, Nitzan M, Merlob P. Determination of anal displacement of the anus in newborn infants and children. 34 Pediatrics 1984; 73:216-17. 35 4. Dua A, Whitworth M, Dugdale A, Hill S. Perineal length: norms in gravid women in the first stage of labour. Int Urogynecol J 36 Pelvic Floor Dysfunct 2009; 20(11):1361-4. 37 5. Combs AC, Robertson PA, Laros RK. Risk factors for third and fourth degree perineal lacerations in forceps and vacuum 38 deliveries. Am J Obstet Gynecol 1990; 163:100-4. 39 6. Goldberg J, Hyslop T, Tolosa JE, Sultana C. Racial differences in severe perineal lacerations after vaginal delivery. American 40 journal of Obstetrics and Gynecology 2003; 188:1063-7. 41 7. ACOG Practice Bulletin. Episiotomy. Clinical management guidelines for obstetrician/gynecologists. Obstetrics and 42 Gynecology 2006; 107(4):957-62. 43 8. Christianson LM, Bovbjerg VE, McDavitt EC, Hullfish KL. Risk factors for perineal injury during delivery. Am J Obstet Gynecol 44 2003; 189:255-60. 45

Annals of Tropical Medicine & Public Health-Special Issue Mar 2018 Vol V
S218-18
9. Rizk DE, Thomas L. Relationship between the length of the perineum and position of the anus and vaginal delivery in 1 primigravidae. Int Urogynecol J 2000; 11:79-83. 2 10. Canningham F, Leveno K, Bloom S, Hauth J, Rouse D, Spong C. Williams Obstetrics. 23rd Ed. New York: McGRAW-Hill; 2009. 3 p. 435 4 11. Rizk DE .Determinants of the length of episiotomy or spontaneous posterior perineal lacerations during vaginal birth. Int 5 Urogynecol J 2005; 16:395-400. 6 12. Tsai PJ, Oyama IA, Hiraoka M, Minaglia S, Thomas J, Kaneshiro B. Perineal body length among different racial groups in the 7 first stage of labor. Female Pelvic Med Reconstr Surg 2012; 18(3):165-7. 8 13. Deering SH, Carlson N, Stitely M, Allaire AD, Satin AJ. Perineal body length and lacerations at delivery. J Reprod Med 2004; 9 49(4):306-10. 10 14. Dahlen HG, Ryan M, Homer C. An Australian prospective cohort study of risk factors for sever perineal trauma during 11 childbirth. Midwifery 2007; 23:196-203. 12 15. Green JR, Soohoo SL. Factors associated with rectal injury in spontaneous deliveries. Obstetrics and Gynecology 1989; 13 63(5):732-8. 14 16. Kalis V, Chaloupka P, Turek J, Rokyta Z. The perineal body length and injury at delivery. Ceska Gynekol 2005; 70(5):355-61. 15 16 17 18 19 20 21 22 23 24
25