issn 1881-7831 online issn 1881-784x dd tddtjournal.com/files/ddt_2019vol13no1_pp1_61.pdf · drug...
TRANSCRIPT

ISSN 1881-7831 Online ISSN 1881-784X
DD&TDrug Discoveries & Therapeutics
www.ddtjournal.com
Volume 13, Number 1February 2019


www.ddtjournal.com
Drug Discoveries & Therapeutics is one of a series of peer-reviewed journals of the International Research and Cooperation Association for Bio & Socio-Sciences Advancement (IRCA-BSSA) Group and is published bimonthly by the International Advancement Center for Medicine & Health Research Co., Ltd. (IACMHR Co., Ltd.) and supported by the IRCA-BSSA and Shandong University China-Japan Cooperation Center for Drug Discovery & Screening (SDU-DDSC).
Drug Discoveries & Therapeutics publishes contributions in all fields of pharmaceutical and therapeutic research such as medicinal chemistry, pharmacology, pharmaceutical analysis, pharmaceutics, pharmaceutical administration, and experimental and clinical studies of effects, mechanisms, or uses of various treatments. Studies in drug-related fields such as biology, biochemistry, physiology, microbiology, and immunology are also within the scope of this journal.
Drug Discoveries & Therapeutics publishes Original Articles, Brief Reports, Reviews, Policy Forum articles, Case Reports, News, and Letters on all aspects of the field of pharmaceutical research. All contributions should seek to promote international collaboration in pharmaceutical science.
ISSN: 1881-7831 Online ISSN: 1881-784X
CODEN: DDTRBXIssues/Year: 6
Language: EnglishPublisher: IACMHR Co., Ltd.
Editor-in-Chief:Kazuhisa SEKIMIZU Teikyo University, Tokyo, Japan
Co-Editors-in-Chief:Xishan HAO Tianjin Medical University, Tianjin, ChinaMunehiro NAKATATokai University, Hiratsuka, Japan
Chief Director & Executive Editor:Wei TANG National Center for Global Health and Medicine, Tokyo, Japan
Senior Editors:Guanhua DU Chinese Academy of Medical Science and Peking Union Medical College, Beijing, ChinaXiao-Kang LI National Research Institute for Child Health and Development, Tokyo, JapanMasahiro MURAKAMI Osaka Ohtani University, Osaka, JapanYutaka ORIHARA The University of Tokyo, Tokyo, JapanTomofumi SANTA The University of Tokyo, Tokyo, JapanHongbin SUNChina Pharmaceutical University, Nanjing, China
Fengshan WANGShandong University, Ji'nan, China
Managing Editor:Hiroshi HAMAMOTOTeikyo University, Tokyo, Japan
Web Editor:Yu CHEN The University of Tokyo, Tokyo, Japan
Proofreaders:Curtis BENTLEY Roswell, GA, USAThomas R. LEBON Los Angeles, CA, USA
Editorial and Head Office:Pearl City Koishikawa 603, 2-4-5 Kasuga, Bunkyo-ku, Tokyo 112-0003, JapanTel.: +81-3-5840-9697Fax: +81-3-5840-9698E-mail: [email protected]
Editorial Board
i

www.ddtjournal.com
Editorial Board Members
Drug Discoveries & TherapeuticsEditorial and Head OfficePearl City Koishikawa 603, 2-4-5 Kasuga, Bunkyo-ku, Tokyo 112-0003, Japan
Tel: +81-3-5840-9697, Fax: +81-3-5840-9698E-mail: [email protected]: www.ddtjournal.com
Alex ALMASAN(Cleveland, OH)John K. BUOLAMWINI(Memphis, TN)Jianping CAO(Shanghai)Shousong CAO(Buffalo, NY)Jang-Yang CHANG(Tainan)Fen-Er CHEN(Shanghai)Zhe-Sheng CHEN(Queens, NY)Zilin CHEN(Wuhan, Hubei)Xiaolan CUI(Beijing)Shaofeng DUAN(Lawrence, KS)Mohamed F. EL-MILIGI(6th of October City)Hao FANG(Ji'nan, Shandong)Marcus L. FORREST(Lawrence, KS)Takeshi FUKUSHIMA(Funabashi, Chiba)Harald HAMACHER(Tübingen, Baden-Württemberg)Kenji HAMASE(Fukuoka, Fukuoka)Junqing HAN(Ji'nan, Shandong)Xiaojiang HAO(Kunming, Yunnan)Kiyoshi HASEGAWA(Tokyo)Waseem HASSAN(Rio de Janeiro)Langchong HE(Xi'an, Shaanxi)
Rodney J. Y. HO(Seattle, WA)Hsing-Pang HSIEH(Zhunan, Miaoli)Yongzhou HU(Hangzhou, Zhejiang)Yu HUANG(Hong Kong)Amrit B. KARMARKAR(Karad, Maharashra)Toshiaki KATADA(Tokyo)Gagan KAUSHAL(Philadelphia, PA)Ibrahim S. KHATTAB(Kuwait)Shiroh KISHIOKA(Wakayama, Wakayama)Robert Kam-Ming KO(Hong Kong)Nobuyuki KOBAYASHI(Nagasaki, Nagasaki)Norihiro KOKUDO(Tokyo, Japan)Toshiro KONISHI(Tokyo)Chun-Guang LI(Melbourne)Minyong LI(Ji'nan, Shandong)Xun LI(Ji'nan, Shandong)Jikai LIU(Wuhan, Hubei)Xinyong LIU(Ji'nan, Shandong)Yuxiu LIU(Nanjing, Jiangsu)Hongxiang LOU(Jinan, Shandong)Xingyuan MA(Shanghai)
Ken-ichi MAFUNE(Tokyo)Sridhar MANI(Bronx, NY)Tohru MIZUSHIMA(Tokyo)Abdulla M. MOLOKHIA(Alexandria)Yoshinobu NAKANISHI(Kanazawa, Ishikawa)Siriporn OKONOGI(Chiang Mai)Weisan PAN(Shenyang, Liaoning)Chan Hum PARK(Eumseong)Rakesh P. PATEL(Mehsana, Gujarat)Shivanand P. PUTHLI(Mumbai, Maharashtra)Shafiqur RAHMAN(Brookings, SD)Adel SAKR(Cairo)Gary K. SCHWARTZ(New York, NY)Yuemao SHEN(Ji'nan, Shandong)Brahma N. SINGH(New York, NY)Tianqiang SONG(Tianjin)Sanjay K. SRIVASTAVA(Abilene, TX)Chandan M. THOMAS(Bradenton, FL)Li TONG(Xining, Qinghai)Murat TURKOGLU(Istanbul)Hui WANG(Shanghai)
Quanxing WANG(Shanghai)Stephen G. WARD(Bath)Yuhong XU(Shanghai)Bing YAN(Ji'nan, Shandong)Chunyan YAN(Guangzhou Guangdong) Xiao-Long YANG(Chongqing)Yun YEN(Duarte, CA)Yasuko YOKOTA(Tokyo)Takako YOKOZAWA(Toyama, Toyama)Rongmin YU(Guangzhou, Guangdong)Guangxi ZHAI(Ji'nan, Shandong)Liangren ZHANG(Beijing)Lining ZHANG(Ji'nan, Shandong)Na ZHANG(Ji'nan, Shandong)Ruiwen ZHANG(Houston, TX)Xiu-Mei ZHANG(Ji'nan, Shandong)Yongxiang ZHANG(Beijing)Jian-hua ZHU(Guangzhou, Guangdong)
(As of February 2019)
ii

www.ddtjournal.com
Role of inulin as prebiotics on inflammatory bowel disease.Wasim Akram, Navneet Garud, Ramakant Joshi
Hepatoprotective properties of Curcuma longa L. extract in bleomycin-induced chronic hepatotoxicity.Yanka D. Karamalakova, Galina D. Nikolova, Tzvetelin K. Georgiev, Veselina G. Gadjeva, Anna N. Tolekova
A new method to evaluate the enzyme-suppressing activity of a leucine aminopeptidase 3 inhibitor.Huina Wu, Wenyan Jiang, Baijian Li, Hanlin Yang, Xin Zhao, Hongan Zhang, Sensen Wang, Lili Peng, Lihua Wang, Xuejian Wang, Gong Dai, Chunyan Fang
Study of correlation of level of expression of Wnt signaling pathway inhibitors sclerostin and dickkopf-1 with disease activity and severity in rheumatoid arthritis patients.Anup Singh, Manish Kumar Gupta, Surendra Pratap Mishra
Synergistic anti-candida activities of lactoferrin and the lactoperoxidase system.Manabu Nakano, Motofumi Suzuki, Hiroyuki Wakabayashi, Kazumi Hayama,Koji Yamauchi, Fumiaki Abe, Shigeru Abe
Raised neutrophil lymphocyte ratio and serum beta hCG level in early second trimester of pregnancy as predictors for development and severity of preeclampsia.Megha Panwar, Archana Kumari, HP Anand, Rashmi Arora, Vishwajeet Singh, Reeta Bansiwal
Effects of coenzyme Q10 supplementation on diastolic function in patients with heart failure with preserved ejection fraction.Mochamad Ali Sobirin, Yan Herry, Sefri Noventi Sofia, Ilham Uddin, Sodiqur Rifqi,Hiroyuki Tsutsui
End-of-life care conferences in Japanese nursing homes.Sho Nishiguchi, Nagisa Sugaya, Masahiko Inamori
Preliminary X-ray crystallographic studies on the Helicobacter pylori ABC transporter glutamine-binding protein GlnH.Mohammad M. Rahman, Mayra A. Machuca, Anna Roujeinikova
Review
1 - 8
Original Article
9 - 16
17 - 21
22 - 27
28 - 33
34 - 37
38 - 46
47 - 51
Brief Report
52 - 58
CONTENTS Volume 13, Number 1, 2019
iii

www.ddtjournal.com
CONTENTS (Continued )
Role of LDL apheresis in a case of homozygous familial hypercholesterolemia.Talakola Naveen, Ashutosh Biswas, Naveet Wig, Manish Soneja, Pankaj Jorwal,Chitikela Sindhura Durga, Paras Singla, Charusmita Chaudhary, Upendra Baitha
Case Report
59 - 61
Guide for Authors
Copyright
iv

www.ddtjournal.com
Drug Discoveries & Therapeutics. 2019; 13(1):1-8. 1
Role of inulin as prebiotics on inflammatory bowel disease
Wasim Akram*, Navneet Garud, Ramakant Joshi
School of Studies in Pharmaceutical Sciences, Jiwaji University, Gwalior, India.
1. Introduction
Inflammatory bowel disease (IBD) refers to a variety of multifactorial dysfunctions that arise in the digestive system (1) and are recognised by intense inflammation of the gastrointestinal tract (2) due to abnormal immune responses (3). This gastrointestinal inflammation includes Crohn's disease (CD) and ulcerative colitis (UC). Recent findings revealed that IBD complication is originated from genetic, ecological and unusual immunological factors (4). The eating regimen, lifestyle and other vulnerable endogenous elements such as gut microflora are involved in the development of disease (2). The research studies proposed that the human bowel microbiota generates antigenic factors which trigger the persistent inflammation of the intestinal mucosa
as observed in CD and UC (5-7). This information has directed to an emerging therapeutic tactic that pins the microbiota of patients having IBD using agents like prebiotics (inulin) which work primarily by stimulating the growth or increasing the numbers of certain bacteria and thus quantitatively transforming the microflora (8). When prebiotics reaches to the colon are fermented by anaerobic bacteria, yielding short-chain fatty acids (SCFA). As a result, intraluminal pH decline (9). An increase of Bifidobacteria, Lactobacilli and non-pathogenic E. coli in colon are accountable for antimicrobial activity, immunomodulation, and induction of an immune response, and improvement of barrier activity that confers health benefits to the host (10-12). The management of IBD consists of employing antibiotics, immunomodulators, and biological therapies (Table 1), even though they show toxicity have less therapeutic benefits for the treatment of UC (13). In addition, the present treatments are frequently directed against the highly intense adaptive immune response of the host but fail to precise probable environmental
Summary The present review is focused on the prebiotic impact of inulin on the management of the gastrointestinal disorder. Prebiotics can be described as "non-digestible food ingredient stimulating the growth of a certain number of bacteria in the colon, which can improve the host health". In 2004 this definition was modernized to include other areas that may benefit from selective targeting of particular microorganisms: "selectively fermented ingredients that alter the configuration and activity in the gastrointestinal microbiota that confer positive effect". The positive impact of prebiotics in experimental colitis and human inflammatory bowel disease (IBD) has already been established. Prebiotics shows a positive effect in the prevention of IBD by modulating the trophic functions of the flora. Inulin enhances the growth of indigenous lactobacilli and/or bifidobacteria by inducing colonic production of short chain fatty acids (SCFA's) and these properties are related to decreased mucosal lesion scores and diminished mucosal inflammation. Inulin shows a positive approach to retain microbial populations and to support epithelial barrier function by their prebiotic effect which helps in the host defense against invasion and pathogens translocation (endogenous and/or exogenous) and in the inhibition of gastrointestinal diseases and this impact should be verified in further clinical studies. In the present review, we discussed the positive effect of prebiotics in rat IBD models and in human subjects along with their potential protective mechanisms. Preclinical and clinical data revealed that the gut mucosal barrier would be improved by the use of prebiotics in IBD.
Keywords: Inulin, prebiotics, microflora, inflammatory bowel disease
DOI: 10.5582/ddt.2019.01000Review
*Address correspondence to:Wasim Akram, School of Studies in Pharmaceutical Sciences, Jiwaji University, Gwalior, M.P-474011, India.E-mail: [email protected]

www.ddtjournal.com
Drug Discoveries & Therapeutics. 2019; 13(1):1-8.
triggers like intestinal microbiota that provokes and perpetuate these ailments (Table 2). In addition, a microbial imbalance exists between disease-causing and defensive intestinal microflora in subjects with IBD (Table 3). The above drawback led to newer approaches for the treatment of IBD-like prebiotics, probiotics or a combination of the two (synbiotics). Using prebiotics as a therapeutic agent or adjuvant to conventional therapy could prove an efficacious tool for the treatment of a series of physiological disorders. The data obtained from limited preclinical and clinical findings have studied the impact of prebiotics on UC and CD (14-16). The various research findings show that unrefined fibre-rich carbohydrates show a prominent effect on the management of CD (17).
2. Inulin a versatile biopolymer
2.1. Origin and identity
Rose, a German scientist discovered inulin in 1804 from the roots of Inulahelenium, a genus of perennial herbs of the group Compositae, inhabitants of the temperate regions of Europe, Asia, and Africa (27). Inulin was also referred by other names such ashelenin, alantin, meniantin, dahlin, sinantemin, and sinisterin. Inulin comes under a general class of fructose-
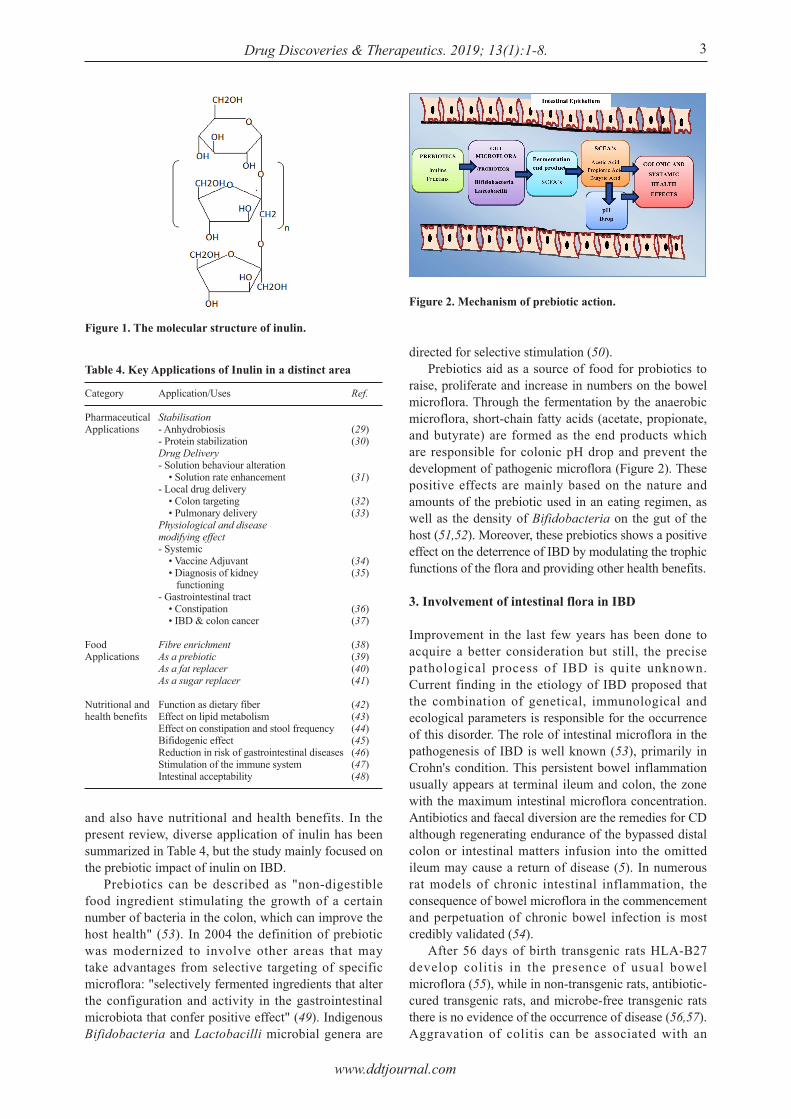
containing polymers known as fructans. Fructans assist as storage polymers in numerous members of the Compositae family such as Cichoriumintybus (chicory), Inulahelenium (elecampane), Taraxacumofficinalis (dandelion) and Helianthus tuberosus (Jerusalem artichoke). Inulin is extracted from chicory is a natural polydisperse carbohydrate (28). Inulin is a fructan which mainly comprises of 1, 2-[3-1inked d-fructofuranose units bound by an (od-132) type linkage to a terminal glucose moiety. By assessment, inulin primarily made up of linear fructose units tied by a β-(2-6) glycosidic bond (Figure 1) (31).
2.2. Versatile applications
Inulin a versatile biopolymer has a variety of applications in the Pharmaceutical arena, Food arena
2
Table 1. Outline of the approaches used for IBD (18)
Therapeutic Agent
5-AminosalicylateCorticosteroids
Immunomodulators: - Azathiopurines - 6 Mercaptopurines - Cyclosporin A - TAcrolimus - Methotrexateen
Antibiotics: - Metronidazole - Ciprofloxacin
Biological Therapies: - Adalimunab - Certolizumabpegol - Inflixmab
Probiotics & Prebiotics: - EscherichiacoliNissle1917 - Fructooligosaccharide - Glucomannanhydrolysate
Disease Conditions
Mild to moderate Mild to critical
Moderate to criticalsteroid-dependentand steroid-refractorydisease fistulising
Active
Modern tocriticalFistulising
Remission maintenance
Method of Delivery
Oral, topicalOral, topical, Intravenous
Oral, topical, injection
Oral, intravenous
Intravenous, injection, infusion
Ingestion
Table 2. Research studies that recommend intestinal microflora involvement in pathological process of IBD
Subjects retained under precise germ-free conditions do not experienceinflammation unless microorganismis introduced (19,20)In patients with CD, the number of adherent mucosal bacteria is increased (21)Inflammation arises in intestinal regionswith the maximum number of bacteria (22)Luminal and mucosa-linked microflora of IBD subjects varies from healthy subjects (23,25)Alteration of the fecal stream triggers clinical progress in Crohn's patients (25)
Table 3. Microbial imbalance among disease-causing and defensive intestinal bacteria in subjects with IBD (26)
Defensive Bacteria
Bifidobacterium Lactobacillus Streptococcus salivariusSaccharomyces boulardiiClostridium butyricumE. coli Nissle 1917Ruminococci
Disease-causing Bacteria
Selected Bacteroides Enterococcus faecalisEnterobacter cloacaeFusobacteriumIntestinal Helicobacter Entero-invasive E.coliEubacterium Peptostreptococcus
www.ddtjournal.com
Drug Discoveries & Therapeutics. 2019; 13(1):1-8. 3
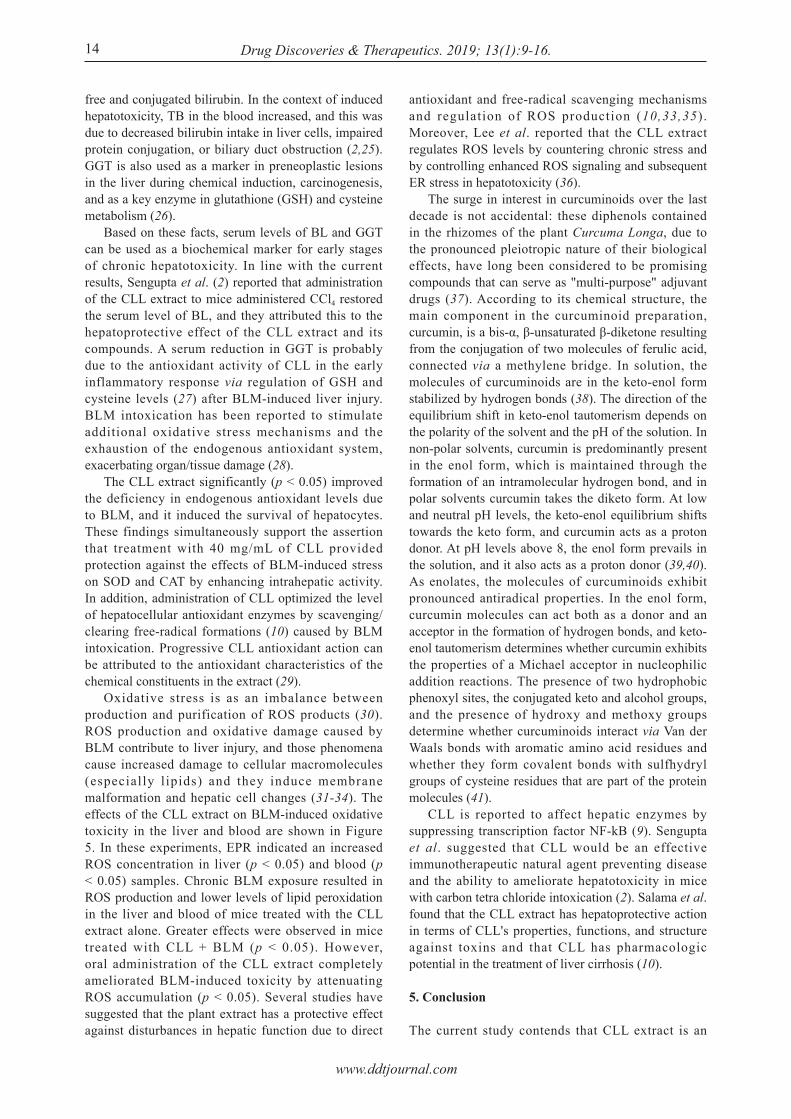
directed for selective stimulation (50). Prebiotics aid as a source of food for probiotics to raise, proliferate and increase in numbers on the bowel microflora. Through the fermentation by the anaerobic microflora, short-chain fatty acids (acetate, propionate, and butyrate) are formed as the end products which are responsible for colonic pH drop and prevent the development of pathogenic microflora (Figure 2). These positive effects are mainly based on the nature and amounts of the prebiotic used in an eating regimen, as well as the density of Bifidobacteria on the gut of the host (51,52). Moreover, these prebiotics shows a positive effect on the deterrence of IBD by modulating the trophic functions of the flora and providing other health benefits.
3. Involvement of intestinal flora in IBD
Improvement in the last few years has been done to acquire a better consideration but still, the precise pathological process of IBD is quite unknown. Current finding in the etiology of IBD proposed that the combination of genetical, immunological and ecological parameters is responsible for the occurrence of this disorder. The role of intestinal microflora in the pathogenesis of IBD is well known (53), primarily in Crohn's condition. This persistent bowel inflammation usually appears at terminal ileum and colon, the zone with the maximum intestinal microflora concentration. Antibiotics and faecal diversion are the remedies for CD although regenerating endurance of the bypassed distal colon or intestinal matters infusion into the omitted ileum may cause a return of disease (5). In numerous rat models of chronic intestinal inflammation, the consequence of bowel microflora in the commencement and perpetuation of chronic bowel infection is most credibly validated (54). After 56 days of birth transgenic rats HLA-B27 develop colitis in the presence of usual bowel microflora (55), while in non-transgenic rats, antibiotic-cured transgenic rats, and microbe-free transgenic rats there is no evidence of the occurrence of disease (56,57). Aggravation of colitis can be associated with an
and also have nutritional and health benefits. In the present review, diverse application of inulin has been summarized in Table 4, but the study mainly focused on the prebiotic impact of inulin on IBD. Prebiotics can be described as "non-digestible food ingredient stimulating the growth of a certain number of bacteria in the colon, which can improve the host health" (53). In 2004 the definition of prebiotic was modernized to involve other areas that may take advantages from selective targeting of specific microflora: "selectively fermented ingredients that alter the configuration and activity in the gastrointestinal microbiota that confer positive effect" (49). Indigenous Bifidobacteria and Lactobacilli microbial genera are
Figure 1. The molecular structure of inulin.
Table 4. Key Applications of Inulin in a distinct area
Category
Pharmaceutical Applications
Food Applications
Nutritional and health benefits
Application/Uses
Stabilisation- Anhydrobiosis- Protein stabilizationDrug Delivery- Solution behaviour alteration • Solution rate enhancement- Local drug delivery • Colon targeting • Pulmonary deliveryPhysiological and diseasemodifying effect- Systemic • Vaccine Adjuvant • Diagnosis of kidney functioning- Gastrointestinal tract • Constipation • IBD & colon cancer
Fibre enrichmentAs a prebioticAs a fat replacerAs a sugar replacer
Function as dietary fiberEffect on lipid metabolismEffect on constipation and stool frequencyBifidogenic effectReduction in risk of gastrointestinal diseasesStimulation of the immune systemIntestinal acceptability
Ref.
(29)(30)
(31)
(32)(33)
(34)(35)
(36)(37)
(38)(39)(40)(41)
(42)(43)(44)(45)(46)(47)(48)
Figure 2. Mechanism of prebiotic action.

www.ddtjournal.com
Drug Discoveries & Therapeutics. 2019; 13(1):1-8.4
amplified concentration of luminal Bacteroides species (58). In the distal intestine Bacteroides spp. is the most dominant. After surgical resection postoperative relapse of CD is related to amplify Bacteroides species (59). Most importantly, after monoassociation for 4 weeks B. vulgate causes intestinal inflammation in transgenic rats, while monoassociation with E. coli does not show any disease condition (60). As a result, all bacteria are not equivalent in their capability to cause intestinal inflammation.
4. Prebiotics in inflammatory bowel diseases
Numerous studies have verified the role of prebiotics on gut flora (Figure 3) and also verified that the metabolic functionality of the intestinal flora can be increased by utilization of prebiotics. For example, there is abundant proof revealing in human research that absorption of calcium improves by inulin-type fructans. Similarly, animal experiments have confirmed that the hepatic metabolism of lipids enhances by fermentation of oligofructose and may elude dysfunctions linked with non-alcoholic steatohepatitis and metabolic syndrome. The bulking capacity of inulin-type fructans shows benefits for metabolic bowel functions and can also help in the inhibition and treatment of constipation. The improvement in the gut barrier has also been shown by prebiotics treatment. Prebiotics are considered to be safe, non-toxic and shows a positive effect in the inhibition and management of gastrointestinal disease on the basis of large number studies on clinical trials (61-70).
4.1. Inulin effect in animal models
The prebiotics impacts on bowel inflammation already been studied in various animal models. Mice lacking IL-10 gene impulsively develop colitis. There is a low level of Lactobacillus species in the colon in the neonatal period of these mice and also have an elevation in adherent and translocated bacteria (71). The count of lactobacilli in faeces was shown to normalize by rectal delivery of Lactobacillus reuteri and this prevents the expansion of colitis. In the same animal model, mucosal
lesion scores and inflammatory activity is reduced by oral administration of either Lactobacillus salivarius or Bifidobacterium infantis (72). A genetically engineered bacterium in IL-10 knockout mouse model produces the anti-inflammatory cytokine IL-10 that prevent the onset of colitis (73). Though, the colitis provokes with the help of trinitrobenzene sulphonic acid in the rat did not diminish probiotic therapy with Lactobacillus plantarum (74). The experimental findings with probiotics have revealed that the impulsively grow inflammatory mucosal lesions in mice knockout of the IL-10 gene is prevented by increasing the amounts of lactobacilli or bifidobacteria in the colonic lumen. The inulin prebiotic impact was studied in dextran sodium sulfate (DSS) evoked distal colitis in a rat model, which histologically bears a resemblance to human UC (75). By daily administration of inulin through oral route the indigenous lactobacilli counts are amplified in the lumen of the caecum and also decrease the pH of colonic. Inulin nourishing prolonged the saccharolytic section (only right colon) that brings about an acidic atmosphere in the left colon. In the rats with DSS evoked colitis themucosal inflammation and histological damage scores are reduced by orally administered inulin (Figure 4) (75). Moreover, the rats fed with inulin exhibited a lower degree of mucosal damage and reduced harshness of crypt damage, as compared to controls. Management with orally administered inulin had been equally showing positive effect whether treatment offered ahead of or during exposure of DSS. For the management of chronic colitis making use of prebiotics are promising and also have been executed frequently in animal models (Table 5). Nourishing inulin and oligofructose combination at 5 g/kg body weight diminishes intestinal inflammation in transgenic rats (76). The model HLA-B27 transgenic rat is used to judge prebiotic action working mechanisms in chronic colitis in this research study. This positive outcome was seen with a rise of intestinal bifidobacteria and
Figure 4. Histological scores in rats with colitis provoked by dextran sodium sulfate (DSS). Insulin-treated rats (400 mg/d) indicated lower lesion scores than controls (*p < 0.05 vs. control). Inulin treatment in progress either 9 days before exposure to DSS (day ‒ 9 to + 5) or at the same time as the exposure to DSS (day 0 to + 5) and was continued for the 5 days on DSS (75)
Figure 3. Role of prebiotics on gut flora.

www.ddtjournal.com
Drug Discoveries & Therapeutics. 2019; 13(1):1-8. 5
lactobacilli. Similarly, colitis-prone rats nourish by prebiotic combination (inulin and oligofructose) decreases mucosal proinflammatory cytokines and also immunoregulatory altering growth factor-β is amplified. The research studies reported a positive effect in transgenic rats with inulin plus probiotics (77). Diminished clinical indications and amplified MUC-3 manifestation were perceived compared with control rats in dextran sodium sulphate evoked colitis rats which were nourished with goat's milk oligosaccharides (78). In trinitrobenzene sulfonates provoke colitis rats, the colonic inflammation and necrotic lesions are also reduced by goat's milk oligosaccharides as compared with control rats (79). Though, it is not necessary that all findings using prebiotics shows a positive effect. Moreau et al. (80) reported oligofructose to be worthless in fixing dextran sodium sulfate evoked intestinal inflammation in rats, and Holma et al. (81) found same inefficaciousness of galacto-oligosaccharides in trinitrobenzene sulfonate induced-intestinal inflammation in rats.
4.2. Inulin effect in human subjects
Though there exists a scarcity of human studies utilizing prebiotics, a number of the emerging finding indicate that there is a prospect of this therapy modality. After colectomy for ulcerative colitis inulin shows a positive effect in the management of chronic pouchitis (82) Furrie et al. observe the usage of synbiotics (prebiotics plus probiotics) in 18 subjects with functional UC with the help of anew randomized, double-blinded controlled trial (83). This treatment involved grouping of prebiotics inulin and oligofructose. In the synbiotic nourished group, sigmoidoscopy inflammation scores were diminished as matched with the placebo group. The levels of intestinal TNF and IL-1a were also diminished. Moreover, the rectal culture revealed more epithelial regeneration and reduced inflammation in the synbiotic-treated subjects. A tiny, open-labeled trial of 10 active CD subjects, 21 days of 15 g oligofructose and inulin
oral administration shows a substantial lowering of the illness condition (84) (Table 6).
4.3. Inulin beneficial effects in other medical conditions
Inulin also shows a positive impact in the number of gastrointestinal complication, like management of infectious colitis, toddler diarrhoea, improvement of lipid metabolism minimised the risk of chemically induced colon cancer, improved absorption of calcium, relief of constipation, and management of diet intolerance (85-92).
5. Conclusion
Inulin is a promising nutraceutical in numerous medical conditions, including IBD. It is convenient to intake, economical, and has no major toxic impacts and may develop into an interesting adjunct to standard salutary in IBD. The dietetic use of inulin proposes a potential tactic to maintain health and wellbeing and to manage the progression of disorders. In human IBD, an inflated immune influence against commensal bacteria has been validated. Bacteria locally affect cytokine signalling, mucosal intrinsic responses and mucosal inflammation can also be down-regulated by certain bacteria. Saccharolysis by inulin in the large intestine support the growth of bifidobacteria and lactobacilli. Due to these impacts, there is a reduction in mucosal inflammation of IBD as illustrated in experimental models. Bacteria producing lactic acid can prevent endogenous microorganism from reproducing and obstruct adhesion and incursion of microorganism from outside the body. In this way, the prebiotic impact of inulin shows a positive effect on the barrier function of the bowel. In this manner, the prebiotic approach is a beneficial adjunct for susceptible subjects such as patients with severe disease and subject with persistent gastrointestinal disorders, such as colonic cancer and gut inflammation. In preliminary clinical trials, promising results have been achieved, but more studies
Table 5. Prebiotic treatment on a colitis induced animal model
Ref.
Videla et al. (76)Holma et al. (82)Moreau et al. (81)Hoentjen et al. (77)Daddaoua et al. (80)Lara-Villoslada et al. (79)
Treatment
Dietary inulinGalacto-oligosaccharidesOligofructoseOligofructose-enriched inulinGoat milk oligosaccharidesGoat milk oligosaccharides
Animal Model
DSS-induced colitis in ratsTNBS-induced colitis in ratsDSS-induced colitis in ratsHLA-B27 transgenic ratHapten-induced colitis DSS-induced colitis in rats
Result
Improvement distal colitisNo reduction of colitisNo reduction of colitisReduction of colitisColitis reductionColitis reduction
Table 6. Clinical trials of prebiotic treatment in IBD
Ref.
Welters et al. (83)
Lindsay et al. (85)
Study
Double-blind placebo-controlled trial
Open-labeled trial
n
20
10
Clinical Condition
Chronic pouchitis
Active CD
Treatment
Dietary inulin24 g/d
Synergy 15 g/d
Duration of Treatment
6 week
3 week
Result
Effective in the treatment ofchronic pouchitis
Reduction of disease activity

www.ddtjournal.com
Drug Discoveries & Therapeutics. 2019; 13(1):1-8.6
are required to ensure the therapeutic use of inulin for the effective management of IBD.
Acknowledgements
The authors are please to acknowledge the financial support received from University Grant Commission (UGC) under the Scheme of "Maulana Azad National Fellowship" (MANF) and are highly obliged for their help and support in carrying out this work.
References
1. Steed H, Macfarlane GT, Macfarlane S. Prebiotics, synbiotics and inflammatory bowel disease. Mol Nutr Food Res. 2008; 5:898-905.
2. Gentschew L, Ferguson LR. Role of nutrition and microbiota in susceptibility to inflammatory bowel diseases. Mol Nutr Food Res. 2012; 56:524-535.
3. Chassaing B, Rolhion N, deValléeA, Salim SY, Prorok Hamon M, Neut C, Campbell BJ, Söderholm JD, Hugot JP, Colombel JF, Darfeuille-Michaud A. Crohn disease-associated adherent-invasive E. coli bacteria target mouse and human Peyer's patches via long polar fimbriae. J Clin Invest. 2011; 121:966-975.
4. Leenen CH, Dieleman LA. Inulin and oligofructose in chronic inflammatory bowel disease. J Nutr. 2007; 37:2572S-2575S.
5. Sartor RB. Targeting enteric bacteria in the treatment of inflammatory bowel diseases: Why, how, and when. Curr Opin Gastroenterol. 2003; 19:358-365.
6. Sartor RB. Microbial influences in inflammatory bowel diseases. Gastroenterol. 2008; 134:577-594.
7. Tannock GW. The bowel microbiota and inflammatory bowel diseases. Int J Inflam. 2010; 2010:954051.
8. Bengmark S. Pre-, pro- and synbiotics. Curr Opin Clin Nutr Metab Car. 2001; 4:571-579.
9. Govers MJ, Gannon NJ, Dunshea FR, Gibson PR, Muir JG. Wheat bran affects the site of fermentation of resistant starch and luminal indexes related to colon cancer risk: A study in pigs. Gut. 1999; 45:840-847.
10. Nerstedt A, Nilsson EC, Ohlson K, Hakansson J, Thomas SL, Lowenadler B, Svensson UK, Mahlapuu M. Administration of Lactobacillus evokes coordinated changes in the intestinal expression profile of genes regulating energy homeostasis and immune phenotype in mice. Br J Nutr. 2007; 97:1117-1127.
11. Rioux KP, Fedorak RN. Probiotics in the treatment of inflammatory bowel disease. J Clin Gastroenterol. 2006; 40:260-263.
12. Barbosa TM, Serra CR, La Ragione RM, Woodward MJ, Henriques AO. Screening for bacillus isolates in the broiler gastrointestinal tract. Appl Environ Microbiol. 2005; 71:968-978.
13. Makharia GK, Ramakrishna BS, Abraham P, et al. Survey of inflammatory bowel diseases in India. Indian J Gastroenterol. 2012; 31:299-306.
14. Rahimi R, Nikfar S, RezaieA, Abdollahi M. A meta-analysis of antibiotic therapy for active ulcerative colitis. Dig Dis Sci. 2007; 52:2920-2925.
15. Russell RI. Review article: Dietary and nutritional management of Crohn's disease. Aliment Pharmacol Ther. 1991; 5:211-226.
16. Smith PA. Nutritional therapy for active Crohn's disease. World J Gastroenterol. 2008; 14:4420-4423.
17. Basson A. Nutrition management in the adult patient with Crohn's disease. South Afr J Clin Nutr. 2012; 25:164-172.
18. Hallert C, Kaldma M, Petersson BG. Ispaghula husk may relieve gastrointestinal symptom sinulcerative colitis in remission. Scand J Gastroenterol. 1991; 26:747-750.
19. Suwannaporn P, Thepwong K, Tester R, Al-Ghazzewi F, Piggott J, Shen N, Chen Z, Chen F, Yang J, Zhang D, Tang M. Tolerance and nutritional therapy of dietary fibre from konjac glucomannan hydrolysates for patients with inflammatory bowel disease (IBD). Bio Carbo Diet Fib. 2013; 2:93-98.
20. Sellon RK, Tonkonogy S, Schultz M, Dieleman LA, Grenther W, Balish ED, Rennick DM, Sartor RB. Resident enteric bacteria are necessary for the development of spontaneous colitis and immune system activation in interleukin-10-deficient mice. Infect Immun. 1998; 66:5224-5231.
21. Geier MS, Butler RN, Howarth GS. Inflammatory bowel disease: Current insights into pathogenesis and new therapeutic options; probiotics, prebiotics, and synbiotics. Int J Food Microbiol. 2007; 115:1-11.
22. Swidsinski A, Ladhoff A, Pernthaler A, Swidsinski S, Loening-Baucke V, Ortner M, Weber J, Hoffmann U, Schreiber S, Dietel M, Lochs H. Mucosal flora in inflammatory bowel disease. Gastroenterology. 2002; 122:44-54.
23. Thompson-Chagoyan OC, Maldonado J, Gil A. Aetiology of inflammatory bowel disease (IBD): The role of intestinal microbiota and gut-associated lymphoid tissue immune response. Clin Nutr. 2005; 24:339-352.
24. Sokol H, Seksik P, Rigottier-Gois L, Lay C, Lepage P, Podglajen I, Marteau P, Doré J. Specificities of the fecal microbiota in inflammatory bowel disease. Inflamm Bowl Dis. 2006; 12:106-111.
25. Kleessen B, Kroesen AJ, Buhr HJ, Blaut M. Mucosal and invading bacteria in patients with inflammatory bowel disease compared with controls. Scand J gastroenterol. 2002; 37:1034-1041.
26. Shanahan F. Host-flora interactions in inflammatory bowel disease. Inflamm Bowl Dis. 2004; 10:S16-S24.
27. Looijer-Van Langen MA, Dieleman LA. Prebiotics in chronic intestinal inflammation. Inflamm Bowl Dis. 2009; 15:454-462.
28. Goudberg A. The utilization of inulin in the metabolism for nutritional cures. Z Exp Path Ther. 1913; 13:310-325.
29. Phelps CF. The physical properties of inulin solutions. Biochem J. 1965; 95:41.
30. Crowe JH, Hoekstra FA, Crowe LM. Anhydrobiosis. Annu Rev of Physiol. 1992; 54:579-599.
31. Hinrichs WLJ, Prinsen MG, Frijlink HW. Inulin glasses for the stabilization of therapeutic proteins. Int J Pharma. 2001; 215:163-174.
32. Srinarong P, Faber JH, Visser MR, Hinrichs WLJ, Frijlink HW. The strongly enhanced dissolution rate of fenofibrate solid dispersion tablets by incorporation of superdisintegrants. Eur J Pharm Biopharm. 2009; 73:154-161.
33. V a n d e n M o o t e r G , V e r v o o r t L , K i n g e t R . Characterization of methacrylated inulin hydrogels 845 designed for colon targeting: in vitro release of BSA. Pharm Res. 2003; 20:303-307.
34. Audouy SAL, Van der Schaaf G, Hinrichs WLJ, Frijlink

www.ddtjournal.com
Drug Discoveries & Therapeutics. 2019; 13(1):1-8. 7
HW, Wilschut J, Huckriede A. Development of a dried influenza whole inactivated virus vaccine for pulmonary immunization. Vaccine. 2011; 29:4345-4352.
35. Kumar S, Tummala H. Development of soluble inulin microparticles as a potent and safe vaccine adjuvant and delivery system. Mol Pharm. 2013; 10:1845-1853.
36. DenHond E, Geypens B, Ghoos Y. Effect of high-performance chicory inulin on constipation. Nutr Res. 2000; 20:731-736.
37. Marteau P, Jacobs H, Cazaubiel M, Signoret C, Prevel, JM, Housez B. Effects of chicory inulin in constipated elderly people: A double‐blind controlled trial. Int J Food Sci Nutr. 2011; 62:164-170.
38. Leenen CH, Dieleman LA. Inulin and oligofructose in chronic inflammatory bowel disease. J Nutr. 2007; 137:2572S-2575S.
39. Franck A. Technological functionality of inulin and oligofructose. Br J Nutr. 2002; 679 87:S287-S291.
40. Menne E, Guggenbuhl N, Roberfroid M. Fn-type chicory inulin hydrolysate has a prebiotic effect in humans. J Nutr. 2000; 130:1197-1199.
41. Kip P, Meyer D, Jellema RH. Inulins improve sensoric and textural properties of low-fat yoghurts. Int Dai J. 2006; 16:1098-1103.
42. Farzanmehr H, Abbasi S. Effects of inulin and bulking agents on some physicochemical, textural and sensory properties of milk chocolate. J Texture Stud. 2009; 40:536-553.
43. Cherbut C. Inulin and oligofructose in the dietary fiber concept. Br J Nutr. 2002; 87:S159-S162.
44. Roberfroid MB. Functional foods: Concepts and application to inulin and oligofructose. Br J Nutr. 2002; 87:S139-S143.
45. Den Hond E, Geypens B, Ghoos Y. Effect of high-performance chicory inulin on constipation. Nutr Res. 2000; 20:731-736.
46. Oliveira RP, Perego P, De Oliveira MN, Converti A. Effect of inulin as a prebiotic to improve growth and counts of a probiotic cocktail in fermented skim milk. LWT-Food Sci Technol. 2011; 44:520-523.
47. Schultz M, Munro K, Tannock GW, Melchner I, Göttl C, Schwietz H, Schölmerich J, Rath HC. Effects of feeding a probiotic preparation (SIM) containing inulin on the severity of colitis and on the composition of the intestinal microflora in HLA-B27 transgenic rats. Clin Diagn Lab Immunol. 2004; 11:581-587.
48. Benyacoub J, Rochat F, Saudan KY, Rochat I, Antille N, Cherbut C, von der Weid T, Schiffrin EJ, Blum S. Feeding a diet containing a fructooligosaccharide mix can enhance Salmonella vaccine efficacy in mice. J Nutr. 2008; 138:123-129.
49. Ripoll C, Flourié B, Megnien S, Hermand O, Janssens M. Gastrointestinal tolerance to an inulin-rich soluble roasted chicory extract after consumption in healthy subjects. Nutrition. 2010; 26:799-803.
50. Gibson GR, Probert HM, Van Loo J, Rastall RA, Roberfroid MB. Dietary modulation of the human colonic microbiota: Updating the concept of prebiotics. Nutr Res Rev. 2004; 17:259-275.
51. Tuohy KM, Probert HM, Smejkal CW, Gibson GR. Using probiotics and prebiotics to improve gut health. Drug Discov Today. 2003; 8:692-700.
52. Hui YH, Evranuz EÖ. Handbook of vegetable preservation and processing (eds.). CRC Press, 2015.
53. Sartor RB. Therapeutic manipulation of the enteric
microflora in inflammatory bowel diseases: Antibiotics, probiotics, and prebiotics. Gastroenterology. 2004; 126:1620-1633.
54. D'Haens GR, Geboes K, Peeters M, Baert F, Penninckx F, Rutgeerts P. Early lesions of recurrent Crohn's disease caused by infusion of intestinal contents in excluded ileum. Gastroenterology. 1998; 114:262-267.
55. Sartor RB. Enteric bacteria in chronic intestinal inflammation: Role in pathogenesis and therapeutic targets. Gastroenterology. 2003; 125.
56. Hammer RE, Maika SD, Richardson JA, Tang J, Taurog JD. Spontaneous inflammatory disease in transgenic rats expressing HLA-B27 and human b2m: An animal model of HLA-B27-associated human disorders. Cell. 1990; 63:1099-1112.
57. Taurog JD, Richardson JA, Croft JT, Simmons WA, Zhou M, Fernandez-Sueiro JL, Balish E, Hammer RE. The germfree state prevents the development of gut and joint inflammatory disease in HLA-B27 transgenic rats. J Exp Med. 1994; 180:2359-2364.
58. Sellon RK, Tonkonogy S, Schultz M, Dieleman LA, Grenther W, Balish E, Rennick DM, Sartor RB. Resident enteric bacteria are necessary for the development of spontaneous colitis and immune system activation in interleukin-10-deficient mice. Infect Immun. 1998; 66:5224-5231.
59. Rath H, Ikeda J, Wilson K, Sartor R. Varying cecal bacterial loads influence colitis and gastritis in HLA-B27 transgenic rats. Gastroenterology. 1999; 116:310-319.
60. Neut C, Bulois P, Desreumaux P, Membre JM, Lederman E, Gambiez L, Cortot A, Quandalle P, van Kruiningen H, Colombel JF. Changes in the bacterial flora of the neoterminal ileum after ileocolonic resection for Crohn's disease. Am J Gastroenterol. 2002; 97:939-946.
61. Rath H, Wilson K, Sartor R. Differential induction of colitis and gastritis in HLA-B27 transgenic rats selectively colonized with Bacteroides vulgatus or Escherichia coli. Infect Immun. 1999; 67:2969-2974.
62. Griffin IJ, Davila PM, Abrams SA. Non-digestible oligosaccharides and calcium absorption in girls with adequate calcium intakes. Br J Nutr. 2002; 87:S187-S191.
63. Delzenne NM, Daubioul C, Neyrinck A, Lasa M, Taper HS. Inulin and oligofructose modulate lipid metabolism in animals: A review of biochemical events and future prospects. Br J Nutr. 2002; 87:S255-S259.
64. Nyman M. Fermentation and bulking capacity of indigestible carbohydrates: The case of inulin and oligofructose. Br J Nutr. 2002; 87:S163-S168.
65. Cummings JH, Christie S, Cole TJ. A study of fructo oligosaccharides in the prevention of travellers ' diarrhoea. Aliment Pharmacol Ther. 2001; 15:1139-1145.
66. Saavedra JM, Tschernia A. Human studies with probiotics and prebiotics: Clinical implications. Br J Nutr. 2002; 87:S241-S246.
67. Olah A, Belagyi T, Issekutz A, Gamal ME, Bengmark S. Randomized clinical trial of specific lactobacillus and fiber supplement to early enteral nutrition in patients with acute pancreatitis. Br J Surg. 2002; 89:1103-1107.
68. Rayes N, Seehofer D, Hansen S, Boucsein K, Muller AR, Serke S, Bengmark S, Neuhaus P. Early enteral supply of lactobacillus and fiber versus selective bowel decontamination: A controlled trial in liver transplant recipients. Transplant. 2002; 74:123-127.

www.ddtjournal.com
Drug Discoveries & Therapeutics. 2019; 13(1):1-8.8
69. Videla S, Vilaseca J, Antolı´n M, Garcı´a-Lafuente A, Guarner F, Crespo E, Casalots J, Salas A, Malagelada JR. Dietary inulin improves distal colitis induced by dextran sodium sulfate in the rat. Am J Gastroenterol. 2001; 96:1486-1493.
70. Cherbut C, Michel C, Lecannu G. The prebiotic characteristics of fructooligosaccharides are necessary for reduction of TNBS-induced colitis in rats. J Nutr. 2003; 133:21-27.
71. Femia AP, Luceri C, Dolara P, Giannini A, Biggeri A, Salvadori M, Clune Y, Collins KJ, Paglierani M, Caderni G. Antitumorigenic activity of the prebiotic inulin enriched with oligofructose in combination with the probiotics Lactobacillus rhamnosus and Bifidobacterium lactis on azoxymethane-induced colon carcinogenesis in rats. Carcinogenesis. 2002; 23:1953-1960.
72. Madsen KL, Doyle JS, Jewell LD, Tavernini MM, Fedorak RN. Lactobacillus species prevents colitis in interleukin 10 gene-deficient mice. Gastroenterology. 1999; 116:1107-1114.
73. McCarthy J, O'mahony L, O'callaghan L, Sheil B, Vaughan EE, Fitzsimons N, Fitzgibbon J, O'sullivan GC, Kiely B, Collins JK, Shanahan F. Double-blind, placebo-controlled trial of two probiotic strains in interleukin 10 knockout mice and mechanistic link with cytokine balance. Gut. 2003; 52:975-980.
74. Steidler L, Hans W, Schotte L, Neirynck S, Obermeier F, Falk W, Fiers W, Remaut E. Treatment of murine colitis by Lactococcus lactis secreting interleukin-10. Science. 2000; 289:1352-1355.
75. Kennedy RJ, Hoper M, Deodhar K, Kirk SJ, Gardiner KR. Probiotic therapy fails to improve gut permeability in a hapten model of colitis. Scand J Gastroenterol. 2000; 35:1266-1271.
76. Videla S, Vilaseca J, Antolı´n M, Garcı´a-Lafuente A, Guarner F, Crespo E, Casalots J, Salas A, Malagelada JR. Dietary inulin improves distal colitis induced by dextran sodium sulfate in the rat. Am J Gastroenterol. 2001; 96:1486-1493.
77. Hoentjen F, Welling G, Harmsen H, Zhang X, Snart J, Tannock GW, Lien K, Churchill TA, Lupicki M, Dieleman LA. Reduction of colitis in HLAB27 transgenic rats is associated with microflora changes and immunomodulation. Inflamm Bowel Dis. 2005; 11:977-985.
78. Schultz M, Munro K, Tannock GW, Melchner I, Gottl C, Schwietz H, Schölmerich J, Rath HC. Effects of feeding a probiotic preparation (SIM) containing inulin on the severity of colitis and on the composition of the intestinal microflora in HLA-B27 transgenic rats. Clin Diagn Lab Immun. 2004; 11:581-587.
79. Lara-Villoslada F, Debras E, Nieto A, Concha A, Galvez J, Lopez- Huertas E, Boza J, Obled C, Xaus J. Oligosaccharides isolated from goat milk reduce intestinal inflammation in a rat model of dextran sodium sulfate-induced colitis. Clin Nutr. 2006; 25:477-488.
80. Daddaoua A, Puerta V, Requena P, Martinez-Ferez A, Guadix E, de Medina FS, Zarzuelo A, Suarez MD, Boza JJ, Martinez-Augustin O. Goat milk oligosaccharides are anti-inflammatory in rats with hapten-induced colitis. J
Nutr. 2006; 136:672-676. 81. Moreau NM, Martin LJ, Toquet CS, Laboisse CL, Nguyen
PG, Siliart BS, Dumon HJ, Champ MM. Restoration of the integrity of rat caecocolonic mucosa by resistant starch, but not by fructo-oligosaccharides, in dextran sulfate sodium-induced experimental colitis. Br J Nutr. 2003; 90:75-78.
82. Holma R, Juvonen P, Asmawi MZ, Vapaatalo H, Korpela R. Galactooligosaccharides stimulate the growth of bifidobacteria but fail to attenuate inflammation in experimental colitis in rats. Scand J Gastroenterol. 2002; 37:1042-1047.
83. Welters CF, Heineman E, Thunnissen FB, van den Bogaard AE, Soeters PB, Baeten CG. Effect of dietary inulin supplementation on inflammation of pouch mucosa in patients with an ileal pouch-anal anastomosis. Dis Colon Rectum. 2002; 45:621-627.
84. Furrie E, Macfarlane S, Kennedy A, Cummings JH, Walsh SV, O'Neil DA, Macfarlane GT. Synbiotic therapy (Bifidobacterium longum/Synergy 1) initiates resolution of inflammation in patients with active ulcerative colitis: A randomized controlled pilot trial. Gut. 2005; 54:242-249.
85. Lindsay JO, Whelan K, Stagg AJ, Gobin P, Al-Hassi HO, Rayment N, Kamm MA, Knight SC, Forbes A. Clinical, microbiological, and immunological effects of fructo-oligosaccharide in patients with Crohn's disease. Gut. 2006; 55:348-355.
86. Swennen K, Courtin CM, Delcour JA. Non-digestible oligosaccharides with prebiotic properties. Crit Rev Food Sci Nutr. 2006; 46:459-471.
87. Ten Bruggencate SJ, Bovee-Oudenhoven IM, Lettink-Wissink ML, Katan MB, Van Der Meer R. Dietary fructo-oligosaccharides and inulin decrease resistance of rats to salmonella: Protective role of calcium. Gut. 2004; 53:530-535.
88. Bovee-Oudenhoven IM, Ten Bruggencate SJ, Lettink-Wiss ink ML, Van der Meer R. Die tary f ructo-oligosaccharides and lactulose inhibit intestinal colonization but stimulate translocation of salmonella in rats. Gut. 2003; 52:1572-1578.
89. Osman N, Adawi D, Molin G, Ahrne S, Berggren A, Jeppsson B. Bifidobacterium infantis strains with and without a combination of oligofructose and inulin (OFI) attenuate inflammation in DSS-induced colitis in rats. BMC Gastroenterol. 2006; 6:31.
90. Mangell P, LennernÄs P, Wang M, Olsson C, AhrnÉ S, Molin G, Thorlacius H, Jeppsson B. Adhesive capability of Lactobacillus plantarum 299v is important for preventing bacterial translocation in endotoxemic rats. APMIS. 2006; 114:611-618.
91. Anderson AD, McNaught CE, Jain PK, MacFie J. Randomised clinical trial of synbiotic therapy in elective surgical patients. Gut. 2004; 53:241-245.
92. Macfarlane S, Macfarlane GT, Cummings JH. Review article: Prebiotics in the gastrointestinal tract. Aliment Pharmacol Ther. 2006; 24:701-714
(Received January 2, 2019; Revised February 20, 2019; Accepted February 25, 2019)

www.ddtjournal.com
Drug Discoveries & Therapeutics. 2019; 13(1):9-16. 9
Hepatoprotective properties of Curcuma longa L. extract in bleomycin-induced chronic hepatotoxicity
Yanka D. Karamalakova1,*, Galina D. Nikolova1, Tzvetelin K. Georgiev2, Veselina G. Gadjeva1, Anna N. Tolekova2
1 Department of Chemistry and Biochemistry, Faculty of Medicine, Trakia University, Stara Zagora, Bulgaria;2 Department of Physiology, Pathophysiology and Pharmacology, Faculty of Medicine, Trakia University, Stara Zagora, Bulgaria.
1. Introduction
The basic organ responsible for the biosynthesis, levels, and degradation of circulating biochemical compounds (proteins, enzymes, and hormones) is the liver. Consequently, the liver should be targeted in order to alter and alleviate the risk of different chronic illnesses (1,2). Liver injury continues to be among the most common of internal diseases in clinical settings. Hepatoprotectors occur a key place in the treatment of diseases, as well as in the treatment of virtually all other
liver diseases. Hepatoprotectors are complex drugs of mainly plant origin intended to increase the resistance of the liver to toxic effects; they help to restore its functions and normalize or enhance the activity of liver cell enzymes. In traditional medicine, natural plant-based antioxidants have frequently been used to treat or prevent liver disease. Many studies have indicated that the use of plant antioxidants may provide hepatoprotection by restoring the prooxidant-antioxidant balance (2), which is completely altered by the induction of oxidative stress. Curcuma longa L. (CLL, turmeric, a yellow powder) is a rhizomatous perennial herb that belongs to the Zingiberaceae family; native to India and China, it is also cultivated in places with a tropical climate (3). This plant is traditionally used in India for food and medical purposes in Ayurveda Medicine. CLL has various
Summary Curcuma longa L. (CLL) extract has previously been reported to alleviate liver damage. The current study examined the antioxidant activity of CLL by which the extract protects the liver against bleomycin (BLM)-induced hepatotoxicity in mice. The hypothesis was that CLL extract would protect the liver by reducing oxidative stress (induced superoxide dismutase (SOD) and catalase (CAT) activity), inhibiting lipid peroxidation, lowering biochemical parameters, and decreasing ROS production. Hepatic toxicity was induced by intraperitoneal injection of mice once daily with BLM (0.069 U/mL; 0.29 U/kg bw.) for a period of 4 weeks. The CLL was administered once a day for 4 weeks, 2 h prior at dose (40 mg/mL; 0.187 mg/kg/day). CLL extract significantly protected the liver, it decreased plasma bilirubin (BL) and gamma glutamyl transpeptidase (GGT), and it reduced lipid peroxidation levels. BLM intoxication produced oxidative stress, in which the antioxidant system functioned incorrectly and ROS production significantly increased. The CLL extract provided significant hepatic protection against BLM toxicity by improving SOD, CAT (p < 0.05), and MDA levels and decreasing ROS in the group receiving BLM (p < 0.05), leading to reduced membrane lipid peroxidation. Throughout this study, the CLL extract facilitated recovery from BLM-induced hepatic injury by suppressing oxidative stress. Therefore, the CLL extract has the potential to serve as an antioxidant compound to treat chronic hepatotoxicity.
Keywords: Curcuma longa L., bleomycin, plasmatic protection, MDA, ROS, hepatic protection, oxidative stress
DOI: 10.5582/ddt.2018.01081Original Article
*Address correspondence to:Dr. Yanka Karamalakova, Department of Chemistry and Biochemistry, Faculty of Medicine, Trakia University, Stara Zagora, Bulgaria.E-mail: [email protected]

www.ddtjournal.com
Drug Discoveries & Therapeutics. 2019; 13(1):9-16.
chemical, biological and pharmacological properties, including antioxidant and anti-inflammatory activities (4,5). Moreover, the anticarcinogenic activity of CLL has been reported in various chemical-induced tumors, including digestive organs (5,6), skin cancers (7), and cell lines (8-10). Although the exact mechanism by which CLL exhibits these effects has yet to be determined, the antioxidant properties of this plant seem to underlie its pleiotropic biological activities (11). Most of the biomedical and medical studies of CLL (approximately 80% of the original sources) are devoted to research on curcuminoids, which are considered to be the active principle in rhizomes. These water-insoluble diphenols of yellow-orange color, called curcumin, were isolated in their pure form as early as 1815. Subsequently, curcumin was found to be non-homogenous, and therefore this group of compounds with a similar structure and biological properties began to be called curcuminoids. Curcumin itself (curcumin I) accounts for about 70%, dimethoxycurcumin (curcumin II) accounts for 17%, bis-dimethoxycurcumin (curcumin III) accounts for 3%, and recently added cyclocurcumin (curcumin IV) accounts for about 10% (12). In preparation for the current study, numerous experimental data verified that the main components of curcumin have the ability to modulate a number of cells and body signaling pathways, either directly or indirectly. Experiments involving animal models have established that the polyphenolic components of curcuma are highly active and can be used to treat many human diseases. Due to its activity as a free-radical scavenger, CLL treatment reduces liver pathology and remodulates immune responses in murine models of acute infection (8). Antioxidants act as a radical scavenger, hydrogen/electron donor, peroxide decomposer, singlet oxygen quencher, enzyme inhibitor, synergist, and metal-chelating agent. There are two main mechanisms of antioxidants' action. The first is the chain-breaking mechanism, by which the primary antioxidant donates an electron to the free radical present in the system. The second involves elimination of reactive oxygen species (ROS)/reactive nitrogen species (RNS) by quenching the catalyst that initiates the chain. Antioxidants can influence biological systems through various mechanisms, including electron donation, chelation of metal ions, co-antioxidants, or regulation of gene expression. ROS overproduction beyond the capacity of antioxidants may result in oxidative stress, possibly causing severe metabolic malfunction (13). Cellular defense mechanisms have evolved to protect cells from ROS, and these include repair systems and detoxifying enzymes such as superoxide dismutases (SOD), catalase (CAT), and glutathione peroxidase (GPX). Moreover, ROS are involved in both initiation and promotion of multistage carcinogenesis, and tumor cells are more susceptible to oxidative stress than the surrounding
normal cells. Therefore, the aim of the current study was to investigate whether pretreatment with CLL extract against bleomycin-induced chronic hepatotoxicity in IRC mice would decrease liver oxidative stress. To achieve the ultimate goal of this research, this study examined the levels of lipid peroxidation and activity of antioxidant defense enzymes SOD and CAT in plasma samples and liver homogenates of mice treated with the antitumor drug bleomycin. Moreover, the obtained results were compared with reported levels of ROS products.
2. Materials and Methods
2.1. Preparation of a CLL extract
CLL rhizomes obtained from ABC Company, New Delhi, India were cleaned, dried, ground, and weighed. After homogenization (100% ethanol, ratio 1:10 plant to ethanol, 2 days/ 27-28.5°C) the mixture was filtered, concentrated (reduced pressure at 45-47°C, 3 days), and lyophilized (Iishin Lab Co., Ltd., USA) to a crude, dark yellow extract. The extract was stored in an airtight glass bottle and kept at 28°C. The extract was then dissolved in d. H2O before being orally administered to animals in concentrations of 40 mg/kg body weight (0.7 mL/kg body weight).
2.2. Antioxidant activity of the CLL extract in vitro
The antioxidant activity (electron donation potential assay, EDP) of the CLL extract was assayed according to the Oyaizu (1986) method (14), with slight modifications. A range of concentrations (1-500 μg/mL) was first tested to determine the concentration at which oil exhibited maximal donation potential. The reaction mixture was left for 10 minutes at 25ºC, and the absorbance was measured at 700 nm. Quercetin was used as a positive control. An increased absorbance of the reaction mixture indicates increased reducing power: % Inhibition = [(ODcontrol – ODtest) /ODcontrol] ×100.
2.3. Instruments
Biochemical analyses were performed with a UV-VIS spectrophotometer-400 (TERMO Sci., RS232C, Stratagene, USA). Electron paramagnetic resonance (EPR) was measured with the X-Band Emxmicro Spectrometer (Bruker, Germany). EPR settings were: a center field of 3,505 g, microwave power of 6.42 mw, a modulated amplitude of 5 g, and 1-5 scans. All experiments were performed in triplicate.
2.4. Experimental design and diet
Twenty-six IRC male mice weighing approximately (46
10

www.ddtjournal.com
Drug Discoveries & Therapeutics. 2019; 13(1):9-16. 11
2.7.1. Plasmatic and hepatocellular lipid peroxidation
The thiobarbituric acid (TBA) method, which measures MDA-reactive products, was used (15). In brief, 1 mL of plasma, 1 mL of physiological solution, and 1 mL of 25% trichloroacetic acid were mixed and centrifuged at 7,000 rpm for 20 min. Two mL of protein-free supernatant was mixed with 0.5 mL of 1% TBA and heated at 95°C for 1 h. After cooling, the intensity of pink color in the final fraction was determined at 532 nm. The MDA concentration was calculated according to the following formula: 1 μmol = l MDA = (OD532 × 1.75)/0.156, where OD532 is the optic density in λ = 532 nm and extinction = 1.56 × 10⁵ M‒1cm‒1.
2.7.2. Determination of superoxide dismutase activity
Erythrocyte lysates were assayed for CuZn-SOD activity as described by Sun et al. (16) with minor modifications. Briefly, the xanthine⁄xanthine oxidase system was used to generate the superoxide anion (O2ˉ). This anion reduced nitroblue tetrazolium (NBT) to formazan, which was monitored at 560 nm. SOD in the sample removes the O2ˉ and inhibits the reduction. The level of this reduction is used as a measure of SOD activity. One unit of enzymatic activity is defined as the amount of enzyme causing 50% inhibition of the reduction of NBT to formazan. Results are expressed as the units per gram of hemoglobin (U⁄ gHb).
2.7.3. Determination of CAT activity
CAT activity was estimated in erythrocyte lysate using the method of Beers and Sizer (17). Hydrogen peroxide (30 mM) was used as a substrate, and a decrease in its concentration at 22°C in phosphate buffer (50 mM, pH = 7.0) was followed at 240 nm for 1 min. One unit of CAT activity was determined to be the quantity of enzyme that removes 1 μmol H2O2 for 1 min. The results are expressed as U/gHb (units per gram of hemoglobin). The hemoglobin concentration of the lysate was determined by the cyanmethemoglobin method of Mahoney et al. (17).
2.7.4. Plasma and hepatocellular ex vivo evaluation of ROS production
One hundred mg of liver tissue homogenate and 100 μL of plasma were homogenized with 900 μL of 50 mM spin-trap N-tert-butyl-alpha-phenylnitrone (PBN) dissolved in dimethyl sulfoxide (DMSO) using sonication at one cycle for 2 min. After 5 min on ice, the suspension was centrifuged at 4,000 rpm for 10 min at 4ºС. Supernatants were transferred to cold Eppendorf tubes and immediately analyzed. The real-time formation of ROS products in the supernatant was estimated using the methods described previously (19)
± 1.2 g) were divided into four experimental groups (n = 6 of each) and given tap water and a standard pellet diet (12:12 h light-dark cycle at 40-60% humidity) at the Suppliers of Laboratory Animals for the Faculty of Medicine, Trakia University for a period of 4 weeks. This study complied with Directive 2010/63/EU and it was approved by the Ethical Committee for Animals of BABH and Trakia University, Stara Zagora, Bulgaria (131/6000-0333/09.12.2016). The first group served as controls (CG). In the second group, mice received bleomycin (BLM) at a dose of 0.069 U/mL; 0.29 U/kg body weight in saline (250 μL) injected once intraperitoneally (i.p.) on a schedule from day 1 to day 28 of the experiment. In the third group, the mice were fed CLL extract at a concentration of 40 mg/mL; 0.187 mg/kg bw (orally) via a feeding cannula for 28 days before meals. In the fourth group, the mice received both CLL extract (0.187 mg/kg bw for 20 days, orally) and BLM (0.29 U/kg body weight in saline for 28 days, i.p.). The CLL extract was given orally daily 2 h prior to BLM on a schedule until the end of the experiment. In addition, the toxicological symptoms, physiological status, and behavior (after 24 h) of IRC mice were monitored daily.
2.5. Blood and liver samples
Twenty-nine days after the start of the experiment, the mice were anesthetized with nembutal (50 mg/kg, i.p.) and sacrificed. Fresh blood (1.3-2 cm3) was collected directly from the heart in cold EDTA containers (5 cm3 Monovette, Germany). After centrifugation of blood samples (4,000 rpm at 4°C for 10 min), 200 µL of plasma from each group was stored at ‒ 40°C until further assay. The freshly collected liver (un-extravasation with cold 0.9% saline) of all six animals in each group was stored on ice. After homogenization and addition of solvents, samples were centrifuged at 4,000 rpm at 4°C for 10 min, and 300 µL of the supernatant was stored at ‒ 4°C until further assay.
2.6. Determination of serum bilirubin and gamma glutamyl transpeptidase levels
One ml of blood from each group was collected in Na3C6H5O7 tubes for assessment of specific liver biochemical markers. Blood in the cold tubes (gel-activated) was allowed to clot, and the blood was centrifuged at 4,000 rpm for 10 min/4°C. Serum samples were collected to measure the liver markers total bilirubin (TB) and gamma glutamyl transpeptidase (GGT). The markers were assayed at the Central Diagnostic Laboratory of Stara Zagora, Bulgaria and estimated using a commercially available diagnostic kit (AMRT- 2047- KJ, 2017).
2.7. Evaluation of oxidative stress markers

www.ddtjournal.com
Drug Discoveries & Therapeutics. 2019; 13(1):9-16.12
with some modifications (20).
2.8. Statistical analysis
EPR spectral processing was performed using the software Bruker Win-EPR and Sim-fonia. Statistical analysis was performed with Statistica 8.0, StatSoft, Inc. One-way ANOVA and the Student t-test were used to determine significant differences among groups. The results are expressed as the mean ± standard error (SE). A value of p < 0.05 was considered significant.
3. Results
In the current study, the CLL extract was examined as a promising protector from liver injury, and its antioxidant activity was evaluated in vitro (Figure 1) along with other biochemical values. The maximal electron donation potential of CLL (40 µg/mL) towards Fe3+ complex was observed at maximal concentration (500 µg/mL, 0.0977 ± 0.016 vs. 0.0485 ± 0.022, p < 0.05, t-test), which is higher than quercetin, which was the standard. However, this suggested that CLL and its constituents had sufficient antioxidant activity/defense to overcome hepatic oxidative disorders caused by BLM in vivo. To examine the role of CLL in hepatic toxicity, the extract was administered to animals with BLM-induced chronic toxicity. The hepatoprotective effects of the CLL extract on the development of liver toxicity, induced by prolonged (4 weeks) exposure to BLM intoxication, were determined in this study. Serum BL (39.05 ± 0.91 µmol/L vs. 13.57 ± 1.06 µmol/L; p < 0.05, t-test) and CG (50.34 ± 2.23 µmol/L vs. 19.417 ± 1.06 µmol/L; p < 0.05, t-test) levels increased significantly in the BLM group compared to those in the CG (Figure 2). Serum BL and GGT levels
increased by BLM decreased significantly after 2 h of oral pretreatment with the CLL extract (BL: 18.08 ± 0.99 µmol/L; p < 0.05 and GGT: 15.55 ± 0.089 µmol/L; p < 0.05, t-test) as an antioxidant. An examinat ion of p lasmat ic and hepat ic homogenate lipid peroxidation (MDA) is shown in Figure 3. In generally, mice with BLM intoxication had significantly higher levels of oxidative stress biomarkers than the CG, in both plasma (26.75 ± 1.56 μmol/ngPr vs. 11.588 ± 0.516 μmol/ngPr; p < 0.05, t-test) and liver homogenate (49.934 ± 2.11 μmol/ngPr vs. 21.417 ± 0.99 μmol/ngPr; p < 0.05, t-test). Notably, the CLL extract group and CLL + BLM group had significantly lower levels of hepatic and plasmatic MDA compared to levels in the BLM group (p < 0.05). Figure 4 shows that the erythrocyte SOD activity in BLM mice was significantly lower than that in the healthy controls (1,232 ± 124 U/gHb vs. 2,489 ± 345 U/gHb, p < 0.01, t-test). The same decrease was observer in liver samples from mice treated with BLM (1,627 ± 151 U/gHb vs. 2,813 ± 415 U/gHb, p < 0.01, t-test). The levels of erythrocyte SOD activity were close to those in the controls in the group treated with CCL (2,712 ± 307 U/gHb vs. 2,813 ± 415 U/gHb, p < 0.07,
Figure 1. Antioxidant activity of CLL extract in the concentration range of 0.5-500 μg/mL compared to quercetin as the positive standard. Experiments were performed in triplicate. Values are expressed as the mean ± SE. *p < 0.05 vs. standard.
Figure 2. Effect of CLL extract on serum BL (a) and GGT (b) level in BLM-intoxicated IRC mice. Experiments were performed in triplicate. Values are expressed as the mean ± SE. *p < 0.05 vs. CG group; **p < 0.05 vs. BLM group.
Figure 3. The levels of MDA measured in plasma (a) and MDA in liver cells (b). *p < 0.05 vs. CG; **p < 0.05 vs. BLM group.

www.ddtjournal.com
Drug Discoveries & Therapeutics. 2019; 13(1):9-16. 13
t-test) or with a combination of CLL + BLM (2,253 ± 4,271 U/gHb vs. 2,813 ± 415 U/gHb, p < 0.05, t-test). Liver SOD activity in the group treated with CCL alone was higher than that in controls, but not significantly so (3,071 ± 397 U/gHb vs. 2,813 ± 415 U/gHb), and activity in the group treated with a combination of CLL + BLM was close to that in controls (2,698 ± 229 U/gHb vs. 2,813 ± 415 U/gHb, t-test). Figure 5 shows that the CAT activity in both erythrocyte samples from mice treated with BLM was significantly higher than that in controls (mean: 38,274 ± 245 U/gHb vs. 13,717 ± 289 U/gHb, p < 0.01, t-test). The examined plasma indicated that activity in mice treated with CCL alone (mean: 14,121 ± 374 U/gHb vs. 13,717 ± 289 U/gHb, t-test) or a combination of BLM and CCL (20,112 ± 378U/gHb vs. 13,717 ± 289 U/gHb, t-test) was close to that in controls and significantly lower than that in the group treated with BLM alone (p < 0.01). The same increase was seen in liver homogenate samples treated with BLM (39,716 ± 377 U/gHb vs. 14,721 ± 451 U/gHb, p < 0.01, t-test). Moreover, CAT activity in liver homogenate samples was close to that in controls after treatment with CCL (15,021 ± 376 U/gHb vs. 14,721 ± 451 U/gHb, t-test) or a combination
of CCL+ BLM (19,072 ± 395 U/gHb vs. 14,721 ± 451 U/gHb, t-test). Figure 6 shows the ROS products in plasma and liver homogenate measured in arbitrary units. The ROS products in mice treated with BLM increased significantly compared to levels in controls (7.68 ± 0.89 vs. 3.59 ± 0.25, p < 0.01, t-test). However, the level of ROS products was roughly close to that in controls in the group treated with CCL (4.01 ± 0.14 vs. 3.59 ± 0.25, t-test), or with a combination of CCL + BLM (4.52 ± 0.14 vs. 3.59 ± 0.25, t-test). A significant decrease was observed in both groups compared to the group treated with BLM alone (CCL: 4.01 ± 0.14 vs. 7.68 ± 0.89, p < 0.01, t-test; and CCL + BLM: 4.52 ± 0.14 vs. 7.68 ± 0.89, p < 0.01, t-test). A significant difference was observed in the liver homogenate (Figure 5) obtained from the group treated with BLM alone compared to controls (8.62 ± 0.71 vs. 4.11 ± 0.53, p < 0.01, t-test). Moreover, insignificant differences were observed in the group treated with CCL (3.99 ± 0.22 vs. 4.11 ± 0.53, t-test) or a combination of CCL + BLM (4.34 ± 0.27 vs. 4.11 ± 0.53, t-test) vs. controls.
4. Discussion
Antitumor drugs (like bleomycin, which has cytotoxic activity resulting in the generation of toxic ROS products and oxidative organ changes) cause significant adverse reactions and, as a result, lead to irreversible oxidative disorders of liver function (10,19-21). As a consequence, this study focused on finding new therapeutic alternatives (natural combinations or plant antioxidants) to reduce, remodel, or protect from hepatic injury (2,10,22). Experimentally, BLM (dose of 0.069 U/mL; 0.29 U/kg bw. in saline) has been used to induce chronic toxicity in IRC mice to produce various grades of oxidative hepatocellular damage and damage to other tissues (23,24). Results revealed that the plasma levels of TB include
Figure 4. SOD activity in plasma and liver homogenate. *p < 0.05 vs. CG group; **p < 0.05 vs. BLM group.
Figure 5. CAT activity in plasma and liver homogenate. *p < 0.05 vs. CG group; **p < 0.05 vs. BLM group.
Figure 6. Formation of ROS products in plasma (a) and liver homogenate (b) samples expressed in Arb units. Experiments were repeated three times; *p < 0.05 vs. CG group; **p < 0.05 vs. BLM group.
www.ddtjournal.com
Drug Discoveries & Therapeutics. 2019; 13(1):9-16.14
free and conjugated bilirubin. In the context of induced hepatotoxicity, TB in the blood increased, and this was due to decreased bilirubin intake in liver cells, impaired protein conjugation, or biliary duct obstruction (2,25). GGT is also used as a marker in preneoplastic lesions in the liver during chemical induction, carcinogenesis, and as a key enzyme in glutathione (GSH) and cysteine metabolism (26). Based on these facts, serum levels of BL and GGT can be used as a biochemical marker for early stages of chronic hepatotoxicity. In line with the current results, Sengupta et al. (2) reported that administration of the CLL extract to mice administered CCl4 restored the serum level of BL, and they attributed this to the hepatoprotective effect of the CLL extract and its compounds. A serum reduction in GGT is probably due to the antioxidant activity of CLL in the early inflammatory response via regulation of GSH and cysteine levels (27) after BLM-induced liver injury. BLM intoxication has been reported to stimulate additional oxidative stress mechanisms and the exhaustion of the endogenous antioxidant system, exacerbating organ/tissue damage (28). The CLL extract significantly (p < 0.05) improved the deficiency in endogenous antioxidant levels due to BLM, and it induced the survival of hepatocytes. These findings simultaneously support the assertion that treatment with 40 mg/mL of CLL provided protection against the effects of BLM-induced stress on SOD and CAT by enhancing intrahepatic activity. In addition, administration of CLL optimized the level of hepatocellular antioxidant enzymes by scavenging/clearing free-radical formations (10) caused by BLM intoxication. Progressive CLL antioxidant action can be attributed to the antioxidant characteristics of the chemical constituents in the extract (29). Oxidative stress is as an imbalance between production and purification of ROS products (30). ROS production and oxidative damage caused by BLM contribute to liver injury, and those phenomena cause increased damage to cellular macromolecules (especially l ipids) and they induce membrane malformation and hepatic cell changes (31-34). The effects of the CLL extract on BLM-induced oxidative toxicity in the liver and blood are shown in Figure 5. In these experiments, EPR indicated an increased ROS concentration in liver (p < 0.05) and blood (p < 0.05) samples. Chronic BLM exposure resulted in ROS production and lower levels of lipid peroxidation in the liver and blood of mice treated with the CLL extract alone. Greater effects were observed in mice treated with CLL + BLM (p < 0.05). However, oral administration of the CLL extract completely ameliorated BLM-induced toxicity by attenuating ROS accumulation (p < 0.05). Several studies have suggested that the plant extract has a protective effect against disturbances in hepatic function due to direct
antioxidant and free-radical scavenging mechanisms and regulation of ROS production (10,33,35). Moreover, Lee et al. reported that the CLL extract regulates ROS levels by countering chronic stress and by controlling enhanced ROS signaling and subsequent ER stress in hepatotoxicity (36). The surge in interest in curcuminoids over the last decade is not accidental: these diphenols contained in the rhizomes of the plant Curcuma Longa, due to the pronounced pleiotropic nature of their biological effects, have long been considered to be promising compounds that can serve as "multi-purpose" adjuvant drugs (37). According to its chemical structure, the main component in the curcuminoid preparation, curcumin, is a bis-α, β-unsaturated β-diketone resulting from the conjugation of two molecules of ferulic acid, connected via a methylene bridge. In solution, the molecules of curcuminoids are in the keto-enol form stabilized by hydrogen bonds (38). The direction of the equilibrium shift in keto-enol tautomerism depends on the polarity of the solvent and the pH of the solution. In non-polar solvents, curcumin is predominantly present in the enol form, which is maintained through the formation of an intramolecular hydrogen bond, and in polar solvents curcumin takes the diketo form. At low and neutral pH levels, the keto-enol equilibrium shifts towards the keto form, and curcumin acts as a proton donor. At pH levels above 8, the enol form prevails in the solution, and it also acts as a proton donor (39,40). As enolates, the molecules of curcuminoids exhibit pronounced antiradical properties. In the enol form, curcumin molecules can act both as a donor and an acceptor in the formation of hydrogen bonds, and keto-enol tautomerism determines whether curcumin exhibits the properties of a Michael acceptor in nucleophilic addition reactions. The presence of two hydrophobic phenoxyl sites, the conjugated keto and alcohol groups, and the presence of hydroxy and methoxy groups determine whether curcuminoids interact via Van der Waals bonds with aromatic amino acid residues and whether they form covalent bonds with sulfhydryl groups of cysteine residues that are part of the protein molecules (41). CLL is reported to affect hepatic enzymes by suppressing transcription factor NF-kB (9). Sengupta et al. suggested that CLL would be an effective immunotherapeutic natural agent preventing disease and the ability to ameliorate hepatotoxicity in mice with carbon tetra chloride intoxication (2). Salama et al. found that the CLL extract has hepatoprotective action in terms of CLL's properties, functions, and structure against toxins and that CLL has pharmacologic potential in the treatment of liver cirrhosis (10).
5. Conclusion
The current study contends that CLL extract is an

www.ddtjournal.com
Drug Discoveries & Therapeutics. 2019; 13(1):9-16. 15
antioxidant that is effective in preventing chronic BLM intoxication in the liver and blood, and this study provides new findings into the pharmacologic potential of the CLL extract as protection from hepatocellular disease.
Acknowledgements
The work was supported by the Faculty of Medicine, Trakia University, Bulgaria and grants for Scientific project 6/2016 and project 1/2018.
References
1. Bishayi B, Roychowdhury S, Ghosh S, Sengupat M. Hepatoprotective and immunomodulatory properties of Tinospora cordifolia in CCl4 intoxicated mature albino rats. J Toxicol Sci. 2002; 27:139-46.
2. S e n g u p t a M , S h a r m a G D , C h a k r a b o r t y B . Hepatoprotective and immunomodulatory properties of aqueous extract of Curcuma longa in carbon tetra chloride intoxicated Swiss albino mice. Asian Pac J Trop Biomed. 2011; 1:3.
3. Dobelis I. Magic and medicine of plants. Pleasantville, NY: Reader's Digest Association. 1986; pp. 702.
4. Selvam R, Subramanian L, Gayathri R, Angayarkanni N. The anti-oxidant activity of turmeric (Curcuma longa). J Ethnopharmacol. 1995; 47:59-67.
5. Anna KT, Suhana ME, Das S, Faizah O, Hamzaini AH. Anti-inflammatory effect of Curcuma longa (turmeric) on collagen-induced arthritis: An anatomico-radiological study. Clin Ter. 2011; 162:201-207.
6. Han S, Yang Y. Antimicrobial activity of wool fabric treated with curcumin. Dyes Pigments. 2005; 64:157-161.
7. Shakeri F, Soukhtanloo M, Boskabady MH. The effect of hydro-ethanolic extract of Curcuma longa rhizome and curcumin on total and differential WBC and serum oxidant, antioxidant biomarkers in rat model of asthma. Iranian J Basic Med Scis. 2017; 20:2.
8. Allam G. Immunomodulatory effects of curcumin t reatment on murine schis tosomiasis mansoni . Immunobiology. 2009; 214:712-727.
9. Singh S, Aggarwal BB. Activation of transcription factor NF-κB is suppressed by curcumin (diferuloylmethane). J Biol Chem. 1995; 270:24995-25000.
10. Salama S, Abdulla M, AlRashdi A, Ismail S, Alkiyumi SS, Golbabapour S. Hepatoprotective effect of ethanolic extract of Curcuma longa on thioacetamide induced liver cirrhosis in rats. BMC Complement Altern Med. 2013; 13:56.
11. Nelson KM, Dahlin JL, Bisson J, Graham J, Pauli GF, Walters MA. The essential medicinal chemistry of curcumin: Miniperspective. J Med Chem. 2017; 60:1620-1637.
12. Rohman A. Analysis of curcuminoids in food and pharmaceutical products. Int Food Res J. 2012; 19:19-27.
13. Komsiyska D. Oxydative stress and post-stroke depression. Tr Jof Scie. 2018; 3:249-253.
14. Oyaizu M. Studies on products of browning reaction. Jpn J Nutr. 1986; 44.
15. Plaser Z, Cushman L, Jonson B. Estimation of product of
lipid peroxidation (malonyl dialdehyde) in biochemical systems. Anal Biochem. 1966; 16:359-364.
16. Sun Y, Oberley LW, Li Y. A simple method for clinical assay of superoxide dismutase. Clin Chem. 1988; 34:497-500.
17. Beers R, Sizer T. Spectrophotometric method for measuring the breakdown of hydrogen peroxide by catalase. J Biol Chem. 1952; 195:133-138.
18. Mahoney J, Vreman H, Stevenson D, Van Kessel AL. A measurement of carboxy hemoglobin and total hemoglobin by five specialized spectrophotometers (CO-oximeters) in comparison with reference methods. Clin Chem. 1993; 39:1693-1700.
19. Shi H, Sui Y, Wang X, Luo Y, Ji L. Hydroxyl radical production and oxidative damage induced by cadmium and naphthalene in liver of Carassius auratus. Comp Biochem Physiol C Toxicol Pharmacol. 2005; 140:115-121.
20. Zheleva A, Karamalakova Y, Nikolova G, Kumar R, Sharma R, Gadjeva V. A new antioxidant with natural origin characterized by Electron Paramagnetic Resonance spectroscopy methods. Biotechnol Biotechnol Equip. 2012; 26:146-150.
21. Sleijfer S. Bleomycin-induced pneumonitis. Chest. 2001; 120:617-624.
22. Reinert T, Baldotto CS, Nunes FA, Scheliga AA. Bleomycin-induced lung injury. J Cancer Res. 2013; 2013:480608.
23. Moeller A, Ask K, Warburton D, Gauldie J, Kolb M. The bleomycin animal model: A useful tool to investigate treatment options for idiopathic pulmonary fibrosis? Int J Biochem Cell Biol. 2008; 40:362-382.
24. He Y, Yue Y, Zheng X, Zhang K, Chen S, Du Z. Curcumin, inflammation, and chronic diseases: How are they linked? Molecules. 2015; 20:9183-9213.
25. Walters D, Kleeberger S. Mouse models of bleomycin-induced pulmonary fibrosis. Curr Protoc Pharmacol. 2008; 5:46.
26. Verma R, Kushwah L, Gohel D, Patel M, Marvania T, Balakrishnan S. Evaluating the ameliorative potential of quercetin against the bleomycin-induced pulmonary fibrosis in wistar rats. Pulm Med. 2013; 2013:921724.
27. Rothuizen J. Important clinical syndromes associated with liver disease. Vet Clin North Am Small Anim Pract. 2009; 39:419-437.
28. Hanigan M, Pitot H. Gamma-glutamyl transpeptidase-its role in hepatocarcinogenesis. Carcinogenesis. 1985; 6:165-172.
29. Pardo A, Ruiz V, Arreola JL, Gaxiola M, Barrios R, Kala SV, Lieberman MW, Selman M. Bleomycin-induced pulmonary fibrosis is attenuated in γ-glutamyl transpeptidase-deficient mice. Am J Respir Crit Care Med. 2003; 167:925-932.
30. Abidi A, Aissani N, Sebai H, Serairi R, Kourda N, Ben Khamsa S. Protective effect of Pistacia lentiscus oil against bleomycin-induced lung fibrosis and oxidative stress in rat. Nutr Cancer. 2017; 69:490-497.
31. Li S, Yuan W, Deng G, Wang P, Yang P, Aggarwal BB. Chemical composition and product quality control of turmeric (Curcuma longa L.). Pharm Crops. 2011; 2:28-54.
32. Behrman HR, Kodaman PH, Preston SL, Gao S. Oxidative stress and the ovary. J Soc Gynecol Investig. 2001; 8(1 Suppl Proceedings):S40-42.
33. Singh R, Wang Y, Schattenberg JM, Xiang Y, Czaja MJ.

www.ddtjournal.com
Drug Discoveries & Therapeutics. 2019; 13(1):9-16.16
Chronic oxidative stress sensitizes hepatocytes to death from 4-hydroxynonenal by JNK/c-Jun overactivation. Am J Physiol Gastrointest Liver Physiol. 2009; 297:G907-17.
34. Nikolova G, Komsiyska D, Karamalakova, Y, Petkov Y, Ivanov V, Manolova T, Gadjeva1 V. Real time oxidative stress markers of patients with post-stroke depression: EPR study. Bulg Chem Commun. 2018; 50:64-68.
35. Misra HP, Rabideau C. Pirfenidone inhibits NADPH-dependent microsomal lipid peroxidation and scavenges hydroxyl radicals. Mol Cell Biochem. 2000; 204:1-2.
36. Lee H, Kim S, Lee G, Choi M, Jung H, Kim Y, Kwon H, Chae H. Turmeric extract and its active compound, curcumin, protect against chronic CCl4-induced liver damage by enhancing antioxidation. BMC Complement Altern Med. 2016; 16:316.
37. Girish C, Koner BC, Jayanthi S, Ramachandra Rao K, Rajesh B, Pradhan SC. Hepatoprotective activity of picroliv, curcumin and ellagic acid compared to silymarin on paracetamol induced liver toxicity in mice.
Fundam Clin Pharmacol. 2009; 23:735-745. 38. Lee H, Kim S, Lee G, Choi M, Chung H, Lee Y, Kim
H, Kwon H, Chae H. Curcumin and Curcuma longa L. extract ameliorate lipid accumulation through the regulation of the endoplasmic reticulum redox and ER stress. Sci Rep. 2017; 7:6513.
39. Wiggers H, Zaioncz S, Cheleski J, Mainardes RM, Khalil NM. Curcumin, A Multitarget Phytochemical: Challenges and Perspectives. In: Studies in Nat Prod Chem. Elsevier, 2017; 53:243-276.
40. Esatbeyoglu T, Huebbe P, Ernst IM, Chin D, Wagner AE, Rimbach G. Curcumin-from molecule to biological function. Angew Chem Int Ed Engl. 2012; 51:5308-5332.
41. Priyadarsini K. The chemistry of curcumin: From extraction to therapeutic agent. Molecules. 2014; 19:20091-20112.
(Received December 15, 2018; Revised February 4, 2019; Accepted February 25, 2019

www.ddtjournal.com
Drug Discoveries & Therapeutics. 2019; 13(1):17-21. 17
A new method to evaluate the enzyme-suppressing activity of a leucine aminopeptidase 3 inhibitor
Huina Wu1,§, Wenyan Jiang1,§, Baijian Li2, Hanlin Yang1, Xin Zhao1, Hongan Zhang1, Sensen Wang1, Lili Peng1, Lihua Wang3, Xuejian Wang1, Gong Dai1,*, Chunyan Fang1,*
1 School of Pharmacy, Weifang Medical University, Weifang, Shandong, China;2 Weifang Municipal Hospital, Weifang, Shandong, China;3 Molecular Oncology Laboratory, Weifang Medical University, Weifang, Shandong, China.
1. Introduction
Leucine aminopeptidases (LAPs) are zinc-containing metalloproteinases and members of the aminopeptidase M1/M17 family (1). These enzymes can catalyze the hydrolysis of leucine residues from the N-terminus of a protein or peptide substrate (2). LAP3 was originally discovered by R.J. Trumbly (3). Since LAP3 is an LAP, its expression is closely related to the activation of
peptide substrates. In breast cancer, LAP3 also enhances the invasion of breast cancer cells (4). Studies have found that knocking down LAP3 will make hepatocellular carcinoma cells more sensitive to cisplatin, thereby promoting cell death in those cells (5). In addition, the malignant transformation of human esophageal squamous cell carcinoma also results from overexpression of LAP3 (6). Therefore, LAP3 expression during the development of a tumor is particularly important. The synthesis of LAP3 inhibitors has attracted considerable interest because of the aforementioned findings. Thus, evaluating the suppression of enzyme activity is essential to developing an LAP3 inhibitor. Currently, there is no method with which to evaluate the suppression of human LAP3 enzyme activity. Only Sigma (Cat. L5006) provides enzymes to evaluate
Summary The expression of leucine aminopeptidase 3 (LAP3) is associated with the prognosis for and malignant transformation of many types of tumors. Therefore, a LAP3 inhibitor may represent a new strategy for cancer therapy. Evaluating the suppression of enzyme activity by an LAP3 inhibitor is essential. Right now, leucine aminopeptidases (LAPs) purified from the porcine kidneys are the only enzymes that can be used to evaluate the suppression of enzyme activity by an LAP3 inhibitor. This approach cannot accurately reflect the suppression of human LAP3 by an inhibitor. The current study developed a new method with which to evaluate the suppression of enzyme activity by an LAP3 inhibitor. Total protein from K562 cells seldom catalyzed the LAP3 substrate. A lentivirus was used to induce K562 cells to overexpress LAP3 (K562-LAP3). After puromycin screening, flow cytometry data indicated that 98.8% of cells expressed green fluorescent protein. The expression of LAP3 in K562-LAP3 cells was also assessed using Western blotting. K562-LAP3 cells were lysed with ultrasonication. Total protein was used as an enzyme source and L-leucine p-nitroaniline hydrochloride was used as a substrate to measure enzyme activity. Total protein from K562-LAP3 cells catalyzed the substrate more than that from K562 cells did. The LAP3 inhibitor ubenimex was used as a positive control to evaluate the suppression of LAP3 enzyme activity. Results indicated that ubenimex significantly inhibited the enzyme activity of LAP3. This approach provides a convenient and accurate way to evaluate the suppression of enzyme activity by an LAP3 inhibitor.
Keywords: Leucine aminopeptidase 3, enzyme activity, K562-LAP3 cells, inhibitor
DOI: 10.5582/ddt.2019.01005Original Article
§These authors contributed equally to this work. *Address correspondence to:Drs. Chunyan Fang and Gong Dai, School of Pharmacy, Weifang Medical University, Weifang, Shandong 261053, China.E-mail: [email protected] (C.F.), [email protected] (G.D.)

www.ddtjournal.com
Drug Discoveries & Therapeutics. 2019; 13(1):17-21.
suppression of LAP enzyme activity (7). However, this enzyme is derived from the porcine kidney. The amino acid sequence and structure of human and porcine LAP3 differ (Figure S1, http://www.ddtjournal.com/action/getSupplementalData.php?ID=39). This may cause a problem since some compounds may suppress the enzyme activity of porcine LAP3 but not human LAP3 (8). The current study developed a new method to evaluate the suppression of enzyme activity by an LAP3 inhibitor in vitro. Enzymes expressed in K562 cells did not strongly catalyze the LAP3 substrate. Therefore, a lentivirus was used to stably overexpress LAP3 in K562 cells (K562-LAP3). Enzymes obtained from K562-LAP3 cells lysed with ultrasonication were used as an enzyme source to examine the suppression of LAP3 activity by compounds. This method is convenient and easy to perform, so it can continuously and easily provide enzymes and accurately allow evaluation of the suppression of human LAP3 by an LAP3 inhibitor.
2. Materials and Methods
2.1. Cell culture
The human erythroleukemia cell line K562 was purchased from the China Infrastructure of Cell Line Resources (Beijing, China). K562 cells were maintained in RPMI-1640 medium supplemented with 10% fetal bovine serum and cultured in humidified air with 5% CO2 at 37°C.
2.2. Western blotting
Whole-cell protein was extracted from cell homogenate and lysed in RIPA buffer (20 mM Tris pH 7.5, 150 mM NaCl, 1 mM EDTA, 1 mM EGTA, 1% NP-40, and 50 mM sodium fluoride) supplemented with a protease inhibitor cocktail. The samples were subjected to sodium dodecyl sulfate polyacrylamide gel electrophoresis and then transferred to polyvinylidene fluoride membranes. Membranes were blocked with 10% skim milk and incubated with specific primary antibodies overnight at 4°C. The membranes were then incubated with antibodies. All antibodies were as follows: LAP3 (SANTA CRUZ, sc-376270), β-actin (SANTA CRUZ, sc-1616).
2.3. Flow cytometry
Cells were suspended at 5 × 10⁵ cells/100 µL and incubated for 60 min at room temperature with an anti-LAP3 mono clonal antibody (Abcam, ab154809) (London, England). After cells were washed in PBS, the samples were resuspended in phosphate buffer saline (PBS) containing 1% FBS. Labeled cells were subsequently analyzed with flow cytometry on BD FACScan.
2.4. Lentivirus infection
Lentivirus particles were purchased from Genechem. Lentivirus (LV)-enhanced green fluorescent protein (EGFP) was transduced into cells. The medium was replaced with fresh culture medium after 12 h. Cells were observed under a fluorescence microscope for transduction efficiency. Cells with stable expression were screened using puromycin.
2.5. Monoclonal cell screening
Equal dilution was used. One hundred cells/200 μL was added to the first row of wells, 100 μL of medium was added to other wells, 100 μL of cells was removed from the first row with a Pasteur pipette and added to the second row, cells were mixed, 100 μL of cells was removed from the second row and added to the third row, and so on, until the last row. K562 cells stably overexpressing LAP3 were generated from only a single cell in a well.
2.6. Enzymatic activity
K562-LAP3 and K562 cells were re-suspended in PBS. Cells were disrupted with ultrasonication and seeded onto 96-well plates. Cells were combined with 1.6 mM LAP3 substrate (L-leucine p-nitroaniline hydrochloride) for 30 min at 37℃. Enzyme activity was measured at 405 nm. The analysis of data was as follows: Rate of inhibition = (expression in control group ‒ expression in experimental group)/ expression in control group × 100%. Here, expression in the control group = wild-type expression, and expression in the experimental group = wild-type expression plus overexpression due to transduction.
2.7. Statistical analysis
All experiments were performed at least three times, and results are expressed as the mean ± SD. Differences between groups were determined using the Student's t test.
3. Results
3.1. K562 cells were used to overexpress LAP3
In addition to LAP3, other enzymes may also catalyze the LAP3 substrate. Therefore, the current study selected cells that minimally catalyze the substrate to reduce the influence of other enzymes. Total enzymes from several cell lines obtained via ultrasonication were tested for their ability to catalyze the substrate, including K562, PLC/RRF/5, and MDA-MB-231 (Figure 1). Results indicated that K562 had the least ability to catalyze the substrate. In addition, a large number of cells can easily
18

www.ddtjournal.com
Drug Discoveries & Therapeutics. 2019; 13(1):17-21. 19
be obtained because K562 cells are suspended cells and not adherent cells.
3.2. LAP3 overexpression in K562 cells via lentivirus infection
K562 cells were transduced with a lentivirus to overexpress LAP3. After puromycin screening, 98.8% of cells expressed GFP (Figure 2A). The cells were used to generate monoclonal cells. Twelve monoclonal cells were obtained, and enzyme activity was measured. No. 35 strongly catalyzed the substrate and was used in the subsequent experiment (K562-LAP3). K562-LAP3 cells exhibited higher enzyme activity than K562 cells (Figure 2B). GFP was observed under fluorescence microscopy (Figure S2, http://www.ddtjournal.com/action/getSupplementalData.php?ID=39). Cells overexpressing LAP3 expressed a high level of LAP3 compared to parental cells (Figure 2C). In summary, K562-LAP3 cells expressed a high level of LAP3 and potently catalyzed the substrate.
3.3. K562-LAP3 cells can be used as an enzyme source to detect the suppression of enzyme activity by an LAP3 inhibitor
To further identify the enzyme activity of LAP3, ultrasound lysates of K562 and K562-LAP3 cells were incubated with the LAP3 inhibitor ubenimex. Results indicated that ubenimex inhibited the enzyme activity of LAP3 in a dose-dependent manner (Figure 3). This finding verified the hypothesis that K562-LAP3 cells can
Figure 1. Catalyzing effects of different cell lines on substrates. Cells were lysed with ultrasound. Total protein was transferred to 96-well plates. One-point-six mM LAP3 substrate was added to the wells. Plates were incubated at 37°C for 30 min. Absorbance at 405 nm was measured. Each bar represents the mean ± SD. *p < 0.05, **p < 0.01.
Figure 2. Infection of K562 cells with a lentivirus to overexpress LAP3. K562 cells were resuspended in complete culture medium, and 4 × 10⁵ TU/mL of virus particles was seeded onto 96-well plates. The lentivirus LV-LAP3 was diluted with ENi.S or medium and added to each well. Simultaneously, polybrene was added to 10 μM as a viral infection adjuvant. The medium was replaced with completed culture medium after 12 h. After three days, cells with stable expression were screened using puromycin. Flow cytometry (A), an enzyme activity assay (B), and Western blotting (C) were used to test transduction efficiency.
Figure 3. The LAP3 inhibitor ubenimex inhibits enzyme activity in K562-LAP3 cells. K562-LAP3 cells were lysed with ultrasound and transferred to 96-well plates. Ubenimex was added to the wells. The concentration of the drug was 25, 100, or 400 μM. After 5 min, the LAP3 substrate was added to 1.2 mM. After incubation at 37°C, absorbance was determined at 405 nm. The data were processed using the formula shown in the article. The experimental results were from three independent experiments, and similar results were obtained.

www.ddtjournal.com
Drug Discoveries & Therapeutics. 2019; 13(1):17-21.20
be used to evaluate the suppression of enzyme activity by an LAP3 inhibitor.
4. Discussion
LAP3 plays a key function in the tissues and cells of plants, animals, and microorganisms (1). LAP3 has been found to play an increasing number of roles in the development of various diseases, such as ovarian epithelial malignancy, breast cancer, endometrial cancer, human esophageal squamous cell carcinoma, and diabetes (6,9-13). Nonetheless, what is more interesting is the role that LAP3 inhibitors could play in treating disease. There is no method with which to evaluate the suppression of human enzyme activity by an LAP3 inhibitor. Only LAP enzyme from porcine kidney microsomes (Sigma, Cat. L5006) can be used as an enzyme source to evaluate the suppression of enzyme activity. However, the amino acid sequence and structure of human and porcine LAP differ. Therefore, there is no guarantee that an inhibitor would suppress human LAP3 in the same manner as it suppresses porcine LAP. Thus, a new method was devised to detect that suppression. The current study used K562 cells, which weakly catalyze a substrate, as a cell source. K562 cells are suspended cells. They do not need to be digested, and they are easy to handle (14). There are some other enzymes that can catalyze the substrate in addition to LAP3 (15). The weak reaction of the enzyme from K562 cells with the substrate indicated little interference by other enzymes. All of this indicated that K562 cells were proper candidate cells. A lentivirus was used to overexpress LAP3 in K562 cells. Lentiviral infection has several unique advantages. An exogenous gene can be stably integrated into a host chromosome in comparison to transient transfection. In addition, a lentivirus also expresses GFP in cells, and this feature can be used to evaluate infection efficiency. In addition, a lentivirus vector also carries the puromycin resistance gene, which can be used to promote infection efficiency and maintain stable expression. K562-LAP3 cells stably express LAP3 with a good reproducibility and specificity. This cell line can be cultured to obtain enough LAP3 to evaluate the suppression of LAP3 activity by a compound. The rate of inhibition was calculated by subtracting expression by parental cells from expression by overexpressing cells. Therefore, this formula only represents the suppression of LAP3, and it eliminates the influence of other enzymes that catalyze the substrate. This guarantees that LAP3 is the only variable in this experiment, accurately reflecting the suppression of LAP3 by an inhibitor.
5. Conclusion
In this experiment, K562 cells overexpressed LAP3 as a
result of lentivirus infection. The total proteins of K562-LAP3 cells served as an enzyme source, and L-leucine p-nitroanilide hydrochloride served as a substrate to measure suppression by an LAP3 inhibitor. Expression by parental cells was subtracted from expression by overexpressing cells, so the data reflected only the suppression of LAP3 enzyme activity. Therefore, this method is an accurate, economical, and convenient way to evaluate the activity of an LAP3 inhibitor.
Acknowledgements
This work was supported by the Shandong Project for Government-sponsored Study Abroad and the National Natural Science Foundation of China (81503108, 81472489), the Shandong Project for Science and Technology in Higher Education (J17KA255), the Weifang Project for Development of Science and Technology (2017YX064), the Shandong Project for Development of Science and Technology (2014GGB14403), and the Project for College Student Innovation in Science and Technology (KX2017061).
References
1. M a t s u i M , F o w l e r J H , W a l l i n g L L . L e u c i n e aminopeptidases: diversity in structure and function. Biol Chem. 2006; 387:1535-1544.
2. Tsujimoto M, Goto Y, Maruyama M, Hattori A. Biochemical and enzymatic properties of the M1 family of aminopeptidases involved in the regulation of blood pressure. Heart Fail Rev. 2008; 13:285-291.
3. Trumbly RJ, Bradley G. Isolation and characterization of aminopeptidase mutants of Saccharomyces cerevisiae. J Bacteriol. 1983; 156:36-48.
4. Wang X, Shi L, Deng Y, Qu M, Mao S, Xu L, Xu W, Fang C. Inhibition of Leucine Aminopeptidase 3 Suppresses Invasion of Ovarian Cancer Cells through Down-regulation of Fascin and MMP-2/9. Eur J Pharmacol. 2015; 768:116-122.
5. Tian SY, Chen SH, Shao BF, Cai HY, Zhou Y, Zhou YL, Xu AB. Expression of leucine aminopeptidase 3 (LAP3) correlates with prognosis and malignant development of human hepatocellular carcinoma (HCC). Int J Clin Exp Pathol. 2014; 7:3752-362.
6. Zhang S, Yang X, Shi H, Li M, Xue Q, Ren H, Yao L, Chen X, Zhang J, Wang H. Overexpression of leucine aminopeptidase 3 contributes to malignant development of human esophageal squamous cell carcinoma. J Mol Histol. 2014; 45:283-292.
7. Kannan Sivaraman K, Paiardini A, Sieńczyk M, Ruggeri C, Oellig CA, Dalton JP, Scammells PJ, Drag M, McGowan S. Synthesis and structure-activity relationships of phosphonic arginine mimetics as inhibitors of the M1 and M17 aminopeptidases from Plasmodium falciparum. J Med Chem. 2013; 56:5213-5217.
8. Wang X, Zhang L, Yang K, Zhang C, Zhang J, Fang H, Xu W.. The Effect of Different Species Aminopeptidase N Structure on the Activity Screening of Aminopeptidase N Inhibitor. Biol Pharm Bull. 2010; 33:1658-1665.
9. Shibata K, Kikkawa F, Mizokami Y, Kajiyama H,

www.ddtjournal.com
Drug Discoveries & Therapeutics. 2019; 13(1):17-21. 21
Ino K, Nomura S, Mizutani S. Possible Involvement of Adipocyte-Derived Leucine Aminopeptidase via Angiotensin II in Endometrial Carcinoma. Tumour Biol. 2005; 26:9-16.
10. Mizutani S, Shibata K, Kikkawa F, Hattori A, Tsujimoto M, Ishii M, Kobayashi H. Essential role of placental leucine aminopeptidase in gynecologic malignancy. Expert Opin Ther Targets. 2007; 11:453-461.
11. Pilar Carrera M, Ramírez-Expósito MJ, Dueñas B, Dolores Mayas M, Jesús García M, De la Chica S, Cortés P, Ruíz-Sanjuan M, Martínez-Martos JM. Insulin-regulated aminopeptidase/placental leucil Aminopeptidase (IRAP/P-lAP) and angiotensin IV-forming activities are modified in serum of rats with breast cancer induced by N-methyl-nitrosourea. Anticancer Res. 2006; 26:1011-1014.
12. Keller SR, Scott HM, Mastick CC, Aebersold R, Lienhard
GE. Cloning and Characterization of a Novel Insulin-regulated Membrane Aminopeptidase from Glut4 Vesicles. J Biol Chem. 1995; 270:23612-23618.
13. Keller SR. Role of the Insulin-Regulated Aminopeptidase IRAP in Insulin Action and Diabetes. Biol Pharm Bull. 2004; 27:761-764.
14. Klein E, Ben-Bassat H, Neumann H, Ralph P, Zeuthen J, Polliack A, Vánky F. Properties of the K562 cell line, derived from a patient with chronic myeloid leukemia. Int J Cancer. 1976; 18:421-431.
15. Bernkop-Schnürch, Zarti H, Walker G F. Thiolation of polycarbophil enhances its inhibition of intestinal brush border membrane bound aminopeptidase N. J Pharm Sci. 2001; 90:1907-1914.
(Received November 17, 2018; Revised February 15, 2019; Accepted February 28, 2019)
www.ddtjournal.com
Drug Discoveries & Therapeutics. 2019; 13(1):22-27.22
Study of correlation of level of expression of Wnt signaling pathway inhibitors sclerostin and dickkopf-1 with disease activity and severity in rheumatoid arthritis patients
Anup Singh1,*, Manish Kumar Gupta2, Surendra Pratap Mishra3
1 Department of Geriatric Medicine, Institute of Medical Sciences, Banaras Hindu University, Varanasi, Uttar Pradesh, India;2 Department of General Medicine, Institute of Medical Sciences, Banaras Hindu University, Varanasi, Uttar Pradesh, India;3 Department of Biochemistry, Institute of Medical Sciences, Banaras Hindu University, Varanasi, Uttar Pradesh, India.
1. Introduction
Rheumatoid arthritis (RA) is characterised by symmetrical peripheral polyarthritis of unknown aetiology. It is most common form of chronic inflammatory arthritis which results in significant joint damage and disability. Hallmark of inflammatory process in RA includes synovial inflammation and proliferation, focal bone erosion, and thinning of articular cartilage. The mechanism underlying osteolysis in RA depends on
osteoclasts roles in shifting the normal balance between bone formation and resorption. The Wnt-β catenin signalling pathways has been found to be a critical regulator of bone and cartilage homeostasis in adult. Canonical Wnt signaling is initiated by its binding to frizzled receptors and co-receptors 'LDL receptor related proteins 5 and 6' (LRP5/6) which leads to β-catenin stabilization, nuclear translocation and activation of target genes such as Wnt-induced signaling protein-1 (WISP-1) (1). Wnt signaling is modulated by soluble antagonists including dickkopf-1 (DKK1), secreted frizzled related proteins (sFRPs), and sclerostin. Sclerostin is encoded by the SOST gene located on chromosome 17q12-q21 in humans. In humans, it was originally believed to be a non-classical bone
Summary This study was done with aim to assess the serum sclerostin and dickkopf-1 (DKK-1) level in patients of rheumatoid arthritis (RA) and to correlate their level with disease activity and bone mineral density. Fifty patients of RA and equal age and sex matched healthy controls were included in the study. Patients were evaluated clinically and investigated with routine blood tests along with rheumatoid factor (RF), anti-citrullinated protein antibody (anti-CCP2), radiographs and bone mineral density (BMD). Serum sclerostin and DKK-1 levels of both cases and controls was assayed by using enzyme-linked immunosorbent assay (ELISA) assay [RayBio®, Georgia, USA with coefficient of variation percent (CV %), < 10%] and compared with disease activity and bone mineral density. Disease activity was measured by Disease Activity Score 28 (DAS28) along with Modified Health Assessment Questionnaire (MHAQ) score. Mean serum sclerostin and DKK-1 was significantly higher in study group as compared to control group. Serum sclerostin showed significant correlation with disease activity scores (DAS score and MHAQ score), erythrocyte sedimentation rate (ESR) and C-reactive protein (CRP) level. Serum sclerostin at level of 394 pg/mL was found to have diagnostic significance with sensitivity of 100% and specificity of 90%. DKK-1 level shows significantly positive correlation with larson score which denotes radiological progression (r value 0.468; p value 0.001). More studies with larger sample size of RA patients are needed for better determination of the role of sclerostin and DKK-1 in RA. Also, the correlation of these and other bone turn over markers will help decipher their role with disease progression in RA patients.
Keywords: Sclerostin, dikkopf 1, rheumatoid arthritis, C-reactive protein
DOI: 10.5582/ddt.2019.01011Original Article
*Address correspondence to:Dr. Anup Singh, Department of Geriatric Medicine, Institute of Medical Sciences, Banaras Hindu University, Varanasi-221005, Uttar Pradesh, India.E-mail: [email protected]

www.ddtjournal.com
Drug Discoveries & Therapeutics. 2019; 13(1):22-27.
morphogenetic protein (BMP) antagonist (2). However, recently sclerostin has been identified as inhibitor the Wnt signaling pathway by binding to LRP5/6 receptors resulting in decreased bone formation. Sclerostin is expressed in osteocytes and some chondrocytes and inhibits bone formation by osteoblasts (3,4). In RA bone loss may be limited to the peri-articular region or can be systemic. This process involves pro-inflammatory cytokines produced by the synovial membrane, which may increase bone resorption but also stimulate soluble antagonists of the canonical Wnt/β-catenin signaling pathway, including DKK-1 and sclerostin, and subsequently inhibit osteoblast proliferation, maturation and progenitor differentiation (5). Role of sclerostin has been found in various studies in bone remodeling in osteoarthritis and ankylosing spondylitis (6,7). Serum sclerostin levels depend on genetic aspects, age, sex, adiposity, renal function and presence or absence of diabetes mellitus (8). Sclerostin is a nonspecific product of osteocytes, however it is also produced by chondrocytes and cementocytes as well as in the liver, vascular wall and kidney (9). It has been reported earlier in few studies that serum levels of sclerostin and DKK-1 are increased in patients with juvenile idiopathic arthritis (JIA) and is mediated by tumor necrosis factor (TNF)-α (10). Very few studies have done to find levels of sclerostin and DKK-1 in RA patients, therefore the present study was done to correlate serum sclerostin and serum DKK-1 level with disease activity, inflammatory profile and severity in rheumatoid arthritis patients.
2. Materials and Methods
2.1. Study design
A case control study was done between June 2016 to June 2018 in Division of Rheumatology/Medicine, Sir Sunderlal Hospital BHU, a tertiary centre in eastern Uttar Pradesh, India after taking approval from Institute's ethical committee. Informed consent was taken from the patients. All RA patients of age > 15 years diagnosed by 2010 ACR/EULAR criteria (American rheumatology criteria/European League Against Rheumatism) were included in study. Exclusion criteria included patients of age less than 15 years, patients on treatment of disease modifying anti rheumatic drug, evidence of steroid use in past 1 month, calcium supplement in last 3 months and presence of diabetes mellitus, chronic kidney disease and chronic liver disease.
2.2. Study population and sample
A total of 50 cases of RA were taken and equal number of age-sex matched controls were taken. Each of sample
selected on basis of inclusion and exclusion criteria. No formal method of sample size calculation was made as it was a pilot study.
2.3. Methodology and statistical analysis
After detailed clinical history and examination all patients were evaluated with investigations like complete blood counts, liver function test, random blood sugar, RF (rheumatoid factor) titre, CRP titre, anti-cyclic citrullinated peptide (anti CCP2). X-ray of bilateral hands, wrist and feet were also obtained and Larsen scoring was done for each (11). Bone marrow density (BMD) was obtained for each patient (12). Disease activity was measured by Disease Activity Score (DAS28) along with Modified Health Assessment Questionnaire (MHAQ) score for all patients (13,14). Serum sclerostin was done using enzyme-linked immunosorbent assay (ELISA) method [RayBio® Human SOST ELISA Kit, Georgia, USA, intra-assay coefficient of variation percent (CV%), < 10% and inter-assay CV%, < 12%)] and DKK1 measurement was done by RayBio® Human DKK-1 ELISA Kit, Georgia, USA with intra-assay coefficient of variation percent (CV%), < 10% and inter-assay CV%, < 12%. The statistical analysis was done using statistical software SPSS for windows (Version 16.0). Chi-square test was used for categorical variables. For continuous data Student's t test and Mann Whitney U test were used. One way analysis of variance (ANOVA) test was used for comparing three groups of mean. For correlating two continuous data Spearman’s correlation coefficient was used. P-value < 0.05 is considered as statistically significant.
3. Results
3.1. Demographic and biochemical data
Out of 50 cases, there were 4% patients in age group (11-20 years), 12% patients in age group (21-30 years), 32% patients in age group (31-40 years), 24% patients in age group (41-50 years), 22% patients in age group (51-60 years) and 6% patients in age group > 60 years. Among cases, males were 18% (n = 9) and rest 82% (n = 41) were females where as in control 54% (n = 27) were male and 46% (n = 23) were females. Male to female ratio in study group was 1:4.5 which shows statistically significant female predominance of disease. Comparison of various hematological and biochemical parameters of cases and control is shown in Table 1. Comparison of BMD, T score, Z score and sclerostin in case and control is shown in Table 2.
3.2. Serum sclerostin and its correlation with other parameters
23

www.ddtjournal.com
Drug Discoveries & Therapeutics. 2019; 13(1):22-27.24
28 score (542.06 ± 56.29 pg/mL) which suggested that serum sclerostin level increases with the severity of disease (Table 4). DAS score, MHAQ score, Larsen score, rheumatoid factor (RF) level, anti CCP level, CRP titer and ESR titer was found significantly higher in cases as compared to control group suggesting that as disease severity increases the levels of these parameters increase. Serum sclerostin level showed significant correlation with disease activity scores (DAS score and
Mean serum sclerostin was 526.75 ± 54.61 pg/mL was significantly higher than the control group (361.59 ± 24.37 pg/mL). Comparison of DAS28, MHAQ, Larson score and other parameter between cases and control is shown in Table 3. In our study, we found 1 patient with low (2.6-3.2) DAS 28 score with serum sclerostin level of 488.13 pg/mL. Thirteen patients (n = 13) had moderate DAS 28 score (3.2-< 5.1) with mean serum sclerostin level of 487.29 ± 20.51 pg/mL and 36 patient had high DAS
Table 1. Comparison of hematological and biochemical parameters of cases and control
Parameter
Age (in years)Hb (hemoglobin in gm/dL)TLC (total leucocyte count/mm3)Neutrophils (/mm3)Lymphocyte (/mm3)RBS (Random blood sugar mg/dL)Creatinine(mg/dL)Urea (mg/dL)Na (sodium mmol/L)K (potassium mmol/L)Total protein (gm/dL)Albumin (gm/dL)Calcium (mg/dL)Phosphate (mg/dL)Platelet (/mm3)Aspartate transaminase (AST U/L)Alanine transaminase (ALT U/L)Total bilirubin (mg/dL)
Case (Mean ± SD)
41.30 ± 12.971 10.816 ± 1.6564
8,995.92 ± 3,427.541 67.02 ± 10.103 22.58 ± 9.123
105.52 ± 18.801 0.852 ± 0.2159 27.58 ± 10.186138.52 ± 4.205
4.140 ± 0.5383 7.698 ± 0.6196 3.860 ± 0.5739 9.070 ± 0.8279 3.454 ± 0.8452
2.60 (1.80 - 3.41) 22 (19.00 - 33.25)21.0 (16.00 - 31.25) 0.50 (0.30 - 0.60)
Control(Mean ± SD)
33.58 ± 11.770 12.146 ± 1.7736
7,803.00 ± 1,723.276 71.28 ± 6.919 21.80 ± 5.026
104.56 ± 10.958 0.779 ± 0.2015 21.56 ± 5.372137.28 ± 2.963
3.746 ± 0.5319 7.236 ± 0.4615 3.740 ± 0.4686 9.598 ± 0.6278 3.786 ± 0.8119
2.6 (1.97-3.42) 20.5 (17.75-25.00) 22.0 (18.75-26.25) 0.80 (0.50 - 0.90)
p-value
0.002< 0.001 0.030 0.016 0.598 0.756 0.084< 0.001 0.091< 0.001< 0.001 0.255< 0.001 0.048 0.828 0.107 0.926< 0.001
Table 2. Comparison of various parameter in cases and control
Variables
DAS28 score MHAQMHAQ ScoreLarsen ScoreRF titreAnti CCP2 titreCRP titerESR titerDKK-1(in pg/mL)BMD (gm/cm2)T SCOREZ SCORESclerostin (in pg/mL)
Case Group
5.25 (2.4 - 6.5) 3.0 (2.00 - 3.00)
> 1.8 (1.3 - ≥ 1.8) 20-30 (20 - 40)
94.50 (29.98 - 175.75)333.50 (132.50 - 548.72)
1.84 (1.06 - 5.10) 46.0 (35.75 - 55.25)
309.00 (196.64 - 494.45) 0.958 ± 0.2354 - 2.030 ± 1.3348 -1.416 ± 1.0305
526.75 ± 54.61573
Control Group
1.0 (1.0 - 1.0) < 1.3 (< 1.3) <10 (< 10)
20.0 (15.00 - 21.00) 2.0 (0.10 - 0.60) 05.0 (0.4 - 0.60)
14 .00 (10.0 - 18.25)110.61(109.00 - 159.77) 0.940 ± 0.1468 -1.248 ± 1.0737 -.926 ± 0.9722
361.59 ± 24.37903
p-value
< 0.001< 0.001< 0.001< 0.001< 0.001< 0.001< 0.001< 0.001< 0.001 0.647 0.002 0.016< 0.001
DAS28: Disease Activity score; RF: Rheumatoid factor; Anti CCP2: Anti-cyclic citrullinated peptide; DKK-1: Dikkopf-1; BMD: Bone mineral density; MHAQ: Modified Health Assessment Questionnaire.
Table 3. DAS 28 score and serum sclerostin level
DAS28 score
2.6 - 3.23.2- < 5.1> 5.1Total
No. of patients (n)
1133650
Serum sclerostin level, Mean ± SD
488.130 ± 0.0 487.296 ± 20.5182 542.068 ± 56.2989 526.748 ± 54.6157
DAS28: Disease Activity score; RF: Rheumatoid factor; Anti CCP2: Anti-cyclic citrullinated peptide; DKK-1: Dikkopf-1; BMD: Bone mineral density; MHAQ: Modified Health Assessment Questionnaire.
f-value
6.114
p-value
0.004
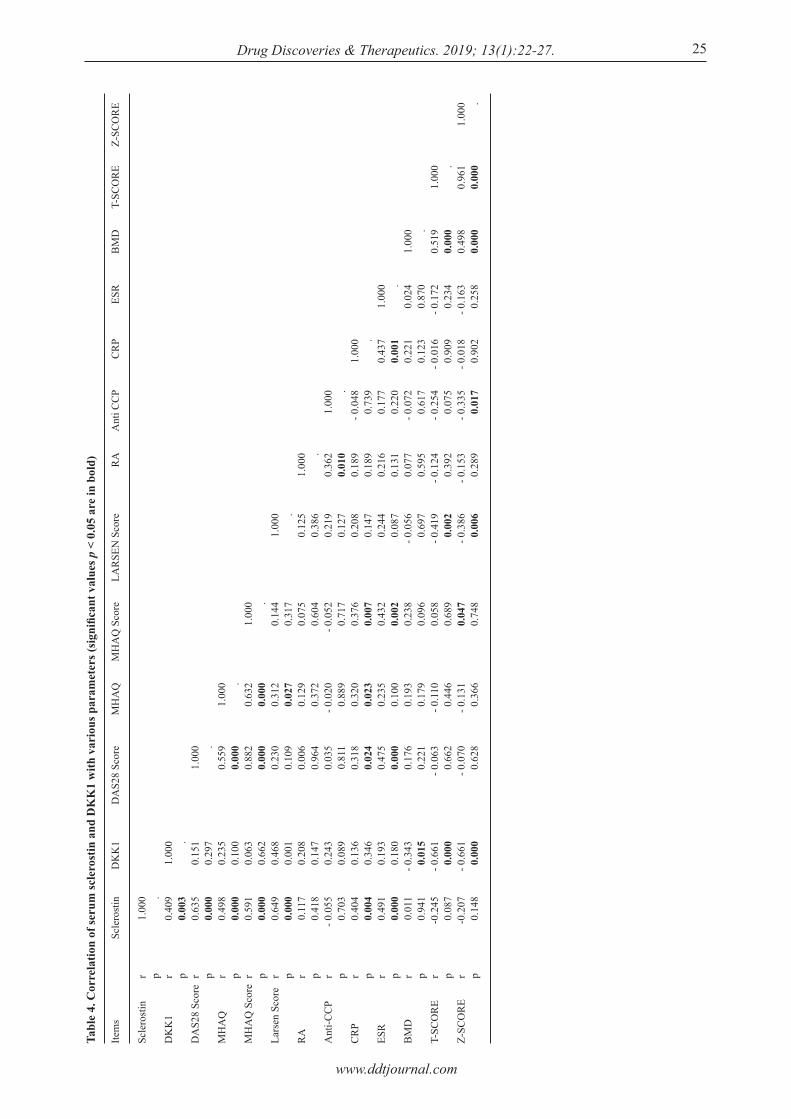
www.ddtjournal.com
Drug Discoveries & Therapeutics. 2019; 13(1):22-27. 25
Tabl
e 4.
Cor
rela
tion
of se
rum
scle
rost
in a
nd D
KK
1 w
ith v
ario
us p
aram
eter
s (si
gnifi
cant
val
ues p
< 0
.05
are
in b
old)
Item
s
Scle
rost
in
DK
K1
DA
S28
Scor
e
MH
AQ
MH
AQ
Sco
re
Lars
en S
core
RA
Ant
i-CC
P
CR
P
ESR
BM
D
T-SC
OR
E
Z-SC
OR
E
r p r p r p r p r p r p r p r p r p r p r p r p r p
Scle
rost
in
1.00
0 .0.
409
0.00
30.
635
0.00
00.
498
0.00
00.
591
0.00
00.
649
0.00
00.
117
0.41
8- 0
.055
0.70
30.
404
0.00
40.
491
0.00
00.
011
0.94
1-0
.245
0.08
7-0
.207
0.14
8
DK
K1
1.00
0 .0.
151
0.29
70.
235
0.10
00.
063
0.66
20.
468
0.00
10.
208
0.14
70.
243
0.08
90.
136
0.34
60.
193
0.18
0- 0
.343
0.01
5- 0
.661
0.00
0- 0
.661
0.00
0
DA
S28
Scor
e
1.00
0 .0.
559
0.00
00.
882
0.00
00.
230
0.10
90.
006
0.96
40.
035
0.81
10.
318
0.02
40.
475
0.00
00.
176
0.22
1- 0
.063
0.66
2- 0
.070
0.62
8
MH
AQ
1.00
0 .0.
632
0.00
00.
312
0.02
70.
129
0.37
2- 0
.020
0.88
90.
320
0.02
30.
235
0.10
00.
193
0.17
9- 0
.110
0.44
6- 0
.131
0.36
6
MH
AQ
Sco
re
1.00
0 .0.
144
0.31
70.
075
0.60
4- 0
.052
0.71
70.
376
0.00
70.
432
0.00
20.
238
0.09
60.
058
0.68
90.
047
0.74
8
LAR
SEN
Sco
re
1.00
0 .0.
125
0.38
60.
219
0.12
70.
208
0.14
70.
244
0.08
7- 0
.056
0.69
7 -
0.41
90.
002
- 0.3
860.
006
RA
1.00
0 .0.
362
0.01
00.
189
0.18
90.
216
0.13
10.
077
0.59
5- 0
.124
0.39
2- 0
.153
0.28
9
Ant
i CC
P
1.00
0 .- 0
.048
0.73
90.
177
0.22
0- 0
.072
0.61
7- 0
.254
0.07
5- 0
.335
0.01
7
CR
P
1.00
0 .0.
437
0.00
10.
221
0.12
3- 0
.016
0.90
9- 0
.018
0.9
02
ESR
1.00
0 .0.
024
0.87
0- 0
.172
0.23
4- 0
.163
0.25
8
BM
D
1.00
0 .0.
519
0.00
00.
498
0.00
0
T-SC
OR
E
1.00
0 .0.
961
0.00
0
Z-SC
OR
E
1.00
0 .
www.ddtjournal.com
Drug Discoveries & Therapeutics. 2019; 13(1):22-27.26
MHAQ score), ESR and CRP level. Serum sclerostin at level of 394 pg/mL showed a diagnostic positive predictive value (PPV) and negetive predictive value (NPP) of 90.9% and 100% respectively and had diagnsotic sensitivity of 100% and specificity of 90%.
3.3. Serum DKK-1 and its correlation with other parameters
DKK-1 level was found significantly higher in cases as compared to control group. Among cases it was found to be 309.00 pg/mL (196.64-494.45) in cases and in controls it was 110.61 pg/mL (109.00-159.77). Eighteen (n = 18) patient with RA with T score < ‒2.5 (more negative) had higher mean DKK-1 level of 512.59 pg/mL as compared to 269.44 pg/mL found in rest 32 RA patients with T score > ‒2.5 (more positive). However, it was not significant. DKK1 level shows significantly positive correlation with larson score which denotes radiological progression (r value 0.468; p value 0.001). A significant negative correlation was also found with with BMD (r value ‒0.343) and T score(r value 0.661).
4. Discussion
RA is associated with both local and systemic bone loss. Bone remodelling is effected by sclerostin and DKK-1 which act by inhibiting the Wnt/β-catenin signalling pathway (15). The study aimed to find a correlation between these inhibitors and disease activity in RA patients. In the study, we found mean haemoglobin level in RA group to be significantly lower than the control group and anaemia was found in overall 82% of cases. Previous studies have shown that anaemia develops in 30-70% of patients with RA (16). Similar results were seen in a study by Smyrnova Ganna et al. where 64% of cases were found to have anaemia compared to healthy population (17). Above observation reinforced the fact that anaemia is common in patient with rheumatoid arthritis as compared to healthy population and usually anaemia of chronic disease was seen. Mean ca lc ium level was a lso found to be significantly lower in RA group (9.070 ± 0.8279 mg/dL) as compared to healthy control (9.598 ± 0.6278 mg/dl). In a study conducted by Scott et al. mean calcium level was found to significantly lower compared to healthy group (18). It suggested that RA patient are associated with low calcium level as compared to healthy population and importance of adding calcium supplement with other treatment options in RA. Serum sc leros t in leve ls were found to be significantly higher in cases as compared to controls (p < 0.001). Further, significant correlation between serum sclerostin with DAS28 score suggested that as DAS28 score increases serum sclerostin increases. In
our study serum sclerostin at level of 394 pg/mL has positive predictive value (PPV) and negetive predictive value (NPP) of 90.9% and 100% respectively and had diagnsotic sensitivity of 100% and specificity of 90%. In a study by El-Bakry S et al., serum sclerostin at a level of 267 ng/mL showed a diagnostic sensitivity of 96.8% and specificity of 66.7% with PPV and NPV of 96.6% and 90% respectively (19). Results from above studies suggests that it can be used for new diagnostic tool for rheumatoid arthritis. In our study, we found that mean serum sclerostin in RA patient with osteoporosis was 536.95 pg/mL which was similar to serum sclerostin in RA without osteoporosis (521.01 pg/mL). Similar finding were found in study by Mehaney DA et al., where no significant correlation was found between sclerostin level, BMD or T scores were found (20). From above finding it could be suggested that although serum sclerostin has diagnostic significance and correlate well with disease activity, it cannot be used as marker of bone destruction. The mean DKK-1 level was also found to be significant higher in RA patients as compared to controls and correlated significantly with larsen score, BMD and T score which suggest bone destruction. Another study by Wang et al. showed that DKK-1 levels in RA patients were significantly higher than levels in healthy controls, and correlated with the Sharp score of radiological changes (r = 0.449, p = 0.001) in RA (5). Study by Raphaèle Seror et al. also showed that the mean baseline DKK-1 level was higher among RA patients with radiological changes than without radiological progression (29.6 ± 13.3 vs. 26.63 ± 12.4 pmol/L) (p = 0.0084) (21). In study by Jun Tian et al. mean DKK-1 in control with osteoporosis was 55.25 ± 10.13 ng/mL and in control without osteoporosis was 40.19 ± 10.69 ng/mL (p value < 0.001) (22). Above results suggests that as rheumatoid arthrtis is chronic disease having bone destructive effect, therefore DKK-1 in RA patient was found higher than the control healthy group. Higher DKK-1 in healthy population with osteoporosis than non-osteoporosis suggest that DKK-1 can be used as a marker of osteoporosis. Results comparision between our study and previous studies suggest that as disease progress and bone distruction increase, serum level of DKK1 will increase. Hence serum DKK1 can used as marker for bone destruction and osteoporosis. Limitations of our study includes small sample size, use of low sensitivity ELISA method and limited investigation with respect to bone turnover and calcium and vitamin D metabolism. More studies on larger population is needed to delineate the role of sclerostin in RA patients as diagnostic marker. Also, more studies on serum sclerostin, DKK-1 and other bone turn over markers will delineate their role in bone remodelling mechanism in rheumatoid arthritis.
www.ddtjournal.com
Drug Discoveries & Therapeutics. 2019; 13(1):22-27. 27
Acknowledgements
We thank Physician Research Foundation, Association of Physician of India for funding the research. We would also like to thank Prof. Shyam Sundar, Professor in Medicine, IMS, BHU for support and guidance and Dr.Shivi Jain, Assistant Professor in Radiodiagnosis, IMS, BHU for helping in reading X-ray during study.
References
1. B Blom A, L van Lent P, M van der Kraan P, B van den Berg W. To seek shelter from the WNT in osteoarthritis? WNT-signaling as a target for osteoarthritis therapy. Curr Drug Targets. 2010; 11:620-629.
2. Winkler DG, Sutherland MK, Geoghegan JC, Yu C, Hayes T, Skonier JE, Shpektor D, Jonas M, Kovacevich BR, Staehling‐Hampton K. Osteocyte control of bone formation via sclerostin, a novel BMP antagonist. EMBO J. 2003; 22:6267-6276.
3. Ellies DL, Viviano B, McCarthy J, Rey JP, Itasaki N, Saunders S, Krumlauf R. Bone density ligand, Sclerostin, directly interacts with LRP5 but not LRP5G171V to modulate Wnt activity. J Bone Miner Res. 2006; 21:1738-1749.
4. Voorzanger-Rousselot N, Ben-Tabassi NC, Garnero P. Opposite relationships between circulating Dkk-1 and cartilage breakdown in patients with rheumatoid arthritis and knee osteoarthritis. Ann Rheum Dis. 2009; 68:1513-1514.
5. Wang SY, Liu YY, Ye H, Guo JP, Li R, Liu X, Li ZG. Circulating Dickkopf-1 is correlated with bone erosion and inflammation in rheumatoid arthritis. J Rheumatol. 2011; 38:821-827.
6. Power J, Poole KE, van Bezooijen R, Doube M, Caballero‐Alías AM, Lowik C, Papapoulos S, Reeve J, Loveridge N. Sclerostin and the regulation of bone formation: Effects in hip osteoarthritis and femoral neck fracture. J Bone Miner Res. 2010; 25:1867-1876.
7. Appel H, Ruiz‐Heiland G, Listing J, Zwerina J, Herrmann M, Mueller R, Haibel H, Baraliakos X, Hempfing A, Rudwaleit M. Altered skeletal expression of sclerostin and its link to radiographic progression in ankylosing spondylitis. Arthritis Rheum. 2009; 60:3257-3262.
8. Kuipers AL, Zhang Y, Yu S, Kammerer CM, Nestlerode CS, Chu Y, Bunker CH, Patrick AL, Wheeler VW, Mil jkovic I . Relat ive inf luence of her i tabi l i ty, environment and genet ics on serum sclerost in. Osteoporos Int. 2014; 25:905-912.
9. Chan B, Fuller E, Russell A, Smith S, Smith M, Jackson M, Cake M, Read R, Bateman J, Sambrook P. Increased chondrocyte sclerostin may protect against cartilage degradation in osteoarthritis. Osteoarthritis Cartilage. 2011; 19:874-885.
10. Brabnikova-Maresova K, Jarosova K, Pavelka K, Stepan JJ. Serum sclerostin in high-activity adult patients with juvenile idiopathic arthritis. Arthritis Res Ther. 2014; 16:460.
11. Larsen A, Dale K, Eek M. Radiographic evaluation of rheumatoid arthritis and related conditions by standard reference films. Acta Radiol Diagn. 1977; 18:481-491.
12. Gough AK, Emery P, Holder R, Lilley J, Eyre S. Generalised bone loss in patients with early rheumatoid arthritis. Lancet. 1994; 344:23-27.
13. Prevoo M, Van'T Hof MA, Kuper H, Van Leeuwen M, Van De Putte L, Van Riel P. Modified disease activity scores that include twenty‐eight‐joint counts development and validation in a prospective longitudinal study of patients with rheumatoid arthritis. Arthritis Rheum. 1995; 38:44-48.
14. Pincus T, Summey JA, Soraci Jr SA, Wallston KA, Hummon NP. Assessment of patient satisfaction in activities of daily living using a modified Stanford Health Assessment Questionnaire. Arthritis Rheum.1983; 26:1346-1353.
15. Wehmeyer C, Stratis A, Kramer I, Kneissel M, Pap T, Dankbar B. Loss of the Wnt inhibitor sclerostin promotes pannus formation and accelerates joint destruction in the hTNFtg mouse model of rheumatoid arthritis. Ann Rheum Dis. 2011; 70:A74-A74.
16. Bloxham E, Vagadia V, Scott K, Francis G, Saravanan V, Heycock C, Rynne M, Hamilton J, Kelly C. Anaemia in rheumatoid arthritis: Can we afford to ignore it? Postgrad Med J. 2011; 87:596-600.
17. Ganna S. The prevalence of anemia in rheumatoid arthritis. Rev Bras Reumatol. 2014; 54:257-259.
18. Scott D, Farr M, Hawkins C, Wilkinson R, Bold A. Serum calcium levels in rheumatoid arthritis. Ann Rheum Dis. 1981; 40:580.
19. El-Bakry S, Saber N, Zidan H, Samaha D. Sclerostin as an innovative insight towards understanding rheumatoid arthritis. Egypt Rheumatol. 2016; 38:71-75.
20. Mehaney DA, Eissa M, Anwar S, Fakhr El-Din S. Serum sclerostin level among Egyptian rheumatoid arthritis patients: Relation to disease activity, bone mineral density and radiological grading. Acta Reumatol Port. 2015; 40:268-274.
21. Seror R, Boudaoud S, Pavy S, Nocturne G, Schaeverbeke T, Saraux A, Chanson P, Gottenberg J-E, Devauchelle-Pensec V, Tobón GJ. Increased Dickkopf-1 in recent-onset rheumatoid arthritis is a new biomarker of structural severity. Data from the ESPOIR Cohort. Sci Rep. 2016; 6:18421.
22. Tian J, Xu XJ, Shen L, Yang YP, Zhu R, Shuai B, Zhu XW, Li CG, Ma C, Lv L. Association of serum Dkk-1 levels with β-catenin in patients with postmenopausal osteoporosis. J Huazhong Univ Sci Technolog Med Sci. 2015; 35:212-218.
(Received February 11, 2019; Revised February 21, 2019; Accepted February 28, 2019)

www.ddtjournal.com
Drug Discoveries & Therapeutics. 2019; 13(1):28-33.28
Synergistic anti-candida activities of lactoferrin and the lactoperoxidase system
Manabu Nakano1,*, Motofumi Suzuki2, Hiroyuki Wakabayashi1, Kazumi Hayama2, Koji Yamauchi1, Fumiaki Abe1, Shigeru Abe2
1 Food Ingredients & Technology Institute, R&D Division, Morinaga Milk Industry Co., Ltd., Kanagawa, Japan;2 Teikyo University Institute of Medical Mycology, Tokyo, Japan.
1. Introduction
Candida albicans is a commensal fungus in human mucosal surfaces, including the oral cavity. Oral candidiasis is an opportunistic infection of the oral cavity caused by the overgrowth of Candida spp., which causes tongue pain, a burning feeling, bad breath, and decreased quality of life. Reduced saliva production, poor oral hygiene, the long-term use of antibiotics, smoking, chemotherapy, and aging have been identified as risk factors for oral candidiasis (1). Although antifungal agents are used to treat oral candidiasis, their repeated usage is associated with the creation of resistant microorganisms (2,3). Lactoferrin (LF) and lactoperoxidase (LPO) are glycoproteins found in saliva, milk, vaginal secretions, and other exocrine secretions and play a role in host protection (4-6). LF exerts antimicrobial effects
against fungi such as Candida (7,8). LPO catalyzes the hydrogen peroxide-dependent oxidation of thiocyanate (SCN–), a component in saliva, to hypothiocyanite (OSCN–), which is a potent antimicrobial agent against fungi, bacteria, and viruses (5,6). This antimicrobial system is called the LPO system. The combination of LPO, glucose oxidase (GO), glucose, and buffer salts was previously shown to exhibit in vitro antimicrobial activity against periodontal bacteria and C. albicans through the formation of OSCN– in the presence of SCN– (9-11). The candidacidal activity of LF or the LPO system alone is moderate (8,10). Although the combined use of LF with antifungal drugs has been reported to enhance anti-candida effects (12), it cannot be taken continuously and safely on a daily basis. In the present study, we assessed the combined effects of LF and the LPO system on the cellular metabolic activity of C. albicans using the alamarBlue assay. We also investigated the in vitro antifungal effects of the combination of LF and the LPO system against C. albicans using a crystal violet staining method to quantify adhesive hyphal cells, which are related to pathogenicity. The aim of the present study was to develop a new method for the prevention of oral candidiasis.
Summary Candida albicans is a commensal fungus in human mucosal surfaces, including the oral cavity. Lactoferrin (LF) and the lactoperoxidase (LPO) system, which are host protection components in exocrine secretions, each exhibit weak anti-candida activity. We herein examined the effects of the combination of LF and the LPO system on C. albicans. Morphological observations indicated that the combination of LF and the LPO system reduced the mycelial volume of C. albicans and changed the size and shape of cells more than each agent alone. The combination of LF and the LPO system also exerted strong inhibitory effects on the cellular metabolic activity and adhesive hyphal form of C. albicans. A checkerboard analysis revealed that the anti-candida activity of LF and the LPO system was synergistic. These results suggest that the combination of LF and the LPO system is useful for preventing candidiasis.
Keywords: Lactoferrin, lactoperoxidase, Candida albicans
DOI: 10.5582/ddt.2019.01010Original Article
*Address correspondence to:Dr. Manabu Nakano, Functional Food Ingredients Group, Food Ingredients & Technology Institute, R&D Division, Morinaga Milk Industry Co., Ltd., 5-1-83, Higashihara, Zama, Kanagawa 252-8583, Japan.E-mail: [email protected]
www.ddtjournal.com
Drug Discoveries & Therapeutics. 2019; 13(1):28-33.
2. Materials and Methods
2.1. Materials
Bovine LF was produced by Morinaga Milk Industry Co., Ltd. (Tokyo, Japan). Components of the LPO system consisted of 43 mg/g of LPO purified from bovine milk (Tatua, Morrinsville, New Zealand), 430 mg/g of GO purified from Penicillium chrysogenum (Shin-Nihon Chemical, Aichi, Japan), 450 mg/g glucose, 24 mg/g citric acid, and 53 mg/g sodium citrate. 66 mM sodium thiocyanate solution was prepared and sterilized with filtration. LF and the LPO system were dissolved in 0.66 mM sodium thiocyanate. Hypothiocyanite (OSCN–) solution was produced enzymatically as described previously (13). In brief, 0.16 mg/mL LPO solution with 7.5 mM sodium thiocyanate and 3.75 mM H2O2 in 10 mM potassium phosphate buffer (pH 6.6) was incubated at room temperature for 15 min. After stopping the reaction by the addition of catalase, LPO and catalase were removed by centrifugation through a 10-kDa molecular mass cut-off filter (Amicon Ultra, Merck, Darmstadt, Germany) at 5000× g for 15 min. The concentration of OSCN– was measured by monitoring the reaction with 5-thio-2-nitrobezonic acid (14).
2.2. Preparation of medium for C. albicans hyphal formation
One milliliter of fetal calf serum (FCS, Thermo Fisher Scientific, MA, USA) was aseptically added to 39 mL of RPMI 1640 medium (Sigma Chemical Co., Mo., US) with L-glutamine and sodium bicarbonate (Sigma-Aldrich, MO, USA), aseptically supplied with 0.03 g of penicillin (FUJIFILM Wako Pure Chemical Corporation, Osaka, Japan), 0.03 g of kanamycin (FUJIFILM Wako Pure Chemical Corporation) and 2.39 g of HEPES (4-(2-Hydroxyethyl)-1-piperazineethanesulfonic acid, Dojindo, Kumamoto, Japan) in 500 mL of the same medium. This 2.5% FCS containing RPMI 1640 medium was three-fold diluted by adding sterile distilled water. The diluted FCS-RPMI medium was used in this study.
2.3. Assay for the inhibition of the cellular metabolic activity of C. albicans
C. albicans TIMM1768, a clinically isolated serotype A strain obtained from the Teikyo University Institute of Medical Mycology, was used in experiments. Cells were cultured on Sabouraud dextrose agar, which contained 1% Bactopeptone (Becton Dickinson, MD, US), 2% glucose, and 1.5% agar, and suspended the diluted FCS-RPMI medium. One hundred microliters of the C. albicans suspension (5 × 10³ cells/mL) in a 96-well microtiter plate was prepared. After the addition of 100-μL serial dilutions of LF and the LPO system, the microtiter plate
was incubated at 37°C for 16 h in 5% CO2 in air. After the incubation, 20 μL of alamarBlue (Thermo Fisher Scientific) was added to each of the wells. Samples were incubated at 37°C for 20 h in 5% CO2 in air. Absorbance at 570 and 594 nm was measured spectrophotometrically. The percent inhibition of cellular metabolic activity was calculated as follows. 100 − (absorbance (samples)/absorbance (control)) × 100 (%).
2.4. Assay for the growth inhibition of C. albicans in the hyphal form
The assay for the hyphal growth of C. albicans was performed using the method previously reported (15,16). The assay was performed under the same culture conditions as described above. One hundred microliters of the C. albicans suspension (5 × 10³ cells/mL) in a 96-well microtiter plate (MS-8096-F, Sumitomo Bakelite, Tokyo, Japan) was prepared. After the addition of 50-μL each of serial dilutions of LF and the LPO system to well of plate, the microtiter plate was incubated at 37°C for 16 h in 5% CO2 in air. The hyphal growth content of C. albicans was assessed by the crystal violet staining assay. The medium in the wells was discarded by inverting the microplate. Adhesive Candida mycelia were sterilized by immersion in 70% ethanol. The plate was washed twice in distilled water. Mycelia were stained with 0.01% crystal violet (Merck, Darmstadt, Germany) for 20 min and washed 3 times with water. After drying the microplate, 150 μL of isopropanol containing 0.04 N HCl and 50 μL of 0.25% sodium dodecyl sulfate were added to the wells. Samples were mixed by a plate mixer for 2 min to extract crystal violet from mycelia. The absorbance at 620 nm of triplicate samples was measured spectrophotometrically. The percent inhibition of Candida was calculated as follows: 100 − (absorbance (samples)/absorbance (control)) × 100 (%). A checkerboard analysis was used to assess anti-candida combinations, and the results obtained were evaluated based on standard criteria (17). Concentrations of the combination of LF and the LPO system showing 50% inhibitory concentration (IC50) against C. albicans were assessed by the crystal violet staining method and plotted in closed circles on arithmetic scales. The fractional inhibitory concentration (FIC) index was calculated as follows: (lowest inhibitory concentration of LF in combination/IC50 of LF alone + lowest inhibitory concentration of the LPO system in combination/IC50
of the LPO system alone). FIC index values of ≤ 0.5, 1.0, and > 4.0 represented synergism, additivity, and antagonism, respectively.
2.5. Statistical analysis
Statistical analyses were performed between two groups using the two-tailed Student's t-test. P values of < 0.05
29

www.ddtjournal.com
Drug Discoveries & Therapeutics. 2019; 13(1):28-33.30
the viability and proliferation of microorganisms. Table 1 shows the effects of the combination of LF and the LPO system on cellular metabolic activity. No marked inhibition was observed in the presence of 125 μg/mL of LF or the LPO system alone (Table 1). LF alone did not exert inhibitory effects, even at 2,000 μg/mL (data not shown). The LPO system alone at 500 μg/mL only exerted weak inhibitory effects (30.7% inhibition, data not shown). In contrast, the combination of more than 7.8 μg/mL of LF and more than 31 μg/mL of the LPO system completely inhibited metabolic activity.
3.3. Inhibitory effects of LF and the LPO system on the adhesive hyphal form of C. albicans
The in vitro antifungal effects of LF and the LPO system on C. albicans were also investigated using a crystal violet staining method to quantify adhesive hyphal cells. The IC50 of LF alone and the LPO system alone were 1,000 and 400 μg/mL, respectively (Table 2). In contrast, the combination of 7.8 μg/mL of LF and 50 μg/mL of the LPO system exerted inhibitory effects (82.6%). This combined effects of LF and the LPO system were characterized by the checkerboard analysis (Figure 2). The points indicate the concentration of each compound achieving more than 50% inhibition against C. albicans by the crystal violet staining method. The FIC index of this combination was 0.134, and this value
were considered to indicate a significant difference.
3. Results
3.1. Effects of LF and the LPO system on the growth morphology of C. albicans
The effects of LF and the LPO system on the hyphal form of C. albicans were investigated morphologically. Figure 1 shows the hyphal growth of C. albicans after an incubation at 37°C for 16 h. LF alone at 500 μg/mL did not reduce the mycelial volume of C. albicans; however, morphologically, the hyphal length of C. albicans under these conditions was shorter than those of the control (Figure 1c). The LPO system alone at 500 μg/mL morphologically altered the hyphal shape of C. albicans to a slightly more isolated and smaller colony-like appearance (Figure 1g). The combination of 125 μg/mL of LF and 125 μg/mL of the LPO system markedly reduced the mycelial volume of C. albicans and altered the size and shape of cells (Figure 1e).
3.2. Effects of LF and the LPO system on the cellular metabolic activity of C. albicans
AlamarBlue is a redox indicator that changes its color and fluoresces in response to metabolic activity (18). This method is commonly used to quantitatively assess
Figure 1. Phase-contrast micrographs of the hyphal growth of C. albicans. Approximately 5 × 10³ cells/mL of C. albicans TIMM1768 were incubated with different doses of LF and the LPO system at 37°C for 16 h in 5% CO2 in air. (a) Control culture showing the prominent development of hyphae; (b) culture with LF (125 μg/mL) alone showing the unchanged development of hyphae; (c) culture with LF (500 μg/mL) alone showing fewer hyphae; (d) culture with the LPO system (125 μg/mL) alone showing a slightly changed hyphal shape; (e, f) culture with LF (125 or 500 μg/mL) and the LPO system (125 μg/mL) showing a marked reduction in the mycelial volume of C. albicans and changes in the size and shape of cells; (g) culture with the LPO system (500 μg/mL) alone showing the changed hyphal shape of C. albicans to a slightly more isolated and smaller colony-like appearance; (h, i) culture with LF (125 or 500 μg/mL) and the LPO system (500 μg/mL) showing almost no hyphae. Bar, 100 μm.

www.ddtjournal.com
Drug Discoveries & Therapeutics. 2019; 13(1):28-33. 31
indicated synergy (≤ 0.5). These results suggest that the combination of LF and the LPO system exerts strong cooperative effects against the adhesive hyphal form of C. albicans. We also assessed the inhibitory effects of LF combined with OSCN− solution using the crystal violet staining method. We produced this OSCN− solution enzymatically, and removed LPO and GO from the
solution. When an OSCN− concentration of 225 μM was used, 500 μg/mL of LF exerted inhibitory effects against the adhesive hyphal form of C. albicans (56.7%, data not shown). On the other hand, LF alone at 500 μg/mL did not exert any inhibitory effects against the adhesive hyphal form (0.0%, data not shown). The OSCN− solution at a concentration of 225 μM exerted weak inhibitory effects (24.0%, data not shown). These results suggest that OSCN− solution, which is a potent antimicrobial product generated by the LPO system, also functions with LF against C. albicans.
4. Discussion
LF and LPO are antimicrobial components found in saliva and each exert weak candidacidal effects (8,10). We herein demonstrated that the combination of LF and the LPO system exerted synergistic inhibitory effects on the cellular metabolic activity and adhesion of the hyphal form of C. albicans. The effects on the combination of LF and the LPO system (FIC index = 0.134) was more synergistic than that of the combined use of LF with antifungal drugs (FIC index = 0.187-190) (12). The hyphal form of C. albicans invades deeper host tissues and initiates clinical disease (1). Therefore, the inhibition of metabolism and adherence is assumed to be a more effective approach for preventing candidiasis. LF with OSCN– solution also exerted inhibitory effects against C. albicans. This result suggests that OSCN–, which is a product of the LPO system, is an active component. The activity of the LPO system was
Table 1. Effects of the combination of LF and the LPO system on the cellular metabolic activity of C. albicans TIMM1768 using the alamarBlue assay
LPO system (μg/mL)
125 31 7.8 2.0 0
0
3.2 ± 3.2 0.0 ± 3.2 -3.2 ± 3.2 -1.1 ± 5.4 0.0 ± 3.2
2.0
2.2 ± 4.3 0.0 ± 5.4
1.1 ± 12.9 -2.2 ± 5.4 -3.2 ± 4.3
Data represent the mean ± SE of three to six experiments. *p < 0.01 significantly different from the control (no added agents).
7.8
101.4 ± 1.1* 98.9 ± 1.1* -2.2 ± 5.4 -1.1 ± 8.6 -4.3 ± 6.5
31
101.2 ± 1.1* 97.8 ± 1.1* 9.7 ± 3.2 1.1 ± 1.1 4.3 ± 3.2
125
102.0 ± 0.3* 98.9 ± 1.1* 78.5 ± 7.5* 1.1 ± 3.2 2.2 ± 3.2
% inhibition, LF (μg/mL)
Table 2. Effects of the combination of LF and the LPO system on the adhesion of the hyphal form of C. albicans TIMM1768 using the crystal violet staining assay
LPO system (μg/mL)
600400300200100 50 0
0
60.7 51.1 48.5 21.5 21.5-19.0 0.0
2.0
68.564.245.638.411.281.6 6.8
A checkerboard analysis showed percent inhibition on the adhesion of the hyphal form. The underlined combination was used to calculate the FIC index for the combination of LF and the LPO system.
7.8
73.469.152.386.586.982.6 5.7
31
88.589.687.787.587.585.9 -0.8
125
89.489.088.888.688.586.5 9.7
% inhibition, LF (μg/mL)
500
90.689.889.289.688.589.244.5
1000
90.890.290.290.089.889.456.3
Figure 2. The anti-candida activity of the combination of LF and the LPO system was examined using a checkerboard analysis. The IC50 of LF and the LPO system against the adhesive hyphal growth of C. albicans TIMM1768 was assessed by the crystal violet staining method and plotted in closed circles on arithmetic scales. A putative additive effect is represented by the dashed line.

www.ddtjournal.com
Drug Discoveries & Therapeutics. 2019; 13(1):28-33.32
more effective than OSCN– alone, and may be explained by the LPO system also producing short-lived, highly reactive intermediates, such as superoxythiocyanate (O2SCN–) or trioxythiocyanate (O3SCN–) (19). The reaction through GO, which is a component of the LPO system, generates hydrogen peroxide, which exhibits antifungal activity (20). Since previous studies reported that hydrogen peroxide was immediately reduced in the presence of peroxidase (21), the contribution of hydrogen peroxide to the effects of the LPO system may have been negligible. Furthermore, hydrogen peroxide exerts toxic effects against mammalian cells (22). The LPO system is safer than hydrogen peroxide alone because lactoperoxidase and thiocyanate protects against the toxic effects of hydrogen peroxide. Previous studies suggested that the main antifungal mechanism of action of LF was dependent on iron and occurred through the direct interaction of LF with the fungal cell surface, leading to cell membrane damage and leakage (8). On the other hand, OSCN– reacts with microbial sulfhydryl groups and inhibits various functions, such as the membrane transport of sugars and amino acids, glycolysis, and respiration (19). Alterations in microbial membranes increased this efficacy of the LPO system, possibly by promoting the access of OSCN– to essential cell compounds (23). Accordingly, we speculate that cell membrane damage caused by LF may increase cell permeability to reactive OSCN– produced by the LPO system, and increase modifications to essential intracellular components. This mechanism of action may have a role in the synergistic inhibitory effects observed; however, further studies are needed to confirm this. Reductions in salivary flow rates may increase the risk of opportunistic infections including oral candidiasis (24). The concentrations of LF and LPO in exocrine secretions have been reported to be 5-10 and 2 μg/mL in saliva, respectively (25,26). These concentrations of LF and LPO in saliva were lower than IC50 in the present study. Hence, LF and the LPO system in saliva do not exert anti-candida effects alone. The synergistic inhibitory effects of LF and the LPO system against saliva may be the reason for the co-localization of LF and LPO in mammalian exocrine secretions. In conclusion, we herein demonstrated that the combination of LF and the LPO system exerted synergistic inhibitory effects against C. albicans. These results suggest that food or a dietary supplement containing LF and the LPO system will be helpful for patients with oral issues caused by the excessive growth of C. albicans. Further clinical trials are needed to assess the preventive effects of this combination of LF and the LPO system on oral candidiasis.
Acknowledgements
This study was supported by research grants from
Morinaga Milk Industry Co., Ltd. Four of the authors, M. Nakano, H. Wakabayashi, K. Yamauchi, and F. Abe, are employees of Morinaga Milk Industry Co., Ltd. The other authors, M. Suzuki, K. Hayama, and S. Abe, declare no potential conflicts of interest with respect to the authorship and/or publication of this manuscript.
References
1. Scully C, EI-Kabir M, Samaranayake LP. Candida and oral candidosis: A Review. Crit Rev Oral Biol Med. 1994; 5:125-157.
2. Odds FC. Resistance of yeasts to azole-derivative antifungals. J Antimicrob Chemother. 1993; 31:463-471.
3. Walsh TJ, Gonzalez CE, Piscitelli S, Bacher JD, Peter J, Torres R, Shetti D, Katsov V, Kligys K, Lyman CA. Correlation between in vitro and in vivo antifungal activit ies in experimental fluconazole-resistant oropharyngeal and esophageal candidiasis. J Clin Microbiol. 2000; 38:2369-2373.
4. Wakabayashi H, Yamauchi K, Takase M. Lactoferrin research, technology and applications. Int Dairy J. 2006; 16:1241-1251.
5. Thomas EL, Bozeman PM, Learn DB. Lactoperoxidase: Structure and catalytic properties. In: Peroxidases in chemistry and biology vol 1. (Everse J, Everse KE GM, eds.). CRC Press, Boca Raton, FL, USA, 1991; pp. 123-142.
6. Reiter B, Härnulv G. Lactoperoxidase antibacterial system: Natural occurrence, biological functions and practical applications. J Food Prot. 1984; 47:724-732.
7. Komatsu A, Satoh T, Wakabayashi H, Ikeda F. Effects of bovine lactoferrin to oral Candida albicans and Candida glabrata isolates recovered from the saliva in elderly people. Odontology. 2015; 103:50-55.
8. Fernandes KE, Carter DA. The antifungal activity of lactoferrin and its derived peptides: Mechanisms of action and synergy with drugs against fungal pathogens. Front Microbiol. 2017; 8:2.
9. Welk A, Meller C, Schubert R, Schwahn C, Kramer A, Below H. Effect of lactoperoxidase on the antimicrobial effectiveness of the thiocyanate hydrogen peroxide combination in a quantitative suspension test. BMC Microbiol. 2009; 9:134.
10. Kho HS, Kim YY, Chang JY, Kim MJ, Lee SG. Candidacidal activities of the glucose oxidase-mediated lactoperoxidase system. Arch Oral Biol. 2012; 57:684-688.
11. Nakano M, Shin K, Wakabayashi H, Yamauchi K, Abe F, Hironaka S. Inactivating effects of the lactoperoxidase system on bacterial lyases involved in oral malodour production. J Med Microbiol. 2015; 64:1244-1252.
12. Wakabayashi H, Abe S, Okutomi T, Tansho S, Kawase K, Yamaguchi H. Cooperative anti-Candida effects of lactoferrin or its peptides in combination with azole antifungal agents. Microbiol Immunol. 1996; 40:821-825.
13. Lane AE, Tan JTM, Hawkins CL, Heather AK, Davies MJ. The myeloperoxidase-derived oxidant HOSCN inhibits protein tyrosine phosphatases and modulates cell signalling via the mitogen-activated protein kinase (MAPK) pathway in macrophages. Biochem J. 2010; 430:161-169.
www.ddtjournal.com
Drug Discoveries & Therapeutics. 2019; 13(1):28-33. 33
14. Tenovuo J, Mäkinen KK, Sievers G. Antibacterial effect of lactoperoxidase and myeloperoxidase against Bacillus cereus. Antimicrob Agents Chemother. 1985; 27:96-101.
15. Abe S, Satoh T, Tokuda Y, Tansho S, Yamaguchi H. A rapid colorimetric assay for determination of leukocyte-mediated inhibition of mycelial growth of Candida albicans. Microbiol Immunol. 1994; 38:385-388.
16. Wakabayashi H, Okutomi T, Abe S, Hayasawa H, Tomita M, Yamaguchi H. Enhanced anti-Candida activity of neutrophils and azole antifungal agents in the presence of lactoferrin-related compounds. Adv Exp Med Biol. 1998; 443:229-237.
17. Eliopoulos GM, Moellering CM. Antimicrobial combinations. In: Antibiotics in laboratory medicine. 3rd ed. (Lorian V, ed). Williams & Qilkins, Baltimore, MD, USA, 1991; pp. 432-492.
18. Pettit RK, Weber CA, Kean MJ, Hoffmann H, Pettit GR, Tan R, Franks KS, Horton ML. Microplate Alamar blue assay for Staphylococcus epidermidis biofilm susceptibility testing. Antimicrob Agents Chemother. 2005; 49:2612-2617.
19. Bafort F, Parisi O, Perraudin JP, Jijakli MH. Mode of action of lactoperoxidase as related to its antimicrobial activity: A review. Enzyme Res. 2014; 2014:517164.
20. Leiter E, Marx F, Pusztahelyi T, Haas H, Pocsi I. Penicillium chrysogenum glucose oxidase ‒ a study on
its antifungal effects. J Appl Microbiol. 2004; 97:1201-1209.
21. Shin K, Horigome A, Wakabayashi H, Yamauchi K, Yaeshima T, Iwatsuki K. In vitro and in vivo effects of a composition containing lactoperoxidase on oral bacteria and breath odor. J Breath Res. 2008; 2:017014.
22. Hänström L, Johansson A, Carlsson J. Lactoperoxidase and thiocyanate protect cultured mammalian cells against hydrogen peroxide toxicity. Med Biol. 1983; 61:268-274.
23. Thomas EL, Aune TM. Susceptibility of Escherichia coli to bactericidal action of lactoperoxidase, peroxide, and iodide or thiocyanate. Antimicrob Agents Chemother. 1978; 13:261-265.
24. Torres SR, Peixoto CB, Caldas DM, Silva EB, Akiti T, Nucci M, de Uzeda M. Relationship between salivary flow rates and Candida counts in subjects with xerostomia. Oral Surg Oral Med Oral Pathol Oral Radiol Endod. 2002; 93:149-154.
25. Német K, Simonovi ts I . The biological role of lactoferrin. Haematologia (Budap). 1985; 18:3-12.
26. Ihalin R, Loimaranta V, Tenovuo J. Origin, structure, and biological activities of peroxidases in human saliva. Arch Biochem Biophys. 2006; 445:261-268.
(Received February 6, 2019; Revised February 14, 2019; Accepted February 28, 2019)

www.ddtjournal.com
Drug Discoveries & Therapeutics. 2019; 13(1):34-37.34
Raised neutrophil lymphocyte ratio and serum beta hCG level in early second trimester of pregnancy as predictors for development and severity of preeclampsia
Megha Panwar1, Archana Kumari1,*, HP Anand1, Rashmi Arora2, Vishwajeet Singh3, Reeta Bansiwal1 1 Department of Obstetrics and Gynaecology, VMMC and Safdarjung Hospital, New Delhi, India;2 Department of Pathology, VMMC and Safdarjung Hospital, New Delhi, India;3 Department of Biostatistics, AIIMS, New Delhi, India.
1. Introduction
Preeclampsia (PE) is a common condition characterized by the development of hypertension after 20 weeks of gestation with or without proteinuria and/or multi-organ involvement. Studies suggest that the pathology for the development of PE is initiated in the second trimester itself, well before the actual development of signs and symptoms of the disease (1). Early detection and prediction of PE/severe PE can be instrumental as it can save the mother and the newborn from the detrimental
complications of PE by close monitoring and timely intervention. A number of clinical, biochemical and biophysical markers have been investigated as potential predictors in the development of PE (2). However, none of them has proven to be suitable for routine clinical practice (3). Serum beta-human chorionic gonadotropin (hCG) and neutrophil-lymphocyte ratio (NLR) are low-cost investigations that are readily available and have recently attracted the interest of researchers. Beta hCG is secreted by the syncytiotrophoblasts of the placenta and has been incriminated to have an initial role in the endothelial dysfunction of PE (3). Increase in the level of serum beta hCG reflects the placental reaction to PE and can be used for both the prediction of development and severity of PE. Furthermore, the placental changes in PE may also be attributed to the hyperactive
Summary Early detection and prediction of preeclampsia (PE) may avert serious materno-fetal complications. This prospective nested study was conducted to evaluate the role of serum beta human chorionic gonadotropin (hCG) and the neutrophil-lymphocyte ratio (NLR) in predicting the development and severity of PE. Four hundred and forty primigravidas, between 16 to 18 weeks of gestation, were recruited in the study. Serum beta-hCG and NLR were measured at the time of recruitment and they were followed and monitored for the development of PE and severe PE. Out of these 440 women, 64 (14%) developed PE; of which 25 (39%) developed severe PE. The mean values of NLR and serum beta hCG were significantly higher in patients developing PE and severe PE. NLR, with a cutoff value of 5.6, predicted the development of PE with 73.4% sensitivity and 88.6% specificity and severe PE with sensitivity 93.3% and specificity 86.6% respectively. The sensitivity and specificity of serum beta hCG in predicting the development of PE was 75% each for a cutoff value of 25,415 IU/mL whereas these values were 86.7%, and 79.1% respectively, for a cut-off value of 29,654 IU/mL for predicting the development of severe PE. These findings suggest that NLR and serum beta hCG can be used as excellent biomarkers in predicting both the development of PE and its severity. Multicentric studies involving subjects of multiple ethnicities should be done for establishing its utility as a routine screening test.
Keywords: Preeclampsia, severe preeclampsia, neutrophil-lymphocyte ratio, NLR, beta hCG
DOI: 10.5582/ddt.2019.01006Original Article
*Address correspondence to:Dr. Archana Kumari , Department of Obstetr ics and Gynaecology, VMMC and Safdarjung Hospital, New Delhi, India.E-mail: [email protected]

www.ddtjournal.com
Drug Discoveries & Therapeutics. 2019; 13(1):34-37.
inflammatory system. The NLR has been proposed as a new indicator of systemic inflammation and shown to have prognostic value in cancers and cardiac diseases (4). It has also been studied as a novel marker of prognosis in patients with PE (2,5). However, its role as a predictor of the development and severity of PE hasn't been studied elaborately. Hence, we planned this study to evaluate the role of both serum beta hCG and NLR in predicting the development and severity of PE.
2. Materials and Methods
This prospective nested case-control study was conducted in the Department of Obstetrics and Gynecology of a tertiary care teaching hospital of India. Primigravida women, between 16 to 18 weeks of gestation, attending antenatal care clinic and willing to follow up in the same hospital were recruited for the study. Women with the history of chronic medical illnesses, obesity (BMI > 30), smoking, ongoing infection or systemic inflammatory infections or any autoimmune disorders were excluded from the study. These women were followed as per hospital protocol and were monitored for the development of PE. The venous samples of these women were taken for measuring beta hCG level and NLR between 16-18 weeks of gestation. Serum beta hCG was measured by the ELISA technique and NLR by automated coulter counters. NLR was defined as the absolute neutrophil count divided by the absolute lymphocyte count. PE was diagnosed and classified according to the ACOG (2013) definition (6). A patient with systolic blood pressure of 140 mm Hg or higher or a diastolic blood pressure of 90 mm Hg or higher on two occasions at least 6 hours apart occurring after 20 weeks of gestation in a pregnant woman with previously normal blood pressure and detectable urinary protein (> 1+ by dipstick or 0.3 g/24 h and more) was diagnosed to have PE. Patients with blood pressure greater than or equal to 160/110 mm Hg with/without other evidence of severe disease like raised serum creatinine, eclampsia, pulmonary oedema, oliguria, fetal growth restriction,
oligohydramnios and symptoms suggesting significant end-organ involvement were diagnosed as having severe PE. Women who met the criteria of PE but not severe PE were diagnosed as mild PE. Values of NLR and serum hCG were correlated with the development and severity of PE. All statistical evaluation of the data was done using statistical software, STATA/SE version 14.2 (StataCorp LP, College Station, TX, USA). Categorical variables were presented in number and percentage (%) and continuous variables were presented as mean ± SD. Normality of data was tested by QQ plot and Kolmogorov-Smirnov test. If the normality was rejected, then the corresponding non-parametric test was used. Quantitative variables were compared using the Independent t-test/Mann-Whitney test (when the data sets were not normally distributed) between the two groups. To find the association between qualitative variables, Chi-Square test/Fisher exact test was used. Receiver operating characteristic curve was used to find out cut off point of β-hCG and NLR for predicting PE and severe PE and accordingly sensitivity and specificity was calculated. A p value < 0.05 was considered as statistically significant.
3. Results
Out of the 440 women recruited in the study, 64 (14%) developed PE of which 25 (39%) developed severe PE. The mean values of NLR and serum beta hCG at 16-18 weeks were found to be significantly higher in patients who developed PE (Table 1) and severe PE (Table 2). On the basis of receiver operator characteristics (ROC) curve, the most discriminant NLR value at 16-18 wks for prediction of development of PE was 5.6 which gave the highest sensitivity and specificity as 76.4% and 88.6% respectively with probability 0.84 i.e. area under the curve (AUC) = 0.84). The best cutoff value of serum beta hCG at 16-18 weeks for prediction of development of PE was 25,415 IU/mL with AUC as 0.81, sensitivity and specificity both being 75% (Table 3). Further, for the prediction of development of PE by
35
Table 1. Distribution of the mean values of Serum beta hCG and NLR ratio between 16-18 weeks in normal women and women who developed PE
Variable
Beta hCG (IU/mL)NLR
Normal women (n = 376), Mean ± SD
19165.03 ± 8044.7 4.55 ± 0.66
PE (n = 64), Mean ± SD
29605.7 ± 8190.835.55 ± 0.81
p-value
< 0.001< 0.001
Table 2. Distribution of the mean values of serum beta hCG and NLR between 16-18 weeks in the women between 16-18 weeks who developed mild PE and severe PE
Variable
Beta hCG (IU/mL)NLR
Mild PE (n = 49), Mean ± SD
27,519.61 ± 7,483.04 5.39 ± 0.84
Severe PE (n = 15), Mean ± SD
36,420.27 ± 6,703.07 6.08 ± 0.43
p-value
< 0.001 0.001

www.ddtjournal.com
Drug Discoveries & Therapeutics. 2019; 13(1):34-37.36
NLR (7). In the recent past, only a few studies have evaluated the predictive utility of NLR in PE, with inconsistent results. In a prospective case-control study, comprising of 50 cases of PE and 51 controls, Sachan et al., found that NLR had sensitivity and specificity of 53% and 65% respectively, for predicting non-severe PE cases at a cut-off value of > 3.35. Moreover, they found that diagnostic accuracy of NLR was significant between non-severe PE and severe PE, at a cut-off value of 3.42, with a sensitivity of 81% and specificity of 65% (8). A couple of other studies have also found a statistically significant association between high NLR values and PE, however, no statistically significant relationship was found between NLR and severity of PE in these studies (2,9). Some other studies, however, didn't find any statistically significant association between NLR and PE (7,10). In the present study, we found that women who had high values of serum beta hCG in the second trimester had a significantly higher risk of developing PE in the later part of pregnancy. Serum beta hCG, with a cutoff value equal to or more than 25,415 IU/mL at 16-18 weeks of gestation, could predict the development of PE with 75% sensitivity and 75% specificity. The predictive value of serum beta hCG for development of severe PE was even better at the cut off value of 29,654 IU/mL at 16-18 weeks with 86.7% sensitivity and 79.1% specificity. The findings of our study are in accordance with another study by Kaur et al., which found that the serum beta hCG estimation at mid-trimester (13-20 weeks) was a good predictor of PE and higher levels of beta hCG were associated with increased severity of PE (11). Increased beta hCG secretion may be attributed to the trophoblastic response to hypoxia as a result of defective placental invasion that occurs in PE. The undifferentiated cytotrophoblasts get transformed to syncytiotrophoblasts in PE, resulting in a hypersecretory state of beta hCG (12). This describes the linear association between the raised beta hCG and the severity of PE. Few other studies that tried to investigate serum beta
NLR and serum beta hCG together; the area under the curve (AUC) was 0.84 (95% CI 0.77 to 0.90), which is equivalent to the prediction by NLR alone. The sensitivity, specificity and AUC of NLR ratio and beta hCG for the prediction of development of severe PE were very high as compared to that for prediction of development of PE. At the cutoff value of 5.6, the sensitivity and specificity NLR ratio (at 16-18 weeks) was 93.3% and 86.6% (AUC = 0.95). The sensitivity and specificity of beta hCG at 16-18 weeks in predicting the development of severe PE taking the cut off value as 29,654 IU/mL were 86.7% and 79.1% (AUC = 0.92) as shown in Table 4. For the prediction of development of severe PE by NLR and serum beta hCG together area under the curve (AUC) was marginally improved and was observed as 0.97 (95% CI 0.93 to 1.0).
4. Discussion
We evaluated NLR and serum beta hCG as potential markers for predicting the development of PE and its severity in primigravida. Both NLR and serum beta hCG were found to be excellent biomarkers in predicting the development of PE and its severity. NLR, with a cut off value equal to or more than 5.6 at 16-18 weeks of gestation was found to predict the development of PE with 73.4% sensitivity and 88.6% specificity. The NLR was found even better in predicting the severity of PE. The sensitivity and specificity of NLR in predicting severe PE was 93.3% and 86.6% respectively, for a cut off value of 5.6. Raised NLR in PE may be attributed to the secretion of proinflammatory cytokines from the hypoxic placenta due to the defective trophoblastic invasion, which is central to the genesis of PE (4). These cytokines stimulate the inflammatory pathway causing free radical generation and oxidative stress, thus contributing to endothelial injury which leads to the development of PE (3). This activation and exaggeration of the inflammatory pathway in PE are reflected as increased leucocyte counts, mainly neutrophils and thus raised
Table 3. Distribution of the sensitivity (SN) and specificity (SF) of serum beta hCG and NLR between 16-18 weeks in predicting the development of PE
Variable
Beta hCG (IU/mL)NLR
AUC
0.810.84
95% Confidence interval
0.76 to 0.860.77 to 0.90
SF
75.088.6
Cut off
> 25,415≥ 5.6
SN
75.073.4
Table 4. Distribution of the sensitivity (SN) and specificity (SF) of serum beta hCG and NLR between 16-18 weeks in predicting the development of severe PE
Variable
Beta hCG (IU/mL)NLR
AUC
0.920.95
95% Confidence interval
0.86 to 0.980.90 to 1.00
SF
79.186.6
Cut off
> 29,654≥ 5.61
SN
86.793.3

www.ddtjournal.com
Drug Discoveries & Therapeutics. 2019; 13(1):34-37. 37
hCG levels in the early second trimester to predict the subsequent occurrence of PE have yielded contrasting results. Karahasanovic et al., found that beta hCG was significantly lower in pregnancies that subsequently developed PE (13). Raty et al., concluded that maternal mid-trimester serum level of free beta-hCG is not predictive for the development of PE (14). A couple of other studies have found a modest or clinically insignificant increase in the risk of developing PE among women with abnormal second-trimester levels of hCG (15,16). However, there are studies from recent past that suggest that elevated hCG levels are associated with developing early PE, and measuring levels of beta hCG during the second trimester of pregnancy can be useful in clinical practice to identify pregnant women who will develop PE (17,18).
5. Conclusion
Researchers from different parts of the world are looking for biomarkers that can predict the development and severity of PE. NLR and serum beta hCG are cheap, rapid, non-invasive biochemical markers that have been studied in PE. In our study, both NLR and serum beta HCG were found to be excellent biomarkers in predicting both the development of PE and its severity. Multicentric, prospective, large-scale studies involving subjects of multiple ethnicities should be done for implementation of these markers as a routine screening test in pregnancy for predicting PE.
References
1. El-Sayed AAF. Preeclampsia : A review of the pathogenesis and possible management strategies based on its pathophysiological derangements. Taiwan J Obstet Gynecol. 2017; 56:593-598.
2. Yavuzcan A, Cağlar M, Ustün Y, Dilbaz S, Ozdemir I, Yildiz E, Ozbilgeç S, Kumru S. Mean platelet volume, neutrophil-lymphocyte ratio and platelet-lymphocyte ratio in severe preeclampsia. Ginekol Pol. 2014; 85:197-203.
3. Conde-Agudelo A, Villar J, Lindheimer M. World Health Organization systematic review of screening tests for preeclampsia. Obstet Gynecol. 2004; 104:1367-1391.
4. LaMarca B. The role of immune activation in contributing to vascular dysfunction and the pathophysiology of hypertension during preeclampsia. Minerva Ginecol. 2010; 62:105-120.
5. Doğan K, Guraslan H, Senturk MB, Helvacioglu C, İdil S, Ekin M. Can platelet count and platelet indices predict the risk and the prognosis of preeclampsia? Hypertens Pregnancy. 2015;34:434-442.
6. American College of Obstetricians and Gynecologists, Task Force on Hypertension in Pregnancy. Hypertension
in pregnancy. Report of the American College of Obstetricians and Gynecologists ' Task Force on Hypertension in Pregnancy. Obstet Gynecol. 2013; 122:1122-1131.
7. Yücel B, Ustun B. Neutrophil to lymphocyte ratio, platelet to lymphocyte ratio, mean platelet volume, red cell distribution width and plateletcrit in preeclampsia. Pregnancy Hypertens. 2017; 7:29-32.
8. Sachan R, Patel ML, Sachan P, Shyam R. Diagnostic accuracy of neutrophil to lymphocyte ratio in prediction of nonsevere preeclampsia and severe preeclampsia. Journal of Current Research in Scientific Medicine. 2017; 3:79.
9. Gezer C, Ekin A, Ertas IE, Ozeren M, Solmaz U, Mat E, Taner CE. High first-trimester neutrophil-to-lymphocyte and platelet-to-lymphocyte ratios are indicators for early diagnosis of preeclampsia. Ginekol Pol. 2016; 87:431-435.
10. Bozdag H, Demirçivi Bör E, Akdeniz E. The predictive value of total leukocyte count and leukocyte differential for severe preeclampsia. Perinat J. 2018; 26:25-31.
11. Kaur G, Jain V, Mehta S, Himani S. Prediction of PIH by maternal serum beta HCG levels in the second trimester (13-20 weeks) of pregnancy. J Obstet Gynaecol India. 2012; 62:32-34.
12. Redman CWG, Staff AC. Preeclampsia, biomarkers, syncytiotrophoblast stress, and placental capacity. Am J Obstet Gynecol. 2015; 213:S9.e1, S9-11.
13. Karahasanovic A, Sørensen S, Nilas L. First trimester pregnancy-associated plasma protein A and human chorionic gonadotropin-beta in early and late pre-eclampsia. Clin Chem Lab Med. 2014; 52:521-525.
14. Räty R, Koskinen P, Alanen A, Irjala K, Matinlauri I, Ekblad U. Prediction of pre-eclampsia with maternal mid-trimester total renin, inhibin A, AFP and free beta-hCG levels. Prenat Diagn. 1999; 19:122-127.
15. Lambert-Messerlian GM, Silver HM, Petraglia F, Luisi S, Pezzani I, Maybruck WM, Hogge WA, Hanley-Yanez K, Roberts JM, Neveux LM, Canick JA. Second-trimester levels of maternal serum human chorionic gonadotropin and inhibin a as predictors of preeclampsia in the third trimester of pregnancy. J Soc Gynecol Investig. 2000; 7:170-174.
16. Davidson EJ, Riley SC, Roberts SA, Shearing CH, Groome NP, Martin CW. Maternal serum activin, inhibin, human chorionic gonadotrophin and alpha-fetoprotein as second trimester predictors of pre-eclampsia. BJOG. 2003; 110:46-52.
17. Roiz-Hernández J, de J Cabello-Martínez J, Fernández-Mejía M. Human chorionic gonadotropin levels between 16 and 21 weeks of pregnancy and prediction of pre-eclampsia. Int Fed Gynaecol Obstet. 2006; 92:101-105.
18. Olsen RN, Woelkers D, Dunsmoor-Su R, LaCoursiere DY. Abnormal second-trimester serum analytes are more predictive of preterm preeclampsia. Am J Obstet Gynecol. 2012; 207:228.
(Received January 24, 2019; Revised February 18, 2019; Accepted February 28, 2019)

www.ddtjournal.com
Drug Discoveries & Therapeutics. 2019; 13(1):38-46.38
Effects of coenzyme Q10 supplementation on diastolic function in patients with heart failure with preserved ejection fraction
Mochamad Ali Sobirin1,2,*, Yan Herry1, Sefri Noventi Sofia1, Ilham Uddin1, Sodiqur Rifqi1, Hiroyuki Tsutsui3
1 Department of Cardiology and Vascular Medicine, Faculty of Medicine, Diponegoro University, Indonesia;2 Department of Pharmacology and Therapeutics, Faculty of Medicine, Diponegoro University, Indonesia;3 Department of Cardiovascular Medicine, Graduate School of Medical Sciences, Kyushu University, Japan.
1. Introduction
The prevalence of heart failure with preserved ejection fraction (HFpEF) accounts for more than 50% of patients with heart failure (HF) and tends to increase with a prognosis as bad as that of HF with reduced ejection fraction (HFrEF) (1-6). Till date, no therapy has been demonstrated to improve mortality in patients with HFpEF including several large prospective, randomized controlled trial such as angiotensin
converting enzyme inhibitor (ACE-I) perindopril (PEP-CHF) (7), angiotensin II receptor blockers (ARBs) candesartan (CHARM-Preserved) (8) and irbesartan (I-PRESERVE) (9), aldosterone receptor blockers spironolactone (TOPCAT (10) and Aldo–DHF (11)), and beta blocker (SENIORS) (12). Recent studies have shown that bioenergetic deficiency is involved in the pathophysiology of HFpEF and that these changes lead to myocardial remodeling and dysfunction (13). Patients with HFpEF show abnormalities in myocardial energetics in the formation of adenosine triphosphate (ATP) and movement between phosphocreatine and ATP through creatine kinase reactions. Phan et al. (14,15) found a significant reduction in the phosphocreatine/ATP ratio of patients with HFpEF compared to that in controls.
Summary Heart failure with preserved ejection fraction (HFpEF) is a leading cause of morbidity and mortality without an established treatment. Diastolic dysfunction, the hallmark of HFpEF, is associated with altered myocardial bioenergetics. No previous study has examined the effects of coenzyme Q10 (CoQ10) on left ventricle (LV) diastolic function in patients with HFpEF. We investigated whether CoQ10 could improve LV diastolic function in patients with HFpEF. We performed a randomized controlled trial (RCT) using pretest and posttest control groups of 30 patients with HFpEF. The patients received either CoQ10 100 mg three times a day or no CoQ10 in addition to routine treatment for 30 days. Echocardiographic study was performed at baseline and follow-up. LV diastolic function was evaluated by two dimensional and Doppler echocardiography as follows; average E/e׳, septal and lateral e׳ velocity, and left atrium volume index (LAVI). A total of 28 patients completed the study. A statistically significant improvement was observed in the CoQ10 treatment group in terms of average E/e׳ ((3.8) 18.9 vs. 15.1 (4.3); p < 0.01) and LAVI (32 (9) mL/m2 vs. 26 (7) mL/m2; p < 0.05) and in the control group (18.4 (3.1) vs. 15.8 (5.6); p < 0.05) and (33 (7) mL/m2 vs. 30 (8) mL/m2; p < 0.05, respectively). However, there was no difference in change reduction between groups (∆E/e3.6 ‒ ׳ vs. ‒ 2.4; p = 0.28) and (∆LAVI ‒ 5.4 vs. ‒ 4.4; p = 0.83). Short term CoQ10 supplementation provided no additional benefits in improving LV diastolic function in patients with HFpEF.
Keywords: Heart failure with preserved ejection fraction (HFpEF), LV diastolic function, coenzyme Q10
DOI: 10.5582/ddt.2019.01004Original Article
*Address correspondence to:Dr. Mochamad Ali Sobirin, Department of Cardiology and Vascular Medicine, Faculty of Medicine, Diponegoro University, Jl. Prof Sudarto SH, Semarang, Indonesia 50275. E-mail: [email protected]

www.ddtjournal.com
Drug Discoveries & Therapeutics. 2019; 13(1):38-46.
Coenzyme Q10 (CoQ10) or ubiquinone is a cofactor that plays a critical role in facilitating the production of ATP by participating in redox reactions within the electron transport chain in the mitochondria. In addition, CoQ10 is a potent antioxidant (16). Previous studies reported that CoQ10 increased left ventricular ejection fraction (LVEF), improved proinflammatory mediators, reduced oxidative stress, and increased myocardial bioenergetics (17,18). However, to our knowledge, no previous study has evaluated the effect of CoQ10 supplementation on the diastolic function in patients with HFpEF. Only one clinical trial evaluated the use of CoQ10 in patients with hypertrophic cardiomyopathy with diastolic dysfunction (19). The aim of this study was to determine whether CoQ10 could improve LV diastolic function in patients with HFpEF.
2. Materials and Methods
2.1. Trial design
This study was a single-center, unblinded, randomized controlled clinical trial, that enrolled patients from Dr. Kariadi Hospital, Semarang, Indonesia. The trial was conducted in accordance with the principles of the Declaration of Helsinki, Good Clinical Practice guidelines, and local and national regulations. Written informed consent was provided by all patients before any study-related procedures were performed.
2.2. Participants
The complete eligibility criteria for participants are described in Table 1.
2.3. Study drug administration and study procedures
Eligible patients were randomly assigned to receive
either CoQ10 100 mg three times a day or no coenzyme Q10 in addition to routine treatment for 30 days. The randomization ratio according to permuted blocks was 1:1 for CoQ10 or without CoQ10. Use of standard therapies for controlling the risk factors and symptoms control was at the discretion of treating physicians and required to be unchanged within the 4 weeks prior to randomization. Echocardiography. A detailed echocardiography was performed as described previously (20,21). Diastolic dysfunction was prospectively identified and graded by a prespecified algorithm defined in the study protocol and diagnostic criteria for HF with normal EF were used according to current guidelines of the American Society of Echocardiography (ASE) or the European Association of Cardiovascular Imaging (EACVI). All patients underwent physical examination, echocardiography, and blood sampling at baseline and 1-month follow-up visits.
2.4. Study objectives and end points
The primary objective of this trial was to determine whether CoQ10 is superior to routine treatment in improving the diastolic function in patients with HFpEF. The diastolic function was assessed by the changes in septal and lateral e׳, ratio E/e' mitral, and LAVI at 1 month. Additional secondary endpoints included changes in echocardiographic measures of cardiac function and remodelling. Clinical tolerability was assessed as the safety endpoint.
2.5. Statistical analysis
The Kolmogorov-Smirnov test was used to assess normality. For continuous variables with normal distribution, the data are presented as mean ± standard deviation, and variables without normal distribution, are reported as median and interquartile range (IQR). The
39
Table 1. Eligibility criteria for study participants
Inclusion Criteria:1. Men or women aged ≥ 45 years old;2. Typical symptoms and signs of chronic heart failure (CHF) (New York Heart Association Class 2-3);3. Left ventricular ejection fraction on echocardiography (LVEF ≥ 50%);4. Evidence of diastolic dysfunction on non-invasive imaging based on ASE/EACVI guideline (diastolic dysfunction of at least grade 1 (E/A ≤
0.8 + E > 50 cm/s or E/A > 0.8 < 2) with “requirement of at least one of the following criteria: (1) septal e7 > ׳ cm/sec or lateral e < 10 cm/s, (2) average E/e' > 14, (3) LA volume index > 34 mL/m2, and (4) TR velocity > 2.8 m/s;
5. Stable medical therapy for 4 weeks prior to randomization; 6. Informed consent available.
Exclusion Criteria:1. Chronic atrial fibrillation;2. Acute coronary syndrome or coronary revascularization within 60 days;3. Clinically significant valvular disease;4. Significantly low systolic blood pressure (< 100 mmHg) or high blood pressure; 5. Patients with a prior LVEF < 40%; 6. Known infiltrative cardiomyopathy (e.g. amyloidosis), hypertrophic cardiomyopathy or chronic pericardial disease;7. Dyspnea or edema due to non-cardiac causes such as pulmonary disease, and anemia (Hb < 8.0 g/dL); 11. Inability or refusal to provide informed consent; 12. Poor echocardiographic recordings.

www.ddtjournal.com
Drug Discoveries & Therapeutics. 2019; 13(1):38-46.40
therapy without CoQ10. One patient each from the control group and the treatment group dropped out due to exacerbations of heart failure and acute coronary syndrome (Figure 1). Among the 30 study patients analyzed, there was no difference in the demographic characteristics between the two groups in terms of sex, age, and body mass index (BMI). Eight patients (53.3%) were females in the CoQ10 group, and the control group had 7 female patients (46.7%) (p = 0.71). The mean age was 64 ± 10 years in the CoQ10 group and 61 ± 7 years in the control group (p = 0.31). As shown in Table 2, there were no differences in baseline clinical characteristics between the control and CoQ10 groups, which included a history of comorbid disease, symptoms and signs of heart failure, physical examination, laboratory parameters, and prescribed medical therapy. The frequency of hypertension history was extremely high (93.3%) in all samples. Blood pressure measured at the time of recruitment was fairly controlled (mean systolic/diastolic pressure was 133/79 mmHg) with no difference between the two groups. Shortness of breath during activity (DOE = dyspnea on
categorical variables are presented as absolute numbers and percentages. The groups were compared using two-tailed unpaired Student's t test for variables with normal distribution and Wilcoxon test for variables without normal distribution. P values < 0.05 were considered as statistically significant.
3. Results
3.1. Basic demographic and clinical characteristics
A total 51 subjects met the inclusion criteria, of whom 21 patients were excluded due to moderate or severe mitral regurgitation (10 patients), chronic renal failure with Hb < 8 g/dL (4 patients), moderate or severe pericardial effusion (3 patients), atrial fibrillation (2 patients), and post-treatment of acute coronary syndrome within 2 months (2 patients). The remaining 30 patients were randomized by permuted blocks and divided into two groups, which included 15 patients in the treatment group receiving routine therapy plus CoQ10 100 mg three times a day (CoQ10 group), and 15 patients in the control group receiving routine
Figure 1. Participant Flow. Flow diagram showing participant flow in the study. The study is a before-and-after study with a comparison group (control group). aExcluded according to exclusion criteria listed in Table 1; b,cDropped-out due to exacerbation of heart failure and acute coronary syndrome events.

www.ddtjournal.com
Drug Discoveries & Therapeutics. 2019; 13(1):38-46. 41
effort) was the most commonly complained symptom (86.7%). Basic blood laboratory parameters showed no difference between the groups in terms of hemoglobin concentration, creatinine, total cholesterol and HbA1c levels. The mean hemoglobin concentration was 12.1 ± 1.5 g/dL in the CoQ10 group and 12.9 ± 1.6 g/dL in the control group (p = 0.19), while the mean total cholesterol levels were 181 ± 36 and 187 ± 43 mg/dL (p = 0.68), respectively. Renal function assessed by creatinine levels was similar between the CoQ10 group (1.6 ± 0.88) mg/dL) and the control group (2.0 ± 2.2) (p = 0.90). Regarding medical therapy prescription, the majority of patients received ACE-I or ARBs (100%), beta-blockers (80%), and spironolactone (26.7%). Other drugs that were administered included calcium antagonists (43.3%), antiplatelets (70%), statins (70%) and antidiabetic (56.7%). There was no significant difference in medical therapy prescription between the two groups.
3.2. Basic echocardiogram characteristics
Echocardiographic examination showed no significant differences between groups (Table 3). The mean LVEF did not differ between the CoQ10 group (55% ± 5%)
and the control group (58% ± 8%) (p = 0.32). Regarding left ventricular structure, all patients had normal left ventricular diameter (mean LVIDd 49 ± 8 mm and LVIDs 33 ± 8 mm), with concentric remodeling or increased left ventricular mass in male (143 ± 37 g/m2) and female (145 ± 34 g/m2) patients of the CoQ10 group and in male (135 ± 27 g/m2) and female (129 ± 32) g/m2) patients of the control group. Left ventricular diastolic function showed a lower E/A ratio in the CoQ10 group than that in control group (0.94 ± 0.3 vs. 1.24 ± 0.4), however, the difference was not significant (p = 0.06). Tissue Doppler imaging (TDI) E' showed a similar decrease in either septal (4.2 ± 1.2 vs. 4.8 ± 1.0) cm/s; p = 0.13) or lateral (5.5 ± 1.2 cm/s vs. 6.6 ± 1.8 cm/s; p = 0.08) in the CoQ10 and control groups. The increase in left ventricular filling pressure was indicated by an increased the E/e' ratio in the CoQ10 group (18.9 ± 3.8) and in the control group (18.4 ± 3.1), however, the difference was not significant (p = 0.67). Left atrium volume index (LAVI) was increased by ≥ 34 mL/m2 among 50% of patients, with a mean LAVI of 32 ± 9 mL/m2 in the CoQ10 group and 33 ± 7 mL/m2 in the control group. Among 10 patients (33.3%), out of 30 studied patients, the speed of tricuspid regurgitation could be
Table 2. Demographic and clinical baseline characteristics
Characteristics
Demographics Age, mean (SD), y Female, %Medical history, % Hypertension Diabetes mellitus CADSign and symptom, % DOE PND Fatique Peripheral edemaPhysical examination, Mean (SD) BMI Heart rate Systolic BP Diastolic BPLaboratorymeasurement Mean (SD) Hemoglobin, g/dL Creatinine, mg/dL Creatinine clearance Total Cholesterol HbA1cCurrent medications, % ACE-I ARB Beta blockers Spironolactone CCB Antiplatelets Statin
Total (n = 30)
62 (8)50.0
93.373.363.3
86.723.366.736.7
24.8 (2.8)75 (11)133(11)79(9)
12.5 (1.6)1.8(1.7)47(22)185(39)7.8(2.0)
6.793.380.026.743.370.076.7
Control Group (n = 15)
61 (7)46.7
100.066.753.3
73.326.773.340.0
24.3 (2.4)76 (13)129 (12)78 (9)
12.1 (1.5)2.0(2.2)47(22)181(36)7.7 (2.2)
6.793.380.026.740.066.780.0
*Significance value p < 0.05; aun-paired t-test; bNon-parametric Mann-Whitney test; cchi-square test; dFisher's-exact test; SD: standard deviation; ACEi: angiotensin converting enzyme inhibitor; ARB: angiotensin receptor blocker; BMI: body mass index; BP: blood pressure; CCB: calcium channel blocker; CAD: coronary artery disease; DOE: dyspnea on exertion; PND: paroxysmal nocturnal dyspnea.
Coenzyme Q10 (n = 15)
64 (10)53.3
86.780.073.3
100.020.060.033.3
25.3 (3.2)74 (10)137(8)81 (10)
12.9(1.6)1.6 (0.8)46(23)187(43)7.9(1.9)
6.793.380.026.746.773.373.3
P value
0.31a
0.71c
0.48d
0.68d
0.25c
0.10d
1.00d
0.43c
0.70c
0.34a
0.68a
0.08b
0.38b
0.19a
0.90b
0.88a
0.68a
0.46b
1.00d
1.00d
1.00d
1.00d
0.71c
1.00d
0.42d

www.ddtjournal.com
Drug Discoveries & Therapeutics. 2019; 13(1):38-46.42
measured and only 4 patients (13.3%) with a TR Vmax of > 2.8 m/s. Other valvular abnormalities found among patients were mild mitral regurgitation (46.7%) and mild aortic regurgitation (13.3%).
3.3. Comparison of pre versus post echocardiography findings between the groups
Pre and post-echocardiographic studies revealed no significant differences in left ventricular function and structure in either CoQ10 or control group. The mean LV ejection fraction was not significantly different between the initial value: (55% ± 4% compared to the final value 56% ± 8%; p = 0.73). Left ventricular mass index (LVMI)
also showed no significant differences (144 ± 34 vs. 129 ± 31 g/m2; p = 0.08). As for left ventricular diastolic function, CoQ10 administration decreased E/e' ratio from 18.9 ± 3.8 to 15.1 ± 4.3 (p = 0.002) and left atrial volume index (LAVI) from 32 ± 9 to 26 ± 7 mL/m2 (p = 0.049). Regarding other diastolic function parameters, CoQ10 administration did not significantly increase the TDI e' septal value (4.2 ± 1.2 vs. 4.3 ± 1.1; p = 0.61), and even the lateral TDI value tended to decrease (5.5 ± 1.2 vs. 5.1 ± 1.0) cm/s; p = 0.23). As in the control group, left ventricular diastolic function improved as characterized by a decrease in the E/e', and the LAVI index and a significant decrease in E velocity (Table 4).
Table 3. Baseline echocardiographic characteristics
Characteristics
LV diastolic function E/e׳ ratio Medial e׳, cm/s Lateral e׳, cm/s E velocity, m/s E/A velocity ratio Decelaration t, ms LAVI, mL/m2
LV systolic function LVEF biplane,% LVIDd, mm LVIDs, mmLV structure LVMI, g/m2
Men Women
Total (n = 30)
18.6 (3.4)4.5 (1.1)6.0 (1.6)87 (22)
1.09 (0.5)186 (50)33 (8)
56 (7)49 (8)33 (8)
138 (31)139 (31)137 (33)
Control Group (n = 15)
18.4 (3.1)4.8 (1.0)6.5 (1.8)92 (23)
1.24 (0.4)182 (47)33 (7)
58(8)49 (9)33 (9)
132 (29)135 (27)129 (32)
*Significance value p < 0.05; aun-paired t-test; bNon-parametric Mann-Whitney test; SD: standard deviation; LV: left ventricle; LAVI: left atrium volume index; LVEF: left ventricular ejection fraction; LVIDd: left ventricle internal diameter diastolic; LVIDs: left ventricle internal diameter systolic; LVMI: left ventricle mass index.
Coenzyme Q10 (n = 15)
18.9 (3.8)4.2 (1.2)5.5 (1.2)82 (21)
0.94 (0.3)190 (55)32 (9)
55 (4)48 (8)33 (6)
144 (34)143 (37)145 (34)
P value
0.67a
0.13a
0.08a
0.15a
0.06a
1.00a
0.88a
0.32b
0.27a
0.42a
0.33a
Table 4. Echocardiography results after 1 month
Measurements
Diastolic Function E/e׳ ratio Medial e׳, cm/s Lateral e׳, cm/s E velocity, m/s E/A velocity Decelaration t, ms LAVI, mL/m2
Systolic Function LVEF,% LVIDd, mm LVIDs, mm GLSOther Variable LVMI, g/m2
Men Women
Pre (n = 15)
18.4 (3.1)4.8 (1.0)6.5 (1.8)92 (23)
1.24 (0.5)182 (47)33 (7)
58(8)49 (9)33 (9)
132 (29)135 (27)129 (32)
Post (n = 14)
15.8 (5.6)4.8 (1.6)5.5 (1.7)75 (18)
1.08 (0.5)197 (46)30 (8)
57 (7)49 (8)32 (8)
16.0 (3.3)
131 (43)121 (33)145 (54)
*Significance value p < 0.05; anon-parametric Wilcoxon test; bpaired t-test. SD: standard deviation; LV: left ventricle; LAVI: left atrium volume index; LVEF: left ventricular ejection fraction; LVIDd: left ventricle internal diameter diastolic; LVIDs: left ventricle internal diameter systolic; LVMI: left ventricle mass index.
P value
0.04a*0.70b
0.06b
0.01b*0.46a
0.17b
0.02b*
0.82a
0.53b
0.26b
0.71a
Pre (n = 15)
18.9 (3.8)4.2 (1.2)5.5 (1.2)82 (21)
0.94 (0.3)190 (55)32 (9)
55 (4)47 (7)33 (8)
144 (34)143 (37)145 (34)
Post (n = 14)
15.1 (4.3)4.3 (1.1)5.1 (1.0)71 (20)
0.82(0.3)169 (45)26 (7)
56 (8)48 (9)33 (8)
16.5 (4.4)
129 (37)117 (35)140 (38)
P value
0.00b*0.61b
0.23b
0.12a
0.55b
0.66a
0.04b*
0.73a
0.37b
0.27b
0.08b
Control Coenzyme Q10
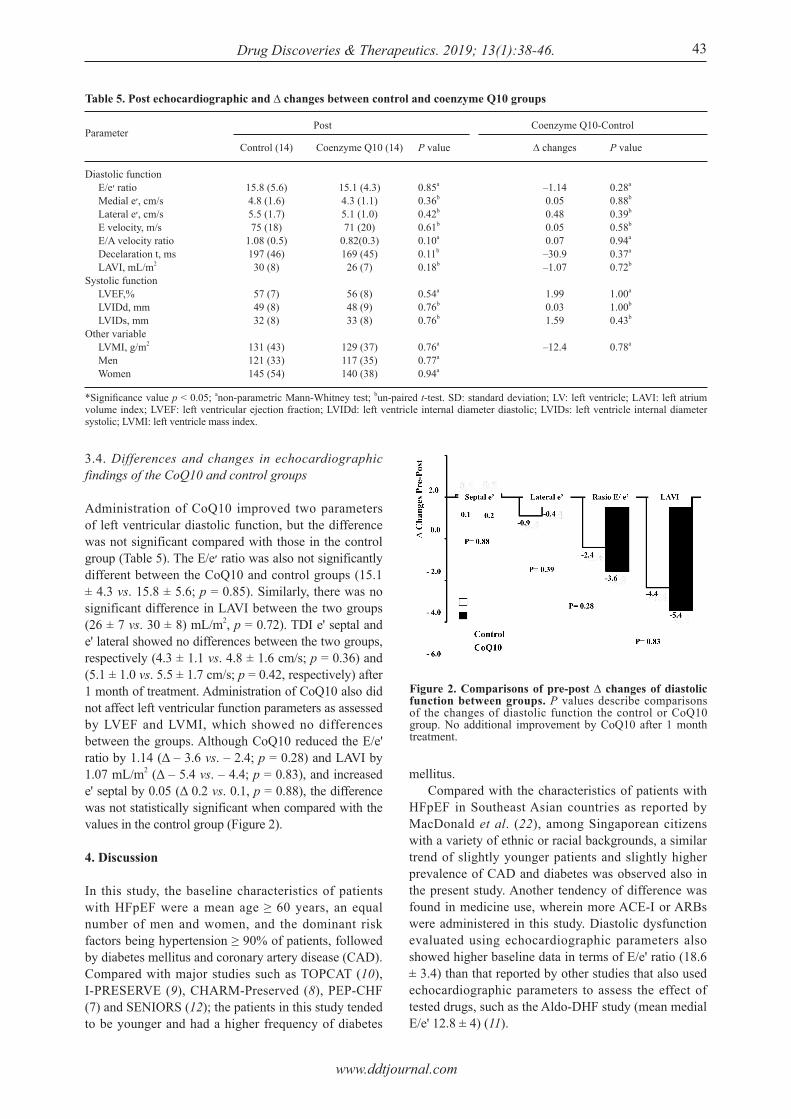
www.ddtjournal.com
Drug Discoveries & Therapeutics. 2019; 13(1):38-46. 43
3.4. Differences and changes in echocardiographic findings of the CoQ10 and control groups
Administration of CoQ10 improved two parameters of left ventricular diastolic function, but the difference was not significant compared with those in the control group (Table 5). The E/e׳ ratio was also not significantly different between the CoQ10 and control groups (15.1 ± 4.3 vs. 15.8 ± 5.6; p = 0.85). Similarly, there was no significant difference in LAVI between the two groups (26 ± 7 vs. 30 ± 8) mL/m2, p = 0.72). TDI e' septal and e' lateral showed no differences between the two groups, respectively (4.3 ± 1.1 vs. 4.8 ± 1.6 cm/s; p = 0.36) and (5.1 ± 1.0 vs. 5.5 ± 1.7 cm/s; p = 0.42, respectively) after 1 month of treatment. Administration of CoQ10 also did not affect left ventricular function parameters as assessed by LVEF and LVMI, which showed no differences between the groups. Although CoQ10 reduced the E/e' ratio by 1.14 (Δ ‒ 3.6 vs. ‒ 2.4; p = 0.28) and LAVI by 1.07 mL/m2 (Δ ‒ 5.4 vs. ‒ 4.4; p = 0.83), and increased e' septal by 0.05 (Δ 0.2 vs. 0.1, p = 0.88), the difference was not statistically significant when compared with the values in the control group (Figure 2).
4. Discussion
In this study, the baseline characteristics of patients with HFpEF were a mean age ≥ 60 years, an equal number of men and women, and the dominant risk factors being hypertension ≥ 90% of patients, followed by diabetes mellitus and coronary artery disease (CAD). Compared with major studies such as TOPCAT (10), I-PRESERVE (9), CHARM-Preserved (8), PEP-CHF (7) and SENIORS (12); the patients in this study tended to be younger and had a higher frequency of diabetes
mellitus. Compared with the characteristics of patients with HFpEF in Southeast Asian countries as reported by MacDonald et al. (22), among Singaporean citizens with a variety of ethnic or racial backgrounds, a similar trend of slightly younger patients and slightly higher prevalence of CAD and diabetes was observed also in the present study. Another tendency of difference was found in medicine use, wherein more ACE-I or ARBs were administered in this study. Diastolic dysfunction evaluated using echocardiographic parameters also showed higher baseline data in terms of E/e' ratio (18.6 ± 3.4) than that reported by other studies that also used echocardiographic parameters to assess the effect of tested drugs, such as the Aldo-DHF study (mean medial E/e' 12.8 ± 4) (11).
Table 5. Post echocardiographic and ∆ changes between control and coenzyme Q10 groups
Parameter
Diastolic function E/e׳ ratio Medial e׳, cm/s Lateral e׳, cm/s E velocity, m/s E/A velocity ratio Decelaration t, ms LAVI, mL/m2
Systolic function LVEF,% LVIDd, mm LVIDs, mmOther variable LVMI, g/m2
Men Women
Control (14)
15.8 (5.6)4.8 (1.6)5.5 (1.7)75 (18)
1.08 (0.5)197 (46)30 (8)
57 (7)49 (8)32 (8)
131 (43)121 (33)145 (54)
Coenzyme Q10 (14)
15.1 (4.3)4.3 (1.1)5.1 (1.0)71 (20)
0.82(0.3)169 (45)26 (7)
56 (8)48 (9)33 (8)
129 (37)117 (35)140 (38)
*Significance value p < 0.05; anon-parametric Mann-Whitney test; bun-paired t-test. SD: standard deviation; LV: left ventricle; LAVI: left atrium volume index; LVEF: left ventricular ejection fraction; LVIDd: left ventricle internal diameter diastolic; LVIDs: left ventricle internal diameter systolic; LVMI: left ventricle mass index.
P value
0.85a
0.36b
0.42b
0.61b
0.10a
0.11b
0.18b
0.54a
0.76b
0.76b
0.76a
0.77a
0.94a
∆ changes
‒1.140.050.480.050.07‒30.9‒1.07
1.990.031.59
‒12.4
P value
0.28a
0.88b
0.39b
0.58b
0.94a
0.37a
0.72b
1.00a
1.00b
0.43b
0.78a
Post Coenzyme Q10-Control
Figure 2. Comparisons of pre-post ∆ changes of diastolic function between groups. P values describe comparisons of the changes of diastolic function the control or CoQ10 group. No additional improvement by CoQ10 after 1 month treatment.
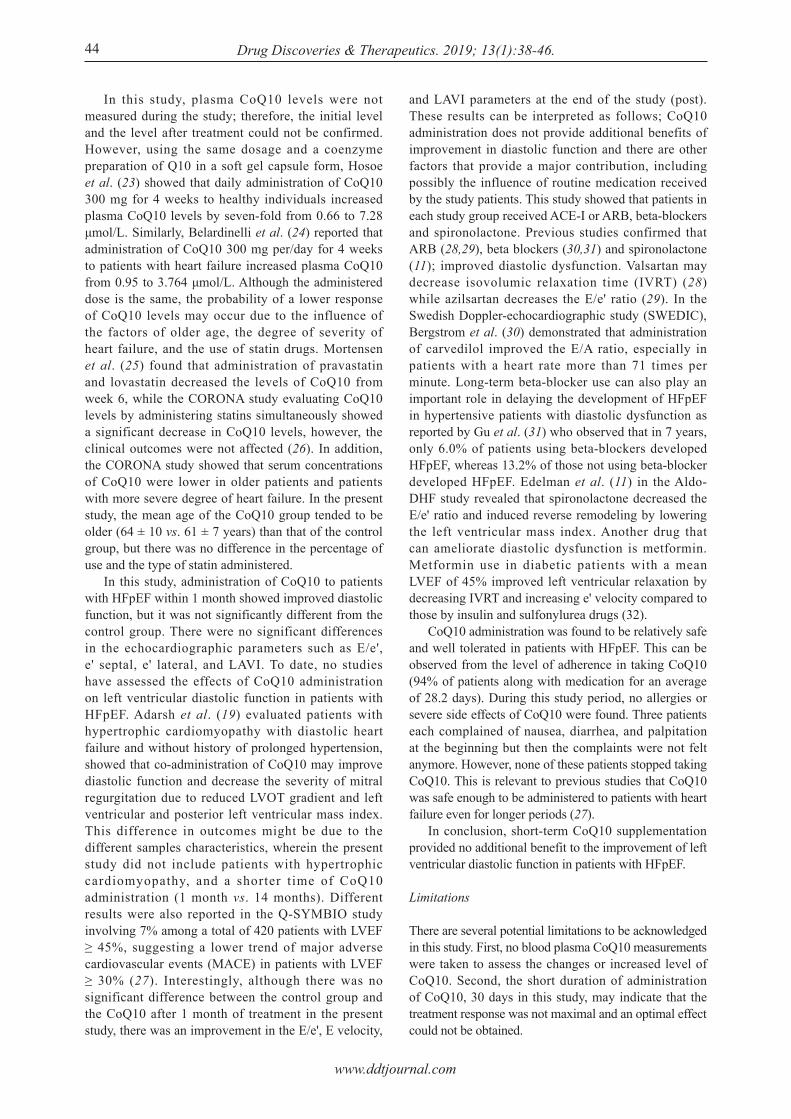
www.ddtjournal.com
Drug Discoveries & Therapeutics. 2019; 13(1):38-46.44
In this study, plasma CoQ10 levels were not measured during the study; therefore, the initial level and the level after treatment could not be confirmed. However, using the same dosage and a coenzyme preparation of Q10 in a soft gel capsule form, Hosoe et al. (23) showed that daily administration of CoQ10 300 mg for 4 weeks to healthy individuals increased plasma CoQ10 levels by seven-fold from 0.66 to 7.28 μmol/L. Similarly, Belardinelli et al. (24) reported that administration of CoQ10 300 mg per/day for 4 weeks to patients with heart failure increased plasma CoQ10 from 0.95 to 3.764 μmol/L. Although the administered dose is the same, the probability of a lower response of CoQ10 levels may occur due to the influence of the factors of older age, the degree of severity of heart failure, and the use of statin drugs. Mortensen et al. (25) found that administration of pravastatin and lovastatin decreased the levels of CoQ10 from week 6, while the CORONA study evaluating CoQ10 levels by administering statins simultaneously showed a significant decrease in CoQ10 levels, however, the clinical outcomes were not affected (26). In addition, the CORONA study showed that serum concentrations of CoQ10 were lower in older patients and patients with more severe degree of heart failure. In the present study, the mean age of the CoQ10 group tended to be older (64 ± 10 vs. 61 ± 7 years) than that of the control group, but there was no difference in the percentage of use and the type of statin administered. In this study, administration of CoQ10 to patients with HFpEF within 1 month showed improved diastolic function, but it was not significantly different from the control group. There were no significant differences in the echocardiographic parameters such as E/e', e' septal, e' lateral, and LAVI. To date, no studies have assessed the effects of CoQ10 administration on left ventricular diastolic function in patients with HFpEF. Adarsh et al. (19) evaluated patients with hypertrophic cardiomyopathy with diastolic heart failure and without history of prolonged hypertension, showed that co-administration of CoQ10 may improve diastolic function and decrease the severity of mitral regurgitation due to reduced LVOT gradient and left ventricular and posterior left ventricular mass index. This difference in outcomes might be due to the different samples characteristics, wherein the present study did not include patients with hypertrophic cardiomyopathy, and a shorter time of CoQ10 administration (1 month vs. 14 months). Different results were also reported in the Q-SYMBIO study involving 7% among a total of 420 patients with LVEF ≥ 45%, suggesting a lower trend of major adverse cardiovascular events (MACE) in patients with LVEF ≥ 30% (27). Interestingly, although there was no significant difference between the control group and the CoQ10 after 1 month of treatment in the present study, there was an improvement in the E/e', E velocity,
and LAVI parameters at the end of the study (post). These results can be interpreted as follows; CoQ10 administration does not provide additional benefits of improvement in diastolic function and there are other factors that provide a major contribution, including possibly the influence of routine medication received by the study patients. This study showed that patients in each study group received ACE-I or ARB, beta-blockers and spironolactone. Previous studies confirmed that ARB (28,29), beta blockers (30,31) and spironolactone (11); improved diastolic dysfunction. Valsartan may decrease isovolumic relaxation time (IVRT) (28) while azilsartan decreases the E/e' ratio (29). In the Swedish Doppler-echocardiographic study (SWEDIC), Bergstrom et al. (30) demonstrated that administration of carvedilol improved the E/A ratio, especially in patients with a heart rate more than 71 times per minute. Long-term beta-blocker use can also play an important role in delaying the development of HFpEF in hypertensive patients with diastolic dysfunction as reported by Gu et al. (31) who observed that in 7 years, only 6.0% of patients using beta-blockers developed HFpEF, whereas 13.2% of those not using beta-blocker developed HFpEF. Edelman et al. (11) in the Aldo-DHF study revealed that spironolactone decreased the E/e' ratio and induced reverse remodeling by lowering the left ventricular mass index. Another drug that can ameliorate diastolic dysfunction is metformin. Metformin use in diabetic patients with a mean LVEF of 45% improved left ventricular relaxation by decreasing IVRT and increasing e' velocity compared to those by insulin and sulfonylurea drugs (32). CoQ10 administration was found to be relatively safe and well tolerated in patients with HFpEF. This can be observed from the level of adherence in taking CoQ10 (94% of patients along with medication for an average of 28.2 days). During this study period, no allergies or severe side effects of CoQ10 were found. Three patients each complained of nausea, diarrhea, and palpitation at the beginning but then the complaints were not felt anymore. However, none of these patients stopped taking CoQ10. This is relevant to previous studies that CoQ10 was safe enough to be administered to patients with heart failure even for longer periods (27). In conclusion, short-term CoQ10 supplementation provided no additional benefit to the improvement of left ventricular diastolic function in patients with HFpEF.
Limitations
There are several potential limitations to be acknowledged in this study. First, no blood plasma CoQ10 measurements were taken to assess the changes or increased level of CoQ10. Second, the short duration of administration of CoQ10, 30 days in this study, may indicate that the treatment response was not maximal and an optimal effect could not be obtained.

www.ddtjournal.com
Drug Discoveries & Therapeutics. 2019; 13(1):38-46. 45
Acknowledgements
This work was supported by a grant from Diponegoro University in International Publication Research Scheme No: 474-72/UN7.P4.3/PP/2018 and DIPA Funding Faculty of Medicine No: 395/UN7.3.4/D/PG/2017
References
1. Roger VL, Go AS, Lloyd-Jones DM, et al. Heart disease and stroke statistics ‒ 2012 update: A report from the American Heart Association. Circulation. 2012; 125:e2-e220.
2. Bhatia RS, Tu JV, Lee DS, Austin PC, Fang J, Haouzi A, Gong Y, Liu PP. Outcome of heart failure with preserved ejection fraction in a population-based study. N Engl J Med. 2006; 355:260-269.
3. Bursi F, Weston SA, Redfield MM, Jacobsen SJ, Pakhomov S, Nkomo VT, Meverden RA, Roger VL. Systolic and diastolic heart failure in the community. JAMA. 2006; 296:2209-2216.
4. Owan TE, Hodge DO, Herges RM, Jacobsen SJ, Roger VL, Redfield MM. Trends in prevalence and outcome of heart failure with preserved ejection fraction. N Engl J Med. 2006; 355:251-259.
5. Lenzen MJ, Scholte op Reimer WJ, Boersma E, Vantrimpont PJ, Follath F, Swedberg K, Cleland J, Komajda M. Differences between patients with a preserved and a depressed left ventricular function: A report from the EuroHeart Failure Survey. Eur Heart J. 2004; 25:1214-1220.
6. Smith GL, Masoudi FA, Vaccarino V, Radford MJ, Krumholz HM. Outcomes in heart failure patients with preserved ejection fraction: mortality, readmission, and functional decline. J Am Coll Cardiol. 2003; 41:1510-1518.
7. Cleland JG, Tendera M, Adamus J, Freemantle N, Polonski L, Taylor J; PEP-CHF Investigators. The perindopril in elderly people with chronic heart failure (PEP-CHF) study. Eur Heart J. 2006; 27:2338-2345.
8. Yusuf S, Pfeffer MA, Swedberg K, Granger CB, Held P, McMurray JJ, Michelson EL, Olofsson B, Ostergren J; CHARM Investigators and Committees. Effects of candesartan in patients with chronic heart failure and preserved left-ventricular ejectionfraction: the CHARM-Preserved Trial. Lancet. 2003; 362:777-781.
9. Massie BM, Carson PE, McMurray JJ, Komajda M, McKelvie R, Zile MR, Anderson S, Donovan M, Iverson E, Staiger C, Ptaszynska A; I-PRESERVE Investigators. Irbesartan in patients with heart failure and preserved ejection fraction. N Engl J Med. 2008; 359:2456-2467.
10. Pitt B, Pfeffer MA, Assmann SF, et al. Spironolactone for heart failure with preserved ejection fraction. N Engl J Med. 2014; 370:1383-1392.
11. Edelmann F, Wachter R, Schmidt AG, et al. Effect of spironolactone on diastolic function and exercise capacity in patients with heart failure with preserved ejection fraction: the Aldo-DHF randomized controlled trial. JAMA. 2013; 309:781-791.
12. van Veldhuisen DJ, Cohen-Solal A, Bo ¨hm M, Anker SD, Babalis D, Roughton M, SENIORS Investigators. Beta-blockade with nebivolol in elderly heart failure patients with impaired and preserved left ventricular
ejection fraction: data from SENIORS (Study of effects of nebivololintervention on outcomes and rehospitalization in seniors with heart failure). J Am Coll Cardiol. 2009; 53:2150-2158.
13. Ponikowski P, Voors AA, Anker SD, et al. 2016 ESC Guidelines for the diagnosis and treatment of acute and chronic heart failure: The Task Force for the diagnosis and treatment of acute and chronic heart failure of the European Society of Cardiology (ESC)Developed with the special contribution of the Heart Failure Association (HFA) of the ESC. Eur Heart J. 2016; 37:2129-2200.
14. Phan TT, Abozguia K, Nallur Shivu G, Mahadevan G, Ahmed I, Williams L, Dwivedi G, Patel K, Steendijk P, Ashrafian H, Henning A, Frenneaux M. Heart failure with preserved ejection fraction is characterized by dynamic impairment of active relaxation and contraction of the left ventricle on exercise and associated with myocardial energy deficiency. J Am Coll Cardiol. 2009; 54:402-409.
15. Smith CS, Bottomley PA, Schulman SP, Gerstenblith G, Weiss RG. Altered creatine kinase adenosine triphosphate kinetics in failing hypertrophied human myocardium. Circulation. 2006; 114:1151-1158.
16. Sharma A, Fonarow GC, Butler J, Ezekowitz JA, Felker GM. Coenzyme Q10 and heart failure: A state-of-the-art review. Circ Heart Fail. 2016; 9:e002639.
17. Miles MV, Horn PS, Tang PH, Morrison JA, Miles L, DeGrauw T, Pesce AJ. Age-related changes in plasma coenzyme Q10 concentrations and redox state in apparently healthy children and adults. Clin Chim Acta. 2004; 347:139-144.
18. Bates A, Shen Q, Hiebert JB, Thimmesch A, Pierce JD. Myocardial energetics and ubiquinol in diastolic heart failure. Nurs Health Sci. 2014; 16:428-433.
19. Adarsh K, Kaur H, Mohan V. Coenzyme Q10 (CoQ10) in isolated diastolic heart failure in hypertrophic cardiomyopathy (HCM). Biofactors. 2008; 32:145-149.
20. Nagueh SF, Smiseth OA, Appleton CP, Byrd BF 3rd, Dokainish H, Edvardsen T, Flachskampf FA, Gillebert TC, Klein AL, Lancellotti P, Marino P, Oh JK, Popescu BA, Waggoner AD. Recommendations for the evaluation of left ventricular diastolic function by echocardiography: An update from the American Society of Echocardiography and the European Association of Cardiovascular Imaging. J Am Soc Echocardiogr. 2016; 29:277-314.
21. Nagueh SF, Appleton CP, Gillebert TC, Marino PN, Oh JK, Smiseth OA, Waggoner AD, Flachskampf FA, Pellikka PA, Evangelista A. Recommendations for the evaluation of left ventricular diastolic function by echocardiography. J Am Soc Echocardiogr. 2009; 22:107-133.
22. MacDonald MR, Wee PP, Cao Y, Yang DM, Lee S, Tong KL, Leong KT. Comparison of Characteristics and outcomes of heart failure patients with preserved versus reduced ejection fraction in a multiethnic southeast Asian cohort. Am J Cardiol. 2016; 118:1233-1238.
23. Hosoe K, Kitano M, Kishida H, Kubo H, Fujii K, Kitahara M. Study on safety and bioavailability of ubiquinol (Kaneka QHTM) after single and 4-week multiple oral administration to healthy volunteers. Regul Toxicol Pharmacol. 2007; 47:19-28.
24. Belardinelli R, Muçaj A, Lacalaprice F, Solenghi M, Seddaiu G, Principi F, Tiano L, Littarru GP. Coenzyme Q10 and exercise training in chronic heart failure. Eur Heart J. 2006; 27:2675-2681.

www.ddtjournal.com
Drug Discoveries & Therapeutics. 2019; 13(1):38-46.
25. Mortensen SA, Leth A, Agner E, Rohde M. Dose-related decrease of serum coenzyme Q10 during treatment with HMG-CoA reductase inhibitors. Mol Aspects Med. 1997; 18(Suppl):S137-S144.
26. McMurray JJ, Dunselman P, Wedel H, Cleland JG, Lindberg M, HjalmarsonA, Kjekshus J, Waagstein F, Apetrei E, Barrios V, Böhm M, Kamenský G, Komajda M, Mareev V, Wikstrand J; CORONA Study Group. Coenzyme Q10, rosuvastatin, and clinical outcomes in heart failure: a pre-specified substudy of CORONA (Controlled Rosuvastatin Multinational Study in heart failure). J Am Coll Cardiol. 2010; 56:1196-1204.
27. Mortensen SA, Rosenfeldt F, Kumar A, Dolliner P, Filipiak KJ, Pella D, Alehagen U, Steurer G, Littarru GP; Q-SYMBIO Study Investigators. The effect of coenzyme Q10 on morbidity and mortality in chronic heart failure: results from Q-SYMBIO: a randomized double-blind trial. JACC Heart Fail. 2014; 2:641-649.
28. Solomon SD, Janardhanan R, Verma A, et al. Effect of angiotensin receptor blockade and antihypertensive drugs on diastolic function in patients with hypertension and diastolic dysfunction: a randomised trial; Valsartan In Diastolic Dysfunction (VALIDD) Investigators. Lancet. 2007; 369:2079-2087
29. Sakamoto M, Asakura M, Nakano A, Kanzaki H, Sugano
Y, Amaki M, T, Hasegawa T, Anzai T, Kitakaze M. Azilsartan, but not candesartan improves left ventricular diastolic function in patients with hypertension and heart failure. Int J Gerontol. 2015; 9: 201-205.
30. Bergström A, Andersson B, Edner M, Nylander E, Persson H, Dahlström U. Effect of carvedilol on diastolic function in patients with diastolic heart failure and preserved systolic function. Results of the Swedish Doppler-echocardiographic study (SWEDIC). Eur J Heart Fail. 2004; 6:453-461.
31. Gu J, Fan YQ, Bian L, Zhang HL, Xu ZJ, Zhang Y, Chen QZ, Yin ZF, Xie YS, Wang CQ. Long-term prescription of beta-blocker delays the progression of heart failure with preserved ejection fraction in patients with hypertension: A retrospective observational cohort study. Eur J Prev Cardiol. 2016; 23:1421-1428.
32. Andersson C, Søgaard P, Hoffmann S, Hansen PR, Vaag A, Major-Pedersen A, Hansen TF, Bech J, Køber L, Torp-Pedersen C, Gislason GH. Metformin is associated with improved left ventricular diastolic function measured by tissue Doppler imaging in patients with diabetes. Eur J Endocrinol. 2010; 163:593-599.
(Received January 21, 2019; Revised February 20, 2019; Accepted February 26, 2019)
46

www.ddtjournal.com
Drug Discoveries & Therapeutics. 2019; 13(1):47-51. 47
End-of-life care conferences in Japanese nursing homes
Sho Nishiguchi1,2,3,*, Nagisa Sugaya2, Masahiko Inamori4
1 Department of General Internal Medicine, Shonan Kamakura General Hospital, Kamakura, Japan;2 Unit of Public Health and Preventive Medicine, Yokohama City University, Yokohama, Japan;3 Department of Internal Medicine, Hayama Heart Center, Miura, Japan;4 Department of Medical Education, Yokohama City University, Yokohama, Japan.
1. Introduction
In aging societies, nursing homes that provide 24-hour functional support to frail elderly residents (1), who require assistance due to diminished capacity, play an important role in end-of-life (EOL) care. In Japan, EOL care in nursing homes has gradually increased over the past decade (2-4). However, approximately 30% of facilities continue to transfer residents to hospitals for EOL care (2,4). In the remaining 70% of facilities, approximately 40% of the residents receive EOL care and ultimately die in hospitals rather than in nursing
homes (2,4). Thus, residents may be transferred to hospitals against their wishes for EOL care. Multidisciplinary care is a requirement of EOL care in nursing homes. However, providing EOL care overnight is challenging. Nurses in nearly all nursing homes work on-call shifts during the evenings (5). Professional caregivers in nursing homes usually perform EOL care without assistance during the nighttime (6). Thus, the professional caregiver's role may be practically the most important. Professional caregivers who do not have sufficient experience with EOL care have fears about EOL care (7). Thus, multidisciplinary care is essential to prevent unnecessary anxiety in nighttime professional caregivers who are inexperienced with EOL care. EOL care conferences were introduced in the Japanese guidelines for EOL care in nursing homes (8), which state that such conferences promote
Summary End-of-life (EOL) care conferences have an important role in promoting EOL care in nursing homes. However, the details of the conferences remain poorly understood. A Japanese prefecture-wide survey was conducted to investigate the factors involved in such conferences that contribute to an increase in the amount of EOL care. One hundred fifty-three nursing homes performed the conferences. The outcome was the amount of EOL care provided in nursing homes after adjusting for the facility beds in 2014. We investigated the factors of staff experience with EOL care, frequency of the conferences, years the conferences were conducted, review conferences after EOL care, and professional participants in the conferences. The multivariate analysis revealed significant associations between EOL care in nursing homes and nurses' experience with EOL care (adjusted β coefficient 2.9, 95% confidence interval (CI) 0.52 ~ 5.22, p = 0.017), more than 5 years of continuous conferences (adjusted β coefficient 3.8, 95% CI 0.46 ~ 7.05, p = 0.026), and family participation (adjusted β coefficient ‒4.0, 95% CI ‒7.5 ~ ‒0.48, p = 0.026). In conclusion, the continuation of conferences and enrollment of the nurse with experience in EOL care may promote EOL care in nursing homes, while family enrollment in conferences may decrease EOL care in nursing homes. EOL care conferences in nursing homes should be continuously performed by staff, with an experienced nurse undertaking the task of information sharing before discussing EOL care with the patients' families.
Keywords: End-of-life care conferences, end-of-life care, interdisciplinary care, interprofessional collaboration, nursing home, Japan
DOI: 10.5582/ddt.2019.01002Original Article
*Address correspondence to:Dr. Sho Nishiguchi, Department of General Internal Medicine, Shonan Kamakura General Hospital, Okamoto 1370-1, Kamakura City, Kanagawa Prefecture, 247-8533, Japan.E-mail: [email protected]
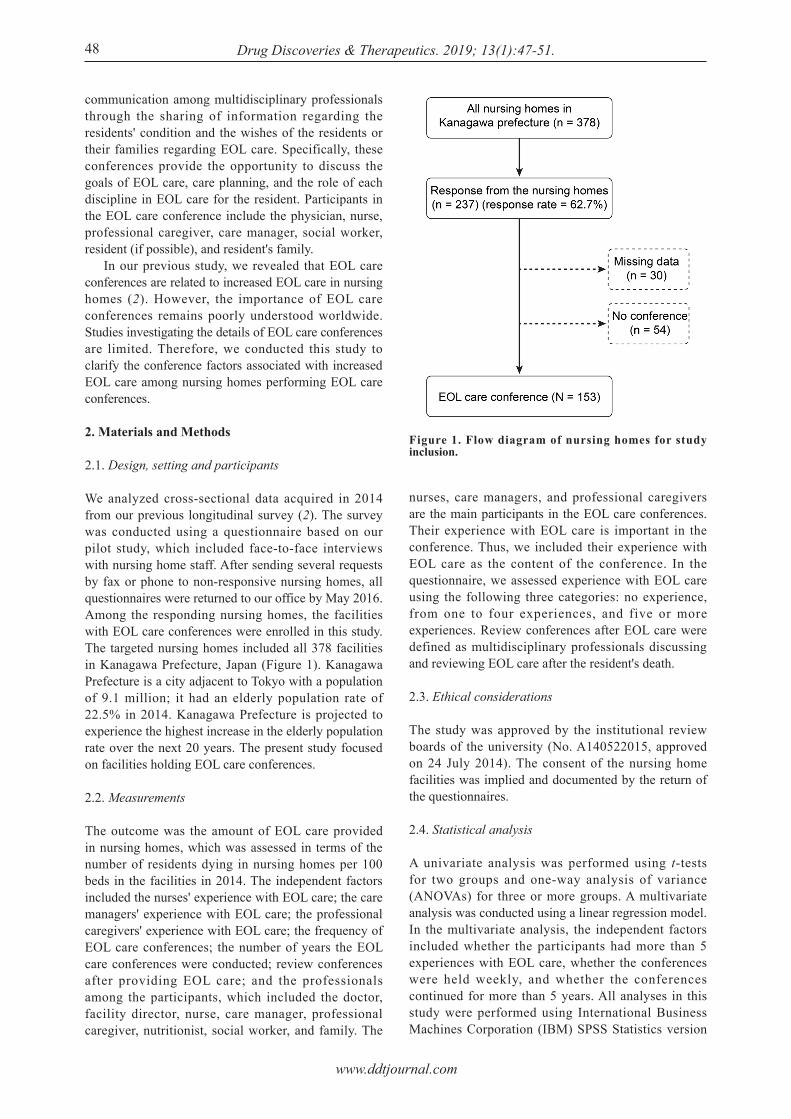
www.ddtjournal.com
Drug Discoveries & Therapeutics. 2019; 13(1):47-51.
communication among multidisciplinary professionals through the sharing of information regarding the residents' condition and the wishes of the residents or their families regarding EOL care. Specifically, these conferences provide the opportunity to discuss the goals of EOL care, care planning, and the role of each discipline in EOL care for the resident. Participants in the EOL care conference include the physician, nurse, professional caregiver, care manager, social worker, resident (if possible), and resident's family. In our previous study, we revealed that EOL care conferences are related to increased EOL care in nursing homes (2). However, the importance of EOL care conferences remains poorly understood worldwide. Studies investigating the details of EOL care conferences are limited. Therefore, we conducted this study to clarify the conference factors associated with increased EOL care among nursing homes performing EOL care conferences.
2. Materials and Methods
2.1. Design, setting and participants
We analyzed cross-sectional data acquired in 2014 from our previous longitudinal survey (2). The survey was conducted using a questionnaire based on our pilot study, which included face-to-face interviews with nursing home staff. After sending several requests by fax or phone to non-responsive nursing homes, all questionnaires were returned to our office by May 2016. Among the responding nursing homes, the facilities with EOL care conferences were enrolled in this study. The targeted nursing homes included all 378 facilities in Kanagawa Prefecture, Japan (Figure 1). Kanagawa Prefecture is a city adjacent to Tokyo with a population of 9.1 million; it had an elderly population rate of 22.5% in 2014. Kanagawa Prefecture is projected to experience the highest increase in the elderly population rate over the next 20 years. The present study focused on facilities holding EOL care conferences.
2.2. Measurements
The outcome was the amount of EOL care provided in nursing homes, which was assessed in terms of the number of residents dying in nursing homes per 100 beds in the facilities in 2014. The independent factors included the nurses' experience with EOL care; the care managers' experience with EOL care; the professional caregivers' experience with EOL care; the frequency of EOL care conferences; the number of years the EOL care conferences were conducted; review conferences after providing EOL care; and the professionals among the participants, which included the doctor, facility director, nurse, care manager, professional caregiver, nutritionist, social worker, and family. The
nurses, care managers, and professional caregivers are the main participants in the EOL care conferences. Their experience with EOL care is important in the conference. Thus, we included their experience with EOL care as the content of the conference. In the questionnaire, we assessed experience with EOL care using the following three categories: no experience, from one to four experiences, and five or more experiences. Review conferences after EOL care were defined as multidisciplinary professionals discussing and reviewing EOL care after the resident's death.
2.3. Ethical considerations
The study was approved by the institutional review boards of the university (No. A140522015, approved on 24 July 2014). The consent of the nursing home facilities was implied and documented by the return of the questionnaires.
2.4. Statistical analysis
A univariate analysis was performed using t-tests for two groups and one-way analysis of variance (ANOVAs) for three or more groups. A multivariate analysis was conducted using a linear regression model. In the multivariate analysis, the independent factors included whether the participants had more than 5 experiences with EOL care, whether the conferences were held weekly, and whether the conferences continued for more than 5 years. All analyses in this study were performed using International Business Machines Corporation (IBM) SPSS Statistics version
48
Figure 1. Flow diagram of nursing homes for study inclusion.

www.ddtjournal.com
Drug Discoveries & Therapeutics. 2019; 13(1):47-51. 49
(adjusted β coefficient 3.8, 95% CI 0.46 ~ 7.05, p = 0.026), and family participation (adjusted β coefficient ‒4.0, 95% CI ‒7.50 ~ ‒0.48, p = 0.026) were significantly associated with the number of residents dying in the nursing homes (Table 2).
J21 (IBM, Tokyo, Japan). A p-value < 0.05 was considered statistically significant in all analyses.
3. Results
Among all 378 nursing home facilities in the prefecture, 237 facilities (62.7%) responded after a reminder by fax or phone, and the remaining 141 nursing homes (37.3%) did not respond. Data were missing from 30 nursing homes. Among the available 207 facilities, 54 facilities held no EOL care conferences (Figure 1). Ultimately, 153 nursing homes (40.5%) were included in the present study, representing 73.9% of responding nursing homes performing EOL care conferences. Of these 153 facilities, 121 facilities (79.1%) were established before 2005. The mean elderly population rate in the area in which these facilities were located was 23.7% (standard deviation (SD): 3.2%), and the mean number of hospital beds per 10 million inhabitants in the facilities' regions was 806.8 (SD: 216.2). Sixty-two facilities (40.8%) used unit care, which generally requires all single rooms with a common living and dining room per 10 beds in a facility. Eleven (7.2%) doctors worked full time on site, and 69 doctors (45.1%) were on call for emergency care during the nighttime. The mean number of nurses was 6.6 (SD: 2.6), the mean number of full-time nurses on site was 3.4 (SD: 1.5), and 128 facilities (84.8%) adopted a nurse on-call system during the nighttime. The number of full-time nurses was few, and there was no nurse during the nighttime in almost all the nursing homes. If nurses' opinions are needed during the nighttime, professional caregivers or other staff will call on-call nurses in almost all facilities. Regarding the basic policies for EOL care, 122 (79.7%) facilities provided EOL care in the nursing home, 15 (9.8%) facilities transferred the residents to a hospital, and 16 (10.5%) facilities had no explicit policy. In total, 119 (77.8%) nursing homes adopted an EOL care bonus, and 14 facilities were preparing for this bonus in the near future. The results of the univariate analysis of the EOL care conference factors associated with the amount of EOL care provided in nursing homes are shown in Table 1. Among the factors involving experience with EOL care, the experience of the nurses (p = 0.020) and professional caregivers (p = 0.020) was significantly associated with the amount of EOL care provided in the nursing homes. No significant results were detected in the factors involving the content of the conference. Among the factors involving the participants in the conference, family enrollment (p = 0.020) was significantly associated with decreased EOL care in the nursing homes. In the multivariate analysis, the nurses' experience with EOL care (adjusted β coefficient 2.9, 95% confidence interval (CI), 0.52 ~ 5.22; p = 0.017), continuation of conferences for more than 5 years
Table 1. Univariate analysis of factors associated with EOL care in nursing homes (n = 153)
Items
Experience with EOL care Nurse 0 1-4 times ≥ 5 times Care manager 0 1-4 times ≥ 5 times Professional caregiver 0 1-4 times ≥ 5 timesContents of conference Frequency Every several days Every week Every two weeks Every month On a timely basis Years from initiation of the conference < 5years ≥ 5years Review conference after EOL care Yes NoParticipant Doctor Yes No Facility director Yes No Nurse Yes No Care manager Yes No Professional caregiver Yes No Nutritionist Yes No Social worker Yes No Family Yes No
Facility number
17 (11.1) 12 (7.8)119 (77.8)
17 (11.1) 29 (19.0)103 (67.3)
17 (11.1) 37 (24.2) 94 (61.4)
3 (2.6) 35 (22.9) 6 (3.9) 4 (2.6) 97 (63.4)
70 (45.8) 57 (37.3)
116 (75.8) 34 (22.2)
31 (20.3)116 (75.8)
51 (33.3) 96 (62.7)
145 (94.8) 2 (1.3)
145 (94.8) 3 (2.0)
145 (94.8) 3 (2.0)
131 (85.6) 16 (10.5)
32 (20.9)115 (75.2)
80 (52.3) 67 (43.8)
Amount of EOL care in nursing
homes
9.3 ± 8.4 7.2 ± 5.614.5 ± 9.6
14.0 ± 13.8 12.0 ± 10.113.5 ± 8.5
17.2 ± 15.3 9.6 ± 7.513.7 ± 8.4
6.2 ± 4.211.7 ± 8.710.0 ± 8.314.0 ± 9.7
15.7 ± 11.7
11.2 ± 8.314.0 ± 8.2
12.9 ± 8.514.9 ± 12.1
13.1 ± 12.113.2 ± 8.6
13.3 ± 11.813.1 ± 7.9
13.2 ± 9.4 11.3 ± 3.7
13.2 ± 9.4 8.0
12.9 ± 8.5 25.3 ± 29.0
13.3 ± 9.812.1 ± 5.5
13.7 ± 12.413.0 ± 8.4
11.5 ± 9.815.2 ± 8.5
EOL: end-of-life, Based on Student's t-test or one-way analysis of variance (ANOVA), where appropriate, *p < 0.05
p-value
0.020*
0.727
0.020*
0.516
0.069
0.290
0.985
0.952
0.780
0.580
0.536
0.454
0.760
0.021*

www.ddtjournal.com
Drug Discoveries & Therapeutics. 2019; 13(1):47-51.50
4. Discussion
In the present cross-sectional study performing a prefecture survey in Japan, nurses' experience with EOL care, the continuation of conferences for more than 5 years, and the lack of family participation were associated with increased EOL care in nursing homes among facilities performing EOL care conferences. In a previous small sample study, nurses' experience with EOL care had a positive effect on their tenure and professional efficacy (7). Moreover, in our previous study, we showed that employing nurses with more than 5 experiences with EOL care was associated with increased EOL care in nursing homes (2), which is consistent with the results of the present study involving facilities performing EOL care conferences. The association between the nurses' experiences and the increased EOL care in the nursing homes among facilities performing EOL care conferences may be associated with the nurses' leadership (9,10). The role of nurses is essential for the implementation of EOL care because nurses are the only medical providers in most nursing homes (2,5). To date, no studies have reported a relationship between increased EOL care in nursing homes and the continuation of EOL care conferences for more than 5 years. This result regarding the continuation of EOL care conference for more than 5 years is logical in terms of increased EOL care in nursing homes because improvement in EOL care in nursing homes requires time after the initiation of EOL care conferences. In the context of palliative care in an intensive care unit, family participation in conferences regarding EOL care promotes communication between families and the doctor, satisfaction and perceived quality of dying for
families, and communication of information to families (11-16). In the context of long-term palliative care, family participation in a conference regarding EOL care affects communication and understanding between the family and the facility's staff, reducing stress, anxiety and undesirable hospitalization (17). However, no study has investigated how family participation may interfere with EOL care in nursing homes. One explanation for the association between family participation and decreased EOL care in nursing homes may be the difficulty of reaching an agreement without information sharing and discussion among professional staff in facilities. In our interviews with the care managers of these facilities, nursing homes that provided more EOL care adopted the model shown in Figure 2, in which the care manager, as a representative of the facility, has the opportunity to speak with the resident's family after information sharing with the resident receiving EOL care and discussion in an EOL care conference. This model can contribute to smooth communication between the facility's staff and the residents' families regarding EOL care. Therefore, EOL care conferences may play an important role in sharing the residents' condition and discussing EOL care. Although interprofessional collaboration and communication in nursing homes have recently attracted attention (18-21), to the best of our knowledge, no study to date has investigated the details of the conferences regarding EOL care in nursing homes. Compared with that of a general survey study, the response rate in our study was higher due to collaboration with the local government's directors (Figure 1). Thus, the study's internal validity is high. The present study includes several limitations. First, there was a relatively large amount of missing data regarding EOL care conferences (Figure 1). Second, a study performed in a single prefecture surrounding a Japanese metropolis may have selection bias. Third, since the study used a cross-sectional design, the results of the present study are unable to address causal relationships. In our previous study, we reported that EOL care conferences were related to increased EOL care in nursing homes (2). The present study additionally investigated how EOL care conferences are performed
Figure 2. Hypothesis of the ideal relationship between nursing home staff and residents' family.
Table 2. Results of the multivariate analysis (n = 153)
Items
Experience with EOL care ≥5 times Nurse Care manager Professional caregiverContents of the conference Every week ≥ 5years Review conference after dyingParticipant Doctor Facility director Nurse Care manager Professional caregiver Nutritionist Social worker Family
β
2.9 1.2 -0.5
2.8 3.8 -0.3
1.5 1.5 -3.3 ‐ ‐ -2.4 1.4 -4.0
95%CI
0.52 ~ 5.22 -1.26 ~ 3.73 -2.94 ~ 1.95
-0.74 ~ 6.31 0.46 ~ 7.05 -4.34 ~ 3.69
-3.39 ~ 3.73 -2.30 ~ 5.24-16.36 ~ 9.68
‐‐
-8.40 ~ 3.65 -2.51 ~ 5.24
-7.50 ~ -0.48
EOL: end-of-life, CI: confidence interval. Based on multiple linear regression analysis, *p < 0.05. The factors of care manager and caregiver were excluded from the analysis, because almost all of those participate in an EOL care conference.
p-value
0.017*0.3270.689
0.1200.026*0.872
0.5410.4410.612‐‐0.4360.4840.026*

www.ddtjournal.com
Drug Discoveries & Therapeutics. 2019; 13(1):47-51. 51
to best achieve EOL care in nursing homes. However, as previously mentioned, a retrospective study design cannot demonstrate the causal relationship by which EOL care conferences promote EOL care in nursing homes. Therefore, a multifacility prospective study based on our results is needed in the near future for an aging society.
5. Conclusions
Nurses' experience with EOL care and the continuation of EOL care conferences for more than 5 years may promote EOL care in nursing homes, while family participation in the conferences may interfere with EOL care in nursing homes. EOL care conferences in nursing homes are recommended to be continuously performed by the facility's staff with an experienced nurse undertaking the task of information sharing, before discussing EOL care with the families.
Acknowledgements
The authors thank the Uehiro Foundation on Ethics and Education [grant number A-046, 2015]. Funding was also provided in part by the Kanagawa Public Health Association [2014] for the pilot survey. The authors thank the directors of the Health and Welfare Departments in Yokohama City, Kawasaki City, Yokosuka City, and Sagamihara City, Kanagawa Prefecture, who assisted with this study. The authors also thank Kanda Hideyuki MD, PhD (Shimane University, Japan) and Takahashi Kenzo MD, PhD, MHS (Teikyo University, Japan) for their thoughtful comments on the study.
References
1. Sanford A. Orrell M, Tolson D, et al. An international definition for "nursing home". J Am Med Dir Assoc. 2015; 16:181-184.
2. Nishiguchi S, Sugaya N, Sakamaki K, Mizushima S. End-of-life care bonus promoting end-of-life care in nursing homes: An 11-year retrospective longitudinal prefecture-wide study in Japan. Biosci Trends. 2017; 11:54-61.
3. Ikegami N, Ikezaki S. Nursing homes and end-of-life care in Japan. J Am Med Dir Assoc. 2013; 14:718-723.
4. Takezako Y, Ishikawa S, Kajii E. Advance directives in Japanese nursing homes. J Pain Symptom Manage. 2013; 45:63-70 e7.
5. Ikegami N, Ikezaki S. Japan's policy of promoting end-of-life care in nursing homes: Impact on facility and resident characteristics associated with the site of death. Health policy. 2012; 105:303-311.
6. Hashimoto M, Ono S. Factors Hindering End-of-life Care at Special Nursing Homes for the Elderly (special nursing homes); An Attitude Survey Involving the Staff of Special Elderly Nursing Homes, Which had Difficulty Promoting "End-of-life care". Shi-no-rinsho. 2014; 37:142-147. (in Japanese)
7. Abe K, Ohashi A. Positive effects of experience in terminal care on nursing home staff in Japan. Am J Hosp
Palliat Care. 2011; 28:389-392. 8. Mitsubishi Research Institute. Tokubetsu yougo roujin
homu niokeru shisetsu sarvice no shitsu kakuho ni kansuru kentou houkokusyo. 2007; 6-14. (in Japanese)
9. Fahlberg B, Buck H. Nurses: We can lead and transform palliative care. Nursing. 2017; 47:15-17.
10. D'Antonio J. End-of-life nursing care and education: End-of-life nursing education: Past and present. J Christ Nurs. 2017; 34:34-38.
11. Machare Delgado E, Callahan A, Paganelli G, Reville B, Parks SM, Marik PE. Multidisciplinary family meetings in the ICU facilitate end-of-life decision making. Am J Hosp Palliat Care. 2009; 26:295-302.
12. Azoulay E. The end-of- l i fe family conference: Communication empowers. Am J Respir Crit Care Med. 2005; 171:803-804.
13. Azoulay E, Pochard F, Chevret S, Lemaire F, Mokhtari M, Le Gall JR, Dhainaut JF, Schlemmer B. Meeting the needs of intensive care unit patient families: A multicenter study. Am J Respir Crit Care Med. 2001; 163:135-139.
14. Azoulay E, Pochard F, Chevret S, et al. Impact of a family information leaflet on effectiveness of information provided to family members of intensive care unit patients: A multicenter, prospective, randomized, controlled trial. Am J Respir Crit Care Med. 2002; 165:438-442.
15. Lilly CM, De Meo DL, Sonna LA, Haley KJ, Massaro AF, Wallace RF, Cody S. An intensive communication intervention for the critically ill. Am J Med. 2000; 109:469-475.
16. Curtis JR, Patrick DL, Shannon SE, Treece PD, Engelberg RA, Rubenfeld GD. The family conference as a focus to improve communication about end-of-life care in the intensive care unit: Opportunities for improvement. Crit Care Med. 2001; 29(2 Suppl):N26-33.
17. Parker D, Clifton K, Tuckett A, Walker H, Reymond E, Prior T, McAnelly K, Jenkin P, Israel F, Greeve K, Glaetzer K. Palliative care case conferences in long-term care: Views of family members. Int J Older People Nurs. 2016; 11:140-148.
18. Mueller CA, Tetzlaff B, Theile G, Fleischmann N, Cavazzini C, Geister C, Scherer M, Weyerer S, van den Bussche H, Hummers-Pradier E. Interprofessional collaboration and communication in nursing homes: A qualitative exploration of problems in medical care for nursing home residents - study protocol. J Adv Nurs. 2015; 71:451-457.
19. Fleischmann N, Geister C, Hoell A, Hummers-Pradier E, Mueller CA. Interprofessional collaboration in nursing homes (interprof): A grounded theory study of nurse experiences of general practitioner visits. Applied Nursing Research. 2017; 35:118-125.
20. Fleischmann N, Tetzlaff B, Werle J, Fleischmann N, Cavazzini C, Geister C, Scherer M, Weyerer S, van den Bussche H, Hummers-Pradier E. Interprofessional collaboration in nursing homes (interprof): A grounded theory study of general practitioner experiences and strategies to perform nursing home visits. BMC Fam Pract. 2016; 17:123.
21. Sheppard KD, Ford CR, Sawyer P, Foley KT, Harada CN, Brown CJ, Ritchie CS. The interprofessional clinical experience: Interprofessional education in the nursing home. J Interprof Care. 2015; 29:170-172.
(Received January 14, 2019; Revised February 19, 2019; Accepted February 25, 2019)

www.ddtjournal.com
Drug Discoveries & Therapeutics. 2019; 13(1):52-58.52
Preliminary X-ray crystallographic studies on the Helicobacter pylori ABC transporter glutamine-binding protein GlnH
Mohammad M. Rahman1, Mayra A. Machuca1, Anna Roujeinikova1,2,*
1 Infection and Immunity Program, Monash Biomedicine Discovery Institute, Department of Microbiology, Monash University, Clayton, Victoria, Australia;
2 Department of Biochemistry and Molecular Biology, Monash University, Clayton, Victoria, Australia.
1. Introduction
A significant portion of the world's population is infected with Helicobacter pylori (1), a motile, flagellated bacterium that colonizes the human gastric mucosa and is associated with chronic gastritis, gastric and duodenal ulcers (2). H. pylori infection has also been linked to an increased person's risk of developing mucosa-associated lymphoid tissue (MALT)-lymphoma (3), type 2 diabetes (4) and gastric adenocarcinoma (5). Currently, no vaccine is available against this pathogen; symptomatic patients are treated using a combination of at least two antibiotics plus a proton pump inhibitor/ bismuth citrate. In recent years, eradication rates have been falling due to the spread of resistance to some antibiotics (6,7). Therefore, there is an urgent need for identification of new protein targets for antibiotic
development. H. pylori takes up essential nutrients, such as amino acids, di- and oligopeptides and metal ions, from host cells (6-8). It scavenges the nutrients using various transport proteins including ATP-binding cassette (ABC) transporters (9-11). A canonical ABC transporter consists of two trans-membrane domains, two nucleotide-binding domains and a periplasmic substrate-binding protein (PBP), sometimes termed solute-binding protein (SBP) (12) . PBPs bind their substrates at the periplasmic space with high specificity and then deliver them to the cognate trans-membrane domains located in the cytoplasmic membrane. Although PBPs are very diverse in terms of the their amino acid sequence, their structural fold is highly conserved (13). The structure of a typical PBP comprises two globular lobes joined by a flexible hinge region. Many PBPs operate via the so-called "Venus flytrap" mechanism, where ligand binding at the interface results in a large conformational change due to the closure of the two lobes around the ligand molecule (14). In addition to their role in nutrient sensing, some PBPs mediate chemotaxis towards the nutrient source (15,16). Furthermore, it has been shown that PBPs play
Summary Periplasmic binding proteins (PBPs) of Gram-negative bacteria sense essential nutrients and mediate their uptake by ATP-binding cassette (ABC) transporters. The gene for a PBP of H. pylori SS1, annotated as GlnH, is located within the glnPQH operon encoding an ABC importer system. In this study, GlnH has been expressed in E. coli and purified to > 98% homogeneity. The recombinant protein was folded according to the circular dichroism (CD) analysis and behaved as a monomer in solution. Crystals of GlnH have been grown by the hanging-drop vapour-diffusion method using polyethylene glycol (PEG) 4000 as a precipitating agent. The crystals belonged to the primitive monoclinic space group P21 with unit cell parameters a = 38.67, b = 93.36, c = 64.13 Å, β = 93.72°. A complete X-ray diffraction data set was collected to 1.3 Å resolution from a single crystal using synchrotron radiation. Molecular replacement using this data revealed that the asymmetric unit contains a single molecule. This is a key step towards elucidation of the structural basis of the GlnH function.
Keywords: Helicobacter pylori, glutamine-binding protein, circular dichroism, protein crystallization, GlnH
DOI: 10.5582/ddt.2019.01008Brief Report
*Address correspondence to:Dr. Anna Roujeinikova, Infection and Immunity Program, Monash Biomedicine Discovery Institute, Department of Microbiology, Monash University, Clayton, Victoria 3800, Australia; Department of Biochemistry and Molecular Biology, Monash University, Clayton, Victoria 3800, Australia.E-mail: [email protected]

www.ddtjournal.com
Drug Discoveries & Therapeutics. 2019; 13(1):52-58.
roles in bacterial virulence, and may, for some bacteria, be immunogenic, raising the notion that PBPs may be targeted for the development of antibacterial vaccines, therapies and new drugs (14,17). Analysis of the whole genome sequences of different H. pylori strains suggested that this pathogen possesses seven to eight PBPs, of which one has been annotated as the ABC transporter glutamine-binding protein precursor, GlnH (18-21). In the genomic context, glnH is a part of the glnPQH operon, where glnP codes for an ABC transporter permease, and glnQ for an ATP binding subunit. Apart from this genome sequence-derived information, no studies have been published yet on H. pylori GlnH, and its natural ligand is not yet known. H. pylori GlnH shares only modest (24%) sequence identity with a well-characterized glutamine-binding protein from E. coli (GlnBP), which binds L-glutamine with a Kd of 0.5 μM (22-25). Interestingly, it shares 56% and 51% overall sequence identity with the cysteine-binding proteins Cj0982 from C. jejuni (26) and Ngo2014 from N. gonorrhoea (27), respectively. This suggests that GlnH may serve to deliver glutamine and/or cysteine to the permease encoded by glnP. In order to understand how GlnH interacts with its putative ligand and to elucidate its three-dimensional structure, we have initiated an X-ray crystallographic study of GlnH. This paper describes the cloning, purification, crystallization and the preliminary X-ray crystallographic analysis of recombinant GlnH from H. pylori strain SS1.
2. Materials and Methods
2.1. Gene cloning and overexpression
The signal sequence of H. pylori GlnH (NCBI ID WP_077232337.1) was predicted by using the online tools PrediSi (28) and Phobius (29). The coding sequence, lacking the signal peptide (residues 1-24), was codon-optimized, synthesized and ligated into the pet151/D-TOPO expression vector (Invitrogen, Waltham, MA, USA) by GenScript (Piscataway, USA). This vector harbors an N-terminal hexa-histidine tag followed by a V5 epitope and a tobacco etch virus (TEV) protease cleavage site (HHHHHHGKPIPNPLLGLDSTENLYFQGIDPFT). The recombinant protein used for thermal melts and crystallization comprised residues 25-277 of GlnH plus additional GIDPFT residues from the TEV cleavage site and the vector as a cloning artifact. The vector was transformed into E. coli BL21 DE3 (Novagen, Darmstadt, Germany) and cells were cultured at 37°C in Luria-Bertani (LB) medium supplemented with 50 µg/mL ampicillin (G-Bioscience, MO, USA). Overexpression of GlnH was induced with 1 mM of isopropyl β-D-1-thiogalactopyranoside (IPTG) (Astral Scientific, NSW, Australia) at an OD600 of 0.60, and growth was continued for a further 4 h. Cells were
then harvested by centrifugation at 4,800 × g for 15 min at 4°C.
2.2. Purification
Protein was purified by following the procedure described in (30). Briefly, harvested cells were resuspended in a buffer A (20 mM Tris-HCl pH 8.0, 100 mM NaCl, 1mM phenylmethylsulfonyl fluoride (Merck, Darmstadt, Germany)) and lysed using an EmulsiFlex-C5 high-pressure homogenizer (Avestin, Ottawa, Canada). Cell debris was then removed by centrifugation at 10,000× g for 15 min at 4°C. Imidazole (Sigma-Aldrich, MO, USA) and NaCl were added to the supernatant to final concentrations of 20 mM and 500 mM, respectively. The protein sample was loaded onto a 5 mL Ni-NTA affinity column (GE Healthcare, Chicago, IL, USA) pre-equilibrated with buffer B (20 mM Tris-HCl pH 8.0, 500 mM NaCl and 20 mM imidazole), washed with the same buffer and eluted with buffer C (20 mM Tris-HCl pH 8.0, 500 mM NaCl and 500 mM imidazole). The N-terminal His6 tag was either left on, or cleaved off using TEV protease (Invitrogen, Waltham, MA, USA) during overnight dialysis against buffer D (20 mM Tris-HCl pH 8.0, 150 mM NaCl, 2 mM DL-Dithiothreitol (DTT) (Sigma-Aldrich, MO, USA) and 1% v/v glycerol (Astral Scientific, NSW, Australia)) at 4°C. Following the incubation with TEV, NaCl and imidazole were added to the sample to final concentrations of 500 mM and 20 mM, respectively, and the cleaved tag, TEV protease and any uncleaved protein were removed by passing the sample through the Ni-NTA affinity column. The final stage in the purification of both tagged and untagged versions of the protein was gel filtration using the Superdex 200 HiLoad 26/60 column (GE Healthcare, Chicago, IL, USA) equilibrated with buffer E (20 mM Tris-HCl pH 8.0, 150 mM NaCl), at a flow rate of 4 mL/min. The peak fractions of the eluate were pooled, protein concentration was determined using the Bradford assay (31) and purity was assessed by sodium dodecyl sulfate-polyacrylamide gel electrophoresis (SDS-PAGE).
2.3. Size-exclusion chromatography coupled to multi-angle light scattering (SEC-MALS) analysis
SEC-MALS analysis involved an injection of 50 µL of the 100 µM GlnH-His6 solution in buffer E onto a Superdex 200 5/150 HiLoad size-exclusion column (GE Healthcare, Chicago, IL, USA) pre-equilibrated with buffer E flowing at 0.15 mL/min. The eluate was passed through a Shimadzu HPLC in-line DAWN HELEOS light scattering detector, an Optilab T-rEX differential refractive index detector and a quasi-elastic light scattering detector (WyattQELS, Wyatt Technology Corporation, Santa Barbara, CA, USA). The MALS
53

www.ddtjournal.com
Drug Discoveries & Therapeutics. 2019; 13(1):52-58.54
8.5 and 30% w/v polyethylene glycol (PEG) 4000. After two days, needle-like crystals also appeared in condition H3 of the JCSG+ Suite screen, containing 0.17 M ammonium sulfate, 25.5% w/v PEG 4,000 and 15% v/v glycerol. Manual optimization resulted in larger, rod-like crystals in a condition containing 0.2 M sodium acetate (Merck, Darmstadt, Germany), 0.05 M Tris-HCl pH 8.5 and 28% w/v PEG 4,000 (Sigma-Aldrich, MO, USA).
2.7. Data collection, processing and molecular replacement
Prior to data collection, the crystals were briefly soaked in a cryoprotectant solution containing 0.1 M Tris-HCl pH 8.5, 0.2 M sodium acetate, 36% w/v PEG 4,000 and 10% v/v glycerol, and flash-frozen in liquid nitrogen. X-ray diffraction data were collected from a single crystal to 1.3 A resolution using an ADSC Quantum 210r detector (Area Detector Systems Corporation, Poway, CA, USA) at the MX1 beamline of the Australian Synchrotron. A total of 360 images were taken using 0.5° oscillations. Data processing and scaling were performed using iMosflm (34) and AIMLESS (35), respectively from the CCP4 suite (36). The Matthews coefficient was calculated using MATTHEWS_COEF (37) from CCP4. Molecular replacement was performed using Phaser (38) from CCP4 with the structure of cysteine-binding protein from C. jejuni (PDB ID 1XT8) as a search model. Model refinement was carried out using Phenix (39).
3. Results and Discussion
The H. pylori glnH gene encodes a 277-a.a. long pre-protein containing a cleavable N-terminal signal peptide (a.a. 1-24). The recombinant GlnH that lacks the signal sequence was overexpressed in E. coli and purified to > 98% electrophoretic homogeneity as determined by Coomassie Blue-stained SDS-PAGE gel (Figure 1). The recombinant protein contained amino acid residues 25-277 of GlnH plus six N-terminal additional residues from the TEV cleavage site and the vector (GIDPFT). It migrated on SDS-PAGE with an apparent molecular weight (MW) of ~29 kDa, which is in agreement with the value calculated from the amino acid sequence (29.2 kDa). Prior to the biophysical and crystallization experiments, we searched for an optimal buffer, in which GlnH is most stable, using a thermal shift assay. We monitored thermal unfolding of the protein samples prepared in different buffers as they were heated from 35°C to 90°C. The results of this assay (Figure 2) suggested that the protein is more stable at pH 6.5-8.0 than at pH ≤ 6.0, and that within the pH 6.5-8.0 range, the melting temperature of the protein in the gel filtration buffer E (20 mM Tris-HCl pH 8.0, 150 mM
detectors were normalized against 100 μM of bovine serum albumin (BSA). Data collection and analysis was performed with ASTRA6 (Wyatt Technology Corporation).
2.4. Circular dichroism (CD) analysis
The purified GlnH-His6 was buffer-exchanged into 10 mM sodium phosphate pH 7.4. CD spectra were recorded using a J-815 spectropolarimeter (JASCO, Tokyo, Japan) at a protein concentration of 0.24 mg/mL in 2-mm path length cuvette (Starna Pty Ltd, NSW, Australia) at 25°C over a wavelength range of 200-250 nm with a scan rate of 20 nm/min. Spectra were recorded in triplicate and averaged. The secondary structure content was estimated by fitting the ellipticity data using the BeStSel server (32).
2.5. Protein buffer optimization
To assess the protein stability in different buffers, thermal melts were performed using a Rotor-Gene Q Real time PCR instrument (QIAGEN, Hilden, Germany). Purified GlnH in buffer E was concentrated to 12 mg/mL and then diluted 36-fold into a series of test buffers containing 10× SYPRO Orange reagent (Sigma-Aldrich, 5000× stock, catalogue number S5692). The samples were then thermally denatured by heating from 35°C to 90°C at a ramp rate of 0.5°C/min. Protein unfolding was monitored by following the SYPRO Orange fluorescence emission (λex 530 nm/λem 555 nm). The unfolding data were fit to a derivation of the Boltzmann equation for the two-state unfolding model to obtain the midpoint of denaturation (the melting temperature Tm) (33) using GraphPad Prism. All experiments were performed in triplicate.
2.6. Crystallization
GlnH was concentrated to 20 mg/mL using an Amicon Ultracel 10 kDa cut-off concentrator (Merck, Darmstadt, Germany) and centrifuged at 4°C for 30 min at 13,200× g to clarify the solution. The crystallization screening was performed by the hanging-drop vapour-diffusion method using an automated Phoenix crystallization robot (Art Robbins Instruments, CA, USA) and commercial screens PEG/Ion HT and Crystal Screen HT (Hampton Research, CA, USA), JCSG+ Suite (QIAGEN, Hilden, Germany) and JBS HTS1 and HTS2 (Jena Bioscience, Jena, Germany). The initial crystallization droplets contained 100 nL of protein solution plus 100 nL of reservoir solution, and were equilibrated against 50 μL of reservoir solution in a 96-well Art-Robins CrystalMation Intelli-plate (Hampton Research, CA, USA). After one day, needle-like crystals appeared in condition B10 of the Crystal Screen HT containing 0.2 M sodium acetate, 0.1 M Tris-HCl pH

www.ddtjournal.com
Drug Discoveries & Therapeutics. 2019; 13(1):52-58. 55
NaCl) does not differ much from that in other tested buffers. Therefore, to streamline the procedure, the protein for all subsequent experiments was prepared in the gel filtration buffer E. Circular dichroism analysis (Figure 3) of GlnH-His6 in the far-UV region of 200-250 nm involved fitting of the experimental spectrum for the purpose of secondary structure calculation using BeStSel server. The values derived from the spectrum (α 35%, β 21%) were very close to those predicted from the primary sequence analysis (α 34%, β 22%) using the YASPIN server (40), confirming that the recombinant protein is folded. SEC-MALS analysis was performed to determine the oligomeric state of GlnH-His6 in solution and the sample monodispersity. GlnH eluted as a single roughly symmetrical peak (Figure 4), the middle of which corresponds to a species with a polydispersity index value of 1.0. This indicates that the sample was largely homogenous with respect to the molecular mass.
The MW of Gln-His6, as determined by SEC-MALS analysis (Table 1), was 34.4 kDa, which is close to the value calculated from the protein sequence (32.2 kDa), demonstrating that this protein is monomeric in solution. This result is in agreement with the findings that majority of PBPs behave as monomers in solution at physiologically relevant concentrations, including, for example, YckK (a different periplasmic binding protein from H. pylori (41)), ModA (a molybdate-binding protein from the archaeon Methanosarcina acetivorans (42)), SitA (a metal-binding PBP from the Staphylococcus pseudintermedius (43)) and OppA (a putative-oligopeptide binding PBP from Thermotoga maritima (44)). Crystals of GlnH (Figure 5) were obtained using a sparse matrix crystallization approach. A complete
Figure 1. Coomassie blue-stained 15% SDS-PAGE gel of recombinant GlnH. M, molecular weight ladder; Lane 1, 15 μg of GlnH-His6 after the first Ni-NTA step; Lane 2, 15 μg of purified, untagged GlnH.
Figure 2. Effect of different buffers on the melting temperature Tm of GlnH. Results are means ± standard deviation (S.D.) for three independent replicates.
Figure 3. Far-UV CD spectrum of H. pylori GlnH.
Figure 4. SEC-MALS analysis of GlnH-His6. The peak (thin line) represents the UV trace for fractions containing protein. The UV absorbance values, normalized to 0-100% scale, are shown on the left-hand y-axis. The thick black line across the peak indicates the estimated molecular mass of the eluting protein particles (values are shown on the right-hand y axis).
Table 1. Molecular weights estimated by SEC-MALS analysis (BSA, bovine serum albumin)
Sample
GlnH-His6
BSA control
Molecular weight (kDa)
34.4 63.2
Polydispersity
1.01.0

www.ddtjournal.com
Drug Discoveries & Therapeutics. 2019; 13(1):52-58.56
data set was collected from a single cryo-cooled crystal using the Australian Synchrotron (AS) facility to a resolution of 1.3 A (Figure 6, Table 2). Autoindexing of the diffraction data with iMosflm suggested that the crystal belonged to the primitive monoclinic symmetry, with unit cell parameters a = 38.67, b = 93.36, c = 64.13 Å, α = 90.00, β = 93.72, γ = 90.00°. The analysis of the scaled data using POINTLESS (36) showed systematic absences along the 0k0 axis, with only reflections with k = 2n present, which suggested that the crystals belong to space group P21. The average I/σ(I) value was 15.8 for all reflections (resolution range 37.71-1.30 A) and 3.3 in the highest resolution shell (1.32-1.30 A). A total of 397,406 measurements were made of 106,244 independent reflections. Data processing gave an Rmerge of 0.046 for intensities (0.293 in the highest resolution shell). The data was 95% complete (69% completeness in the outer shell). Calculation of
the Matthews coefficient (VM) using MW = 29.2 kDa gave values of 4.0 and 2.0 A3 Da-1, assuming one or two subunits in the asymmetric unit, respectively (45). An automated molecular replacement (MR) was performed with Phaser using the coordinates of the cysteine-binding protein from C. jejuni (PDB ID 1XT8) as a search model. The MR solution contained 2 subunits in the asymmetric unit. After several rounds of XYZ and B refinement using the simulated annealing protocol in Phenix, the R and Rfree values fell from 0.481 and 0.487 to 30.2 and 32.9, respectively, confirming that the MR solution is correct. Model building is currently under way. Worku et al. (46) demonstrated that glutamine acts as a chemoattractant for the H. pylori isolates obtained from endoscopic biopsies of patients with non-ulcer dyspepsia or duodenal ulcer. Given the similarity of H. pylori GlnH to the glutamine-binding PBP of E. coli, it would be essential to establish in the future if glutamine is a natural ligand recognized by GlnH, and if not, what is, and what role GlnH plays in chemotaxis and in the nutrient uptake. Furthermore, determination of the crystal structure of GlnH in complex with its natural ligand will provide an insight into the structural basis of its ligand specificity that could be an important step towards the development of therapeutic small molecule inhibitors targeting chemotaxis or nutrient uptake.
Acknowledgements
We thank Danuta Maksel and Geoffrey Kwai Wai Kong at the Monash Macromolecular Crystallization Facility for their help in setting up robotic crystallization screens. Part of this research was undertaken on the MX1 beamline of the AS, Victoria, Australia. We also thank the AS staff for their assistance with data collection.
Figure 5. Crystals of GlnH from H. pylori SS1.
Figure 6. A representative diffraction image (0.5° oscillation) obtained for a GlnH crystal using an ADSC Quantum 210r detector on the MX1 station at the Australian Synchrotron, Victoria, Australia. The edge of the detector corresponds to the resolution of 1.36 A.
Table 2. Data-collection and processing statistics
Items
DetectorWavelength (A)Temperature (K)Total rotation range (°)Mosaicity (°)Space groupUnit cell parameters a, b, c (A) α, ꞵ, γ (°)Resolution range (A)Observed reflectionsUnique reflectionsMean I/σ(I)Completeness (%)MultiplicityRmerge
CC(1/2) (%)Rmeas
Rpim
MX1 beamline, Australian Synchrotron
ADSC Quantum 210r Detector0.951001800.33P21
38.67 93.36 64.1390.00 93.72 90.0037.71-1.30 (1.32-1.30)
397,406 (12,068)106,244 (3,795)
15.8 (3.3)95 (69)3.7 (3.2)
0.046 (0.293)99 (85)
0.062 (0.384)0.032 (0.210)
Values in parentheses are for the highest resolution shell.

www.ddtjournal.com
Drug Discoveries & Therapeutics. 2019; 13(1):52-58. 57
References
1. Mitchell H, Katelaris P. Epidemiology, clinical impacts and current clinical management of Helicobacter pylori infection. Med J Aust. 2016; 204:376-380.
2. Andersen LP. Colonization and infection by Helicobacter pylori in humans. Helicobacter. 2007; 12:12-15.
3. Pereira M-I, Medeiros JA. Role of Helicobacter pylori in gastric mucosa-associated lymphoid tissue lymphomas. World J Gastroenterol. 2014; 20:684-698.
4. Li JZ, Li JY, Wu TF, Xu JH, Huang CZ, Cheng D, Chen QK, Yu T. Helicobacter pylori infection is associated with type 2 diabetes, not type 1 diabetes: An updated meta-analysis. Gastroenterol Res Pract. 2017; 2017:5715403.
5. Kato M, Asaka M, Shimizu Y, Nobuta A, Takeda H, Sugiyama T. Relationship between Helicobacter pylori infection and the prevalence, site and histological type of gastric cancer. Aliment Pharmacol Ther. 2004; 20:85-89.
6. Nedenskov P. Nutritional requirements for growth of Helicobacter pylori. Appl Environ Microbiol. 1994; 60:3450-3453.
7. Weinberg MV, Maier RJ . Pept ide t ranspor t in Helicobacter pylori: Roles of dpp and opp systems and evidence for additional peptide transporters. J Bacteriol. 2007; 189:3392-3402.
8. Haley KP, Gaddy JA. Metalloregulation of Helicobacter pylori physiology and pathogenesis. Front Microbiol. 2015; 6:911.
9. Fischer F, Robbe-Saule M, Turlin E, Mancuso F, Michel V, Richaud P, Veyrier FJ, De Reuse H, Vinella D. Characterization in Helicobacter pylori of a nickel transporter essential for colonization that was acquired during evolution by gastric Helicobacter species. PLoS Pathog. 2016; 12:e1006018.
10. Cao DM, Lu QF, Li SB, Wang JP, Chen YL, Huang YQ, Bi HK. Comparative genomics of H. pylori and non-pylori Helicobacter species to identify new regions associated with its pathogenicity and adaptability. BioMed Res Int. 2016; 2016:6106029.
11. Shaik MM, Cendron L, Salamina M, Ruzzene M, Zanotti G. Helicobacter pylori periplasmic receptor CeuE (HP1561) modulates its nickel affinity via organic metallophores. Mol Microbiol. 2014; 91:724-735.
12. Wi lkens S . S t ruc tu re and mechan i sm of ABC transporters. F1000Prime Rep. 2015; 7:14.
13. Tam R, Saier MH, Jr. Structural, functional, and evolutionary relationships among extracellular solute-binding receptors of bacteria. Microbiol Rev. 1993; 57:320-346.
14. Felder CB, Graul RC, Lee AY, Merkle HP, Sadee W. The Venus flytrap of periplasmic binding proteins: An ancient protein module present in multiple drug receptors. AAPS Pharm Sci. 1999; 1:7-26.
15. Borrok MJ, Kiessling LL, Forest KT. Conformational changes of glucose/galactose-binding protein illuminated by open, unliganded, and ultra-high-resolution ligand-bound structures. Protein Sci. 2007; 16:1032-1041.
16. Dunten P, Mowbray SL. Crystal structure of the dipeptide binding protein from Escherichia coli involved in active transport and chemotaxis. Protein Sci. 1995; 4:2327-2334.
17. Garmory HS, Titball RW. ATP-binding cassette t ransporters are targets for the development of antibacterial vaccines and therapies. Infect Immun. 2004; 72:6757-6763.
18. Tomb JF, White O, Kerlavage AR, et al. The complete
genome sequence of the gastric pathogen Helicobacter pylori. Nature. 1997; 388:539-547.
19. McClain MS, Shaffer CL, Israel DA, Peek RM, Cover TL. Genome sequence analysis of Helicobacter pylori strains associated with gastric ulceration and gastric cancer. BMC genomics. 2009; 10:3-3.
20. Draper JL, Hansen LM, Bernick DL, Abedrabbo S, Underwood JG, Kong N, Huang BC, Weis AM, Weimer BC, van Vliet AH, Pourmand N, Solnick JV, Karplus K, Ottemann KM. Fallacy of the unique genome: Sequence diversity within single Helicobacter pylori strains. mBio. 2017; 8:e02321-16.
21. Baltrus DA, Amieva MR, Covacci A, Lowe TM, Merrell DS, Ottemann KM, Stein M, Salama NR, Guillemin K. The complete genome sequence of Helicobacter pylori strain G27. J Bacteriol. 2009; 191:447-448.
22. Masters PS, Hong JS. Genetics of the glutamine transport system in Escherichia coli. J Bacteriol. 1981; 147:805-819.
23. Willis RC, Iwata KK, Furlong CE. Regulation of glutamine transport in Escherichia coli. J Bacteriol. 1975; 122:1032-1037.
24. Shen QC, Simplaceanu V, Cottam PF, Ho C. Proton nuclear magnetic resonance studies on glutamine-binding protein from Escherichia coli. Formation of intermolecular and intramolecular hydrogen bonds upon ligand binding. J Mol Biol. 1989; 210:849-857.
25. Hsiao CD, Sun YJ, Rose J, Wang BC. The crystal structure of glutamine-binding protein from Escherichia coli. J Mol Biol. 1996; 262:225-242.
26. Muller A, Thomas GH, Horler R, Brannigan JA, Blagova E, Levdikov VM, Fogg MJ, Wilson KS, Wilkinson AJ. An ATP-binding cassette-type cysteine transporter in Campylobacter jejuni inferred from the structure of an extracytoplasmic solute receptor protein. Mol Microbiol. 2005; 57:143-155.
27. Bulut H, Moniot S, Licht A, Scheffel F, Gathmann S, Saenger W, Schneider E. Crystal structures of two solute receptors for L-cystine and L-cysteine, respectively, of the human pathogen Neisseria gonorrhoeae. J Mol Biol. 2012; 415:560-572.
28. Hiller K, Grote A, Scheer M, Munch R, Jahn D. PrediSi: Prediction of signal peptides and their cleavage positions. Nucleic Acids Res. 2004; 32:W375-379.
29. Kall L, Krogh A, Sonnhammer EL. A combined transmembrane topology and signal peptide prediction method. J Mol Biol. 2004; 338:1027-1036.
30. Woon AP, Tohidpour A, Alonso H, Saijo-Hamano Y, Kwok T, Roujeinikova A. Conformational analysis of isolated domains of Helicobacter pylori CagA. PloS One. 2013; 8:e79367.
31. Bradford MM. A rapid and sensitive method for the quantitation of microgram quantities of protein utilizing the principle of protein-dye binding. Anal Biochem. 1976; 72:248-254.
32. Micsonai A, Wien F, Bulyaki E, Kun J, Moussong E, Lee YH, Goto Y, Refregiers M, Kardos J. BeStSel: A web server for accurate protein secondary structure prediction and fold recognition from the circular dichroism spectra. Nucleic Acids Res. 2018; 46:W315-w322.
33. Orwig SD, Lieberman RL. Biophysical characterization of the olfactomedin domain of myocilin, an extracellular matrix protein implicated in inherited forms of glaucoma. PloS One. 2011; 6:e16347.
34. Battye TG, Kontogiannis L, Johnson O, Powell HR,

www.ddtjournal.com
Drug Discoveries & Therapeutics. 2019; 13(1):52-58.58
Leslie AG. iMOSFLM: A new graphical interface for diffraction-image processing with MOSFLM. Acta Crystallogr D Biol Crystallogr. 2011; 67:271-281.
35. Evans PR, Murshudov GN. How good are my data and what is the resolution? Acta Crystallogr D Biol Crystallogr. 2013; 69:1204-1214.
36. Winn MD, Ballard CC, Cowtan KD, et al. Overview of the CCP4 suite and current developments. Acta Crystallogr D Biol Crystallogr. 2011; 67:235-242.
37. Kantardjieff KA, Rupp B. Matthews coefficient probabilities: Improved estimates for unit cell contents of proteins, DNA, and protein-nucleic acid complex crystals. Protein Sci. 2003; 12:1865-1871.
38. McCoy AJ, Grosse-Kunstleve RW, Storoni LC, Read RJ. Likelihood-enhanced fast translation functions. Acta Crystallogr D Biol Crystallogr. 2005; 61:458-464.
39. Adams PD, Afonine PV, Bunkoczi G, et al. PHENIX: A comprehensive Python-based system for macromolecular structure solution. Acta Crystallogr D Biol Crystallogr. 2010; 66:213-221.
40. Lin K, Simossis VA, Taylor WR, Heringa J. A simple and fast secondary structure prediction method using hidden neural networks. Bioinformatics. 2005; 21:152-159.
41. Rahman M, Germantsis D, Machuca M, Ud-Din
A, Roujeinikova A. Crystallisation and preliminary crystallographic analysis of Helicobacter pylori periplasmic binding protein YckK. Crystals. 2017; 7:330.
42. Chan S, Giuroiu I, Chernishof I, Sawaya MR, Chiang J, Gunsalus RP, Arbing MA, Perry LJ. Apo and ligand-bound structures of ModA from the archaeon Methanosarcina acetivorans. Acta Crystallogr Sect F Struct Biol Cryst Commun. 2010; 66:242-250.
43. Abate F, Malito E, Cozzi R, Lo Surdo P, Maione D, Bottomley Matthew J. Apo, Zn2+-bound and Mn(2+)-bound structures reveal ligand-binding properties of SitA from the pathogen Staphylococcus pseudintermedius. Biosci Rep. 2014; 34:e00154.
44. Yoon HJ, Kim HJ, Mikami B, Yu YG, Lee HH. Crystal structure of a putative oligopeptide-binding periplasmic protein from a hyperthermophile. Extremophiles. 2016; 20:723-731.
45. Matthews BW. Solvent content of protein crystals. J Mol Biol. 1968; 33:491-497.
46. Worku ML, Karim QN, Spencer J, Sidebotham RL. Chemotactic response of Helicobacter pylori to human plasma and bile. J Med Microbiol. 2004; 53:807-811.
(Received January 30, 2019; Revised February 21, 2019; Accepted February 28, 2019)

www.ddtjournal.com
Drug Discoveries & Therapeutics. 2019; 13(1):59-61. 59
Role of LDL apheresis in a case of homozygous familial hypercholesterolemia
Talakola Naveen1, Ashutosh Biswas1, Naveet Wig1, Manish Soneja1, Pankaj Jorwal1, Chitikela Sindhura Durga1, Paras Singla1, Charusmita Chaudhary2, Upendra Baitha1,*
1 Department of Medicine, All India Institute of Medical Sciences, New Delhi, India;2 Department of Radiodiagnosis, All India Institute of Medical Sciences, New Delhi, India.
1. Introduction
Familial hypercholesterolemia (FH), otherwise also referred to as autosomal dominant hypercholesterolemia type 1 is a genetic disorder of the lipoprotein metabolism. It is characterized by high levels of serum low density lipoprotein (LDL), eruptive xanthomas all over the body and premature atherosclerotic disease affecting the heart, aorta, carotids and peripheral arteries. Homozygotes for the disease are at 100 times greater mortality risk from fatal myocardial infarction (MI) due to premature atherosclerotic damage to the coronary arteries than those without the disease (1,2). Timely recognition of the disease and aggressive lipid lowering is lifesaving in these patients. We are presenting a case of 18-year-old female exhibiting characteristic features of familial hypercholesterolemia.
2. Case Report
An 18-year-old girl, with a body mass index (BMI)
of 17.7 kg/m2 presented with eruptive xanthomas, gradually increasing in size over different parts of the body involving extensor surfaces of bilateral large and small joints of upper and lower limbs, thighs and gluteal regions since 8 years of age. The patient also had history of exertional shortness of breath and angina for which she was evaluated and found to have dyslipidemias along with severe valvular and supravalvular aortic stenosis and antero-medial leaflet prolapse of mitral valve causing severe mitral regurgitation. The patient was started on anti-lipidemic drugs and diuretics. However, the patient did not improve to treatment with these drugs. She underwent double valve replacement 1 year ago following which she remained asymptomatic. Since then, the patient was on atorvastatin (60 mg), warfarin, aspirin, digoxin and furosemide. The patient presented to our Out Patient Department (OPD) with fatigue and generalized malaise, increasing size and number of the skin lesions, with multiple reports showing very high levels of LDL (max. 959 mg/dL). Her triglycerides were also elevated while her high density lipoprotein (HDL) and very low density lipoprotein (VLDL) were within normal limit. On examination, she had xanthelasma palpebrarum over both the eyelids, multiple xanthomas over bilateral knuckles, fingers, elbows, knees, thighs and feet. Examination of eyes revealed arcus juvenilis and lipemiaretinalis in both the
Summary Familial hypercholesterolemia (FH) is a form of primary hyperlipoproteinemia characterized by the presence of high concentrations of serum low density lipoprotein (LDL) cholesterol, increased tendency to form xanthomas and early onset of coronary artery disease. This disease is an autosomal dominant disorder caused by defects in the gene that encode for the LDL receptor. Homozygous familial hypercholesterolemia is a rare occurrence and here we report a case of an 18-year-old girl with familial hypercholesterolemia treated with anti-lipidemic drugs and controlled only with LDL apheresis. The patient expired after 3 months highlighting the difficulties in management due to economic constraints in a resource limited setting in spite of availability of effective therapy.
Keywords: Autosomal dominant, xanthoma, coronary artery disease
DOI: 10.5582/ddt.2019.01001Case Report
*Address correspondence to:Dr. Upendra Baitha, Room No. 3094-A, 3rd Floor, Dept. of Medicine, All India Institute of Medical Sciences, New Delhi-110029, India.E-mail: [email protected]
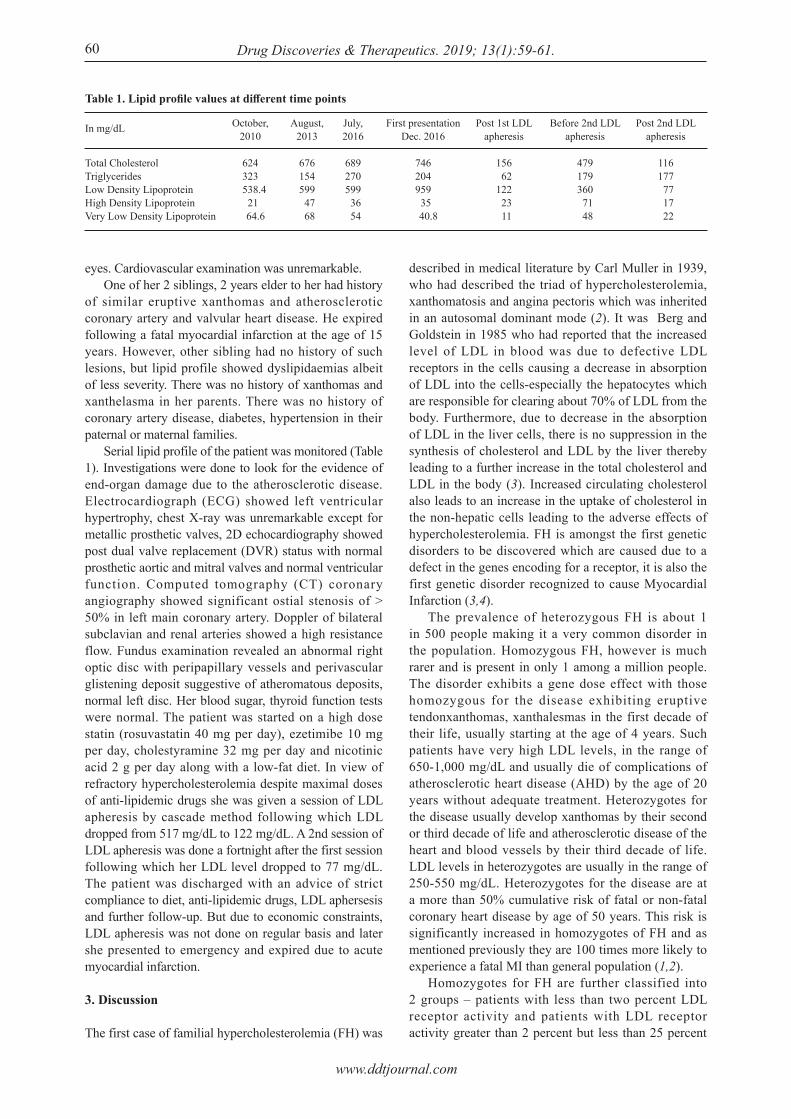
www.ddtjournal.com
Drug Discoveries & Therapeutics. 2019; 13(1):59-61.
eyes. Cardiovascular examination was unremarkable. One of her 2 siblings, 2 years elder to her had history of similar eruptive xanthomas and atherosclerotic coronary artery and valvular heart disease. He expired following a fatal myocardial infarction at the age of 15 years. However, other sibling had no history of such lesions, but lipid profile showed dyslipidaemias albeit of less severity. There was no history of xanthomas and xanthelasma in her parents. There was no history of coronary artery disease, diabetes, hypertension in their paternal or maternal families. Serial lipid profile of the patient was monitored (Table 1). Investigations were done to look for the evidence of end-organ damage due to the atherosclerotic disease. Electrocardiograph (ECG) showed left ventricular hypertrophy, chest X-ray was unremarkable except for metallic prosthetic valves, 2D echocardiography showed post dual valve replacement (DVR) status with normal prosthetic aortic and mitral valves and normal ventricular function. Computed tomography (CT) coronary angiography showed significant ostial stenosis of > 50% in left main coronary artery. Doppler of bilateral subclavian and renal arteries showed a high resistance flow. Fundus examination revealed an abnormal right optic disc with peripapillary vessels and perivascular glistening deposit suggestive of atheromatous deposits, normal left disc. Her blood sugar, thyroid function tests were normal. The patient was started on a high dose statin (rosuvastatin 40 mg per day), ezetimibe 10 mg per day, cholestyramine 32 mg per day and nicotinic acid 2 g per day along with a low-fat diet. In view of refractory hypercholesterolemia despite maximal doses of anti-lipidemic drugs she was given a session of LDL apheresis by cascade method following which LDL dropped from 517 mg/dL to 122 mg/dL. A 2nd session of LDL apheresis was done a fortnight after the first session following which her LDL level dropped to 77 mg/dL. The patient was discharged with an advice of strict compliance to diet, anti-lipidemic drugs, LDL aphersesis and further follow-up. But due to economic constraints, LDL apheresis was not done on regular basis and later she presented to emergency and expired due to acute myocardial infarction.
3. Discussion
The first case of familial hypercholesterolemia (FH) was
described in medical literature by Carl Muller in 1939, who had described the triad of hypercholesterolemia, xanthomatosis and angina pectoris which was inherited in an autosomal dominant mode (2). It was Berg and Goldstein in 1985 who had reported that the increased level of LDL in blood was due to defective LDL receptors in the cells causing a decrease in absorption of LDL into the cells-especially the hepatocytes which are responsible for clearing about 70% of LDL from the body. Furthermore, due to decrease in the absorption of LDL in the liver cells, there is no suppression in the synthesis of cholesterol and LDL by the liver thereby leading to a further increase in the total cholesterol and LDL in the body (3). Increased circulating cholesterol also leads to an increase in the uptake of cholesterol in the non-hepatic cells leading to the adverse effects of hypercholesterolemia. FH is amongst the first genetic disorders to be discovered which are caused due to a defect in the genes encoding for a receptor, it is also the first genetic disorder recognized to cause Myocardial Infarction (3,4). The prevalence of heterozygous FH is about 1 in 500 people making it a very common disorder in the population. Homozygous FH, however is much rarer and is present in only 1 among a million people. The disorder exhibits a gene dose effect with those homozygous for the disease exhibiting eruptive tendonxanthomas, xanthalesmas in the first decade of their life, usually starting at the age of 4 years. Such patients have very high LDL levels, in the range of 650-1,000 mg/dL and usually die of complications of atherosclerotic heart disease (AHD) by the age of 20 years without adequate treatment. Heterozygotes for the disease usually develop xanthomas by their second or third decade of life and atherosclerotic disease of the heart and blood vessels by their third decade of life. LDL levels in heterozygotes are usually in the range of 250-550 mg/dL. Heterozygotes for the disease are at a more than 50% cumulative risk of fatal or non-fatal coronary heart disease by age of 50 years. This risk is significantly increased in homozygotes of FH and as mentioned previously they are 100 times more likely to experience a fatal MI than general population (1,2). Homozygotes for FH are further classified into 2 groups – patients with less than two percent LDL receptor activity and patients with LDL receptor activity greater than 2 percent but less than 25 percent
60
Table 1. Lipid profile values at different time points
In mg/dL
Total CholesterolTriglyceridesLow Density LipoproteinHigh Density LipoproteinVery Low Density Lipoprotein
October,2010
624323
538.4 21
64.6
August,2013
676154599 47 68
July,2016
689270599 36 54
First presentationDec. 2016
746204959 35
40.8
Post 1st LDLapheresis
156 62122 23 11
Before 2nd LDLapheresis
479179360 71 48
Post 2nd LDLapheresis
116177 77 17 22

www.ddtjournal.com
Drug Discoveries & Therapeutics. 2019; 13(1):59-61. 61
and had succumbed to a fatal MI due to premature atherosclerotic coronary artery disease (CAD). The patient has a brother who is currently 22 years old and although he does not have eruptive xanthomas/xanthalesmas, he was found to have dyslipidemia on routine evaluation. Our patient also satisfies the WHO criteria for familial hypercholesterolemia (score > 8).
4. Conclusion
The clinical features and biochemical profile of this patient are consistent with homozygous familial hypercholesterolemia with atherosclerotic end organ damage. It is a rare disorder of lipid metabolism that is under diagnosed and under treated. Early detection and aggressive lipid lowering therapy with statins, non-statins along with regular LDL apheresis is recommended. LDL apheresis has definitive role in homozygous FH and it should be regularly done to maintain target level to prevent atherosclerotic complications. However if LDL apheresis cannot bring LDL levels to the recommended target level then patient may have to be considered for liver transplantation. Limited availability and economic issues are major concerns in management of these patients in a resource limited setting.
References
1. Austin MA, Hutter CM, Zimmern RL, Humphries SE. Genetic causes of monogenic heterozygous familial hypercholesterolemia: A HuGE prevalence review. Am J Epidemiol. 2004; 160:407-420.
2. Muller C. Angina pectoris in hereditary xanthomatosis. Arch Intern Med. 1939; 64:675.
3. Brown MS, Goldstein JL. A receptor-mediated pathway for cholesterol homeostasis. Science. 1986; 232:34-47.
4. Hobbs HH, Brown MS, Goldstein JL. Molecular genetics of the LDL receptor gene in familial hypercholesterolemia. Hum Mutat. 1992; 1:445-466.
5. R a d e r D J , C o h e n J , H o b b s H H . M o n o g e n i c hypercholesterolemia: new insights in pathogenesis and treatment. J Clin Invest. 2003; 111:1795-1803.
6. Tosi I, Toledo-Leiva P, Neuwirth C, Naoumova RP, Soutar AK. Genetic defects causing familial hypercholesterolaemia: Identification of deletions and duplications in the LDL-receptor gene and summary of all mutations found in patients attending the Hammersmith Hospital Lipid Clinic. Atherosclerosis. 2007; 194:102-111.
7. Sethuraman G, Thappa DM, Karthikeyan K. Intertriginous xanthomas ‒ a marker of homozygous famil ia l hypercholesterolemia. Indian Pediatr. 2000; 37:338.
(Received January 10, 2019; Revised February 22, 2019; Accepted February 25, 2019)
of normal. Plasma LDL levels have an inverse relation to the remaining LDL receptor (LDL-R) activity (5). The former group performs very poorly and without treatment succumbs to atherosclerotic heart disease by the age of 20 years. The latter group has a better prognosis and develops atherosclerotic disease by the third decade of life. Early and aggressive treatment to lower the LDL and total cholesterol levels with antilipidemic drugs as well as LDL apheresis in patients of FH is thus lifesaving. Over 1,600 mutations in the LDL receptor gene have been identified which cause FH. Five different genetic variants of FH have been identified by Tosi et al. in 2007 with each class having multiple alleles (6). Class 1 mutation – These are "null allele" mutations in which LDL-Rs are not produced due to large deletion mutations. Class 2 mutations – These are the most common mutations. They are caused due to the failure of the receptors to migrate to the cell surface. Class 3 mutations – These mutations lead to a defective APO-B component of LDL due to which LDL is unable to bind to its receptors. Class 4 mutations – These mutations result in the defective internalization of LDL-LDL receptor complexes. Class 5 mutations – These mutations interfere with the LDL receptors ability to recycle back to the cell surface. Raised LDL levels with few phenotypic similarities to familial hypercholesterolemia are also present in conditions like familial combined hypercholesterolemia, familial defective apolipoprotein B-100, autosomal recessive hypercholesterolemia (ARH), polygenic hypercholesterolemia and sitosterolemia. In our case the patient was clinically diagnosed with familial hypercholesterolemia, in view of the appearance at the age of 8 years of eruptive xanthomas over the extensor surfaces of bilateral large and small joints, thighs and gluteal regions. She also had the rare intertriginous xanthomas which have been described as pathognomonic for homozygous FH (7). At the same time she also had developed severe valvular heart disease secondary to premature atherosclerosis. After hospital admission patient was also diagnosed with an ostial narrowing of the left main coronary artery characteristic of atherosclerotic damage. There was also arcus juvenilis and lipemiaretinalis in the eyes. The patient had responded to aggressive lipid lowering with the use of statins, bile acid resins, ezetimibe along with LDL apheresis, which resulted in significant decrease in the size of her xanthomas and also subjective improvement of her fatigue and generalized malaise. The patient had a first degree relative who had also developed similar eruptive xanthomas

Guide for Authors
1. Scope of Articles
Drug Discoveries & Therapeutics welcomes contributions in all fields of pharmaceutical and therapeutic research such as medicinal chemistry, pharmacology, pharmaceutical analysis, pharmaceutics, pharmaceutical administration, and experimental and clinical studies of effects, mechanisms, or uses of various treatments. Studies in drug-related fields such as biology, biochemistry, physiology, microbiology, and immunology are also within the scope of this journal.
2. Submission Types
Original Articles should be well-documented, novel, and significant to the field as a whole. An Original Article should be arranged into the following sections: Title page, Abstract, Introduction, Materials and Methods, Results, Discussion, Acknowledgments, and References. Original articles should not exceed 5,000 words in length (excluding references) and should be limited to a maximum of 50 references. Articles may contain a maximum of 10 figures and/or tables.
Brief Reports definitively documenting either experimental results or informative clinical observations will be considered for publication in this category. Brief Reports are not intended for publication of incomplete or preliminary findings. Brief Reports should not exceed 3,000 words in length (excluding references) and should be limited to a maximum of 4 figures and/or tables and 30 references. A Brief Report contains the same sections as an Original Article, but the Results and Discussion sections should be combined.
Reviews should present a full and up-to-date account of recent developments within an area of research. Normally, reviews should not exceed 8,000 words in length (excluding references) and should be limited to a maximum of 100 references. Mini reviews are also accepted.
Policy Forum articles discuss research and policy issues in areas related to life science such as public health, the medical care system, and social science and may address governmental issues at district, national, and international levels of discourse. Policy Forum articles should not exceed 2,000 words in length (excluding references).
Case Reports should be detailed reports of the symptoms, signs, diagnosis, treatment, and follow-up of an individual patient. Case reports may contain a demographic profile of the patient but usually describe an unusual or novel occurrence. Unreported or unusual side effects or adverse interactions involving medications will also be considered. Case
Reports should not exceed 3,000 words in length (excluding references).
News articles should report the latest events in health sciences and medical research from around the world. News should not exceed 500 words in length.
Letters should present considered opinions in response to articles published in Drug Discoveries & Therapeutics in the last 6 months or issues of general interest. Letters should not exceed 800 words in length and may contain a maximum of 10 references.
3. Editorial Policies
Ethics: Drug Discoveries & Therapeutics r equ i r e s t ha t au tho r s o f r epo r t s o f investigations in humans or animals indicate that those studies were formally approved by a relevant ethics committee or review board.
Conflict of Interest : All authors are required to disclose any actual or potential conflict of interest including financial interests or relationships with other people or organizations that might raise questions of bias in the work reported. If no conflict of interest exists for each author, please state "There is no conflict of interest to disclose".
S u b m i s s i o n D e c l a r a t i o n : W h e n a manuscript is considered for submission to Drug Discoveries & Therapeutics, the authors should confirm that 1) no part of this manuscript is currently under consideration for publication elsewhere; 2) this manuscript does not contain the same information in whole or in part as manuscripts that have been published, accepted, or are under review elsewhere, except in the form of an abstract, a letter to the editor, or part of a published lecture or academic thesis; 3) authorization for publication has been obtained from the authors' employer or institution; and 4) all contributing authors have agreed to submit this manuscript.
Cover Letter: The manuscript must be accompanied by a cover letter signed by the corresponding author on behalf of all authors. The letter should indicate the basic findings of the work and their significance. The letter should also include a statement affirming that all authors concur with the submission and that the material submitted for publication has not been published previously or is not under consideration for publication elsewhere. The cover letter should be submitted in PDF format. For example of Cover Letter, please visit http://www.ddtjournal.com/downcentre.php (Download Centre).
C o p y r i g h t : A s i g n e d J O U R N A L PUBLISHING AGREEMENT (JPA) must be provided by post, fax, or as a scanned file before acceptance of the article. Only forms with a hand-written signature are accepted. This copyright will ensure the widest possible dissemination of information. A form facilitating transfer of copyright can be downloaded by clicking the appropriate link and can be returned to the e-mail address or fax number noted on the form (Please visit
Download Centre). Please note that your manuscript will not proceed to the next step in publication until the JPA form is received. In addition, if excerpts from other copyrighted works are included, the author(s) must obtain written permission from the copyright owners and credit the source(s) in the article.
Suggested Reviewers: A list of up to 3 reviewers who are qualified to assess the scientific merit of the study is welcomed. Reviewer information including names, affiliations, addresses, and e-mail should be provided at the same time the manuscript is submitted online. Please do not suggest reviewers with known conflicts of interest, including participants or anyone with a stake in the proposed research; anyone from the same institution; former students, advisors, or research collaborators (within the last three years); or close personal contacts. Please note that the Editor-in-Chief may accept one or more of the proposed reviewers or may request a review by other qualified persons.
Language Editing: Manuscripts prepared by authors whose native language is not English should have their work proofread by a native English speaker before submission. If not, this might delay the publication of your manuscript in Drug Discoveries & Therapeutics. The Editing Support Organization can provide English proofreading, Japanese-English translation, and Chinese-English translation services to authors who want to publish in Drug Discoveries & Therapeutics and need assistance before submitting a manuscript . Authors can vis i t this organization directly at http://www.iacmhr.com/iac-eso/support.php?lang=en. IAC-ESO was established to facilitate manuscript preparation by researchers whose native language is not English and to help edit works intended for international academic journals.
4. Manuscript Preparation
Manuscripts should be written in clear, grammatically correct English and submitted as a Microsoft Word file in a single-column format. Manuscripts must be paginated and typed in 12-point Times New Roman font with 24-point line spacing. Please do not embed figures in the text. Abbreviations should be used as little as possible and should be explained at first mention unless the term is a well-known abbreviation (e.g. DNA). Single words should not be abbreviated.
Title page: The title page must include 1) the title of the paper (Please note the title should be short, informative, and contain the major key words); 2) full name(s) and affiliation(s) of the author(s), 3) abbreviated names of the author(s), 4) full name, mailing address, telephone/fax numbers, and e-mail address of the corresponding author; and 5) conflicts of interest (if you have an actual or potential conflict of interest to disclose, it must be included as a footnote on the title page of the manuscript; if no conflict of interest exists for each author, please state "There is no conflict of interest to disclose"). Please visit Download Centre and refer to the title page of the manuscript sample.
Abstract: The abstract should briefly state the purpose of the study, methods, main findings, and conclusions. For article types including Original Article, Brief Report, Review, Policy Forum, and Case Report, a one-paragraph abstract consisting of no more than 250 words must be included in the manuscript. For News and Letters, a brief summary of main content in 150 words or fewer should be included in the manuscript. Abbreviations must be kept to a minimum and non-standard abbreviations explained in brackets at first mention. References should be avoided in the abstract. Key words or phrases that do not occur in the title should be included in the Abstract page.
Introduction: The introduction should be a concise statement of the basis for the study and its scientific context.
Materials and Methods: The description should be brief but with sufficient detail to enable others to reproduce the experiments. Procedures that have been published previously should not be described in detail but appropriate references should simply be cited. Only new and significant modifications of previously published procedures require complete description. Names of products and manufacturers with their locations (city and state/country) should be given and sources of animals and cell lines should always be indicated. All clinical investigations must have been conducted in accordance with Declaration of Helsinki principles. All human and animal studies must have been approved by the appropriate institutional review board(s) and a specific declaration of approval must be made within this section.
Results: The description of the experimental results should be succinct but in sufficient detail to allow the experiments to be analyzed and interpreted by an independent reader. If necessary, subheadings may be used for an orderly presentation. All figures and tables must be referred to in the text.
Discussion: The data should be interpreted concisely without repeating material already presented in the Results section. Speculation is permissible, but it must be well-founded, and discussion of the wider implications of the findings is encouraged. Conclusions derived from the study should be included in this section.
Acknowledgments: All funding sources should be credited in the Acknowledgments section. In addition, people who contributed to the work but who do not meet the criteria for authors should be listed along with their contributions.
References: References should be numbered in the order in which they appear in the text. Citing of unpublished results, personal communications, conference abstracts, and theses in the reference list is not recommended but these sources may be mentioned in the text. In the reference list, cite the names of all authors when there are fifteen or fewer authors; if there are sixteen or more authors, list the first three followed by et al. Names of journals should
be abbreviated in the style used in PubMed. Authors are responsible for the accuracy of the references. Examples are given below:
Example 1 (Sample journal reference): Nakata M, Tang W. Japan-China Joint Medical Workshop on Drug Discoveries and Therapeutics 2008: The need of Asian pharmaceutical researchers' cooperation. Drug Discov Ther. 2008; 2:262-263. Example 2 (Sample journal reference with more than 15 authors):Darby S, Hill D, Auvinen A, et al. Radon in homes and risk of lung cancer: Collaborative analysis of individual data from 13 European case-control studies. BMJ. 2005; 330:223. Example 3 (Sample book reference):Shalev AY. Post-traumatic stress disorder: Diagnosis, history and life course. In: Post-traumatic Stress Disorder, Diagnosis, Management and Treatment (Nutt DJ, Davidson JR, Zohar J, eds.). Martin Dunitz, London, UK, 2000; pp. 1-15.
Example 4 (Sample web page reference):World Health Organization. The World Health Report 2008 – primary health care: Now more than ever. http://www.who.int/whr/2008/whr08_en.pdf (accessed September 23, 2010).
Tables: All tables should be prepared in Microsoft Word or Excel and should be arranged at the end of the manuscript after the References section. Please note that tables should not in image format. All tables should have a concise title and should be numbered consecutively with Arabic numerals. If necessary, additional information should be given below the table.
Figure Legend: The figure legend should be typed on a separate page of the main manuscript and should include a short title and explanation. The legend should be concise but comprehensive and should be understood without referring to the text. Symbols used in figures must be explained.
Figure Preparation: All figures should be clear and cited in numerical order in the text. Figures must fit a one- or two-column format on the journal page: 8.3 cm (3.3 in.) wide for a single column, 17.3 cm (6.8 in.) wide for a double column; maximum height: 24.0 cm (9.5 in.). Please make sure that artwork files are in an acceptable format (TIFF or JPEG) at minimum resolution (600 dpi for illustrations, graphs, and annotated artwork, and 300 dpi for micrographs and photographs). Please provide all figures as separate files. Please note that low-resolution images are one of the leading causes of article resubmission and schedule delays. All color figures will be reproduced in full color in the online edition of the journal at no cost to authors.
Units and Symbols: Units and symbols conforming to the International System of Units (SI) should be used for physicochemical quantities. Solidus notation (e.g. mg/kg, mg/mL, mol/mm2/min) should be used. Please refer to the SI Guide www.bipm.org/en/si/ for standard units.
Supplementa l da ta : Supp l emen ta l data might be useful for supporting and enhancing your scientific research and Drug Discoveries & Therapeutics accepts the submission of these materials which will be only published online alongside the electronic version of your article. Supplemental files (figures, tables, and other text materials) should be prepared according to the above guidelines, numbered in Arabic numerals (e.g., Figure S1, Figure S2, and Table S1, Table S2) and referred to in the text. All figures and tables should have titles and legends. All figure legends, tables and supplemental text materials should be placed at the end of the paper. Please note all of these supplemental data should be provided at the time of initial submission and note that the editors reserve the right to limit the size and length of Supplemental Data.
5. Submission Checklist
The Submission Checklist will be useful during the final checking of a manuscript prior to sending it to Drug Discoveries & Therapeutics for review. Please visit Download Centre and download the Submission Checklist file.
6. Online submission
Manuscripts should be submitted to Drug Discoveries & Therapeutics online at http://www.ddtjournal.com. The manuscript file should be smaller than 5 MB in size. If for any reason you are unable to submit a file online, please contact the Editorial Office by e-mail at [email protected]
7. Accepted manuscripts
Proofs: Galley proofs in PDF format will be sent to the corresponding author via e-mail. Corrections must be returned to the editor ([email protected]) within 3 working days.
Offprints: Authors will be provided with electronic offprints of their article. Paper offprints can be ordered at prices quoted on the order form that accompanies the proofs.
Page Charge: A page charge of $140 will be assessed for each printed page of an accepted manuscript. The charge for printing color figures is $340 for each page. Under exceptional circumstances, the author(s) may apply to the editorial office for a waiver of the publication charges at the time of submission.
(Revised February 2013)
Editorial and Head Office:
Pearl City Koishikawa 6032-4-5 Kasuga, Bunkyo-kuTokyo 112-0003JapanTel: +81-3-5840-9697Fax: +81-3-5840-9698E-mail: [email protected]

JOURNAL PUBLISHING AGREEMENT (JPA)------------------------------------------------------------------------------------------------------------------------------------------Manuscript No.:
Title:
Corresponding author:------------------------------------------------------------------------------------------------------------------------------------------
The International Advancement Center for Medicine & Health Research Co., Ltd. (IACMHR Co., Ltd.) is pleased to accept the above article for publication in Drug Discoveries & Therapeutics. The International Research and Cooperation Association for Bio & Socio-Sciences Advancement (IRCA-BSSA) reserves all rights to the published article. Your written acceptance of this JOURNAL PUBLISHING AGREEMENT is required before the article can be published. Please read this form carefully and sign it if you agree to its terms. The signed JOURNAL PUBLISHING AGREEMENT should be sent to the Drug Discoveries & Therapeutics office (Pearl City Koishikawa 603, 2-4-5 Kasuga, Bunkyo-ku, Tokyo 112-0003, Japan; E-mail: [email protected]; Tel: +81-3-5840-9697; Fax: +81-3-5840-9698).
1. Authorship CriteriaAs the corresponding author, I certify on behalf of all of the authors that:1) The article is an original work and does not involve fraud, fabrication, or plagiarism.2) The article has not been published previously and is not currently under consideration for publication elsewhere. If accepted by Drug Discoveries & Therapeutics, the article will not be submitted for publication to any other journal.3) The article contains no libelous or other unlawful statements and does not contain any materials that infringes upon individual privacy or proprietary rights or any statutory copyright.4) I have obtained written permission from copyright owners for any excerpts from copyrighted works that are included and have credited the sources in my article.5) All authors have made significant contributions to the study including the conception and design of this work, the analysis of the data, and the writing of the manuscript.6) All authors have reviewed this manuscript and take responsibility for its content and approve its publication. 7) I have informed all of the authors of the terms of this publishing agreement and I am signing on their behalf as their agent.
2. Copyright Transfer AgreementI hereby assign and transfer to IACMHR Co., Ltd. all exclusive rights of copyright ownership to the above work in the journal Drug Discoveries & Therapeutics, including but not limited to the right 1) to publish, republish, derivate, distribute, transmit, sell, and otherwise use the work and other related material worldwide, in whole or in part, in all languages, in electronic, printed, or any other forms of media now known or hereafter developed and the right 2) to authorize or license third parties to do any of the above. I understand that these exclusive rights will become the property of IACMHR Co., Ltd., from the date the article is accepted for publication in the journal Drug Discoveries & Therapeutics. I also understand that IACMHR Co., Ltd. as a copyright owner has sole authority to license and permit reproductions of the article. I understand that except for copyright, other proprietary rights related to the Work (e.g. patent or other rights to any process or procedure) shall be retained by the authors. To reproduce any text, figures, tables, or illustrations from this Work in future works of their own, the authors must obtain written permission from IACMHR Co., Ltd.; such permission cannot be unreasonably withheld by IACMHR Co., Ltd.
3. Conflict of Interest DisclosureI confirm that all funding sources supporting the work and all institutions or people who contributed to the work but who do not meet the criteria for authors are acknowledged. I also confirm that all commercial affiliations, stock ownership, equity interests, or patent-licensing arrangements that could be considered to pose a financial conflict of interest in connection with the article have been disclosed.---------------------------------------------------------------------------------------------------------------------------------------------------------
Corresponding Author's Name (Signature):
Date:
Drug Discoveries & Therapeutics (www.ddtjournal.com)Pearl City Koishikawa 603, 2-4-5 Kasuga, Bunkyo-ku, Tokyo 112-0003, Japan; E-mail: [email protected]; Tel: +81-3-5840-9697; Fax: +81-3-5840-9698

