issn: 2476-6909; ecopersia. 2021;9(1):11-21 evaluation of
TRANSCRIPT

ISSN: 2476-6909; ECOPERSIA. 2021;9(1):11-21
C I T A T I O N L I N K S
Copyright© 2021, TMU Press. This open-access article is published under the terms of the Creative Commons Attribution-NonCommercial 4.0 International License which permits Share (copy and redistribute the material in any medium or format) and Adapt (remix, transform, and build upon the material) under the Attribution-NonCommercial terms.
Evaluation of Groundwater Suitability for Drinking, Irrigation, and Industrial Purposes (Case Study: Yazd-Ardakan Aquifer, Yazd Province, Iran)
[1] Evaluation of groundwater quality ... [2] Four billion people are facing ... [3] OECD environmental outlook to … [4] 21st century runoff sensitivities of major global river ... [5] Human impact on freshwater ecosystem ... [6] eemj.icpm.tuiasi ... [7] Occurrence and health implication of fluoride in groundwater of loess aquifer in the Chinese ... [8] Ground waterand climate … [9] Measuring global water security towards ... [10] Water balance of globalaquifers revealed by groundwater ... [11] Valuation of hidden water ecosystem services: The replacement cost of the aquifer … [12] Mechanism of fluoride enrichment in groundwater of hard rock aquifers ... [13] Geochemical characteristics and controlling factors of chemicalcomposition of … [14] Geochemistry and quality of groundwater of the Yarmouk ... [15]Evaluating the main sources of groundwater pollution in ... [16] Evaluation of groundwaterquality for drinking and irrigation purposes … [17] Groundwater quality evaluation usingwater ... [18] Evaluation of groundwater contamination for fluoride ... [19] Fragmented local governance and water resource … [20] Construction of a novel water quality index andquality indicator for reservoir water ... [21] Water quality for ... [22] A new proposal of theclassification of ... [23] evaluation of groundwater quality using … [24] Heavy metalcontamination and health risk assessment in ... [25] Evaluation of spatial variations ingroundwater quality ... [26] use of the water quality index and dissolved oxygen deficit ... [27] Use of water quality index for river classification ... [28] Application of water qualityindex for quality … [29] Assessment of water quality index of industrial ... [30] GIS-based evaluation of groundwater quality and ... [31] The analytical control of anti-corrosion water … [32] A new index for determining amount ... [33] Survey of corrosion and scaling potential produced … [34] Laboratory studies relating mineral ... [35] Evaluation of corrosion andscaling potential ... [36] Conjunctive water resources management with ... [37] A waterquality index- do we ... [38] Drinking-water quality ... [39] Soil and plant testing ... [40] Guidelines for drinking-water ...
Aims Water quality is an important factor in determining groundwater uses. An effort has been made to determine the groundwater quality of the Yazd-Ardakan aquifer. This research was conducted to fill the research gap in aquifer quality in the study area and make a comprehensive evaluation of the study aquifer using different water quality indices. The results can be used for decision-makers better to understand the water quality situation in the area. Materials & Methods In order to carry out this study, the Ryznar Stability Index (RSI), Langelier saturation index (LSI), Larson–Skold index (LS), and Puckorius scaling index (PSI) were considered to determine groundwater quality for industrial use. Also, the drinking water quality index (WQI) and FAO water quality index (FWQI); and irrigation water quality index (IWQI) were employed to categorize water suitability for drinking and irrigation uses. Finally, the spatial distribution of water quality parameters was assessed. Findings This study showed that the study aquifer is less corrosive based on PSI, significant, and heavy corrosive, according to LI. Also, results of the aquifer classification based on WQI indicated that about 45% of the aquifer is categorized as poor, very poor, and undesirable for drinking purposes. Finally, IWQI showed that %2.8 of the aquifer is categorized as “non-restriction” class and %4.1 as a “severe restriction” class for irrigation.Conclusion Therefore, it could be concluded that Yazd-Ardakan aquifer water quality is exacerbating. Consequently, the water quality and water treatments should be taken into account to mitigate the exacerbating trend of the Yazd-Ardakan aquifer.
A B S T R A C TA R T I C L E I N F O
Article TypeOriginal Research
AuthorsHekmatnia H. 1 PhD,Barzegari Banadkooki F. 2 PhD, Moosavi V. *3 PhD,Zare Chahouki A. 4 PhD
Keywords Agriculture; Aquifer; Geographic Information System (GIS); Water Quality
Correspondence* Address: Department of Watershed Management Engineering, Faculty of Natural Resources, Tarbiat Modares University, Imam Reza Blvd., Nur,Iran. Postal code: 46417-76489Phone: +98 (11) 44999121 Fax: +98 (11) 44999121
1Geography Department, Geography Faculty, Payame Noor University, Tehran, Iran.2Agricultural Department, Agricul-tural Faculty, Payame Noor Univer-sity, Tehran, Iran3Department of Watershed Man-agement Engineering, Faculty of Natural Resources, Tarbiat Modares University, Nur, Iran4Agricultural Department, Faculty of Natural Resources, Yazd University, Yazd, Iran
Article HistoryReceived: March 17, 2020 Accepted: July 18, 2020ePublished: October 24, 2020
How to cite this articleHekmatnia H, Barzegari Banadkoo-ki F, Moosavi V, Zare Chahouki A. Evaluation of Groundwater Suitabili-ty for Drinking, Irrigation, and Indu-strial Purposes (Case Study: Yazd-Ardakan Aquifer, Yazd Province, Ir-an). ECOPERSIA. 2021;9(1):11-21.

EvaluationofGroundwaterSuitabilityforDrinking,Irrigation…12
ECOPERSIAWinter2021,Volume9,Issue1
IntroductionWater is critical for sustainable development, and water resource constraints in many arid and semi-arid regions of the world are a serious threat to sustainable regional development [1]. Studies show that nearly two-thirds of the world’s population (four billion people) is experiencing water shortage at least a month [2]. Given the world’s population growth of 9 billion in 2050 and an increase of 55 percent in water per capita in 2050 compared to 2000, the water resources problem seems to be more serious in the future [3]. Surface water resources are under tension because of land use, changing urbanization, deforestation, pollution, and groundwater over-exploitation [4-7] essentially. Factors such as population growth, industrial and agricultural development, welfare levels, and climate changes have resulted in a rising water crisis in recent decades. This situation affects water resources capacity to meet the needs of the future population of the world [8, 9]. Today, nearly 1.7 billion of the world’s population live in the areas where groundwater is the only or the main water resource [10]. Given the critical state of the water resources and the management of this crisis, preserving existing water resources and supplying the water needed by communities is one of the main challenges [11]. Among the main challenges facing water resource managers, the contamination of these resources through the agricultural and industrial developments and urbanization is an important issue. This issue has affected groundwater resources and resulted in groundwater quality [1, 12, 13]. Many studies have been conducted in different parts of the world to investigate groundwater quality. Based on the results of a study conducted on groundwater quality and geochemical properties in northern Jordan, extensive agricultural activities, inappropriate drainage, and a high volume of wastewater were the main causes of groundwater contamination in it [14]. Studying the quality of groundwater resources in south Tehran showed that the main pollutants of the groundwater aquifer in the study area are silicate weathering of the surface soil, extensive agricultural activities, human wastewater, and industrial development [15]. The study of aquifer quality in the northwest of Libya reflected the impact of human activities and climatic factors, especially evaporation, on the quality of
groundwater resources in the area [16]. Water quality studies play an important role in clarifying and providing managers with appropriate decision-making tools [17]. In many countries, monitoring water quality is one of the major programs of water resource management organizations [18] Most of these countries have developed plans and guidelines for monitoring their water resources [19]. In these guidelines, indicators for studying the water resources quality are defined. Some of the most common indices in this regard are as the following: Water Quality Index (WQI) [20], FAO water quality index [21], Irrigation Water Quality Index (IWQI) [22], Industrial Water Quality Indices (PSI, RSI, LSI, LI) [23, 24] Among the preferred indicators for water quality monitoring, the WQI index is one of the most effective means of transferring water quality data to citizens, government officials, and policymakers [25]. The indicator is a simple way to summarize much water quality data as an indicator and water quality zoning [26]. The WQI index is used to integrate multiple water quality data and create an effective and understandable number to display water resource quality [27]. Different researchers have employed the WQI index to investigate the quality of surface water and groundwater resources worldwide. The WQI index was used to verify the water quality of the Karaj River between 2007 and 2009. The results showed that the water quality of the Karaj River in 2008 was more favorable than in 2009 and 2007, and the use of drinking water is necessary for river water treatment [28]. The WQI index was applied to study the surface water quality in the Bhilai steel plant in India. The results showed that only the parameters of alkalinity and magnesium are beyond the standard limits and other variables are in a favorable state [29]. The quality of drinking water and human health risks in southern India were examined using the WQI index. The results of this study showed that 86% of samples taken from underground water sources in the study area do not have a proper grade for drinking, and the amount of nitrate in 61% of samples is higher than the standards of the World Health Organization (WHO) [17].
Some studies used the IWQI index to evaluate water quality for irrigation uses [22, 25]. IWQI was introduced by Meireles etal. in 2010 [22] and then employed in different studies to classify

13HekmatniaH.etal.
ECOPERSIAWinter2021,Volume9,Issue1
irrigation water quality. Bessre etal. used IWQI to categorize irrigation water quality in Tunesia [30]. IWQI also was used to classify groundwater quality in Sistan and Baluchestan province, Iran, in terms of irrigation use [23]. Industrial water quality indices were also applied to investigate water quality in corrosion and its effects on industrial equipment and pipes. Langelier Saturation Index (LSI) defines the difference between pH and calcium carbonate saturation’s pH. This index is widely used as a scale prediction tool [31]. LSI has been considered a worthwhile network monitoring parameter, especially when CaCO3 is used as a protective layer. Ryznar developed a similar index by modification of the Langelier index formula [32]. The maximum quantity of sediments formed in the equilibrium, based on buffer capacity, is predicted by the Puckorius Scaling index (PSI) [33]. Larson-Skold index (LS) also evaluates the tendency of water to corrosion of the cast-iron and steel pipes [34]. PSI, RSI, LSI, and LI indices are the most important indices to evaluate industrial water quality. Corrosion and scaling potential of water was evaluated using PSI, RSI, LSI, and LI indices in rural water supply distribution networks of Tabas city in Iran [35]. Industrial water quality indices (PSI, RSI, LSI, LI) were also used to classify groundwater quality in Sistan and Baluchestan province in Iran [23, 24] Despite studies on the quality of water resources around the world, due to the undeniable effects of water on human life components such as health, industry, agriculture and the like, as well as reducing the precipitations and high volume of groundwater extraction, identifying the qualitative characteristics of water and compliance rates, it is of great importance to managers for various uses. This problem, along with severe and prolonged drought, has created a critical situation in the country and has caused most of the regions to face serious challenges in terms of quantity and quality of groundwater. Yazd-Ardakan plain is one of these areas. All conducted researches show that without conducting qualitative water quality studies, it is not possible to plan the water resources allocation for various uses. Due to population growth and the need for development, suitable and standard water is a critical issue. The majority of the recent studies have emphasized on the drinking or agricultural water quality. Only a few works in the literature demonstrated
a comprehensive evaluation of water quality from different drinking, agricultural, and industrial aspects. Besides, despite accelerated development in the study area and the vital role of water as an important resource, no efforts have been made to specify a comprehensive assessment of groundwater quality in the study region. This research was conducted to fill this gap and evaluate water quality in the Yazd-Ardakan aquifer in terms of physicochemical parameters from different perspectives using several water quality indices.
MaterialsandMethodsStudyareaYazd-Ardakan aquifer is located between 31°15′N to 32°30′N latitude and 53°30′E to 55°E longitude in central Iran. It covers an area of about 12473km2. There are 945 wells in the Yazd-Ardakan basin, 821 of which with annual extraction of 275Mm3 are located in Yazd -Ardakan aquifer, and others are located in secondary and small mountainous aquifers. Moreover, there are 22 deep wells with an annual extraction of 15Mm3 to supply drinking water. Also, 52Mm3 of groundwater of the Yazd-Ardakan basin are drained through Qanats, but only 7Mm3 of this extraction is related to the main aquifer [36]. There are 64 piezometric wells in the region (Figure 1). This area is divided into four cities, including Yazd, Ashkezar, Meybod, and Ardakan. The area has a hot and dry climate. Because of these climatic factors, groundwater plays an essential role in human survival and development. In recent decades, the population and industrial growth of the region have led to an increasing trend in groundwater exploitation and inter-basin water transportation from Isfahan. It seems there is a need for water quality assessments of the Yazd-Ardakan aquifer. Water samples were collected from piezometric wells located in the region from the 2017-2018 period. The samples were examined based on the water and wastewater examination standards. Important water quality affecting factors were analyzed, including electrical conductivity (EC), the concentration of hydrogen ion (pH), total dissolved solids (TDS), sodium (Na+), potassium (K+), calcium (Ca+2), magnesium (Mg+2), bicarbonate (Hco3-), carbonate (Co3-), sulfate (So4-) and chloride (Cl-). It should be noticed that all parameters, except pH, are expressed as milliequivalent per liter.

EvaluationofGroundwaterSuitabilityforDrinking,Irrigation…14
ECOPERSIAWinter2021,Volume9,Issue1
Figure1) Location of Yazd-Ardakan aquifer and piezometric wells
Drinking‐Water Quality DeterminationUsingWaterQualityIndex(WQI)Water quality evaluation was performed using WQI, which is widely used for drinking water quality assessment. The WQI is also specified for groundwater quality evaluation. WQI index was initially introduced by Brown etal. [37] and then developed by Backman etal. [38]. Based on the world health organization (WHO) report in 2004, WQI is a composite index quantifying water quality [39]. The value of each qualitative parameter is evaluated based on the standard and related to other parameters. The value of physicochemical parameters and their relative importance in the overall quality of drinking water is applied to calculate the WQI index. The relative weight is calculated based on Equation 1.
𝑊 ∑∑ (1)
where 𝑊 is weighting factor (∑ 𝑊 1) and n is the number of parameters. The relative weight assigned to parameters is presented in Table 1. By comparing the observed value of each parameter to a benchmark (water quality standard), the quality rating scale was calculated [35]. The results of the analysis were multiplied by 100, as presented in Equation 2. q (2)
in which q is the quality rating value of parameter I, C represents the concentration of each parameter in the water sample, and S is the standard for each parameter according to
Yazd
Yazd
15HekmatniaH.etal.
ECOPERSIAWinter2021,Volume9,Issue1
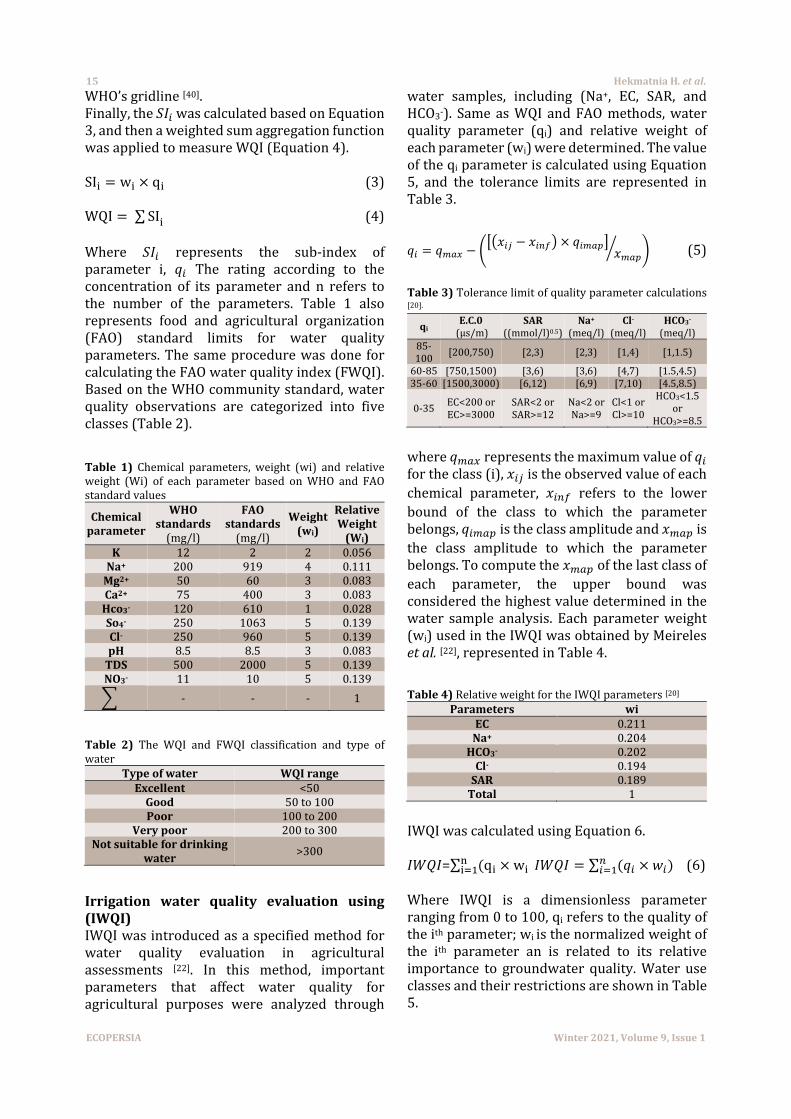
WHO’s gridline [40]. Finally, the 𝑆𝐼 was calculated based on Equation 3, and then a weighted sum aggregation function was applied to measure WQI (Equation 4). SI w q (3) WQI ∑ SI (4) Where 𝑆𝐼 represents the sub-index of parameter i, 𝑞 The rating according to the concentration of its parameter and n refers to the number of the parameters. Table 1 also represents food and agricultural organization (FAO) standard limits for water quality parameters. The same procedure was done for calculating the FAO water quality index (FWQI). Based on the WHO community standard, water quality observations are categorized into five classes (Table 2).
Table1) Chemical parameters, weight (wi) and relative weight (Wi) of each parameter based on WHO and FAO standard values
Chemicalparameter
WHOstandards
(mg/l)
FAOstandards
(mg/l)
Weight(wi)
RelativeWeight(Wi)
K 12 2 2 0.056 Na+ 200 919 4 0.111 Mg2+ 50 60 3 0.083 Ca2+ 75 400 3 0.083 Hco3‐ 120 610 1 0.028 So4‐ 250 1063 5 0.139 Cl‐ 250 960 5 0.139 pH 8.5 8.5 3 0.083 TDS 500 2000 5 0.139 NO3‐ 11 10 5 0.139
- - - 1
Table 2) The WQI and FWQI classification and type of water
Typeofwater WQIrangeExcellent <50 Good 50 to 100 Poor 100 to 200
Verypoor 200 to 300 Notsuitablefordrinking
water>300
Irrigation water quality evaluation using(IWQI)IWQI was introduced as a specified method for water quality evaluation in agricultural assessments [22]. In this method, important parameters that affect water quality for agricultural purposes were analyzed through
water samples, including (Na+, EC, SAR, and HCO3-). Same as WQI and FAO methods, water quality parameter (qi) and relative weight of each parameter (wi) were determined. The value of the qi parameter is calculated using Equation 5, and the tolerance limits are represented in Table 3. 𝑞 𝑞 𝑥 𝑥 𝑞
𝑥 (5) Table3) Tolerance limit of quality parameter calculations [20]. qi
E.C.0(µs/m)
SAR((mmol/l)0.5)
Na+ (meq/l)
Cl‐(meq/l)
HCO3‐
(meq/l)85-100 [200,750) [2,3) [2,3) [1,4) [1,1.5)
60-85 [750,1500) [3,6) [3,6) [4,7) [1.5,4.5) 35-60 [1500,3000) [6,12) [6,9) [7,10) [4.5,8.5)
0-35 EC<200 or EC>=3000
SAR<2 or SAR>=12
Na<2 or Na>=9
Cl<1 or Cl>=10
HCO3<1.5 or
HCO3>=8.5
where 𝑞 represents the maximum value of 𝑞 for the class (i), 𝑥 is the observed value of each chemical parameter, 𝑥 refers to the lower bound of the class to which the parameter belongs, 𝑞 is the class amplitude and 𝑥 is the class amplitude to which the parameter belongs. To compute the 𝑥 of the last class of each parameter, the upper bound was considered the highest value determined in the water sample analysis. Each parameter weight (wi) used in the IWQI was obtained by Meireles etal. [22], represented in Table 4.
Table4) Relative weight for the IWQI parameters [20]
Parameters wiEC 0.211 Na+ 0.204 HCO3‐ 0.202 Cl‐ 0.194 SAR 0.189 Total 1
IWQI was calculated using Equation 6. 𝐼𝑊𝑄𝐼=∑ q w 𝐼𝑊𝑄𝐼 ∑ 𝑞 𝑤 (6) Where IWQI is a dimensionless parameter ranging from 0 to 100, qi refers to the quality of the ith parameter; wi is the normalized weight of the ith parameter an is related to its relative importance to groundwater quality. Water use classes and their restrictions are shown in Table 5.

EvaluationofGroundwaterSuitabilityforDrinking,Irrigation…16
ECOPERSIAWinter2021,Volume9,Issue1
GroundwatersuitabilityforindustrialuseLow quality of water often provides requirements for the corrosion process. The process leads to different problems, such as reducing the equipment longevity, pipe clogging, and economic and health problems caused by dissolved materials in the water [23, 24]. Different studies introduced useful indices for industrial water quality evaluation. Among them, the Ryznar Stability Index (RSI), Langelier
saturation index (LSI), Puckorius scaling index (PSI), and Larson-Skold index (LS) are considered as the most efficient indices for determining water suitability for industrial uses. The indices, their equations, and some definitions are presented in Table 6 [23, 24]. The water quality indices calculations were imported to ArcGIS software to produce the spatial distribution maps of the water quality indices using the IDW method.
Table5) Definition and classification of IWQI [20]
IWQI ExploitationrestrictionsRecommendation
Soil Plant
[85,100] No restriction (NR) Water can be used for almost all types of
soil. Soil is exposed to lower risks of salinity/ sodicity problems
No toxicity risk for most plants.
[70,85] Low restriction (LR)
Irrigated soils with a light texture or moderate permeability can be adopted to this range. To avoid soil sodicity in
heavy texture, soil leaching is recommended.
Elevated risks for salt-sensitive plants.
[55,70] Moderate restriction (MR)
The water in this range would be better used for soils with moderate to high
permeability values. Moderate leaching of salts is highly recommended to avoid
soil degradation.
Plants with moderate tolerance to salts maybe grow
[40,55] High restriction (HR)
This range of water can be used in soils with high permeability without compact
layers-high-frequency irrigation schedule.
Suitable for irrigation of plants with moderate to high tolerance to salt
with special salinity control particles, except water with low Na, Cl, and
HCO3 values
[0,40] Sever restriction (SR) Using this range of water for irrigation
under normal conditions should be avoided.
Only plants with high salt tolerance, except for waters with extremely low
values of Na, Cl, and HCO3
Table6) Corrosion and saturation indexes, criteria, and equations for industrial water quality classification
Index Equation Indexvalue Watercondition
Langeliersaturationindex
LSI=pH-pHs pHs=A+B-log (Ca2+) -Log (Alk)pH<=9.3
pHs=(9.3+A+B)-(C+D) (3) pH>9. 3
LSI>1 Supersaturated, tend to precipitate CaCO3
LSI=0 saturated, CaCO3 is an equilibrium
LSI<0 Undersaturated, tend to dissolve solid CaCO3
Rynzarstabilityindex(RSI) RSI=2pHs-pH
RSI<6 Supersaturated, tend to precipitate CaCO3
6<RSI<7 Saturated, CaCO3 is an equilibrium
RSI>7 Undersaturated, tend to dissolve solid CaCO3
Puckoriusscalingindex(PSI)PSI=2 (pHeq)-pHs
pH=1.465+log(T.ALK)+4.54 pHeq=1.465×log(T.ALK)+4.54
PSI<6 Scaling is unlikely to interfere with the formation of protecting film PSI>7
Larson‐skoldindex(LS) Ls=(Cl- +SO4-2)/(HCO3+CO3-2)
LS<0.8 Chloride and sulfate are unlikely to interfere with the formation of the protecting film
0.8<LS<1.2 Corrosion rates may be higher than expected
LS>1.2 Hight rates of localized corrosion may be excepted

17HekmatniaH.etal.
ECOPERSIAWinter2021,Volume9,Issue1
FindingsandDiscussionPhysicochemicalcharacteristicsThe statistical explanation (maximum, minimum, average, and standard deviation) of various physiochemical parameters of 64 groundwater samples were presented in Table 6. Also, the tolerable limits of each parameter for drinking water based on the WHO standard are shown in Table 7. Using this explanation, evaluation of the main physicochemical aspects of the study aquifer was done.
GroundwaterqualityfordrinkingpurposesThe concentration of hydrogen ion (pH) as an important factor shows water conditions in acidic or alkaline strength. The pH of groundwater in the study area is in the range of 7.1 to 8.11, with an average value of 7.77. Compared with the limits of the pH values for drinking water (6.5-8.5), results revealed that pH in the study aquifer is in the standard range for drinking purposes. Electrical conductivity (EC) shows the ionic concentration presented in the water samples. Besides, there is a straight correlation between EC, total dissolved solids, and salinity. EC concentration varies from 358 to 18670 µS/cm, with a mean of 3363 µS/cm in the study area. A higher value of EC is a result of the geological condition and anthropogenic activities. Total dissolved solids (TDS) in the study region are in the range of 230-12020mg/l with an average of 2409mg/l. compare this range with the WHO standard in the TDS term (Table 7) shows that some water samples consider in the unpalatable condition for drinking purposes.
Table 7) statistical summary of chemical parameters of groundwater samples in Yazd-Ardakan aquifer.
ParametersUnites Min Max MeanWHO(2008)
pH - 7.1 8.11 7.75 6.5-8.5 EC µS/cm 358 18670 3363 / TDS mg/l 230 12020 2409 500-1500 TH mg/l 163 3870.4 696.46 100-500 Ca+2 mg/l 104 2016 351.16 75-200 Mg+2 mg/l 59 1855 345 50-150 Na+ mg/l 10.2 620 105.9 200 K+ mg/l 1.02 5.18 3.2 12 Cl mg/l 80 560 207 200-600 SO4‐ mg/l 4.6 1164.66 159.532 200-400 HCO3‐ mg/l 80 560 207.5 -
Water hardness is derived from a variety of dissolved ions, mainly magnesium and calcium [40]. In the study aquifer, TH values varied from 163 to 3870.4mg/l, with an average of 696.46mg/l (Table 7). Considering the standard limits of WHO for TH, the Yazd-Ardakan aquifer is categorized as very hard in terms of water hardness criteria. Major cations and anions are arranged in the order of Ca>Mg>Na>K and SO4> HCO3>Cl, respectively. The maximum allowable limit of calcium for drinking water is 200mg/l based on WHO standard, while the calcium concentration in the study area is in the range of 104 to 2016mg/l with a mean of 351.16mg/l. The magnesium concentration was found in the range of 59 to 1855mg/l, with an average of 345mg/l compared to the maximum standard limit of 150mg/l for drinking water. Sodium concentration is also exceeding the allowable range for drinking water. At the same time, potassium concentration is located within the acceptable range of drinking standard. Sulfate concentration is ranging from 4.76 to 1164.66mg/l within a mean of 159.539mg/l. The permissible upper limit of the WHO standard for sulfate in drinking water is 600mg/l. The results of the groundwater analysis revealed that in some areas of aquifer, sulfate concentration exceeds standard limits. Chloride is known as an indication of water pollution. Also, chloride is derived from industrial and domestic waste [17]. In the present study, chloride concentration of groundwater samples varies from 12.8 to 670mg/l with an average of 12.8mg/l compared with a desirable range of chloride, i.e., 200 to 600mg/l in WHO standard. Bicarbonate concentration is located in the range of 80 to 560mg/l with a mean of 207.5mg/l. Analysis of physicochemical parameters showed that 26%, 14%, and 5% of total aquifer area are classified as poor, very poor, and undesirable for drinking purposes, respectively as shown in the Figure 2. Results of using FWQI for quality evaluation of the study aquifer for drinking uses are presented in Figure 3. Results of the FWQI and WQI are similar.

EvaluationofGroundwaterSuitabilityforDrinking,Irrigation…18
ECOPERSIAWinter2021,Volume9,Issue1
Figure2) Average values of groundwater quality index for drinking consumption.
Figure3)Average values of groundwater quality index for drinking consumption based on WHO standard
GroundwaterqualityforirrigationpurposesIrrigation water quality index (IWQI) was employed to evaluate groundwater quality for irrigation purposes in the study region. Results showed that IWQI is ranged between 31.1 and 90.53. The results of aquifer classification based on IWQI are presented in Figure 4. Based on the interpolated results of the IWQI method, 2.8% of the aquifer is categorized as a non-restriction class, 15.6% as low restriction class, 63% as moderate restriction class, 14.5% as high restriction class, and 4.1% as sever restriction class for irrigation purposes.
Figure4) Average values of groundwater quality index for agricultural consumption based on FAO standards.
GroundwaterqualityforindustrialpurposesTo estimate industrial water quality, Langelier, Rayner, Puckorius, and Larson-Skold indices were evaluated for groundwater samples. The results of these calculations are depicted in Figure 5. The results indicated that the study aquifer is less corrosive based on the PSI index. Also, according to the Langelier index, the aquifer is categorized as insignificant and heavy corrosion classes. RSI and LSI evaluations indicated that the groundwater in the study region was very corrosive.

19HekmatniaH.etal.
ECOPERSIAWinter2021,Volume9,Issue1
Figure5) Average values of groundwater quality index for industrial consumption. (Spatial distribution of a: Puckorius, b: Ryznar, c: Langelier, and d: Larson-Skold indices). ConclusionThis paper has evaluated groundwater quality for industrial, agricultural, and drinking use in the Yazd-Ardakan aquifer using water quality indices. The results advocated that some areas in
the study region, especially northern and eastern, are classified as poor, very poor, and undesirable for drinking use. In the central and western margins of the aquifer, groundwater quality is evaluated as excellent and good.
a b
c d

EvaluationofGroundwaterSuitabilityforDrinking,Irrigation…20
ECOPERSIAWinter2021,Volume9,Issue1
Comparing the location of the main drinking wells of the Yazd-Ardakan plain, it could be concluded that drinking water of the area is extracted from suitable zones (western margins of the aquifer). Based on the results of the groundwater classification for irrigation purposes, almost 20% of the aquifer is categorized as high and severe restrictions for irrigation. Results of the aquifer quality evaluation using industrial indices advocated that the aquifer is located in the corrosive class. Besides, the future development of the study area is based on industrial growth. Considering the results of the present study revealed that aquifer is classified as high corrosive for industrial use, the water quality and aquifer potential for water supplying should be considered in defining the future perspective of the region. Also, since the aquifer quality is affected by industrial and domestic wastewater, so it is essential to pay more attention to manage wastewaters.
Acknowledgements: The authors would like to acknowledge Yazd Regional Water Authority and Payame Noor University for their corporation and technical support.Ethical Permissions: The authors declared this study was not under revision in any other scholarly journals at the time of submission. Also, the authors have chosen Dr. Vahid Moosavi as the corresponding author and delegated all the responsibilities of the article to him.ConflictofInterests: There is no conflict of interests. Authors’ Contributions: Hekmatnia H. (First author), Original researcher (25%); Barzegari Banadkooki F. (Second author), Introduction author/Methodologist/Discussion author (25%); Moosavi V. (Third author), Assistant researcher/Statistical analyst (25%); Zare Chahouki A. (Fourth author), Assistant researcher/Statistical analyst (25%) Funding/Sources: The authors received no specific funding.
References1- Adimalla N, Vasa SK, Li P. Evaluation of groundwater quality, Peddavagu in Central Telangana (PCT), south India: An insight of controlling factors of fluoride enrichment. Model Earth Syst Environ. 2018;4(2):841-52. 2- Mekonnen MM, Hoekstra AY. Four billion people are facing severe water scarcity. Sci Adv. 2016;2(2):1500323. 3- OECD. OECD environmental outlook to 2050: The consequence of infaction [Internet]. Paris: OECD Publishing; 2012 [Cited 2020 Jan 29]. Available from: https://b2n.ir/737181. 4- Tang Q, Lettenmaier DP. 21st century runoff sensitivities of major global river basins. Geophys Res Lett. 2012;39(6).
5- Dodds WK, Perkin JS, Gerken JE. Human impact on freshwater ecosystem services: A global perspective. Environ Sci Technol. 2013;47(16):9061-8. 6- eemj.icpm.tuiasi.ro [Internet]. Iasi: Technical University of Iasi; 2014 [Cited 2020 Jan 29]. Available from: http://omicron.ch.tuiasi.ro. 7- Li P, He X, Li Y, Xiang G. Occurrence and health implication of fluoride in groundwater of loess aquifer in the Chinese loess plateau: A case study of Tongchuan, northwest China. Expo Health. 2018;11:95-107. 8- Taylor RG, Scanlon B, Doll P, Rodell M, Van Beek R, Wada Y, et al. Ground water and climate change. Nat Clim Change. 2013;3:322-9. 9- Gain AK, Giupponi C, Wada Y. Measuring global water security towards sustainable development goals. Environ Res Lett. 2016;11(12):124015. 10- Gleeson T, Wada Y, Bierkens MFP, Van Beek LPH. Water balance of global aquifers revealed by groundwater footprint. Nature. 2012;488(7410):197-200. 11- Lopez-Morales CA, Mesa-Jurado MA. Valuation of hidden water ecosystem services: The replacement cost of the aquifer system in central Mexico. Water. 2017;9(8):571. 12- Adimalla N, Venkatayogi S. Mechanism of fluoride enrichment in groundwater of hard rock aquifers in Medak, Telangana state, south India. Environ Earth Sci. 2017;76(1):45. 13- Subba Rao N, Marghade D, Dinakar A, Chandana I, Sunitha B, Ravindra B, et al. Geochemical characteristics and controlling factors of chemical composition of groundwater in a part of guntur district, Andhra Pradesh, India. Environ Earth Sci. 2017;76:747. 14- Abboud IA. Geochemistry and quality of groundwater of the Yarmouk basin aquifer, north Jordan. Environ Geochem Health. 2017;40(4):1405-35. 15- Ghahremanzadeh H, Noori R, Baghvand A, Nasrabadi T. Evaluating the main sources of groundwater pollution in the southern Tehran aquifer using principal component factor analysis. Environ Geochem Health. 2017;40(4):1317-28. 16- Abd El-Aziz SH. Evaluation of groundwater quality for drinking and irrigation purposes in the north-western area of Libya (Aligeelat). Environ Earth Sci. 2017;76:147. 17- Adimalla N, Qian H. Groundwater quality evaluation using water quality index (WQI) for drinking purposes and human health risk (HHR) assessment in an agricultural region of Nanganur, south India. Exotoxicol Environ Saf. 2019;176:153-61. 18- Adimalla N, Li P, Qian H. Evaluation of groundwater contamination for fluoride and nitrate in semi-arid region of Nirmal Province, South India: A special emphasis on human health risk assessment (HHRA). Human Ecol Risk Assess Int J. 2018;25(5):1107-24.19- Kim JH, Keane TD, Bernard EA. Fragmented local governance and water resource management outcomes. J Environ Manag. 2015;150:378-86. 20- Lobato TC, Hauser-Davis RA, Oliveira TF, Silveira AM, Silva HAN, Tavares MRM, et al. Construction of a novel water quality index and quality indicator for reservoir water quality evaluation: A case study in the Amazon region. J Hydrol. 2015;522:674-83. 21- Ayers RS, Westcot DW. Water quality for agriculture. Rome: FAO; 1985. 22- Meireles A, De Andrade EM, Chaves LCG, Frischkorn H, Crisostomo LA. A new proposal of the classification of irrigation water. Rev Cienc Agron. 2010;41(3):349-57.

21HekmatniaH.etal.
ECOPERSIAWinter2021,Volume9,Issue1
23- Abbasnia A, Yousefi N, Mahvi AH, Nabizadeh R, Radfard M, Yousefi M, et al. evaluation of groundwater quality using water quality index and its suitability for assessing water for drinking and irrigation purposes: Case study of Sistan and Baluchistan province (Iran). Hum Ecol Risk Assess Int J. 2019;25(4):988-1005. 24- Mirzabeygi M, Abbasnia A, Yunesian M, Nabizadeh Nodehi R, Yousefi N, Hadi M, et al. Heavy metal contamination and health risk assessment in drinking water of Sistan and Baluchistan, southeastern Iran. Hum Ecol Risk Assess Int J. 2017;23(8):1893-905. 25- Magesh NS, Chandrasekar N. Evaluation of spatial variations in groundwater quality by WQI and GIS technique: A case study of Virudunagar district, Tamil Nadu, India. Arab J Geosci. 2013;6:1883-98. 26- Sanchez E, Colmenarejo MF, Vicente J, Rubio A, Garcia MG, Travieso L, et al. use of the water quality index and dissolved oxygen deficit as simple indicators of watersheds pollution. Ecol Indic. 2007;7(2):315-28. 27- Bhargava DS. Use of water quality index for river classification and zoning of Ganga river. Environ Pollut Ser B Chem Phys. 1983;6(1):51-67. 28- Dehghanifard E, Baneshi MM, Gholikandi GB, Dehnavi A. Application of water quality index for quality zoning. Arch Hyg Sci. 2012;1(1). [Persian] 29- Vinod J, Dixit S, Gupta S. Assessment of water quality index of industrial area surface water samples. Int J Chem Tech Res. 2013;5(1):278-83. 30- Besser H, Mokadem N, Redhouania B, Rhimi N, Khlifi F, Ayadi Y, et al. GIS-based evaluation of groundwater quality and estimation of soil salinization and land degradation risks in an arid Mediterranean site (SW Tunisia). Arab J Geosci. 2017;10:350.
31- Langelier WF. The analytical control of anti-corrosion water treatment. J Am Water Work Assoc. 1936;28(10):1500-21. 32- Ryznar JW. A new index for determining amount of calcium carbonate scale formed by a water. J Am Water Work Assoc. 1944;36(4):472-83. 33- Fazlzadehdavil M, Mahvi AH, Norouzi M, Mazloomi S, Amarluie A, Tardast A, et al. Survey of corrosion and scaling potential produced water from Ilam water treatment plant. World Appl Sci J. 2009;7(11):11-24. [Persian] 34- Larson TE, Skold RV. Laboratory studies relating mineral quality of water to corrosion of steel and cast iron. J Sci Eng. 1958;14(6):43-6. 35- Shams MH, Mohamadi A, Sajadi SA. Evaluation of corrosion and scaling potential of water in rural water supply distribution networks of Tabas, Iran. World Appl Sci J. 2012;17(11):1484-9. 36- Barzegari Banadkooki F, Malekinezhad H, Hosseini MM. Conjunctive water resources management with emphasis on environmental sustainability in yazd-ardakan basin. 2016;12(2):104-19. [Persian] 37- Brown RM, McClelland NI, Deininger RA, Tozer RG. A water quality index- do we dare. 1970;117(10):339-43. 38- Backman B, Bodis D, Lahermo P, Rapant S, Tarvainen T. Application of a groundwater contamination index in Finland and Slovakia. Environ Geol. 1998;36:55-64. 39- World health organization. Drinking-water quality guidelines [Internet]. Geneva: World Health Organization; 2004 [Cited Y M D]. Available from: https://www.who.int/water_sanitation_health/water-quality/guidelines/en/ 40- World health organization. Guidelines for drinking-water quality. Geneva: World Health Organization; 2011.