issn print: issn online: a qualitative approach of vlf (em
TRANSCRIPT

~ 50 ~
ISSN Print: 2394-7500 ISSN Online: 2394-5869 Impact Factor: 5.2 IJAR 2016; 2(4): 50-59 www.allresearchjournal.com Received: 06-02-2016 Accepted: 08-03-2016 Dubba Vijay Kumar Department of Geophysics, Osmania University, Hyderabad, Telangana, India G. Ramadass Department of Geophysics, Osmania University, Hyderabad, Telangana, India. Correspondence Dubba Vijay Kumar Department of Geophysics, Osmania University, Hyderabad, Telangana, India.
A qualitative approach of VLF (EM) data for
groundwater exploration in a hard rock terrain, Osmania University Campus, Hyderabad, Telangana state, India
Dubba Vijay Kumar, G. Ramadass Abstract Very Low Frequency (EM) investigations were carried out in the Osmania University Campus, Hyderabad to delineate structural configuration and trace subsurface fracture zones at depth could represent groundwater potential zones. A qualitative interpretation of VLF-EM data along the AA1 to SS1 traverses is based on the crossover point, amplitudes of filtered real and imaginary components are appears as positive peaks in the Fraser filter real curve. This region constitutes anomalous zone which can be attributed the presence of vertical conductive or lateral contacts of different conductivity beneath the surface. Qualitative maps tilt derivative and analytical signal trends lows and highs are mapped which are reflecting similar trends of fractures, which are indicating structural configuration, conductive subsurface conductors at depth representing the groundwater potential zones. Keywords: Very Low Frequency Electromagnetic Method (VLF-EM); Fracture zones; Fraser filter; Conductivity; Groundwater. 1. Introduction The Osmania University Campus (78031′00″ E Longitude to 78032′30″ E Longitude and 170
23′48″ N Latitude to 170 25′42″ N Latitude) is situated in an area of approximately 6.58 sq. km (1627.32 acres) lies in Hyderabad metropolitan city (SOI). The maximum elevation observed is 535m and minimum elevation is 503 m with respect to mean sea level. Here three types of granites exist–pink, grey and the leucogranites (Balakrishana and Rao, 1961; Sitaramayya, 1968, 1971) [1, 2, 3] and some pegmatite patches traversed by narrow white apatite veins, which intersect each other randomly. The granitic host rocks are intruded at places with doleritic dykes. The general geological section consists of soil layer underlain by weathered rock, which is in turn followed by the fractured rock at a few places. The basement, occurring at an average depth of 15 m consists of hard impervious granite. Groundwater occurrence in the hard rock terrain can be vary irregular due to abrupt discontinuity in lithology, thickness and electrical properties of the overburden and weathered bed rock (Udaya Laxmi and Ramadass 2013) [4]. Many researchers (Kelly and Mares, 1993[5], Koefed 1979) [6], Parasnis (1973) [7], Zohdy (1964, 1965 and 1975) [8, 9, 10] have employed electrical methods of prospecting comprise a wide variety of techniques which utilize different electrical properties and their related phenomena to distinguish between different geological formations or to delineate structures. Subsurface characteristics are deduced from measured electrical properties of the earth such as resistivity. Though several geophysical methods are applicable for weathered zone studies under various geological conditions. Very Low Frequency Electromagnetic Method (VLF-EM) is passive methods from ground based military radio transmitters as the primary EM field for Geophysical survey. VLF ground surveys a quick and powerful tool for the study of geologic features within about 100m of the surface. In the present paper emphasis the results of VLF-EM surveys. VLF (EM) are carried out in the hard rock terrain in Osmania University Campus, Hyderabad, to delineate the structural configuration and trace subsurface conductive zones at depth, could represent groundwater potential zones.
International Journal of Applied Research 2016; 2(4): 50-59
~ 51 ~
International Journal of Applied Research
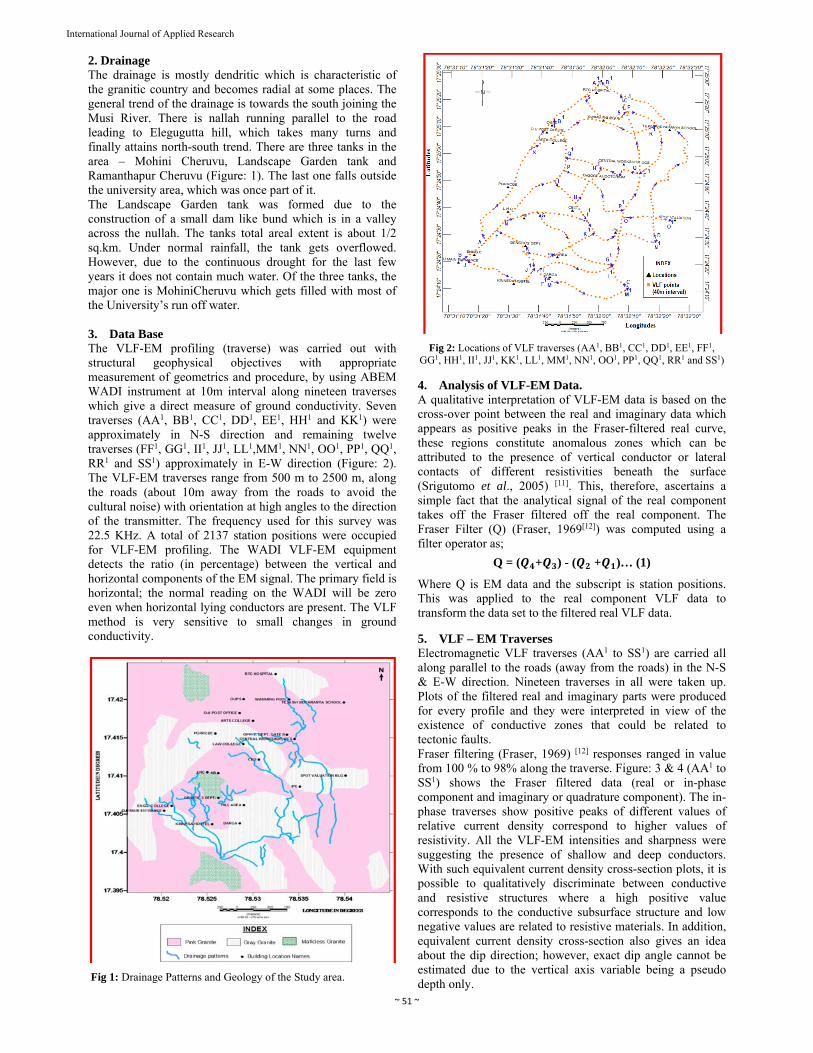
2. Drainage The drainage is mostly dendritic which is characteristic of the granitic country and becomes radial at some places. The general trend of the drainage is towards the south joining the Musi River. There is nallah running parallel to the road leading to Elegugutta hill, which takes many turns and finally attains north-south trend. There are three tanks in the area – Mohini Cheruvu, Landscape Garden tank and Ramanthapur Cheruvu (Figure: 1). The last one falls outside the university area, which was once part of it. The Landscape Garden tank was formed due to the construction of a small dam like bund which is in a valley across the nullah. The tanks total areal extent is about 1/2 sq.km. Under normal rainfall, the tank gets overflowed. However, due to the continuous drought for the last few years it does not contain much water. Of the three tanks, the major one is MohiniCheruvu which gets filled with most of the University’s run off water. 3. Data Base The VLF-EM profiling (traverse) was carried out with structural geophysical objectives with appropriate measurement of geometrics and procedure, by using ABEM WADI instrument at 10m interval along nineteen traverses which give a direct measure of ground conductivity. Seven traverses (AA1, BB1, CC1, DD1, EE1, HH1 and KK1) were approximately in N-S direction and remaining twelve traverses (FF1, GG1, II1, JJ1, LL1,MM1, NN1, OO1, PP1, QQ1, RR1 and SS1) approximately in E-W direction (Figure: 2). The VLF-EM traverses range from 500 m to 2500 m, along the roads (about 10m away from the roads to avoid the cultural noise) with orientation at high angles to the direction of the transmitter. The frequency used for this survey was 22.5 KHz. A total of 2137 station positions were occupied for VLF-EM profiling. The WADI VLF-EM equipment detects the ratio (in percentage) between the vertical and horizontal components of the EM signal. The primary field is horizontal; the normal reading on the WADI will be zero even when horizontal lying conductors are present. The VLF method is very sensitive to small changes in ground conductivity.
Fig 1: Drainage Patterns and Geology of the Study area.
Fig 2: Locations of VLF traverses (AA1, BB1, CC1, DD1, EE1, FF1, GG1, HH1, II1, JJ1, KK1, LL1, MM1, NN1, OO1, PP1, QQ1, RR1 and SS1)
4. Analysis of VLF-EM Data. A qualitative interpretation of VLF-EM data is based on the cross-over point between the real and imaginary data which appears as positive peaks in the Fraser-filtered real curve, these regions constitute anomalous zones which can be attributed to the presence of vertical conductor or lateral contacts of different resistivities beneath the surface (Srigutomo et al., 2005) [11]. This, therefore, ascertains a simple fact that the analytical signal of the real component takes off the Fraser filtered off the real component. The Fraser Filter (Q) (Fraser, 1969[12]) was computed using a filter operator as;
Q = ( + ) - ( + )… (1)
Where Q is EM data and the subscript is station positions. This was applied to the real component VLF data to transform the data set to the filtered real VLF data. 5. VLF – EM Traverses Electromagnetic VLF traverses (AA1 to SS1) are carried all along parallel to the roads (away from the roads) in the N-S & E-W direction. Nineteen traverses in all were taken up. Plots of the filtered real and imaginary parts were produced for every profile and they were interpreted in view of the existence of conductive zones that could be related to tectonic faults. Fraser filtering (Fraser, 1969) [12] responses ranged in value from 100 % to 98% along the traverse. Figure: 3 & 4 (AA1 to SS1) shows the Fraser filtered data (real or in-phase component and imaginary or quadrature component). The in-phase traverses show positive peaks of different values of relative current density correspond to higher values of resistivity. All the VLF-EM intensities and sharpness were suggesting the presence of shallow and deep conductors. With such equivalent current density cross-section plots, it is possible to qualitatively discriminate between conductive and resistive structures where a high positive value corresponds to the conductive subsurface structure and low negative values are related to resistive materials. In addition, equivalent current density cross-section also gives an idea about the dip direction; however, exact dip angle cannot be estimated due to the vertical axis variable being a pseudo depth only.

~ 52 ~
International Journal of Applied Research
-200
-100
0
100
200
300
0 100 200 300 400 500 600 700 800 900 1000
Real Component Imag ComponentDistance (m)
Indore Stadium
A Junction Road before Central Workshop, UCS
VL
F-E
M C
om
po
nen
ts %(e)
N
FrFr
*Fr - Fracture
Fr Traverse EE1
‐300
‐200
‐100
0
100
200
300
400
500
0 100 200 300 400 500 600
Real Component Imag Component
Distance (m)
Adjacent to Geography Dept.
Near Culvert Close Culvert Opp: Zoology Dept. Gate-II
VL
F-E
M C
ompo
nent
s %(f)
NFr
*Fr - Fracture
Traverse HH1

~ 53 ~
International Journal of Applied Research
Fig 3: Fraser filter graph of Traverses (N-S direction) of a) AA1, b) BB1, c) CC1,d) DD1, e) EE1, f) HH1 and g) KK1
-300
-200
-100
0
100
200
300
0 100 200 300 400 500 600 700 800
Real Component Imag Component
Distance (m)
VL
F-E
M C
ompo
nent
s %(g)
Hill areaBoundary wall of
Sports Hostel
Front Boundary wall of Sports
Hostel
NFr
Fr
Fr
*Fr - Fracture
Traverse KK1
Distance (m)
‐500
‐400
‐300
‐200
‐100
0
100
200
300
400
500
0 100 200 300 400 500 600 700 800
Real Component Imag Component
H-tech Hostel
Genetics DepartmentDarga
VL
F-E
M C
om
po
nen
ts %(h) NFr
FrFr
*Fr - Fracture
Traverse FF1
-150
-100
-50
0
50
100
150
0 200 400 600 800 1000 1200
Real Component Imag Component
Distance (m)
VL
F-E
M C
om
po
nen
ts %(i)
Cafeteria V.C Lodge
NFr
Fr Fr
*Fr - Fracture
Traverse GG1
-200
-100
0
100
200
300
0 100 200 300 400 500 600
Real Component Imag ComponentDistance (m)V
LF
-EM
Com
pone
nts
%(j)
Opp: to Law College.
At Garden EntranceOpp: Geography Dept.
At a road towards to Press
NFr
Fr Fr Fr Fr
*Fr - Fracture
Traverse II1
-300
-200
-100
0
100
200
300
0 100 200 300 400 500 600 700 800
Real Component Imag ComponentDistance (m)
Mechanical Engg. Dept. Kinnera Hostel
VL
F-E
M C
om
po
nen
ts %(k) NFr
FrFr
Fr
*Fr - Fracture
Traverse JJ1

~ 54 ~
International Journal of Applied Research
Fig 4: Fraser filter graph of Traverses (E-W direction) of h) FF1, i) GG1, j) II1, k) JJ1,l) LL1, m) MM1, n) NN1, o) OO1, p) PP1, q) QQ1, r) RR1 and s) SS1
-250
-200
-150
-100
-50
0
50
100
150
0 100 200 300 400 500 600 700 800 900
Real Component Imag Component
Distance (m)
Near Darga
VL
F-E
M C
om
po
nen
ts %(l) A road towards to IPE NFr Fr
*Fr - Fracture
Traverse LL1
-300
-200
-100
0
100
200
0 100 200 300 400 500 600
Real Component Imag componentDistance (m)
VL
F-E
M C
om
po
nen
ts %(m) N
Fr
*Fr - Fracture
Traverse MM1
-200
-100
0
100
200
0 200 400 600 800 1000 1200 1400 1600 1800
Real component Imag ComponentDistance (m)
VL
F-E
M C
om
po
nen
ts %(n) N
Administrative Building O.U Press
Centre for Indian Ocean Studies
OUCIP
At O.U Boundary wall near IPE
residencesFr
Fr Fr
*Fr - Fracture
Traverse NN1
-300
-200
-100
0
100
200
300
0 50 100 150 200 250 300 350 400 450 500
Real Component Iamg componentDistance (m)
Darga Culvert Spot valuation building entrance N
VL
F-E
M C
om
po
nen
ts %(o)
Fr Fr
*Fr - Fracture
Traverse OO1
-200
-150
-100
-50
0
50
100
150
0 100 200 300 400 500 600 700 800 900
Real Component Imag ComponentDistance (m)
To maneru hostel road
Besides of Tagore Auditorium
VL
F-E
M C
om
po
nen
ts %
(p)
N
Fr
*Fr - Fracture
Traverse PP1

~ 55 ~
International Journal of Applied Research
Fig 4:Continued
Table 1: VLF method Fractures details
S.No. Traverse/Total Length (m)
Identified Fracture Locations co-ordinates Fractures along
the Traverse (m) Longitude in Degrees
Latitude in Degrees
1 AA1(N-S)-From UFRO to Tarnaka
Junction/2000
78.52461 17.41222 500 2 78.52527 17.41335 640 3 78.52918 17.42070 1450 4 BB1(N-S)-From O.U main entrance to
O.U Police Station/2200 78.52347 17.40852 490
5 78.53003 17.41808 1850 6 CC1(N-S)-From Behind the Genetics
Dept, to Aradana Theatre/2400 78.53679 17.41352 1470
7 78.53616 17.41945 2070 8
DD1(N-S)-From IPE residences to Tarnaka Junction/2430
78.54131 17.41785 1350 9 78.53754 17.42218 1950 10 78.53526 17.42283 2200 11
EE1(N-S)-From Indoor Stadium Entrance to near central workshop/920
78.53627 17.42101 70 12 78.53820 17.42008 300 13 78.53857 17.41953 370 14
FF1(E-W)-From Ganga Hostel to Darga/920
78.52614 17.40748 270 15 78.52635 17.40657 390 16 78.52727 17.40567 500 17
GG1(E-W)-From Cafeteria to IPE/960 78.52947 17.40896 300
18 78.53042 17.40795 440 19 78.53242 17.40573 720
20 HH1(N-S)-From Geography Dept. to
Botanical Garden II Gate/490 78.53222 17.41386 260
21 II1(E-W)-From Opposite to Law College to a road towards to O.U
Press/560
78.53004 17.41288 170 22 78.53066 17.41210 230 23 78.53156 17.41080 410
-150
-100
-50
0
50
100
150
0 100 200 300 400 500 600 700 800 900
Real Component Imag ComponentDistance (m)
Junction road after central workshop, UCS
Central workshop, UCS Botanical
garden gate - IIPhysics Dept.
gate - II
VL
F-E
M C
ompo
nent
s %(q)
NFr Fr
Fr
*Fr - Fracture
Traverse QQ1
-300
-200
-100
0
100
200
300
400
0 200 400 600 800 1000 1200 1400 1600
Real Component Imaginary ComponentDistance (m)
Opp: Directorate Admissions O.U
Post Office‘B’
Hostel
Swimming Pool At Professors Quarters
N
VL
F-E
M C
ompo
nent
s %(r) Fr
Fr
FrFr
Fr Fr
*Fr - Fracture
Traverse RR1
-300
-200
-100
0
100
200
0 100 200 300 400 500 600 700
Real Component Imag ComponentDistance (m)
Manjeera Hostel
Basketball Court
Close to Culvert
Close to Culvert
N
VL
F-E
M C
ompo
nent
s %
(s)Fr
Fr
*Fr - Fracture
Traverse SS1

~ 56 ~
International Journal of Applied Research
24 78.53177 17.41051 450 25 78.53211 17.40992 530 26
JJ1(E-W)-From Opposite to Telangana Mahila Sabha to behind the Genetics
Dept., close to Darga/760
78.52133 17.40556 60 27 78.52241 17.40496 190 28 78.52381 17.40476 350 29 78.52458 17.40424 440 30
KK1(E-W)-From Behind the Genetics Dept., close to Sports Hostel/730
78.52911 17.40625 300 31 78.53090 17.40746 500 32 78.53236 17.40833 710 33 LL1(E-W)-From Darga to (Forest)
towards to IPE road/790 78.53108 17.40515 410
34 78.53172 17.40484 490 35 MM1(E-W)-From Near Darga to a road
up to a point of N-S direction/560 78.53095 17.40302 240
36 78.52688 17.41054 250 37 NN1(E-W)-From R Y Temple to dead of
IPE residences/1560 78.53132 17.41012 700
38 78.53505 17.40831 1200 39 OO1(E-W)-From O.U Darga (IPE) to
Spot valuation Building/440 78.53607 17.41027 70
40 78.53880 17.41015 330
41 PP1(E-W)-From Opposite to O.U Library to Maneru Hostel road/850
78.53431 17.41092 700
42 QQ1(E-W)-From After Central
workshop to Arts College road/810
78.53532 17.41501 170 43 78.53508 17.41445 250 44 78.53347 17.41534 460 45
RR1(E-W)-Opposite to directorate admissions to Professors quarters/1400
78.52860 17.41832 240 46 78.52904 17.41852 300 47 78.53116 17.42015 600 48 78.53399 17.42000 950 49 78.53495 17.41959 1060 50 78.53669 17.41906 1280 51 SS1(N-S)-From Near Shivalayam to
Indoor Stadium/590 78.53293 17.42101 240
52 78.53510 17.42052 510 6. Real and Imaginary Components A popular method of presenting traverse data along single or parallel traverses is by drawing the graphs of the parameters measured against the locations. In the present study area, nineteen (19) traverses are available maps of the variation in parameters are constructed showing by means of contours the locations of anomalous points. During the record of data and under the field conditions data have been affected by noise hence applying the Fraser filter and noise has been
removed. Real and imaginary data has plotted as contours shown in the Figures 5 and 6. These Figures representing lateral and vertical variation in conductivity when the conductivity of the source of the interest is more than that the adjoining the rocks, positive real anomalies are observed. It is possible to demarcate the approximate boundary conductive and nonconductive bodies. It is interesting to know that where real and imaginary both positive indicating the conductive fracture zones.
Fig 5: Contour map of Real Component (Contour Interval 2.5)

~ 57 ~
International Journal of Applied Research
Fig 6: Contour map of Imaginary Component (Contour Interval 2.5)
7. Analytical Signal The amplitude of the analytical signal gives a symmetrical curve and in general attains its maximum exactly over the origin of regular geometrical structures (Sinha 2003, Sundararajan and Srinivas 1996. and Lazarus et al., 2013) [13,
14, 15], however, the peak of the amplitude corresponds to the origin for all structures. For VLF-EM anomaly, if f(x) is the in-phase component and H(x) its Hilbert transform, then the analytical signal can be expresses as
A(x) = f(x)-iH(x) … (2)
Whereas H(x) = {IF (w) Cos (wx) – RF (w) Sin (wx) z}dw, RF (w) and IF (w) are real and imaginary part of the Fourier transform off(x) expresses as F (w) = f(x) e dx = RF (w) – iIF(w) and the amplitude of the analytical signal is
AA(x) = f(x) 2 + H(x) 2 … (3)
When the filter is apply to the real component data aimed at simplifying the fact that conductive bodies have positive and negative peak associated with, it may take difficult to determine the exact location of the positive conductive body, instead of this N-S and E-W trends have been observed. This function and it derivatives are independent of the strike, dip conductive bodies. The VLF data Figure: 7, the range from 0.1 to 5.3, the area is marked by both high and low conductive closures which could be attributed to several factors such as 1) variation in depth to difference in conductivity 2) difference in lithology 3) degree of strike. Several trends within the study area are
N-S and E-W, are observed, and are Figure: 6 high-frequency signatures are observed at the northern and southern portion of the study area.
Fig 7: Contour map of Analytical Signal of Real Component (Contour Interval 0.1)

~ 58 ~
International Journal of Applied Research
8. Tilt Derivative The tilt derivative, first reported in 1994 and more recently used to derive the local wave number (1997), it will show that the combination of the tilt derivative and its total horizontal derivative are highly suitable for mapping shallow basement structure and mineral exploration targets and that they have distinct advantages over many conventional derivatives. The tilt derivative opting calculates the tilt derivative of a grid and optionally, the total horizontal derivative of the tilt derivative grid using the convolution method saves a lot of processing memory and time. The tilt derivative is defined as:
TDR = … (4)
Where VDR = First vertical derivative THDR = Total horizontal derivative
VDR = … (5)
THDR = … (6)
The total horizontal derivative of the tilt derivative defined as
HD-TDR = … (7)
The results of the tilt derivative shown in Figure: 8 narrow over merging for minimum and maximum values of tilt, therefore, the edges of real anomalies are better resolve and the tilt derivative, shows the structured fabric of the region, this special distribution of aquifers and VLF real data highs and lows are demarcated.
Fig 8: Contour map of Tilt Derivative of Real Component (Contour Interval 0.1)
Fig 9: Map of VLF Analytical Signal lineaments with Fracture locations

~ 59 ~
International Journal of Applied Research
9. Conclusions An attempt has been made to identify groundwater potential zones in hard rock terrain in Osmania University Campus. Very Low Frequency (VLF) electromagnetic survey has been conducted in this study for the purpose of delineating subsurface features in the study area, Osmania University Campus. A total of nineteen (19) VLF - EM profiles are acquired using ABEM WADI VLF instrument at every 10m interval. The VLF-EM result mapped shallow linear conductors that are suspected fracture zones of varying length in the area. The VLF-EM techniques as clearly demarcated the fracture system associated with crossover points at positive amplitude peaks of filtered real and imaginary components along the traverses shows 52 fracture zones were delineated in the study region, which are capable of holding significant quantity of groundwater. These zones were shown in table: 1 and presented in figure 9. A qualitative analysis of VLF-EM data of real and imaginary are subjected to gradient techniques to identify structural trends as well as groundwater potential zones in the O.U campus granitic terrain Hyderabad, mapping of the fracture points following the same trends. 10. Acknowledgment The authors gratefully acknowledge the financial support extended by the UGC, New Delhi for granting Emeritus fellow. 11. References 1. Balakrishna S. Raghava Rao M., Pink and grey granites
Hyderabad, Current Science, 1961; 30:264. 2. Sitaramayya S. Structure, Petrology and Geochemistry
of Granites of Ghatkesar, A.P., and Ph.D. Thesis (unpublished), Osmania University, Hyderabad, 1968.
3. Sitaramayya S. The Pyroxene Bearing Granodiorites and Granites of Hyderabad Area, (the Osmania Granites): Quarterly Journal of the Geological, Mining and Metallurgical Society of India. 1971; 43:117-129.
4. Udaya Laxmi, Ramadass, Environmental studies & Groundwater Quality Assessment Approach through integrated studies in parts of Hyderabad, A.P, India, International Journal of Advances in science and technology, 2013; 6(4):85-102.
5. Kelly WE, Mares S. Applied geophysics in hydrogeological and engineering practice, Elsevier, Amsterdam, 1993, 289.
6. Koefed O. Geosounding principles, I-Resistivity Sounding Measurements, Elsevier, Amsterdam, 1979, 276.
7. Parasnis DS. Methods in Geochemistry and Geophysics, 3, the mise-a-la-masse method, Mining Geophysics, 2nd
revised edition, 1973, 195-202. 8. Zohdy AAR. Earth resistivity and seismic refraction
investigations in Santaclara country, California: Ph.D dissertations, Stamford University, Publ. by University Microfilms, A Xerox company, Ann Asbar, Michigan, U.S.A, 1964.
9. Zohdy AAR. The auxiliary point method of electrical sounding interpretation and its relationship to Dar Zarrouk parameters. Geophysics, 1965; 30(4):644-660.
10. Zohdy AAR. Automatic interpretation of Schlumberger sounding curves using modified Dar Zarrouk functions. Geological Survey Bulletin 313E, Washington, 1975.
11. Srigutomo W, Harja A, Sutarno D, Kagiyama T. VLF data analysis through transformation into resistivity value: Application to synthetic and field data, Indonesia Journal of Physics. 2005; 16(4):127-136.
12. Fraser DC. Contouring of VLF-EM data: Geophysics, 1969; 34(6): 958- 967.
13. Sinha PK, Surenendra Nath M, Sikhendu De, Murlidharan PK, Ravi Shankar Misra. A GIS approach in mineral targeting with Narayanpet Kimberlite spatial dataset. Presented at the Map India Conference, 2003
14. Sundararajan N, Srinivas Y. A modified Hilbert transform and its applications to self-potential interpretations. Journal of Applied Geophysics. 1996; 36:137-143.
15. Lazarus G. Ndatuwong, GS Yadav. Analysis and Interpretation of In-Phase Component of VLF-EM Data using Hilbert Transform and the Amplitude of Analytical Signal. Journal of Environment and Earth Science. 2013, 3(11).