issue 145 western australian stock exchange index · 3 | issue 145 - western australian stock...
TRANSCRIPT

April 2015
Issue 145Western Australian Stock Exchange IndexA review of Western Australian listed companies on the Australian Securities Exchange
Content
ContentsExecutive summary 1
Deloitte WA Index performance against the ASX All Ordinaries and Overseas Indices 2
Performance of global financial markets 4
Commodity and precious metal prices 5
Western Australian movers and shakers over the past month 7
WA’s top 100 listed companies 9
Compilation of the Deloitte WA Index 11
Recent awards and achievements 12
About Deloitte 13
Contact us 14
April 2015, No. 145Western Australian Securities Exchange Index Published monthly by Deloitte
Brought to you by:
Tim RichardsClients & Markets Partner - Western Australia
Tel: +61 8 9365 7248 [email protected]
Contents
1 | Issue 145 - Western Australian Stock Exchange Index
The Movers & Shakers for the month of April were: • Aziana Limited, whose market capitalisation increased
by AU$54m (277.9%) to AU$74m
• Coal of Africa Limited, whose market capitalisation increased by AU$34m (75%) to finish the month at AU$78m
• Buru Energy Limited, whose market capitalisation increased by AU$75m (68.7%) to close at AU$184m.
The market capitalisation of WA listed companies which comprise the Deloitte WA Index increased by 1.7% during April to close at AU$131bn. The Index’s performance was boosted by stronger commodity prices, providing welcome relief and a small sign of recovery in the Western Australian market. The majority of commodities surveyed increased during the month, in particular crude oil, reaching its highest price so far for 2015 to close at US$64.06 per barrel. The increase came as oil drilling activities in the U.S. continued to decrease, coupled with increasing tension in the Middle East, which has increased speculation of possible supply disruption.
Iron ore rose by 9.4% to close at US$58 per tonne. During April, BHP Billiton Limited slowed the expansion of its export terminal in Port Hedland to 290 million tonnes a year, which is expected to ease oversupply, reducing downward pressure on prices, Fortescue Metals Group experienced its strongest trading day in three years and BC Iron Limited’s share price doubled in a week.
The majority of equity markets surveyed this month posted positive results, with the All Ordinaries being the only exception, suffering a 1.5% decline. The FTSE 100 was the best performer, increasing 2.8%, while the Deloitte WA Index and the Nikkei increased by 1.7% and 1.6% respectively, followed by the US S&P 500 with an increase of 0.9%.
The loss experienced by the All Ordinaries was despite the rebound in commodity prices, as concerns mounted over the direction of the RBA’s official cash rate, the appreciation of the Australian dollar and suggestions that Australia’s AAA credit rating was at risk unless the Federal Government can display a credible plan for returning the Budget to surplus.
Strengthening commodity prices contributed to a gain of 2.8% for the FTSE 100. Mining stocks rallied following the news that China had implemented stimulus measures by reducing cash reserves held by banks to revitalise recent slower growth. The Nikkei continued its steady growth, increasing by 1.7% due to the continued improvements in company earnings. The U.S. S&P 500 also experienced moderate growth, posting a gain of 0.9% on the back of better than expected first quarter company results and recovering oil prices.
Executive summary
Welcome to the 145th edition of the Deloitte WA Stock Exchange Index (Deloitte WA Index), a monthly review of Western Australian (WA) stocks and indices.
Tim RichardsPartner Clients & Markets Western Australia
2 | Issue 145 - Western Australian Stock Exchange Index
Deloitte WA Index performance against the ASX All Ordinaries and Overseas Indices
The Deloitte WA Index rose 1.7% during April as major iron ore miners in Western Australia benefited from recovering iron ore prices. The iron ore price rose to just below US$60 per tonne on the back of the announcement by China’s central bank that they will soon launch a credit easing program which is hoped to stimulate further growth, combined with inventory replenishments by Chinese steel mills. The Department of Industry and Science in Australia remained upbeat and forecast that iron ore prices will remain around US$60 per tonne for the remainder of 2015. The biggest winner for the month was Fortescue Metals Group which saw gains of nearly 11.0% in a single day’s trade as investor demand for their corporate bonds yielding 9.8% per annum exceeded initial expectations. This favourable response from investors saw its market capitalisation rise by AU$0.7bn (10.7%).
The ASX All Ordinaries fell by 1.5% during the month largely as a result of uncertainties surrounding the direction of the Reserve Bank of Australia’s official cash rate. Similarly the nation’s worsening economic climate and the current political standoff over the federal budget has raised speculations of an increased risk of Australia’s credit rating being downgraded.
Australia has been able to maintain its current AAA credit rating since 1986. Investors were quick to sell off finance stocks amid the fiscal uncertainty, with all major banks finishing in the red this month.
ANZ, Commonwealth Bank, National Australia Bank and Westpac Banking Corporation all suffered the largest decreases in market capitalisation, driving aggregate losses of approximately AU$27.3bn from the All Ordinaries.
The US S&P 500 increased by a meagre 0.9% as consumer confidence rose to its second highest level since 2007. Earnings reports were the focus for investors with the S&P 500 being lifted by strong corporate quarterly earnings, including stronger than expected results from the tech giant Microsoft. Microsoft saw its market capitalisation increasing by 18.3% in April after announcing higher than expected earnings per share of 61 cents on revenue totalling US$21.7bn in its fiscal third quarter.
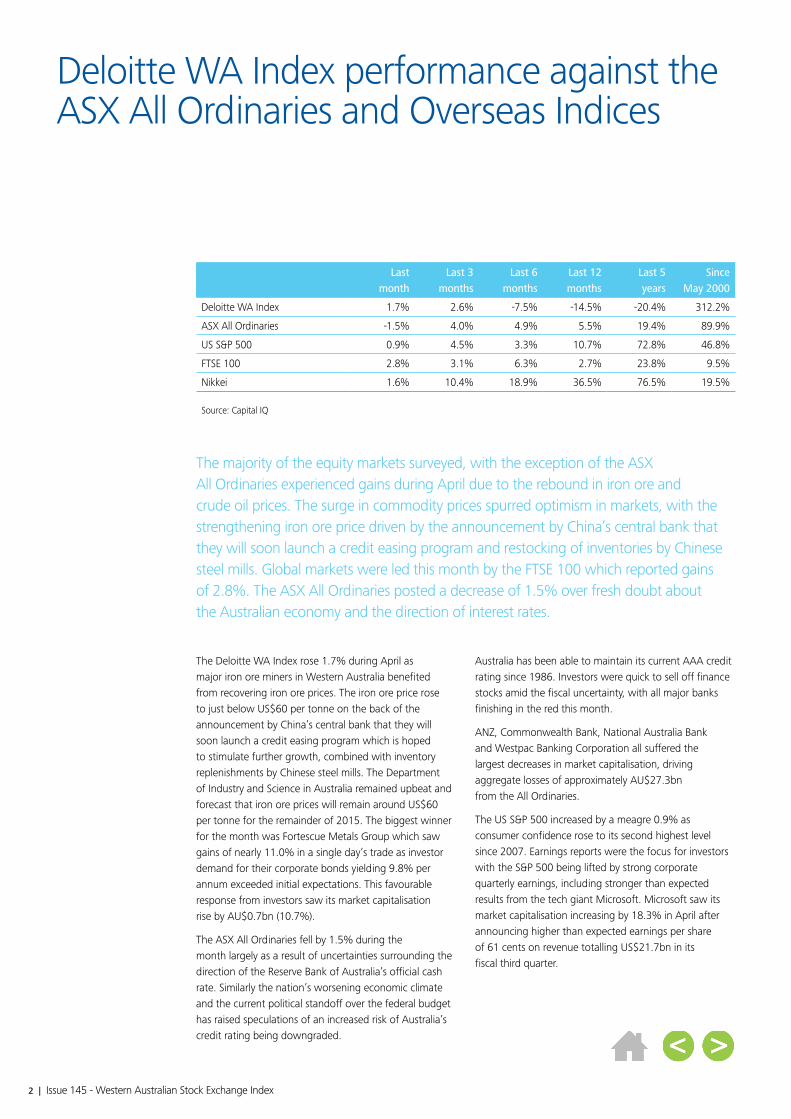
The majority of the equity markets surveyed, with the exception of the ASX All Ordinaries experienced gains during April due to the rebound in iron ore and crude oil prices. The surge in commodity prices spurred optimism in markets, with the strengthening iron ore price driven by the announcement by China’s central bank that they will soon launch a credit easing program and restocking of inventories by Chinese steel mills. Global markets were led this month by the FTSE 100 which reported gains of 2.8%. The ASX All Ordinaries posted a decrease of 1.5% over fresh doubt about the Australian economy and the direction of interest rates.
Last month
Last 3 months
Last 6 months
Last 12 months
Last 5 years
Since May 2000
Deloitte WA Index 1.7% 2.6% -7.5% -14.5% -20.4% 312.2%
ASX All Ordinaries -1.5% 4.0% 4.9% 5.5% 19.4% 89.9%
US S&P 500 0.9% 4.5% 3.3% 10.7% 72.8% 46.8%
FTSE 100 2.8% 3.1% 6.3% 2.7% 23.8% 9.5%
Nikkei 1.6% 10.4% 18.9% 36.5% 76.5% 19.5%
Source: Capital IQ

3 | Issue 145 - Western Australian Stock Exchange Index
The FTSE 100 was the best performer in April, gaining 2.8% as resources stocks rallied from news of stimulus measures in China to spur its slowing growth. One of the key movers in April was BG Group plc, which saw its market capitalisation increase by 42.7% on news of a proposed takeover by Royal Dutch Shell. The agreement to buy BG Group for £47bn in cash and shares is anticipated to be one of the largest acquisitions of 2015, which could produce a company with market capitalisation in excess of £200bn.
The growth experienced by the Nikkei slowed down after experiencing stellar performance over the past 12 months, increasing by 1.6%. Mitsubishi UFJ Financial Group Inc. was the largest mover in April, experiencing a market capitalisation increase of 15.1%, driven largely by expectations that the group will report a net profit in excess of JPY¥1 trillion (approximately AUD$10.5bn) for financial year ended 31 March 2015, up from a record of JPY¥984.8bn in the prior fiscal period. The increased earnings expectation for Japan’s largest bank has been driven by successful acquisitions in overseas markets and the weakened Japanese Yen.

4 | Issue 145 - Western Australian Stock Exchange Index
Performance of global financial markets
Deloitte WA Index ASX All Ordinaries S&P 500 FTSE Nikkei
Source: Capital IQ
Performance of global financial markets since May 2000 (inception of Deloitte WA Index)
6.10
6.40
5.80
5.50
5.20
4.90
4.60
4.30
4.00
3.70
3.40
3.10
2.80
2.50
2.20
1.90
1.60
1.30
1.00
0.70
0.40
0.10
Nov 1
3
May
14
Nov14
May
13
Nov 1
2
May
12
May
00
Nov 0
0
May
01
Nov 0
1
May
02
Nov 0
2
May
03
Nov 0
3
May
04
Nov 0
4
May
05
Nov 0
5
May
06
Nov 0
6
May
07
Nov 0
7
May
08
Nov 0
8
May
09
Nov 0
9
May
10
Nov 1
0
May
11
Nov 1
1
Performance of global financial markets over the past 12 months
Mar
10
Apr 14
May
14
Jun 1
4Ju
l 14
Aug 14
Sep 1
4
Apr 15
Mar
15
Feb 1
5
Jan 15
Dec 14
Nov 14
Oct 14
1.40
1.30
1.20
1.00
1.10
0.80
0.90
0.70

5 | Issue 145 - Western Australian Stock Exchange Index
The Crude oil price increased by 16.8% over the course of the month. Significantly, stockpiles remain at a record high, however upward pressure on global supply is starting to ease, and the utilisation of U.S. exploration drill rigs is decreasing and stockpile growth rates are beginning to decline. Additionally, continued tension within the oil rich Middle East has heightened concerns of potential supply disruptions.
Iron ore prices rebounded during April, increasing by 9.4%. Prices reached 10 year lows of US$46.70 per tonne earlier in the month, however prices trended upward since then to reach nearly US$60 per tonne at the end of the month. The increase has been attributed to the announcement by China’s central bank that they will soon launch a credit easing program which is hoped to stimulate further growth and improve liquidity within the country. Furthermore, announcements of supply cutbacks and improved market sentiment within China has also played a role in the increase in the iron ore price.
Safe haven metals gold and silver, experienced decreases of 0.4% and 0.1% respectively for the month of April. News of higher U.S. interest rates, low inflation rates, a rise in treasury yields and speculation that the borrowing rates will increase has combined in lowering investor interest in gold in favour of high-yield assets such as equities. Demand for silver has also soured recently on the back the slowdown of economic growth in China.
Platinum and palladium prices increased 3.5% and 6.9% respectively over the month of April. China’s low demand in recent months has resulted in both metals struggling with April results showing a reversal in fortunes. Platinum’s increase is due to an increase in Chinese imports, with January and February representing the largest import quantities in any two-month period for the past 5 years. Platinum and Palladium’s improved fortunes are attributed to increasing car sales most notably in China, given that a significant portion of their global supply goes into the production of catalytic converters.
Commodity and precious metal prices
Commodity Metric 30 Apr 2015 31 Mar 2015 Monetary change
Percentage change
Gold US$/troy oz. 1,180.69 1,185.79 (5.10) (0.43%)Silver US$/troy oz. 1,667.00 1,668.50 (1.50) (0.09%)Platinum US$/troy oz. 1,158.00 1,119.00 39.00 3.49%Palladium US$/troy oz. 779.00 729.00 50.00 6.86%LME Copper US$/tonne 6,162.50 6,106.50 56.00 0.92%LME Nickel US$/tonne 13,391.00 12,824.50 566.50 4.42%LME Aluminium US$/tonne 1,891.75 1,792.00 99.75 5.57%LME Lead US$/tonne 2,090.00 1,823.75 266.25 14.60%LME Zinc US$/tonne 2,321.00 2,099.00 222.00 10.58%LME Tin US$/tonne 15,720.00 16,987.00 (1,267.00) (7.46%)Crude Oil (Brent) US$/bbl. 64.06 54.85 9.21 16.79%Uranium US$/lb. 38.25 39.25 (1.00) (2.55%)Iron Ore US$/tonne 58.00 53.00 5.00 9.43%Coal (Newcastle) US$/troy oz 61.90 57.20 4.70 8.22%
Source: Thompson Reuters DataStream Professional
Commodities price movements over the past month were varied, with strong gains within the energy and bulk commodities contrasting mixed performance in the precious and base metals. One of the main drivers behind the surge in commodity prices was China’s central bank releasing news of a monetary easing program, driving demand for base metals.
6 | Issue 145 - Western Australian Stock Exchange Index
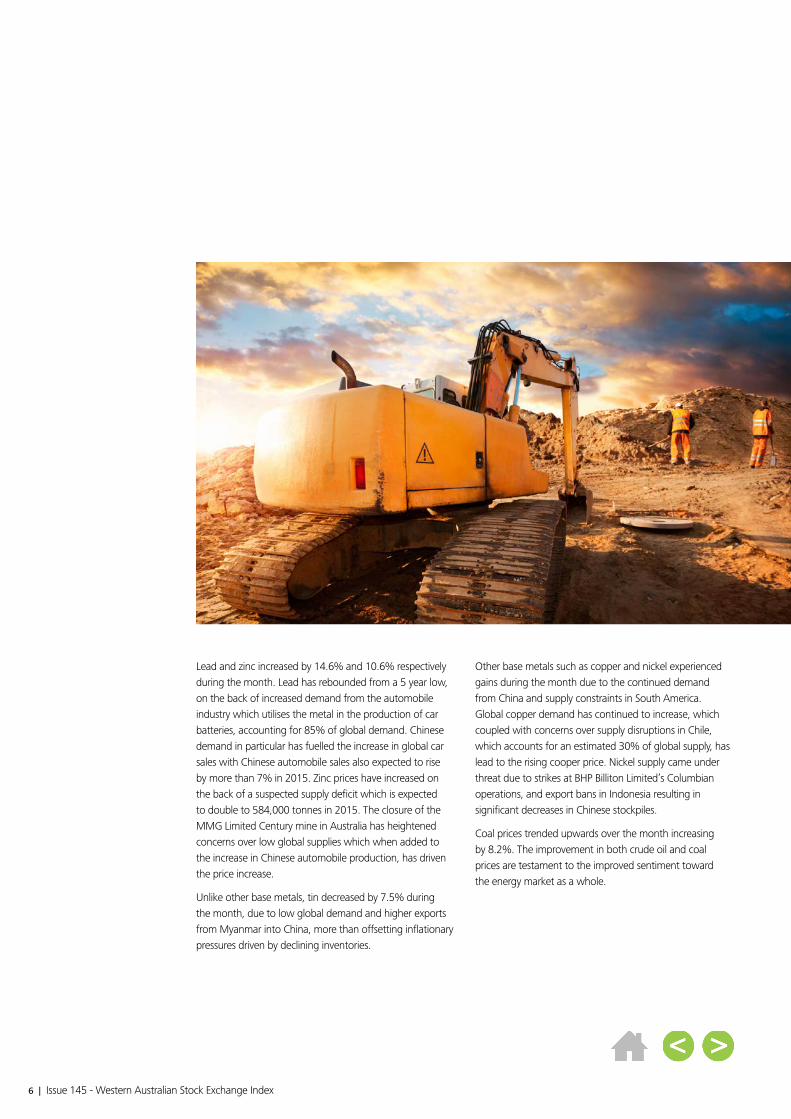
Lead and zinc increased by 14.6% and 10.6% respectively during the month. Lead has rebounded from a 5 year low, on the back of increased demand from the automobile industry which utilises the metal in the production of car batteries, accounting for 85% of global demand. Chinese demand in particular has fuelled the increase in global car sales with Chinese automobile sales also expected to rise by more than 7% in 2015. Zinc prices have increased on the back of a suspected supply deficit which is expected to double to 584,000 tonnes in 2015. The closure of the MMG Limited Century mine in Australia has heightened concerns over low global supplies which when added to the increase in Chinese automobile production, has driven the price increase.
Unlike other base metals, tin decreased by 7.5% during the month, due to low global demand and higher exports from Myanmar into China, more than offsetting inflationary pressures driven by declining inventories.
Other base metals such as copper and nickel experienced gains during the month due to the continued demand from China and supply constraints in South America. Global copper demand has continued to increase, which coupled with concerns over supply disruptions in Chile, which accounts for an estimated 30% of global supply, has lead to the rising cooper price. Nickel supply came under threat due to strikes at BHP Billiton Limited’s Columbian operations, and export bans in Indonesia resulting in significant decreases in Chinese stockpiles.
Coal prices trended upwards over the month increasing by 8.2%. The improvement in both crude oil and coal prices are testament to the improved sentiment toward the energy market as a whole.

7 | Issue 145 - Western Australian Stock Exchange Index
Western Australian movers and shakers over the past month
Mkt cap 30 Apr 2015
AU$m
Mkt cap 31 Mar 2015
AU$m
Change in month
AU$m
Change in month
%
Aziana Limited 74 20 54 277.9%
Coal of Africa Limited 78 45 34 75.0%
Buru Energy Limited 184 109 75 68.7%
Source: All data obtained from company websites, ASX website and Capital IQ
Aziana LimitedAziana Limited (“Aziana”) increased its market capitalisation by 277.9% from AU$20m to AU$74m during the month ended 30 April 2015. As at 30 April 2015 Aziana was ranked 100th in the Deloitte WA index, moving up 123 places from 223rd.
Aziana is a Western Australian established company which has historically been focused on mineral exploration in Madagascar. Aziana’s operations in Madagascar include the Manatenina Bauxite Project, Anasivola Copper-Gold-Molybdenum Project and Belanitra Graphite Project. Currently, Aziana is going through a transformational phase that will see the company transition from a resource exploration focused entity to a technology company. This transition commenced with Aziana’s sale of its Louisiana Oil & Gas projects at the end of 2014. In March 2015, Aziana agreed to a conditional contract to sell its Manatenina Bauxite Project and, in the same month entered to an agreement to acquire a US-based tech company called BrainChip. The BrainChip transaction remains subject to conditions, including shareholder approval, preparing a full form prospectus and completion of an equity raising.
Aziana’s market capitalisation surged by 277.9%, from 10 cents to 36 cents during the month following the announcement of the BrainChip acquisition. BrainChip is a United States company based in California, that founded and owns one of the world’s leading patented artificial intelligence technologies. This includes the creation of a Neural Computing technology that autonomously has the ability to learn, evolve and process information in a way that mirrors the neural behaviour of a biological brain.
BrainChip filed and successfully patented this technology in 2008 in both the U.S. and Australia. At the completion of the acquisition of BrainChip, Aziana will be the only ASX listed company in Australia to hold the patented artificial intelligence technology which is reportedly 5,000 times faster and substantially more power efficient than the fastest neural computing computers in use today.
Aziana claims that the technology is endorsed by the world’s leading neuroscientists and has numerous potential applications in smartphones, robotics, prostheses, toys, gaming, driverless vehicles, drones, and in sensor related products.
Coal of Africa LimitedCoal of Africa Limited (“CoAL”) increased its market capitalisation by 75.0% from AU$45m to AU$78m during the month ended 30 April 2015. As at 30 April 2015, CoAL was ranked 97th in the Deloitte WA index.
CoAL’s business centres on its exploration, development and mining operations of its coal interests located in South Africa. CoAL has been listed on the ASX since 1980 and subsequently listed on the Alternative Investment Market of the London Stock Exchange (AIM) in 2005 and the Johannesburg Stock Exchange (JSE) one year later, in 2006.

8 | Issue 145 - Western Australian Stock Exchange Index
CoAL’s flagship project is its 100.0% owned Vele coking and thermal coal colliery which operates out of the Limpopo Province in South Africa. The project commenced production at the beginning of 2012. CoAL’s other notable assets include the Mooiplaats Colliery (74.0% ownership) located in the Mpumalanga Province of South Africa and the Makhado project (100.0% ownership), situated 80km southeast from the Vele Project.
The Mooiplaats colliery has been on care and maintenance since 2013 as it was considered unprofitable for the company to continue operations. CoAL has recently signed a Sale and Purchase Agreement with Blackspear Capital Proprietary Limited to sell the colliery for 250m Rand, approximately AU$20.7m.
During the quarter ended March 2015, CoAL concluded negotiations for broad-based black economic-empowerment partners to acquire a 26% share of the Makhado project. South African mining legislation requires black empowered groups to hold a stake in all commodity projects in order to secure mining rights required for production. Chief Executive Officer of CoAL, David Brown expects that the mining right will be granted for the Makhado projected during the first 6 months of 2015.
Approval has also been granted for an updated Environmental Authorisation for the Vele Colliery’s anticipated plant modifications. Construction is expected to commence in the 3rd quarter of 2015 following approval of the Integrated Water Use Licence (IWUL) recently applied for.
In order to fund these activities at Makhado and Vele, last year CoAL’s shareholders approved a two stage equity placement for the issue of up to 695 million shares for £0.055 per share. The first stage was completed in November 2014 with CoAL issuing 251m shares for approximately £14m. In December it was decided that the second stage should be split with 300m shares issued in December for approximately £17m. Stage 3 was supposed to be settled by 29 April 2015, however during the month this was pushed out to 29 May 2015. An additional 144m shares will be issued at £0.055 per share raising approximately £8m resulting in a total capital raising of £38m.
Buru Energy LimitedBuru Energy Limited (Buru) increased its market capitalisation by 68.7% from AU$109m to AU$184m during the month ended 30 April 2015. As at 30 April 2015, Buru was ranked 49th in the Deloitte WA index.
Buru is an ASX listed oil & gas exploration and production company focused on exploring and developing its petroleum resources within the onshore Canning Basin, in the southwest Kimberley region of Western Australia.
Buru holds interests in an extensive portfolio of petroleum exploration permits covering approximately 83,000km2 in the Canning Superbasin, making Buru the largest holder in the area.
Buru’s exploration program has identified potentially world class gas accumulations in the Laurel Formation and a highly significant oil discovery at Ungani, owned 50/50 with Mitsubishi Corporation.
The 2011 oil discovery at Ungani, located 150 kilometres east of Broome, was the first onshore oil discovery in Western Australia in 10 years. Early production testing from two test wells established strong flows of light sweet crude in mid-2012.
The increase in Buru’s market capitalisation during the month is attributable to the announcement on the 14th of April, that Buru’s joint venture with Mitsubishi is expected to secure a production licence for the Ungani oil field, after executing a native title agreement with the Yawuru people. This was the final agreement required and follows the recent signing of native title agreements with the Nyikina Mangala and Karajarri Yanja people.
The good news continued for Buru, with the announcement one day later that the Supreme Court of WA ruled in Buru’s favour regarding a dispute over royalties payable to Fitzroy River Corporation. The decision supported Buru’s interpretation of the royalty agreement, being 2.0% of the value of petroleum at the well head.
Buru is currently upgrading its infrastructure at Ungani in anticipation of ramping production to full capacity. The upgrade is scheduled to begin in mid-July.

9 | Issue 145 - Western Australian Stock Exchange Index
This month
Last month
ASX Company name Mkt cap 30 Apr 2015
AU$m
Mkt cap 31 Mar 2015
AU$m
Last price (mth)
High price
(yr)
Low price
(yr)
EPS (PoAb)
1 1 WES Wesfarmers Limited 49,119 49,400 43.71 46.95 40.26 2.33
2 2 WPL Woodside Petroleum Ltd. 28,878 28,441 35.05 44.23 31.97 2.93
3 3 FMG Fortescue Metals Group Limited 6,757 6,103 2.17 5.03 1.75 0.43
4 4 ILU Iluka Resources Ltd. 3,410 3,552 8.16 9.23 5.57 -0.15
5 7 LNG Liquefied Natural Gas Limited 2,112 1,463 4.56 5.00 0.62 -0.09
6 5 BWP BWP Trust 1,953 1,927 3.04 3.21 2.31 0.32
7 6 NVT Navitas Limited 1,742 1,844 4.63 7.88 4.26 0.12
8 8 IIN iiNet Ltd. 1,620 1,439 9.94 10.18 6.12 0.39
9 13 IGO Independence Group NL 1,350 1,228 5.90 5.96 3.51 0.35
10 9 NST Northern Star Resources Limited 1,310 1,363 2.21 2.56 0.92 0.12
11 11 AHE Automotive Holdings Group Limited 1,309 1,287 4.27 4.33 3.42 0.27
12 10 SWM Seven West Media Limited 1,263 1,336 1.27 2.08 1.21 -1.00
13 12 MIN Mineral Resources Ltd 1,220 1,264 6.50 11.61 5.73 0.38
14 14 SIR Sirius Resources NL 1,195 1,125 2.90 4.16 2.18 -0.04
15 15 MND Monadelphous Group Limited 924 929 9.92 19.00 7.87 1.30
16 16 WSA Western Areas Limited 857 830 3.69 5.30 3.03 0.21
17 18 SFR Sandfire Resources NL 770 691 4.92 6.78 3.74 0.48
18 22 ASB Austal Ltd. 690 610 1.99 2.04 1.03 0.15
19 19 RRL Regis Resources Limited 627 657 1.26 2.45 1.15 -0.29
20 20 UOS United Overseas Australia Ltd. 627 633 0.54 0.59 0.44 0.08
21 25 MLX Metals X Limited 621 507 1.47 1.48 0.62 0.11
22 17 AMM Amcom Telecommunications Ltd. 613 719 2.30 2.99 1.84 0.08
23 21 PDN Paladin Energy Ltd 583 625 0.35 0.46 0.28 -0.14
24 23 PPC Peet Limited 555 592 1.14 1.40 1.01 0.08
25 24 TFC TFS Corporation Limited 543 575 1.66 2.24 1.17 0.44
26 26 CWP Cedar Woods Properties Ltd. 423 435 5.36 7.96 5.10 0.38
27 39 BCK Brockman Mining Limited 419 226 0.05 0.06 0.03 -0.04
28 27 CCV Cash Converters International Limited 412 433 0.86 1.21 0.77 0.02
29 28 TOX Tox Free Solutions Ltd. 405 379 3.02 3.76 2.15 0.16
30 49 8IH 8I Holdings LTD 361 186 1.01 1.13 0.25 2.66
31 29 SAR Saracen Mineral Holdings Limited 357 337 0.45 0.50 0.20 0.00
32 33 PRG Programmed Maintenance Services Ltd. 332 287 2.80 3.00 2.08 0.23
33 30 WLF Wolf Minerals Limited 295 323 0.37 0.41 0.23 -0.01
34 32 FRI Finbar Group Limited 294 288 1.28 1.70 1.23 0.13
35 31 SEH Sino Gas & Energy Holdings Ltd. 288 293 0.17 0.26 0.13 0.00
36 34 RCR RCR Tomlinson Limited 260 277 1.88 3.47 1.50 0.32
37 36 MRM MMA Offshore Limited 260 243 0.70 2.42 0.61 0.19
38 35 AQP Aquarius Platinum Limited 251 266 0.17 0.49 0.16 -0.03
39 40 IWG Iwebgate Limited 228 225 0.38 0.40 0.13 -0.17
40 37 MGX Mount Gibson Iron Limited 224 240 0.21 0.81 0.18 -0.78
41 45 RSG Resolute Mining Limited 215 199 0.34 0.73 0.22 -0.40
42 48 NGF Norton Gold Fields Limited 214 186 0.23 0.24 0.10 0.01
43 42 GOR Gold Road Resources Limited 211 208 0.36 0.40 0.14 0.00
44 44 MLD MACA Limited 209 204 0.90 2.25 0.76 0.28
45 38 ATU Atrum Coal NL 206 229 1.19 1.95 0.85 -0.14
46 56 PRU Perseus Mining Limited 200 150 0.38 0.55 0.20 0.03
47 41 DCG Decmil Group Limited. 195 214 1.16 2.25 1.11 0.30
48 46 MML Medusa Mining Limited 192 197 0.93 1.99 0.47 0.21
49 80 BRU Buru Energy Limited 184 109 0.54 1.25 0.31 -0.10
50 43 BDR Beadell Resources Ltd 180 208 0.23 0.71 0.19 0.02
Source: Australian Securities Exchange and Capital IQ
Earnings per share = company earnings divided by number of shares Price/Earnings ratio = A stock’s price divided by its historic earnings per share
WA’s top 100 listed companiesas at 30 April 2015
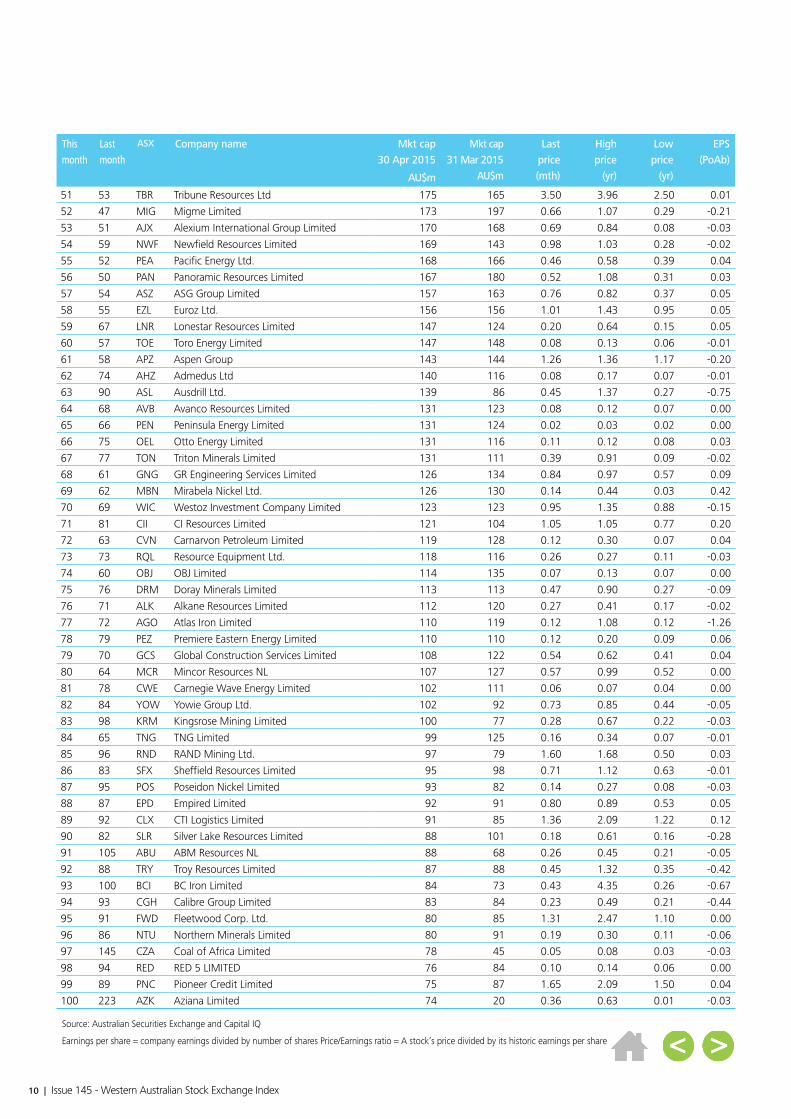
10 | Issue 145 - Western Australian Stock Exchange Index
This month
Last month
ASX Company name Mkt cap 30 Apr 2015
AU$m
Mkt cap 31 Mar 2015
AU$m
Last price (mth)
High price
(yr)
Low price
(yr)
EPS (PoAb)
51 53 TBR Tribune Resources Ltd 175 165 3.50 3.96 2.50 0.01
52 47 MIG Migme Limited 173 197 0.66 1.07 0.29 -0.21
53 51 AJX Alexium International Group Limited 170 168 0.69 0.84 0.08 -0.03
54 59 NWF Newfield Resources Limited 169 143 0.98 1.03 0.28 -0.02
55 52 PEA Pacific Energy Ltd. 168 166 0.46 0.58 0.39 0.04
56 50 PAN Panoramic Resources Limited 167 180 0.52 1.08 0.31 0.03
57 54 ASZ ASG Group Limited 157 163 0.76 0.82 0.37 0.05
58 55 EZL Euroz Ltd. 156 156 1.01 1.43 0.95 0.05
59 67 LNR Lonestar Resources Limited 147 124 0.20 0.64 0.15 0.05
60 57 TOE Toro Energy Limited 147 148 0.08 0.13 0.06 -0.01
61 58 APZ Aspen Group 143 144 1.26 1.36 1.17 -0.20
62 74 AHZ Admedus Ltd 140 116 0.08 0.17 0.07 -0.01
63 90 ASL Ausdrill Ltd. 139 86 0.45 1.37 0.27 -0.75
64 68 AVB Avanco Resources Limited 131 123 0.08 0.12 0.07 0.00
65 66 PEN Peninsula Energy Limited 131 124 0.02 0.03 0.02 0.00
66 75 OEL Otto Energy Limited 131 116 0.11 0.12 0.08 0.03
67 77 TON Triton Minerals Limited 131 111 0.39 0.91 0.09 -0.02
68 61 GNG GR Engineering Services Limited 126 134 0.84 0.97 0.57 0.09
69 62 MBN Mirabela Nickel Ltd. 126 130 0.14 0.44 0.03 0.42
70 69 WIC Westoz Investment Company Limited 123 123 0.95 1.35 0.88 -0.15
71 81 CII CI Resources Limited 121 104 1.05 1.05 0.77 0.20
72 63 CVN Carnarvon Petroleum Limited 119 128 0.12 0.30 0.07 0.04
73 73 RQL Resource Equipment Ltd. 118 116 0.26 0.27 0.11 -0.03
74 60 OBJ OBJ Limited 114 135 0.07 0.13 0.07 0.00
75 76 DRM Doray Minerals Limited 113 113 0.47 0.90 0.27 -0.09
76 71 ALK Alkane Resources Limited 112 120 0.27 0.41 0.17 -0.02
77 72 AGO Atlas Iron Limited 110 119 0.12 1.08 0.12 -1.26
78 79 PEZ Premiere Eastern Energy Limited 110 110 0.12 0.20 0.09 0.06
79 70 GCS Global Construction Services Limited 108 122 0.54 0.62 0.41 0.04
80 64 MCR Mincor Resources NL 107 127 0.57 0.99 0.52 0.00
81 78 CWE Carnegie Wave Energy Limited 102 111 0.06 0.07 0.04 0.00
82 84 YOW Yowie Group Ltd. 102 92 0.73 0.85 0.44 -0.05
83 98 KRM Kingsrose Mining Limited 100 77 0.28 0.67 0.22 -0.03
84 65 TNG TNG Limited 99 125 0.16 0.34 0.07 -0.01
85 96 RND RAND Mining Ltd. 97 79 1.60 1.68 0.50 0.03
86 83 SFX Sheffield Resources Limited 95 98 0.71 1.12 0.63 -0.01
87 95 POS Poseidon Nickel Limited 93 82 0.14 0.27 0.08 -0.03
88 87 EPD Empired Limited 92 91 0.80 0.89 0.53 0.05
89 92 CLX CTI Logistics Limited 91 85 1.36 2.09 1.22 0.12
90 82 SLR Silver Lake Resources Limited 88 101 0.18 0.61 0.16 -0.28
91 105 ABU ABM Resources NL 88 68 0.26 0.45 0.21 -0.05
92 88 TRY Troy Resources Limited 87 88 0.45 1.32 0.35 -0.42
93 100 BCI BC Iron Limited 84 73 0.43 4.35 0.26 -0.67
94 93 CGH Calibre Group Limited 83 84 0.23 0.49 0.21 -0.44
95 91 FWD Fleetwood Corp. Ltd. 80 85 1.31 2.47 1.10 0.00
96 86 NTU Northern Minerals Limited 80 91 0.19 0.30 0.11 -0.06
97 145 CZA Coal of Africa Limited 78 45 0.05 0.08 0.03 -0.03
98 94 RED RED 5 LIMITED 76 84 0.10 0.14 0.06 0.00
99 89 PNC Pioneer Credit Limited 75 87 1.65 2.09 1.50 0.04
100 223 AZK Aziana Limited 74 20 0.36 0.63 0.01 -0.03
Source: Australian Securities Exchange and Capital IQ
Earnings per share = company earnings divided by number of shares Price/Earnings ratio = A stock’s price divided by its historic earnings per share
11 | Issue 145 - Western Australian Stock Exchange Index
Compilation of the Deloitte WA Index
Compilation of the Deloitte WA Index The monthly Deloitte WA Index is compiled from publicly available information provided by the ASX and Capital IQ on the market capitalisation of each Western Australian listed company.
A company is included as a Western Australian Company where its registered office is listed in Western Australia, regardless of whether the company is dual listed. The information on Western Australian listed companies is extracted and then summarised to provide a cumulative market capitalisation figure for all Western Australian listed companies.
The base period of the Deloitte WA Index is May 2000 and for the purposes of the Index the month of May 2000 is given a notional value of one. All subsequent monthly cumulative market capitalisation totals are divided by the May 2000 total to then obtain a relative movement. Please note that if a company has been suspended or delisted during a particular period no data will be included for that month and all subsequent months until the company is re-listed or the suspension lifted. Historical information regarding the company’s market capitalisation will continue to be included in the calculation of the Index.
Earnings per share (EPS) is a basic EPS calculation, i.e. net profit divided by weighted average number of shares.
About Deloitte PerthAs one of Australia’s leading professional services firms, Deloitte Touche Tohmatsu and its affiliates provide audit, tax, consulting, and financial advisory services through approximately 6,000 people across the country. We have expertise that spans industry sectors including automotive; consumer business; energy and resources; financial services; government services; life sciences and health care; manufacturing; real estate; and technology, media and telecommunications. Focused on the creation of value and growth, and known as an employer of choice for innovative human resources programs, we are dedicated to helping our clients and our people excel. Our professionals are dedicated to strengthening corporate responsibility, building public trust, and making a positive impact in their communities.
Our Perth practice continues to grow with over 500 dedicated personnel including 52 partners. We provide high quality service to our clients throughout Western Australia, delivering seamless solutions and the insights that they need to address their most complex business challenges. The strong performance culture of the Perth office is attributed to Deloitte’s seven Signals, representing who we are and how we do business.
Disclaimer of liabilityThis Index has been prepared as general information only and does not consider the specific objectives, situation or needs of anyone including any member of its target audience. You should not rely on the information in the Index or disclose it or refer to it in any document.
Deloitte does not accept any duty of care or liability to anyone regarding this Index or any of its content and we are not responsible to anyone for any loss suffered in connection with the use of this Index or any of its content. We make no representation or warranty about the accuracy of the information in the Index. Circumstances might have changed since the date this Index was prepared.
For information regarding the Deloitte WA Index, please contact:
Tim RichardsTel: +61 8 9365 7248 [email protected]
David NewmanTel: +61 8 9365 7178 [email protected]
Adrian KellyTel: +61 8 9365 7266 [email protected]
www.deloitte.com.au
Perth officeTel: +61 8 9365 7000 Fax: +61 8 9365 7001
12 | Issue 145 - Western Australian Stock Exchange Index
Awarded in 2013
AFR CFO Awards 2013 Deloitte wins the double• Deloitte won both the Accounting Firm of the
Year and the Audit Firm of the Year in the Financial Review CFO Awards 2013. This was the first time in the awards’ history that any firm had taken out both awards in the same year.
Deloitte Audit Services wins Australian International Design Award• Recognised for commitment to applying design
thinking principles to better understand client needs.
Deloitte ranked #1 Globally in Security Consulting• The world’s largest IT consulting firm, as well as the
largest security consulting services firm, with the largest and most mature global delivery network compared with the four other top firms.
Deloitte ranked #1 in Global Financial Services Consulting by Kennedy• Measured by capabilities and skills in delivering
integrated offerings around restructuring and rebuilding opportunities for its financial services clients.
Deloitte ranks #1 in 2013 World’s Best Outsourcing Advisors List• Recognised Deloitte’s deep experience and knowledge
in finance, human capital, IT and other frequently outsourced functions, as well as its ability to help organisations throughout the outsourcing life cycle.
Deloitte ranked #1 in Global Consulting by Gartner• Deloitte remained the top player in 2012 for
consulting services, with a 6.6% market share and consulting services growth rate of 13.8%.
Kennedy named Deloitte as the global leader for Human Capital Strategy Consulting• Recognising Deloitte’s capability strengths including
human capital analytics and a heavy investment in predictive analytics tools for scenario modelling, strategic workforce planning and talent management, as an aging workforce and shortage of qualified talent drove industry spend.
ANZ FastPay, developed by Deloitte Digital, won two awards• Australia’s first mobile banking app recognised
for ‘Innovation in Mobile Payments’ at the IDC Financial Insights Innovation Awards in Singapore and a Trailblazer Award for ‘Channel Excellence in Mobile Payments’ for Asia.
Deloitte named a global leader in change management by Kennedy• The evaluation was based primarily on service
capabilities breadth and depth, client satisfaction, and market eminence.
Recent awards and achievements
Awarded in 2014
Kennedy ranked Deloitte #1 in Global Consulting and Management Consulting• Ranked #1 in Global Consulting and Management
Consulting based on revenue by Kennedy in its recent report titled Global Consulting Index 2013.
Gartner names Deloitte #1 globally in Consulting• Third year running, ranked #1 globally in Consulting in
Gartner’s recently released market share analysis titled Market Share: IT Services, 2013.
Kennedy names Deloitte the leader in Analytics IT Consulting 2014• Deloitte was named the leader in Analytics IT
Consulting by Kennedy in its IT Consulting: Analytics 2014 report.
Kennedy names Deloitte a leader in Benefits Consulting 2014• Kennedy named Deloitte a leader in its recently
released report titled Benefits Consulting 2014.
Forrester names Deloitte a global leader in Oracle Application Services Q1 2014• Forrester named Deloitte a global leader in Oracle
Application Services in its recently released report titled Forrester Wave: Oracle Application Services Providers, Q1 ‘14.
Tier One tax practice and Tier One transfer pricing practice for 2014 by the International Tax Review• Deloitte’s recognition as a Tier One tax and transfer
pricing practice by the prestigious International Tax Review journal cements our reputation as leading tax advisers to corporate Australia. Our depth of tax and transfer pricing expertise, and the innovative tax and transfer pricing services we provide to a wide range of blue-chip clients across numerous industries, has allowed us to continue to attract some of the most eminent and accomplished Australian practitioners to enhance our growing practice.

13 | Issue 145 - Western Australian Stock Exchange Index
About Deloitte
Our Signals
Continuously grow and improveWe have an environment that respects the individual, rewards achievements, welcomes change and encourages a lifetime of learning – with ourselves and our clients.
Have fun and celebrateThere is never a wrong time to celebrate and have fun – recognising, appreciating, acknowledging and learning from the experiences and success shared between our client and Deloitte teams.
Aim to be famousWe aim to reach for the stars – and beyond. To be thought leaders, showcasing our clients and our team’s talent and expertise.
Play to winThink globally – Winning is our stated objective. It is also our state of mind.
Talk straightWhen we talk, it’s open, regular, honest, constructive two-way communication between our people and our clients.
Empower and trustWe encourage a sense of ownership and pride by giving responsibility and delegating authority.
Recruit and retain the bestOur people are talented, enthusiastic, self-starters, team players who are bursting with potential. They are people with whom we have a lifetime association.
Our Culture – our essenceCulture at Deloitte does not just happen – we work at it. It’s the sum total of the actions of our people, it’s the way we treat others – it’s the way we behave. Our seven Signals embody these values. Our passion for teamwork and exceptional client service is our point of difference.
At Deloitte, we live and breathe our culture. Our internationally experienced professionals strive to deliver seamless, consistent services wherever our clients operate.
Our mission is to help our clients and our people excel.
14 | Issue 145 - Western Australian Stock Exchange Index
Contact us
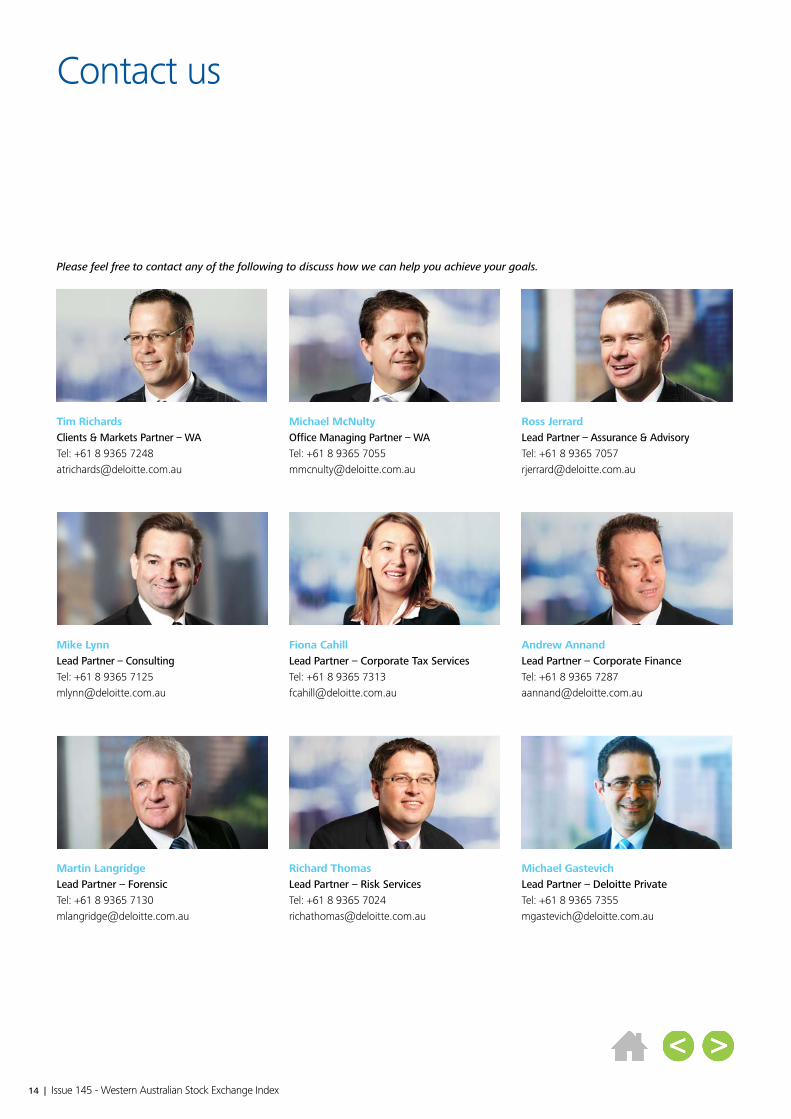
Please feel free to contact any of the following to discuss how we can help you achieve your goals.
Tim RichardsClients & Markets Partner – WA Tel: +61 8 9365 7248 [email protected]
Michael McNultyOffice Managing Partner – WA Tel: +61 8 9365 7055 [email protected]
Ross JerrardLead Partner – Assurance & Advisory Tel: +61 8 9365 7057 [email protected]
Mike LynnLead Partner – Consulting Tel: +61 8 9365 7125 [email protected]
Fiona CahillLead Partner – Corporate Tax Services Tel: +61 8 9365 7313 [email protected]
Andrew AnnandLead Partner – Corporate Finance Tel: +61 8 9365 7287 [email protected]
Martin LangridgeLead Partner – Forensic Tel: +61 8 9365 7130 [email protected]
Richard ThomasLead Partner – Risk Services Tel: +61 8 9365 7024 [email protected]
Michael GastevichLead Partner – Deloitte Private Tel: +61 8 9365 7355 [email protected]

15 | Issue 145 - Western Australian Stock Exchange Index
Culture at Deloitte does not just happen – we work at it

Contact us
Deloitte Level 14, Woodside Plaza 240 St Georges Terrace Perth WA 6000 Australia
Tel: +61 8 9365 7000 Fax: +61 8 9365 7001
www.deloitte.com.au
This publication contains general information only, and none of Deloitte Touche Tohmatsu Limited, its member firms, or their related entities (collectively the ‘Deloitte Network’) is, by means of this publication, rendering professional advice or services.
Before making any decision or taking any action that may affect your finances or your business, you should consult a qualified professional adviser. No entity in the Deloitte Network shall be responsible for any loss whatsoever sustained by any person who relies on this publication.
About Deloitte
Deloitte refers to one or more of Deloitte Touche Tohmatsu Limited, a UK private company limited by guarantee, and its network of member firms, each of which is a legally separate and independent entity. Please see www.deloitte.com/au/about for a detailed description of the legal structure of Deloitte Touche Tohmatsu Limited and its member firms.
Deloitte provides audit, tax, consulting, and financial advisory services to public and private clients spanning multiple industries. With a globally connected network of member firms in more than 150 countries, Deloitte brings world-class capabilities and high-quality service to clients, delivering the insights they need to address their most complex business challenges. Deloitte has in the region of 200,000 professionals, all committed to becoming the standard of excellence.
About Deloitte Australia
In Australia, the member firm is the Australian partnership of Deloitte Touche Tohmatsu. As one of Australia’s leading professional services firms, Deloitte Touche Tohmatsu and its affiliates provide audit, tax, consulting, and financial advisory services through approximately 6,000 people across the country. Focused on the creation of value and growth, and known as an employer of choice for innovative human resources programs, we are dedicated to helping our clients and our people excel. For more information, please visit Deloitte’s web site at www.deloitte.com.au.
Liability limited by a scheme approved under Professional Standards Legislation.
Member of Deloitte Touche Tohmatsu Limited
© 2015 Deloitte Touche Tohmatsu.
MCBD_PER_05/15_A51697