issue 28
DESCRIPTION
technicalTRANSCRIPT

Jun
e2
00
8
.technicalanalyst.co.ukwwwThe publication for trading and investment professionals
Markets StrategiesThe predictive power
of fund flows
Automated TradingOverview of
execution algorithmsSector performance
in the S&P500
Dealing with RiskJulian McCree of Erste Bank

presents
A premier event for trading and investment professionals
Speakers include:
Global Equities
200826 June 2008
Chandos House
London W1Outlook and investment
strategies for global stocks
Web: www.technicalanalyst.co.uk
Telephone: +44 (0)1483 573150
Register Today!
Email: [email protected]
Topics covered:Who should attend:
Delegate fee: £445 + VAT
+ Outlook for global stocks+ VIX and market direction+ Trend following strategies+ Momentum investing+ Issues in shorting stocks
+ Fund managers+ Hedge funds+ Traders+ Risk managers+ Analysts+ Brokers
Bringing together leading experts in the field oftechnical and quantitative trading, the confer-ence will look to assess the effectiveness of thevarious equity trading strategies such as trendfollowing and momentum investing in thecurrent market climate, as well as providing anin-depth assessment of the outlook for the majorstock markets. This is the essential event for theUK and Europe’s investment community.
Max KnudsenPIA First
Antonio ManziniUBS
Charles MorrisHSBC Investments
Laurens SwinkelsRobeco
Robin GriffithsCazenove Capital
Richard RamyarLipper
© 2008 Global Markets Media Limited. All rights reserved. Neither this publication nor any part of it may be
reproduced, stored in a retrieval system, or transmitted in any form or by any means, electronic, mechanical,
photocopying, recording or otherwise, without the prior permission of Global Markets Media Limited. While the
publisher believes that all information contained in this publication was correct at the time of going to press, they
cannot accept liability for any errors or omissions that may appear or loss suffered directly or indirectly by any
reader as a result of any advertisement, editorial, photographs or other material published in The Technical
Analyst. No statement in this publication is to be considered as a recommendation or solicitation to buy or sell
securities or to provide investment, tax or legal advice. Readers should be aware that this publication is not
intended to replace the need to obtain professional advice in relation to any topic discussed.
CONTENTS 1 FEATURES
S&P500 OutlookKamran Sheikh of Informa Global Markets
breaks down the S&P500 and gives
his outlook for its various sectors.
Managing RiskJulian McCree of Erste Bank talks about
his approach to trade management.
Fund Flows Data We present a Deutsche Bank study that
looks to establish if weekly fund flows
data can be used to predict the markets.
JUNE
>36
>04
> 19
>
> >
WELCOMEAlthough a great deal is written in books and magazines (including this one) about
how to employ technical trading strategies, the subjects of risk and money man-
agement are often overlooked. As any successful trader will tell you, this is often
as important a subject as choosing a successful entry and exit strategy. In this
issue Julian McCree, a trader at Erste Bank, gives us his views on how trade man-
agement is best approached when combined with a technical trading strategy.
We also discuss the importance of funds flows and examine if data can be used to
predict market movements.
We hope you enjoy this edition of the magazine
Matthew Clements, Editor
June 2008 THE TECHNICAL ANALYST 1


Editor: Matthew Clements
Managing Editor: Jim Biss
Consultant Editor: Trevor Neil
Advertising & subscriptions:Louiza Charalambous
Marketing: Vanessa Green
Events: Adam Coole
Design & Production:Stuart Field
The Technical Analyst is published by
Global Markets Media Ltd
Jeffries House
1-5 Jeffries Passage
Guildford
GU1 4AP
UK
Tel: +44 (0)20 7833 1441
Web: www.technicalanalyst.co.uk
Email: [email protected]
SUBSCRIPTIONS
Subscription rates (6 issues)
UK: £160 per annum
Rest of world: £185 per annum
Electronic pdf: £49 per annum
For information, please contact:
ADVERTISING
For information, please contact:
PRODUCTION
Art, design and typesetting by
Stuart Field.
Printed by Goodman Baylis
ISSN(1742-8718)
MARKET VIEWS S&P500 - Divergence in sector performance
Emerging Markets Outlook
Outlook for Crude Oil
TECHNIQUES Volume - The voice of the market
The Predictive Power of Weekly Fund Flows
The ARMS Index
Trading Variations in Double Tops and Double Bottoms
INTERVIEWJulian McCree, Erste Bank
RESEARCH UPDATE
BOOKSThe Encyclopedia of Candlestick Charts
Top Ten Books
AUTOMATED TRADING SYSTEMSOverview of Today’s Algorithms:
Advanced Strategies for a Complex Marketplace
TRAINING DIARY
04
10
12
16
19
28
32
36
41
43
44
45
48
CONTENTS 2 REGULARS>
June 2008 THE TECHNICAL ANALYST 3
28 43

4 THE TECHNICAL ANALYST June 2008
Market Views

S&P500DIVERGENCE IN SECTOR PERFORMANCE By Kamran Sheikh
June 2008 THE TECHNICAL ANALYST 5
Market Views
Sector performanceAfter a notably weak start to the year by the entire market,there has been a marked divergence in sector performance in2008. While the S&P500 has lost only 2.90% (by 16 May)after recovering from its early losses, sharp declines wereseen in sectors like Financials (-10.4%), Healthcare (-10.4%)and Telecommunication (-8.1%). See Figure 1. On the otherhand some sectors outperformed the broader market, such asMaterials (+10.0%), Energy (+9.0%) and ConsumerDiscretionary (+1.5%).
Historically out performance by the Energy Sector hascoincided with a decline in the broader market. The EnergySector also has a tendency to rally at the end of an expansionin the economic cycle. While weight of the Energy sector(and of course fuel prices) can be seen adversely affecting thestock market, out performance the Materials and ConsumerDiscretionary sectors is evidence of confidence in the econ-omy via strong manufacturing and high levels of spendingon the luxury goods and services, respectively, even in thecurrent market conditions.
Despite the fact that the S&P Information TechnologySector is still down 4% this year so far (16 May), the recentbreakouts on the Sector Index and the relative strength ofS&P500 charts is of significant importance as this sector hasan history of leading bull markets. Another positive develop-ment is the recent weakness of the Consumer Staples Indexrelative to the S&P500. Historically Consumer Staples sectoris considered resilient to overall bearish stock market condi-tions and outperforms S&P500 during times of poor confi-dence in the economy. By contrast, it usually underperformsduring times of confidence. The recent deterioration in theSector’s relative strength to the broader market, after a peri-od of out performance in Q4 2007 and Q1 2008, is a posi-tive signal for the stock market.
In this article we take a brief look at US stock market sec-tors. Since global stock markets are closely interconnected,similar trends can be observed in other markets around theglobe.
Bullish energy sector In light of rising fuel prices to fresh record highs (Figure 2),it is not surprising that the Energy sector is making new alltime highs. The current bull market commenced in mid-2002and regardless of a few corrective reactions, the overall trendhas been strong. The second half of 2007 witnessed high lev-els of volatility but the Index has held above the support
“DESPITE SOME OVERBOUGHT CONDITIONS [IN THEENERGY SECTOR] NEITHER INDICATORS NOR THE CHART
STRUCTURE SHOW SIGNS OF REVERSAL”
→
Figure 1. S&P500 sector performance
Figure 2. S&P Energy Sector


near 480 (2006 peak) during August and January dips. Theearly April break above the trendline resistance near 580 wasfollowed by fresh all time highs. Despite some overboughtconditions, neither indicators nor the chart structure showsany signs of reversal at this stage.
The Energy sector has been outperforming the S&P500since late 2003. However, the out-performance significantlyaccelerated following a break above the neckline of a doublebottom formation (Sep 2006-Jan 2007) in mid last year. Therelative strength chart is solidly entrenched within a bullchannel since early this year. We look for this trend to contin-ue for the time being. A break below the channel support onthe relative strength charts would warn of diminishing inter-est in the Energy Sector and may be a positive sign for therest of the stock market.
Technology – a leading indicatorThe Information Technology sector index is considered aleading sector. Historically this sector has led bull markets inpast years and generally outperformed the broader market.The index completed a classic text book head and shoulderformation in early January (Figure 3). This was followed by asharp decline to probe below the formation objective at 340within 3 weeks. Following a 3 month consolidation within atight 335-364 range, the index has completed a base, whichalso coincides with a 5 month bear trendline break on the rel-ative strength charts. The subsequent breaks above the trend-line near 381, and the 200 day moving average close to 385,corresponded with a rally on the relative strength charts. Wetake this advance as a positive sign for the stock market ingeneral and the Information sector in particular.
Industrials outperformFollowing a sharp decline in late January, the S&P Industrialssector has formed a series of consecutive rising troughs andpeaks. A break above the 6 month trendline resistance (con-necting October and December 2007 highs) near 341 and therecent clearance of the 200 day moving average close to 349exhibits underlying strength (Figure 4).
The sector has been outperforming the S&P500 sinceApril 2007. However, the recent formation of a potentialhead and shoulders top on the relative strength charts warnsof a possible reversal, though the outlook remains positivewhile the S&P Industrial & S&P500 ratio is above the neck-line at 0.24.
Telecoms face resistance The S&P Telecommunication Services sector advanced formost of 2006 and 2007, outperforming the rest of the mar-ket before the index completed a double top formation uponbreach of the neckline at 159 late last year. The subsequentdecline was worse than the rest of the market as reflected onthe relative strength charts (Figure 5). Following a 3 monthbasing, the index has shown some recovery, however thetrendline from the September peak and the 200 day movingaverage near 160 offer tough resistance. The relative perform-ance chart is exhibiting a fairly neutral outlook at this stage.
Materials see new highsThe Materials sector index has been in an uptrend since mid2006 and outperforming the broader market since late2006. The second half of 2007 and early 2008 saw high
June 2008 THE TECHNICAL ANALYST 7
Market Views
Figure 3. S&P Information Technology Index
Figure 4. S&P Industrials Sector
Figure 5. S&P Telecom Services Sector Index
→
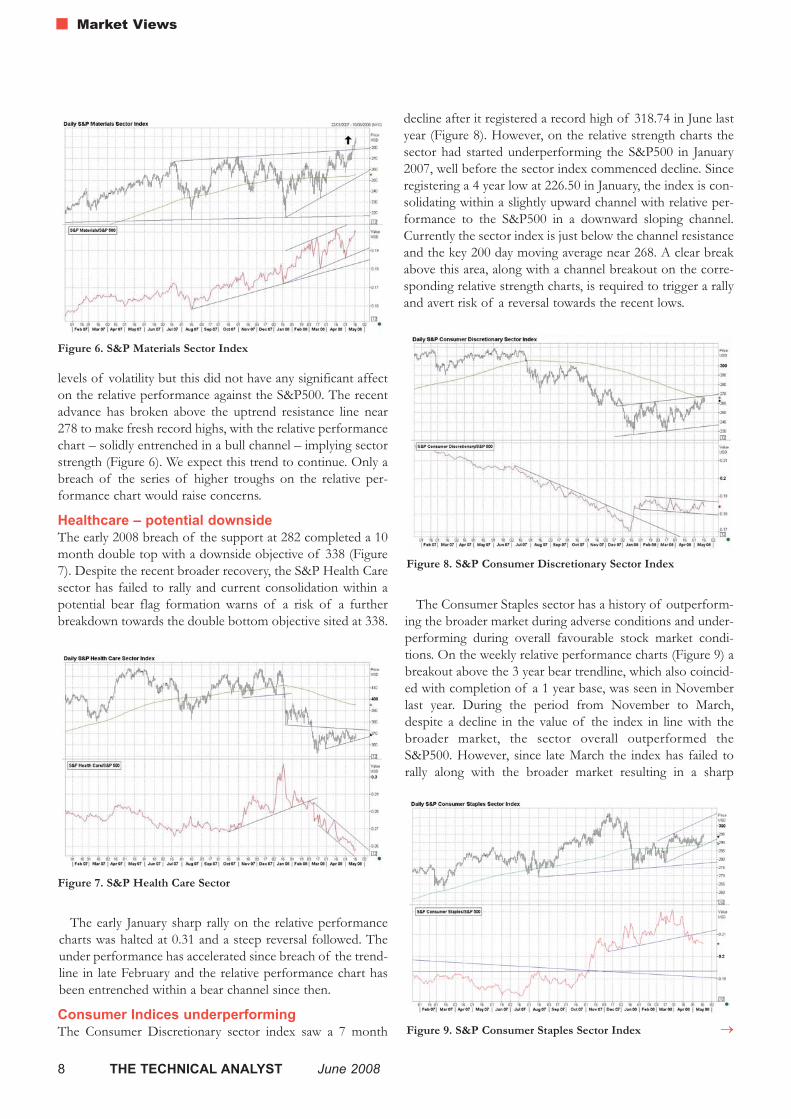
levels of volatility but this did not have any significant affecton the relative performance against the S&P500. The recentadvance has broken above the uptrend resistance line near278 to make fresh record highs, with the relative performancechart – solidly entrenched in a bull channel – implying sectorstrength (Figure 6). We expect this trend to continue. Only abreach of the series of higher troughs on the relative per-formance chart would raise concerns.
Healthcare – potential downside The early 2008 breach of the support at 282 completed a 10month double top with a downside objective of 338 (Figure7). Despite the recent broader recovery, the S&P Health Caresector has failed to rally and current consolidation within apotential bear flag formation warns of a risk of a furtherbreakdown towards the double bottom objective sited at 338.
The early January sharp rally on the relative performancecharts was halted at 0.31 and a steep reversal followed. Theunder performance has accelerated since breach of the trend-line in late February and the relative performance chart hasbeen entrenched within a bear channel since then.
Consumer Indices underperformingThe Consumer Discretionary sector index saw a 7 month
decline after it registered a record high of 318.74 in June lastyear (Figure 8). However, on the relative strength charts thesector had started underperforming the S&P500 in January2007, well before the sector index commenced decline. Sinceregistering a 4 year low at 226.50 in January, the index is con-solidating within a slightly upward channel with relative per-formance to the S&P500 in a downward sloping channel.Currently the sector index is just below the channel resistanceand the key 200 day moving average near 268. A clear breakabove this area, along with a channel breakout on the corre-sponding relative strength charts, is required to trigger a rallyand avert risk of a reversal towards the recent lows.
The Consumer Staples sector has a history of outperform-ing the broader market during adverse conditions and under-performing during overall favourable stock market condi-tions. On the weekly relative performance charts (Figure 9) abreakout above the 3 year bear trendline, which also coincid-ed with completion of a 1 year base, was seen in Novemberlast year. During the period from November to March,despite a decline in the value of the index in line with thebroader market, the sector overall outperformed theS&P500. However, since late March the index has failed torally along with the broader market resulting in a sharp
Figure 6. S&P Materials Sector Index
Figure 7. S&P Health Care Sector
Figure 8. S&P Consumer Discretionary Sector Index
Figure 9. S&P Consumer Staples Sector Index →
Market Views
8 THE TECHNICAL ANALYST June 2008

decline on the relative performance charts. The outlook ofthe relative strength charts seems negative which may be aprecursor to a broader bull market.
Financials – no sign of recoveryThe S&P Financial sector index completed a double top for-mation in July 2007 (Figure 10). The relative performancechart had already shown signs of warning upon completionof a top area 4 months before the credit crunch started tak-ing its toll in March last year. A sharp decline followed onboth the sector and relative performance charts. Despiterecent basing on the Financial Sector charts following theMarch low at 302.82, the relative strength versus the S&P500,which is still declining within a bear channel, has shown nosigns of improvement so far.
Utilities – possible strength aheadThe Utilities sector has enjoyed an uptrend on the relativeperformance charts from mid 2004 (Figure 11). Despite thehigh volatility on the index chart in late 2007 and early 2008,the relative performance versus the S&P500 – on the longerterm charts – is still in an uptrend and above the key 4 year
bull trendline. Since establishing a high in January following arecord high at 225 on the sector index chart, the relativestrength to the S&P500 is within a bear channel. Currentlythe Utilities sector is forming a potential reverse head andshoulders formation. A clear break above the horizontalneckline near 209, along with a breakout from the bear chan-nel resistance on the relative strength charts, would signalcontinuation of the primary bull trend on both the index andthe relative performance chats.
Figure 10. S&P Financial Sector Index
Figure 11. S&P Utilities Sector
“AFTER A NOTABLY WEAK START TOTHE YEAR BY THE ENTIRE MARKET,
THERE HAS BEEN A MARKED DIVERGENCE IN SECTOR PERFORMANCE IN 2008”
Kamran Sheikh is technical analyst with InformaGlobal Markets in London.
June 2008 THE TECHNICAL ANALYST 9
Market Views

10 THE TECHNICAL ANALYST June 2008
Market Views
June 2008 THE TECHNICAL ANALYST 11
Market Views
TA: Do you believe there is a decoupling between USand Asian stocks and economies?
MH: You need to distinguish between macro decoupling andasset price decoupling. There is very clear evidence of eco-nomic decoupling between the US and the BRIC and Asianeconomies. In contrast asset prices are correlated. When theUS stock market falls, so do Asian stock markets. But thenegative hit is much smaller than it used to be.
TA: What is your view of the Chinese stock market?
MH: The Chinese market is oversold and investors areunderweight. We say trading buy. But a renewed secularupswing in the Chinese stock market requires a sustained fallin inflation.
TA: Do you think other markets apart from BRICs,such as the frontier markets of central Asia, will offerbetter opportunities?
MH: Frontier markets offer strong, uncorrelated returns.The markets are undercapitalized and under owned, offerstrong economic growth potential, and are underleveragedeconomies. Within Emerging Markets the BRIC markets willretain the leadership.
TA: Which emerging markets do you think are over-bought?
MH: Morocco, Egypt and Brazil are currently the most over-bought relative to their 200 day moving average.
TA: Do any recent dips in emerging markets offergood buying opportunities or are you expecting amore sustained correction?
MH: We've been buyers since the Bear Stearns event but webelieve it's a bear market rally.
TA: Will a decline in export competitiveness viz-a-viza fall in the USD have a major impact? Where will itits impact be felt most?
MH: Not for the commodity producers. They love a weaker
dollar. And the Asian markets are benefiting from the strongEuro. Indeed, while export growth from Asia to the US hasslowed over the past year, total Asian export growth has actu-ally risen.
TA: What other markets or data do you think are use-ful as leading indicators for emerging market equi-ties?
MH: Our best short term sentiment indicators are the MerrillLynch Fund Managers Survey and the EPFR fund flow data.Emerging Markets are of course also highly correlated withmany other market indicators, such as commodities, the USdollar, volatility and the S&P500.
TA: Re portfolio/country allocation, what are the keyfactors in your decision-making process?
MH: We are always overweight markets with attractive valu-ations (cheap PEs) and large current account surpluses. Thelatter implies high levels of savings and liquidity. If you canget that cheap then you are onto a winner.
TA: Can you give us an idea of how you use EPFRdata? Are you looking to follow trends or spot poten-tial reversals when the market is over-extended? Howgood is EPFR data in helping you to do this?
MH: EPFR flow data helps us to identify inflexion points inthe equity market. We use flow data to develop trading rulesand make directional calls on emerging markets. The data isvery useful.
TA: What techniques do you use to fine-tune/timeyour entries and exits? How and to what extent doyou use technical analysis?
MH: In addition to our flow and sentiment tools, we usetechnical indicators such as 200 day moving averages and soon to indicate breakouts and the extent to which markets areoverbought and oversold.
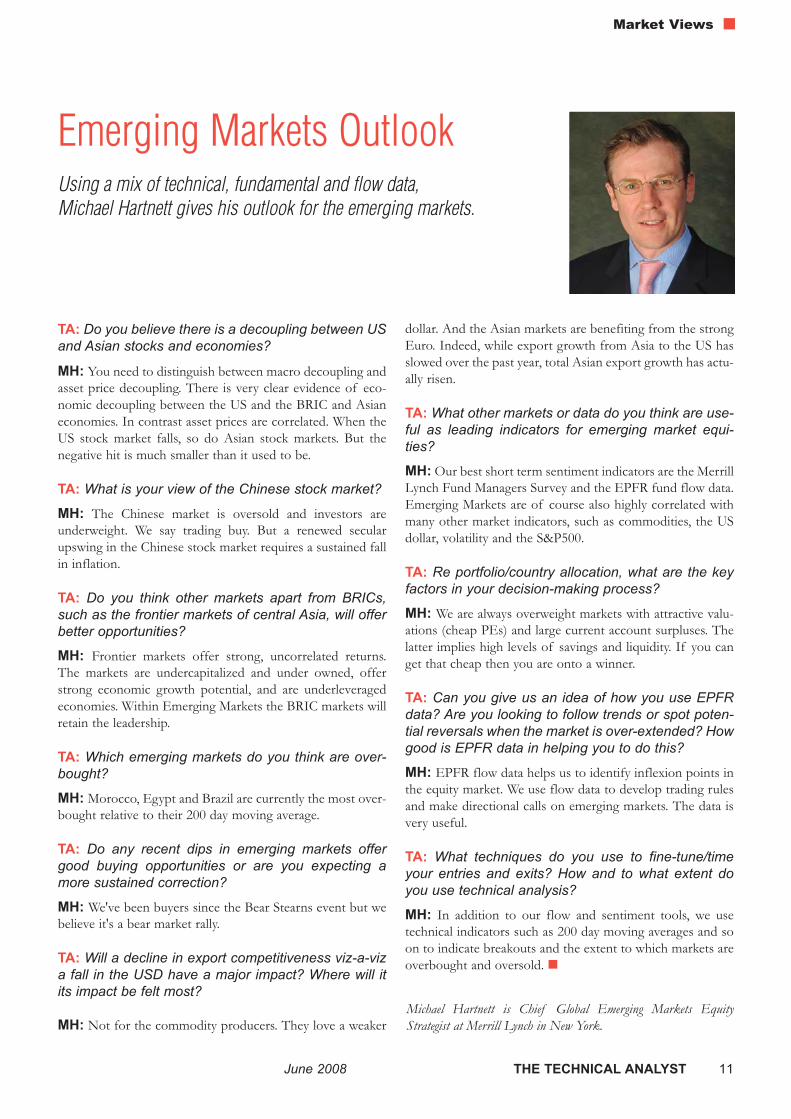
Emerging Markets OutlookUsing a mix of technical, fundamental and flow data, Michael Hartnett gives his outlook for the emerging markets.
Michael Hartnett is Chief Global Emerging Markets EquityStrategist at Merrill Lynch in New York.

12 THE TECHNICAL ANALYST June 2008
Market Views
Outlook forCrude Oil
On 23 April this year,Global Markets Mediaheld their first OilMarket seminar inLondon, covering allaspects of the oil mar-ket from explorationto changes in thedemand profile. Herewe summarise a few oftheir conclusions andask whether oil pricesare set to continue ontheir path upwards andfor how long. →

Do Current Oil PricesRepresent a Paradigm Shift?
Leo Drollas, Centre for Global Energy Studies
“We have probably seen the oil pricepeak for the time being, unless thereare further supply disruptions or thegeopolitical scene suddenly deterio-rates. Refinery margins are under somepressure from slowing oil demand andhigh crude prices amid worries aboutan impending recession. Oil prices arelikely to stay above $100/bbl until thethird quarter but will tend to weakenthereafter, requiring cuts by OPECearly next year. In the longer term, oildemand growth is likely to slow upconsiderably due to high oil prices andworries about the environment…OPEC will do its best to keep the oilprice above $60/bbl, but it will faceperiods of excess capacity that will testits cohesion and its resolution.”
Crude Towards $200:Fundamental and TechnicalDrivers
Lars Steffensen, Ebullio Capital Management
“The days of talking about demanddestruction are over. This myth hasbeen busted. On the supply side,OPEC won’t deliver and non-OPECcountries can’t, and there is no end insight. US and Europe are not growing,
but they are still driving their cars –accounting for 65 to 75% of globaldemand in the transport and petro-chemical sectors. Moreover, emergingeconomies don’t see the real price –OPEC, China, India, Indonesia andmany others subsidize domestic con-sumption and can’t stop for politicalreasons. OPEC now believe that highprices are needed to slow unrelentingdemand growth. Technically, there is afirm uptrend and dips are beingbought, which means any retracementis limited. One cannot be bearish untilsubsidies are removed, resourcenationalism goes away, project delaysend, new supplies come to market andsupply/demand transmission isrestored. The only thing guaranteed isvolatility.”
Oil as an Asset Class
Tim Guinness, Guinness Atkinson
“In the long-term, the demand fromemerging economies provides a nearirresistible force which means we areunlikely to see a real curbing ofdemand without a $150-200 spike.OPEC will seek to manage averageprice up by $5/10 barrel per year. Withregards to the equity markets, energyequities will return 50 – 150% overnext 5 years in a scenario which com-bines higher earnings from higher oil,gas & coal prices (even after highergovernment take) and multiple expan-sion. In the shorter-term, the oil priceis likely to correct to around $80 as oilinventories are about right. Above all,investment valuations remain attractivefor energy equities. The market is valu-ing stocks at $55-65 oil, well belowanalysts’ forecasts of $70-80 and theactual $102.5 year strip.”
The Changing Profile ofDemand
Eduardo Lopez, International Energy Agency
“High prices, coupled with worseningeconomic prospects and milder winterconditions are certainly affectingOECD demand. Yet, in non-OECDcountries, demand has actually turnedout to be much higher than expected.By 2012 non-OECD growth will beabout three times higher than theOECD’s. In general, when a manufac-turing sector emerges, income per capi-ta rises significantly and oil demandtakes off (as cars, flights, air condition-ing etc become part of everyday life).Empirically, the pace of demandgrowth becomes very brisk between$3000 and US$9,000 per capita. It’snotable that several non-OECDeconomies are in or about to reachthat stage.
“Our forecast is that transportationfuels will account for the bulk of oildemand and oil demand growth willcome from non-OECD countries.Within the OECD, demand is sus-tained by North America which willrepresent 53% of the total by 2012.With regard to non-OECD countries,Asian demand will account for 47%and the Middle East for 19% of thetotal. Biofuels are gaining much atten-tion and are seen as an alternative forexpensive and polluting oil-basedtransportation fuels. However, despitespeculator growth in a few countries –such as Brazil – biofuels are likely toaccount for less than 2% of globalproduct demand by 2012.”
June 2008 THE TECHNICAL ANALYST 13
→
Market Views

Oil Prices: Are capacity con-straints to blame?
Margaret Chadwick, Oxford Petroleum Research
“There are four key reasons to explainwhy oil prices are so high: Upstreamsupply rationing from OPEC, particu-larly in 2006-2007; strong demand fortransport fuels combined with a fully-utilised refinery upgrading capacity (inrelation to upgrading heating fuel totransport fuel); A Q1 surge in middledistillate demand caused by a cold snap(with reference to the 14 large oil-con-suming countries); and downstreamrefinery bottlenecks. As such, in2007/2008, Europe’s deficit soared andChina became a large importer. Tomake matters worse, non-OPEC pro-duction has also been below expecta-tions.”
We also summarise below a few of thekey points in relation to conventionaland non-conventional oil reserves:
Geological Uncertainty andRisk: Implications forHydrocarbon ResourceAssessment
Jonathan Redfern, University of Manchester
“The calculation and estimation ofreserves is complex and open to errorand interpretation. Generally for anydiscovered prospect or field, three
cases are calculated depending onincreasing geologic certainty: Possible(P3 – 10% probability); Probable (P2 –50% probability); and Proven (P1 –90% probability). It’s often not clearwhen numbers are quoted whetherthey are talking about STOIP(Standard Oil in Place, which includesthe sub-economic resources) orReserves/Resources (P1 to P3). Oftenhigh hopes are not rewarded, as in thecase of Kenya and Mautania.
“With regard to the calculation ofglobal resources, by using trends with-in mature basins it’s possible to esti-mate the ultimate recoverable reservesexpected (URR). It’s a typical trend fora basin to follow a fractal pattern, i.e.to have a few very large fields at firstand many more smaller fields towardsthe end of its life that produce fromsmaller complex structures and strati-graphic traps
“Convention oil and gas is definedas hydrocarbons that “flow freely”, arein accessible locations and do notrequire complex and expensive tech-nology to produce. Non conventionaloil and gas is everything else, includingdeepwater oil and gas (although thishas started to be considered conven-tional in the last 5 to 10 years), heavyoil, oil shale/sands, polar oil and gas,coal bed methane, tight oil and gasfields, biogenic gas, gas hydrates andsynthetic oil from gas. According toBP, total proved oil reserves (P1) equal1,208 thousand million barrels, enoughfor 40 years demand at current con-sumption of 84 million barrels a day.The Middle East accounts for 61.5%of total proved reserves. According tothe US National Petroleum Counsel(NPC), the mean estimate of remain-ing oil reserves (including mean esti-mates for new discoveries and growthof existing reserves, but not includingnon conventional oil) is 2,628 thou-sand million barrels, enough for 86years at current consumption levels. Asregards global in-place oil resources, astudy in 1998 estimated a most likelycase of 14,960 thousand million bar-rels, including conventional and somenon-conventional resources butexcluding oil sands/shales. The ques-
tion is now how much of this can berecovered?
“There are 350 ‘giant fields’ in theworld which hold 50-60% of currentworld oil reserves, each containingmore than 500 million barrels inreserves. The largest of which isGhawar in Saudi Arabia, discovered in1938, which has 489 thousand millionbarrels in place and 100 thousand mil-lion recoverable. With a reserve size of100 million barrels considered verygood in many basins, to replace justone Ghawar means we need to find1100 new fields. So where is theremaining big potential?
“There are several areas which offerpotentially big fields. These are theCanadian Oil Sands; Deepwater Gulfof Mexico; Deepwater West Africaand Brazil; Baltic/Russian Arctic; aswell as new exploration and produc-tion from the Middle East. The UnitedStates government recently declaredAlberta’s oil sands to be ‘proven oilreserves’. Consequently, the USupgraded its global oil estimates forCanada from five billion to 175 billionbarrels. Only Saudi Arabia has moreoil. The Tupi deepwater field in Brazilis the biggest discovery since 2000 andthe largest ever in deep waters.Petrogras believes Tupi may be Brazil’sfirst of several new “elephants”, fieldsof more than 1 billion barrels. InitiallyTupi will produce about 100,000 bar-rels a day but may ramp up to as muchas 1 million before 2020. “It’s mon-strous,” says Matthew Shaw, a LatinAmerican energy analyst at consultantWood Mackenzie.
“An NPC Global Oil & Gas Studyconcluded that global endowment is nota limiting factor in future supply in thenear term. Constraints will come fromother sources – technology, access,deliverability, economics, geopolitics etc.Small changes in recovery efficiency(percentage of oil in place that will ulti-mately be produced) will have a globallystrategic impact upon the oil budget,and the role of unconventionalresources will have a growing and pro-found impact as non conventional oil &gas becomes conventional.”
Market Views
14 THE TECHNICAL ANALYST June 2008


Techniques
16 THE TECHNICAL ANALYST June 2008

Ilike to think about volume as themost powerful indicator I have onmy trading screen. Volume is driv-
ing price, not the other way around. Sowho is actually moving the market? Thebig volume traders such as the largebanks, hedge funds and market makers,the so called smart money or profes-sionals. They have much more informa-tion than most other traders, withaccess to order books where they cansee stops, size of orders and who isselling and buying.
These institutions trade large tickettrades or a series of trades to engage inthe market and they have to pay moreattention to slippage and executionthan smaller players do. They get in andout of the market in the most cost effi-cient way by buying into down movesand selling into up moves. This oftengives them a better average entry pricesince they are trading against the shortterm momentum so they find it easierto scale in large trades without gettingtoo much slippage.
Trading tricksThese large institutional traders willalso use various techniques to “trick”other traders such as hunting for stopsand spiking the market up to makeother traders take bad long positionswhile they build up shorts to slam themarket down. News events are often agood time to play tricks and manipulatethe market and many times the market
will react unexpectedly when the actualdata is released. Keeping this in mind itis now easy to see why volume is animportant indicator. It gives an indica-tion of what price levels the largetraders get engaged at and how muchinterest they have in higher or lowerprices.
Since the large traders are the onesdriving the market it can be an advan-tage to try and follow their lead. Butvolume by itself is not really giving youmuch to go by so you need to be ableto read the price chart in relation tovolume to really understand what isgoing on. To be really effective one hasto pay attention to what the market hasbeen doing recently to put it all intoperspective.
High volume candlesYou will see plenty of signals by exam-ining the volume in relation to the priceaction. Are the professionals showingan interest in the up or down move orare they aware of something that isabout to change so they are backingaway or even turning around their posi-tions? One of the first things I look foron a chart in order to see where theprofessionals are showing interest isextremely high volume candles. This isimportant because the only way to getan extreme high volume day is if thereare both sellers and buyers heavilyinvolved in the market. This tends tohappen at market tops and bottoms.
The next thing is to look at what hap-pened on those specific days. The key isto try and figure out if the profession-als are accumulating or distributing andthen try to play along with them. Acommon misperception is that peoplethink weakness shows on down barsand strength on up bars. Weakness willalways show first in an up bar andstrength will always show itself first ona down bar. This is of course due to thefact that at certain levels professionalswill turn their positions around or shownew interest. This will eventually leadto a change in trend.
Reversals on extremely highvolumeA good example is the recent reversalin the S&P 500 E-mini futures on the17th of March (Figure 1). This was aclassic reversal formation and the chartactually gave several signals that a lowwas in the making. On 16th March thevolume was extremely high trading 3.87million contracts, 64% more than the20 day average at that time. The nextday it traded slightly less with 3.69 mil-lion contracts but still way above the 20day average of 2.46 million. The signif-icant clue was that the close on boththose days was some way off the lows.The only way this can happen is if pro-fessionals are buying into the sellingand therefore creating extreme volumeand forcing the market off the lows.
High volume up bars closing off
- the voice of the marketBy Per-Erik Karlsson
→
volume
June 2008 THE TECHNICAL ANALYST 17
Techniques

the highs represents selling. The nextbig clue was the following day, the 18thMarch, when the market rallied 52.50points to close right at the high, trading3.12 million contracts. For that to hap-pen the professionals had to be buyersthe previous few days removing mostsupply so the market could rise. Indeedthat is what happened as well with theS&P rising 174 points in 34 days.
Lack of interestAnother thing I like to look for is what
I call “lack of interest”. If professionalsthink prices are too high they will nolonger be interested in buying andtherefore volume could drop quite a loton up bars. I also want the bar to beshort because that further underlinesthe lack of buying power. Figure 2shows Dax futures where there are sev-eral signs of a lack of interest from pro-fessionals on the recent down trendfrom October 2007 to the low on the17th March 2008.
First you will notice several weakness
signs at the highs of October 2007showing high volume up bars closingoff the highs. This suggests the profes-sionals were lining up for a down moveselling into those highs. Then as itdrops lower at the beginning ofNovember you get the first confirma-tion that the market is weak because on6th November the first “lack of inter-est” bar appears. Notice how short thebar is and also the accompanying lowvolume which is lower than the recentbars and well below the 20 day averagevolume. Then another one on 14thJanuary and the market droppedsharply the next 7 trading sessions. On2nd April the last “lack of interest” barappears and the market drops another348 points in 3 days from that day’sclose to the low 3 days later.
The market will often react quitequickly to these “lacks of interest” barsand if you look at the Dax chart youwill see that the market moved lower onall three occasions following “lack ofinterest” during that down move fromOctober 07 to March 08. Failure by themarket to respond within a few bars isa warning signal that something is notright and the market might swing theopposite way.
Figure 1. S&P 500 Daily Continous Contract June 08
Figure 2. Dax continous futures contract June 08
18 THE TECHNICAL ANALYST June 2008
Techniques
Volume rising into low Huge volume
Low volume vs. recent bars
Reversal - Closing off the highs on extreme volumesignals buying
More buying by professionals the following day, high volume up bar closing right at the high, very wide bar.
More strength, ‘lack of interest’ byprofessionals to sell the market
Volume lower than resent bars
Again no interest to participare in the
up moveVolume is lower than resent bars
This reversal corresponds with theS&P reversal on the above chart
Lack ofinterest More selling, up bar closing off the high, high volume
Lack of interest on up bar
Weakness in the backgroundLack of interest on up bar
More selling
Selling, high volume up bars closing off the highs
Per-Erik Karlsson is head of tradingoperations at Advantage Financialin Switzerland.

The PredictivePower of WeeklyFund FlowsBy Bernd Meyer, Joelle Anamootoo and Ingo Schmitz
June 2008 THE TECHNICAL ANALYST 19
Techniques
As Keynes said, the stock market is comparable to abeauty contest whereby the person picking the mostpopular candidate wins a prize: “It is not a case of
choosing those [faces] which, to the best of one’s judgment,are really the prettiest… We have reached the third degreewhere we devote our intelligence to anticipating what averageopinion expects the average opinion to be.” As such, aninvestor is likely to gain by anticipating which assets, regionsor sectors will become the popular choices, which not neces-sarily reflect the best fundamentals. To the extent that thetrend in fund flows reflects investor action and behaviour,this is likely to shed more information on market expecta-tions regarding various asset classes as well as regions andsectors.
In August 2006, we (the Equity Strategy research team atDeutche Bank) looked at fund flow data in general and theEmerging Portfolio Fund Research (EPFR) data in particular(see Box 2), and analysed the predictive power of weeklyfund flow data, both for the direction of the equity marketand for the relative performance of regions. The key findingsfrom this research can be found in Box 1. The top line find-ing is that there is stronger evidence for predictive power
regarding the relative performance of regions than for themarket overall, but that there was no strong evidence thatflows lead performance in the following weeks. Simplestrategies that go long or short the asset based on the previ-ous week’s direction of flows do not generally work.Focusing on the changes in the direction of the flow ratherthan the direction of the flows does not improve the predic-tive power for the market direction either.
However, including the ‘Liquidity Pulse’ - a measure of ris-ing or contracting liquidity momentum – helps predict mar-ket direction. Extremely strong/weak readings of theLiquidity Pulse should be seen as a negative/positive signal.As such, we were able to develop profitable trading rules forthe market based on the combination of the direction of theweekly fund flows, the direction of the average 4-week flowand the Liquidity Pulse.
We also found that the relative strength of fund flows fordifferent regions contains explanatory power for subsequentrelative performance of the regions. Excluding transactioncosts, we find information ratios larger than 1. In our view,this suggests that the relative strength of fund flows doesadd value to models of regional equity allocation. →
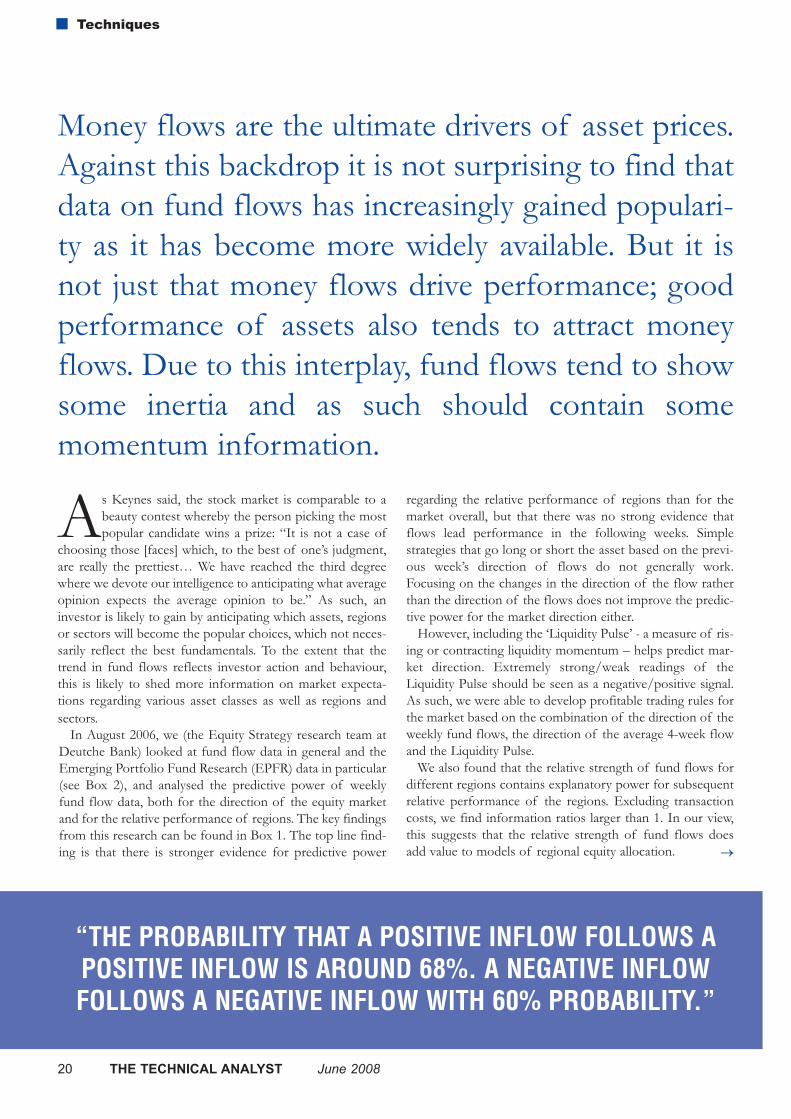
Money flows are the ultimate drivers of asset prices.Against this backdrop it is not surprising to find thatdata on fund flows has increasingly gained populari-ty as it has become more widely available. But it isnot just that money flows drive performance; goodperformance of assets also tends to attract moneyflows. Due to this interplay, fund flows tend to showsome inertia and as such should contain somemomentum information.
“THE PROBABILITY THAT A POSITIVE INFLOW FOLLOWS A POSITIVE INFLOW IS AROUND 68%. A NEGATIVE INFLOW FOLLOWS A NEGATIVE INFLOW WITH 60% PROBABILITY.”
20 THE TECHNICAL ANALYST June 2008
Techniques

Box 1: Key findings about the predictive power of weekly fund flows
� We find no evidence of seasonal patterns in weekly fund flow, such as the rush in January, the sell off in the summer andtax loss selling. In our view fund flow data therefore do not require seasonal adjustment.
� Weekly fund flows show inertia as flows drive performance and performance leads flows. The average first-order autocor-relation coefficient is 0.27, with emerging market equity flows showing autocorrelation up to 0.54. The probability that apositive inflow follows a positive inflow is around 68%. A negative inflow follows a negative inflow with 60% probability.
� We observe a high (0.28) average contemporaneous correlation between weekly fund flows and equity market perform-ance (as measured by the respective MSCI indices). We also find a strong positive correlation between performance andlagged fund flows, providing clear evidence that performance leads flows. We do not find strong evidence that fund flowslead performance in the following weeks.
� In the bear market until March 2003 as well as in sideways markets the direction of fund flows in one week (or in 4weeks on average) carries predictive power for subsequent performance. In a rising market the direction of fund flowsdoes not seem helpful and actually gives wrong signals on average. Hence, simple strategies that go long or short basedon the previous week’s direction of flows do not generally work.
� Focusing on the changes in the direction of the flow rather than the direction of the flows does not improve theexplanatory power for the market direction.
� Including the Liquidity Pulse, a measure of rising or contracting liquidity momentum, proves helpful for predicting themarket direction. We were able to develop trading rules for the market based on the direction of the weekly fund flows,the direction of the average 4-week flow and the Liquidity Pulse that have worked for the regions for which we have thelongest history. Generally these strategies suggest to remain invested in the market unless all measures send a negative sig-nal. Extremely strong/weak readings of the Liquidity Pulse should be seen as negative/positive signal. The May 2006 cor-rection though was not predicted by these strategies.
� Our cross-sectional analysis shows that the relative strength of fund flows for different regions contains explanatorypower for subsequent relative performance of the regions. Excluding transaction costs we find information ratios largerthan 1. Even if results after transaction costs are unlikely to be that positive, this suggests in our view that the relativestrength of fund flows does add value to models of regional equity allocation.
� Finally a word of warning. One needs to be careful with any major conclusions as the earliest data available is fromJanuary 2000. All data available for developed markets lies in the positive part of the current market cycle. In this marketcycle cheap money was available globally due to low interest rates in Japan, Europe and the US, which lead to a strongappreciation in value of all asset classes. The data could be misleading and not reflect the true long-term fund flow pic-ture. As no other data is available we can neither prove our findings to be right nor wrong. We believe however the datacan among other things be used to confirm economic or equity performance trends.
* Based on Deutsche Bank report “Predictive power of weekly fund flows”, 10 August 2006.
June 2008 THE TECHNICAL ANALYST 21
Techniques

Liquidity Pulse – a measure of liquidity momentum
Our results suggested that neither the direction of flows inone week (or its 4-week average) nor the change in the direc-tion of flows, on their own, are sufficient to predict nextweek’s equity market performance. We therefore had to testmeasures that go beyond simply looking at the direction ofthe flows. Liquidity momentum, i.e. a measure of rising orcontracting liquidity might prove helpful. Flows might still bepositive (negative) but the size of the inflows (outflows)might already ease, indicating a declining (rising) investorconviction. To measure liquidity momentum we introducedthe liquidity pulse.
Calculation of the Liquidity PulseThe liquidity pulse compares the size of the current flow
(4-week average as % of NAV) with the average size of theflow in the last 13 weeks. The relative size is given in stan-dard deviation from the mean. As a momentum indicator itgauges investor’s confidence in certain regions and the move-ment of momentum in those regions. A high liquidity pulseindicates a liquidity momentum expansion as the asset classin question is experiencing net inflow for many consecutiveweeks. This is an indication of above-average investor confi-dence in a certain region and generally indicates a strong per-formance for equity markets in the respective region. A liq-uidity pulse which is steadily increasing indicates an increasein the amount of fund inflows into the region, and viceversa.
We illustrate the output such that the light blue data pointsare closely around the mean and show moderate changes inmomentum. The dark blue data points are more than onestandard deviation away from the mean and indicate periodsof strongly expanding or contracting liquidity momentum.
The charts in Figures 1 and 2 illustrate the DevelopedEquity Market Pulse (based on the fund flows for WesternEurope, the US and Japan) and the Risky Fund FlowsLiquidity Pulse (based on fund flows for Latin-American
equity funds, Asia-Ex Japan equity funds, EMEA equityfunds, emerging market bond funds and high yield bondfunds). Compared to the Emerging Markets Liquidity Pulse,the Risky Fund Flows Liquidity Pulse captures the addition-al effect of the emerging bond and high yield bond markets.Therefore the Risky Fund Flows Liquidity Pulse shows amore complete picture of risky fund flows than the emerg-ing markets equity liquidity pulse, and we believe that it is amore valuable measure of investor’s willingness to invest inrisky assets, i.e. risk appetite.
Liquidity Pulse and equity market performance When comparing the liquidity pulse data with equity perform-ance, we observe common trends. Figure 3 shows the US liq-uidity pulse versus the US MSCI equity index performancefrom April 2004 to July 2006. The trends of the liquidity pulseand equity performance are similar during periods of consis-tent liquidity momentum expansion and contraction. Thismakes the fund flows a reasonable momentum indicator.However, what we also observe is that if liquidity momentumis signaled to be very strong (or very weak) the subsequentperformance tends to be negative (or positive). This suggeststhat the liquidity pulse becomes a contra indicator whenmomentum has become too strong in either direction. Wefind comparable results for the other regions.
-3
-2
-1
0
1
2
3
Apr
-04
Jun-
0 4
Aug-
0 4
Oct
-04
Dec-
04
Feb-
05
Apr
-05
Jun-
0 5
Aug-
0 5
Oct
-05
Dec-
05
Feb-
06
Apr
- 06
Jun-
0 6
Liquidity M o mentum Expanding
Liquidity M o mentum Co ntracting
Source: Deutsche Bank Equity Strategy / EPFR
Figure 1. Developed Market Equity Liquidity Pulse
-3
-2
-1
0
1
2
3
Apr-0
4
Jun-
04
Aug-
04
Oct
-04
Dec-
04
Feb-
0 5
Apr-0
5
Jun-
05
Aug-
05
Oct
- 05
Dec-
05
Feb-
0 6
Apr-0
6
Jun-
06
Liquidity M o mentum Expanding
Liquidity M o mentum Co ntracting
Source: Deutsche Bank Equity Strategy / EPFR
Figure 2. Risky Fund Flows Liquidity Pulse
-3
-2
-1
0
1
2
3
Apr
-04
May
-04
Jun-
04
Jul-0
4
Au
g-04
Sep-
04
Oct
-04
No
v-04
Dec
-04
Jan-
05
Feb-
05
Mar
-05
Apr
-05
May
-05
Jun-
05
Jul-0
5
Au
g-05
Sep-
05
Oc t
-05
No
v-05
Dec
-05
Jan-
06
Feb-
06
Mar
-06
Apr
-06
May
-06
Jun-
06
-5%
-4%
-3%
-2%
-1%
0%
1%
2%
3%
4%
US L iquidity P ulse (l.h.s.) Wee kly US MSCI Per formance (r .h.s .)
Source: Deutsche Bank Equity Strategy / EPFR, Factset
Figure 3. US Liquidity Pulse vs. weekly US MSCI Indexperformance
→
22 THE TECHNICAL ANALYST June 2008
Techniques

� Large universe. EPFR tracks a total of 8817 funds with adifferent geographical focus and across different assetclasses. 7725 of these funds are equity funds (as ofAugust 2006)
� Most of the funds under coverage are long only funds,and only a minority of the included hedge funds has shortpositions, but these are insignificant relative to totalinvestment value.
� All the funds included are pure plays – equity funds investonly in equities, and bond funds invest only in debt secu-rities, and not a mixture of both.
� The funds are not generally exchange traded. Data on theproportion of ETFs to non-exchange traded funds is lim-ited, but according to EPFR it is negligible.
� Investors are a mix of retail and institutional investors.EPFR estimates that 70% of them are institutional, thebiggest ones being pension funds and insurance compa-nies. Institutional investors account for most of thoseinvesting in emerging market funds, but we see a higherparticipation of retail investors for Western Europe andUS equity funds.
� EPFR tracks mutual funds on a global basis compared tosome other providers of flow data, and presents the flowof funds into geographical asset classes irrespective ofdomicile. For instance, the flows into Western Europeequity funds represent the amount deposited or with-drawn in funds investing in Western European equitiesirrespective of where the funds are located. We believethat this data is therefore more representative comparedto other data available which tend to only cover fundslocated in the US.
Calculation of flowsOn a weekly basis we obtain the raw data from EPFR, whoin turn obtain it each Wednesday from the respective fundmanagers. EPFR releases the data on Thursday night, hencethe Weekly fund flows note we publish each Friday containsvery timely information.
The calculation of the weekly net flow is as follows:
� Assets BoW = Total fund assets beginning of week(as of prior Wednesday's market close)
� Assets EoW = Total fund assets end of week(as of current Wednesday's market close)
� Weekly Portfolio Change = (Assets BoW) x (Weekly per-formance of fund)*
� Weekly net flow in local currency = Assets EoW – AssetsBoW – Weekly Portfolio Change
� Weekly net flow in $ = Weekly net flow in local currencyx Average weekly forex
� Weekly flow as % of NAV = Weekly net flows in dol-lars/Assets BoW in dollars using beginning of the weekexchange rate
The flow data table which features in our Weekly fund flowsnote contains information on weekly flows, the 4-week aver-age flow as well as the year-to-date net flow for all funds inour universe. The 4-week moving average of the flowssmoothes the data as the weekly flows can at times be quitevolatile. Flow information is provided in absolute dollarsand as a percentage of total assets. The latter improves thecomparability of the flows across regions.
Focus on fund flow as a proportion of total assetsWe recommend analysing fund flow data as a % of totalassets, rather than in dollar terms, because it provides a bet-ter comparison between regions:
� First, funds investing in emerging markets, for instance,tend to be smaller than those investing in developed mar-kets such that weekly flows in dollar terms do not accu-rately reflect the flow momentum across regions.
� Second, the size of net flows (in dollars) tends to changewith the development/index performance of the marketswhich they track.
� Third, EPFR has widened its coverage of fund flows overtime. For a better historical comparison, it is thereforenecessary to look at fund flows as a percentage of thecovered assets rather than in absolute terms.
� Fourth, it is worth noting that the flows are provided indollar terms and are therefore dependant on foreignexchange movements. As the dollar strengthens or weak-ens relative to the funds’ respective local currencies, wecould see some fluctuations in the overall funds which arenot the result of equity investor behaviour.
*change in NAV per share including any dividend distributions
Box 2: A brief guide to fund flow data
We use Emerging Portfolio Fund Research (EPFR) fund flow data for several reasons:
June 2008 THE TECHNICAL ANALYST 23
Techniques


Trading strategies including the Liquidity Pulse We now test trading strategies for individual regions based onthe direction of the 1-week flow in combination with thedirection of the average 4-week flow and the liquidity pulse.The general idea is to stay invested in the market unless allthree indicators send a negative signal.
Strategy with strong/weak liquidity pulse as a contra indicator The first strategy uses the liquidity pulse at the top and thebottom of the range as a contrarian indicator. This assumesfor example that if the momentum falls too much, it will hita lower boundary and rebound into positive territory, alongwith equity performance. The same principle applies to veryhigh momentum. If the liquidity pulse lies above 1, it is takenas a contrarian indicator and is a negative signal, if it liesbetween 1 and 0 it is a positive signal, if it lies between 0 and-1 it is a negative signal and if it is below -1 it is again a con-trarian indicator and hence a positive signal. The data andperformance charts for our strategy for the emerging marketsare shown in Figure 4.
The strategy outperformed the market from February 2001to July 2006 by 72pp (study conducted August 2006) with aninformation ratio of roughly 70% both based on annualisedweekly returns as well as on returns by calendar year. Thestrategy rose by 154%, compared to 83% for the benchmark,if all excess returns are reinvested. Note that the strategy hasin particular outperformed during a bear or sideways market.Between 2001 and 2003 the trading strategy tended to out-perform especially when the MSCI Index dropped, as itpicked up the signals and went short. It has non-negativeexcess returns in 97.5% of the weeks, mostly because it stayslong most of the time. The problem however is that it hasnot given many signals to trade since then and as a result didnot pick up the market correction in May 2006. The flow datasignals were not clear enough to be picked up by the tradingstrategy. This trading strategy therefore has not outper-formed the bull market since March 2003.
We increased the boundaries of the liquidity pulse to 1.5xstandard deviation in order for the contrarian indicators toreact at more extreme levels. This way the strategy increasedthe number of trades executed and for the emerging marketsincreased its performance to 184%. The information ratiothough did not improve.
We applied the same strategy to all other regions. With theLiquidity Pulse boundaries set to 1x standard deviation forthe Liquidity Pulse to become a contra indicator, a positiveexcess return is generated for the US, Japan and theEmerging Market with the information ratio ranging from0.3 to 0.7. The main problem with this strategy is that it hasnot worked well since 2003. While it seems to work well in abear market, it does not in a bull market. We believe the mainreason why the strategy does not work well for other regions,is because for most regions we only have data available forthe bull market. We cannot back test this strategy for the bearmarket period, and therefore cannot make any clear conclu-sions on its ability to outperform the bear market in anyregions other than the emerging markets.
Increasing the sensitivity of the strategy to the flow signalsdecreases its overall performance, as does the introduction ofadditional signals from flows into bond funds data or fromtaking the difference of weekly flows. We cannot draw anyclear conclusions from the results obtained.
Strategy with only weak liquidity pulse as a contra indicatorOur second strategy is similar to the one above but a liquidi-ty pulse above 0 is taken as a positive signal, if it is between0 and -1.5 it is taken as a negative signal and if it is below -1.5 it is taken as a contrarian indicator, and hence a positivesignal. Again we show the results for the emerging markets inFigure 5. This strategy also outperforms the market consider-ably, but has the same limitations as above.
Predictive power of fund flows for regional allocationAnother question we wanted to answer is whether the
50
100
150
200
250
300
350
400
Feb
-01
Ma
y-0 1
Au
g-01
Nov
-01
Feb
-02
Ma
y-0 2
Au
g-02
Nov
-02
Feb
-03
Ma
y-03
Au
g-03
Nov
- 03
Feb
-04
Ma
y-04
Au
g-04
Nov
- 04
Feb
-05
Ma
y-05
Au
g-05
Nov
-05
Feb
- 06
Ma
y-06
0. 90
1. 10
1. 30
1. 50
1. 70
1. 90
2. 10
B enchmark (MS CI Emer ging Mar kets Index) (l.h. s .)
Portfolio (Trading S trategy F or Eme rging Ma rkets) (l.h.s .)
Outperformance (r .h. s .)
Source: Deutsche Bank Equity Strategy / EPFR, Factset
Figure 4. Trading strategy vs. benchmark (liquidity pulse boundaries at 1x)
50
100
150
200
250
300
350
400
Feb
-01
Ma
y-01
Au
g-01
Nov
-01
Feb
-02
Ma
y-0 2
Au
g-0 2
Nov
-02
Feb
-03
Ma
y-03
Au
g-03
Nov
-03
Feb
-04
Ma
y-0 4
Au
g-04
Nov
-04
Feb
- 05
Ma
y-0 5
Au
g-05
Nov
-05
Feb
-06
Ma
y-0 6
0. 90
1. 10
1. 30
1. 50
1. 70
1. 90
2. 10
B enchmark (MS CI Emer ging Mar kets Index) (l.h. s .)
Portfolio (Trading S trategy F or Eme rging Ma rkets) (l.h.s .)
Outperformance (r .h. s .)
Source: Deutsche Bank Equity Strategy / EPFR, Factset
Figure 5. Trading strategy vs. benchmark (liquidity pulse boundaries at 1.5x)
→
June 2008 THE TECHNICAL ANALYST 25
Techniques

relative strength of flows for different regions contains anyexplanatory power for subsequent relative performance ofthe regions.
We look at the six main regions covered by the fund flowdata: Western Europe, the US, Latin-America, Asia ex Japan,Japan, and EMEA. The cross-sectional comparison of theflows is based on the 4-week average flow as % of NAV forthe six regions. Each week we normalise these 6 observationsby calculating the cross-sectional z-score. z-scores are cappedat 2 to reduce the noise in the data. It is ensured though, thatthe sum of the z-scores equals zero.
The benchmark is an equally weighted portfolio of the sixregions with weekly re-adjustment. The strategy takes activebets relative to the benchmark with the size and the directionof the active bet similar to the z-score of the flows times afixed multiplier. For example, if a region has a z-score of 1,we add one percentage point, times the multiplier, to the ini-tial weighting of 16.7% to that region. Therefore every weekwe readjust our positions in all 6 regions around their initialpositions of 16.7%, depending on their respective z-score
values. We use a multiplier 3, meaning that the absolute sizeof the maximal active bet equals 6pp.
Our strategy outperformed the market in 2003, 2004, 2005and marginally underperformed in 2006 (to 10 August 2006).57.5% of the weekly excess returns have been positive. Theaverage annualized excess at 0.94% compared to the bench-mark looks small, but with an even smaller tracking error of0.74% the information ratio is 1.28. Fund reallocations of151% of the portfolio size were needed annually, suggestingthat even including transaction costs an excess return can begenerated. The results suggest that the relative strength ofweekly fund flows can add value to models of regional equi-ty allocation.
Bernd Myer, Joelle Anamootoo and Ingo Schmitz areEquity Strategists at Deutsche Bank AG. This article isbased on their report “Predictive power of weekly fundflows” (2006). For information on EPFR data visitwww.epfr.com.
26 THE TECHNICAL ANALYST June 2008
Techniques

presents
A premier event for trading and investment professionals
Speakers include:
Automated Trading
200815 October 2008
Royal Society of Medicine
London W1
Backtesting andoptimisation
Web: www.technicalanalyst.co.uk
Telephone: +44 (0)1483 573150
Register Today!
Email: [email protected]
Topics include: Who should attend:
Delegate fee: £495 + VATRegister by 31 July for £100 early bird discount
+ Data integrity + Statistical analysis of test results + Correlation between asset classes+ Issues in data mining+ Monte Carlo techniques + Avoiding curve fitting
+ Traders + Fund managers + Hedge funds + Proprietary dealers + Quantitative analysts + Algorithmic trading managers
Automated Trading 2008 is a one day confer-ence for traders and investment managers involved in automated or systematic trading across all asset classes. Bringing together leading experts from the UK and US, this event will focus on backtesting and optimisation strategies for those looking to develop and build their own automated trading system.
David Aronson Baruch University
Gaurav Mangla Collage LLC
Daniel Jones Oxford University
Richard RamyarLipper
Woon WongCardiff Business School
Emmanuel Acar Directional Trading

The Arms Index, otherwise know as the TRIN (short forTrading Index), has traditionally been used as a short termindicator for US stocks that uses daily price and volume datato measure relative demand for rising and falling stocks. Byusing data from all 2250 or so stocks listed on the NYSE, theindex acts, in effect, as a volume weighted ratio of risingstocks versus falling stocks. This ratio can then be used as anindicator of how buying or selling pressure in the market ischanging.
Although the ARMS Index is calculated using data from allNYSE stocks, it can be refined to include just S&P or Dowstocks. However, Richard Arms warns that the effectivenessof the index is reduced when fewer stocks are used in its cal-culation. Moreover, despite its widespread use as a shortterm indicator, Arms insists that the TRIN can be used forlong term analysis and that many of his clients are tradition-al long term fund managers and not necessarily just shortterm intraday traders.
Arms today runs a consulting firm, ARMS Advisory, fromhis base in Albuquerque, New Mexico specialising in provid-ing TRIN based research to trading and investment houses.Richard spoke to the Technical Analyst for this feature andhis views on using and interpreting the TRIN are included.
The ARMS Index The ARMS Index is calculated using daily closing prices andvolume data from the New York Stock Exchange (NYSE).The formula is familiar enough:
Advances the number of NYSE listed stocks thatclose higher
Declines the number of NYSE listed stocks thatclose down
Advancing volume the volume of stocks closing higherDeclining volume the volume of stocks ending low
The TRIN calculation produces an index that centres around1.0, a value where the index is said to be neutral as advancingand declining volume is equally spread over rising and fallingissues. Because of the nature of the formula, the index pro-duced is counter-intuitive in nature in that if more volume isgoing into stocks that are rising in price, the index falls
The ARMS IndexWe take a look at the famous ARMS index and try to establish how best to use the indicator when trad-ing US stocks.
Figure 1.
ARMS Index =
Number ofadvancing stocks
Number ofdeclining stocks
Advancingvolume
Decliningvolume
÷
→
28 THE TECHNICAL ANALYST June 2008
Techniques

June 2008 THE TECHNICAL ANALYST 29
Techniques
30 THE TECHNICAL ANALYST June 2008
Techniques
below 1.0 and visa versa. So if the index is above 1.0 then itis said to be bearish for stocks and below 1.0 is bullish. Thisis because even if, for example, the number of rising stocksexceeds the number of declining stocks the index will rise ifthis occurs on low or declining volume.
Using the TRIN The index or line that this equation produces from daily datais often used smoothed using a moving average. Indeed,many references to using the TRIN are often made in termsof its moving average.
However, beyond that the index is open to a great deal ofinterpretation. Some users of TRIN tend to adopt their ownparameters as to which reading indicates a bullish or bearishsignal. Richard Arms himself recommends using the follow-ing moving averages for trading different time scales:
Short term: 4 day MA
Intermediate: 10 day MA
Medium term: 21 day MA
Long term: 55 day MA
(Note that 21 and 55 are both Fibonacci numbers).
Wall Street traders and investment managers have tradi-tionally used the 10 day moving average for TRIN. This is
probably because before the use of computers, it was an eas-ier figure to work with.
Despite the index being considered bullish when it is below1.0 and bearish when it is above 1.0, Richard Arms himselfconcedes that the index appears to be most effective whenused as an overbought/oversold indicator. However, there isno consensus on what constitutes overbought or oversoldconditions and furthermore, they depend on what movingaverage of the index is being used. John Murphy states thatthe TRIN can be used as a contrary indicator, especially inintraday trading. A very high figure (strongly bearish) is there-fore bullish as it indicates a turning point.
According to Katie Townshend chief market technician atMKM Partners, a proprietary trading and research firm basedin Greenwich, Connecticut, the real value of the TRIN lies inits application as a breadth indicator, as well as an over-bought/oversold oscillator. Furthermore, the TRIN shouldnot be used in isolation but only when other indicators con-firm it. “I publish the TRIN reading on a daily basis in anemail to clients but only heed it when it reaches extremes.Lately, a high extreme has been about >2.0 and a low extremehas been about <0.5.”
“When it reaches a high extreme, which usually happens onsharp down days, it can be considered an oversold readingthat suggests the next day or two will be more bullish.Conversely, when it reaches a low extreme, which usually isassociated with strong up days, it can be considered an over-bought reading that suggests the next day or two will be morebearish”, she says.
“WALL STREET TRADERS AND INVESTMENT MANAGERS HAVE TRADITIONALLY USED THE
10 DAY MOVING AVERAGE”
→

June 2008 THE TECHNICAL ANALYST 31
Techniques
Trading rulesRichard Arms recommended trading rules based on using theTRIN as an overbought/oversold oscillator are as follows:
Moving Average Overbought Oversold(sell) (buy)
Short term (4 to 10 day) <0.75 >1.25Medium term (21 day) <0.85 >1.10Long term (55 day) <0.90 >1.05
The TRIN suffers to some extent from a lack of consen-sus regarding not only which moving averages to use butwhat readings of the index indicate a buy and sell signal. Thisis a drawback because it suggests that the ideal parametersmay change as market conditions change so the optimal read-ings to use are likely to remain unknown at any particulartime.
In addition, there have been very few proper statisticalstudies on the TRIN which is surprising given how popularthe index is often said to be. What does appear to be agreedon is that using the index in its simplest form without a mov-ing average, (buy<1.0, sell>1.0) does not produce profitableresults.
Robert Colby, a US based analyst who has written aboutand backtested most (if not all) technical indicators* foundthat the ARMS index has little predictive power for readingsbetween 0.523 and 1.444. However, extreme readings beyondthese were profitable with a one year holding period to a 99%confidence level. Although Colby also cites the TRIN’s valueis being used as an overbought/oversold indicator, he alsosays that extreme readings of the index in either direction(above 1.444 and below 0.523) give a bullish reading.Backtesting showed this result had a 99% confidence levelfor a 1-year holding period although the number of signalsthis strategy has generated since 2000 has gone up consider-ably, which calls into question whether it is still valid. Thelow readings of the index are bullish because this usuallyindicates a (oversold) reversal after the end of a decline orbear market.
The problem with these findings is that TRIN is usuallythought of as a short term indicator and used as such whichmakes a one year holding period unrealistic. Colby states thatthe 10 day simple moving average above 1.266 is very bullishfor a one year holding period to a 99% confidence level.From this Colby proposes a “greater than 1.266 rule”. Itshould be noted that these results are based on data before2000.
Based on backtesting 16 years of data, for short term trad-ing Colby recommends the following rule:
Buy: 11 day exponential moving average (EMA) > 0.8
Sell: 11 day EMA < 0.8
This strategy according to Colby would have returned1640% for the S&P500 (with reinvested profits and no costs)during the test period from 1984 to 2000, more than 80%more than a buy and hold strategy (900% return).
Colby also cites the significance of a single day’s reading of2.65 for the index. If the S&P500 had been bought on theclose of every day when the index was 2.65 or above over inthe 35 years before 2000, it would have yielded a profit 11 outof the 12 instances it happened when held for one year.
Holding period Although Colby sites a one year holding period in all his test-ing of TRIN and doesn’t vary this, Kirkpatrick andDahlquist** insist that the holding period is crucial to theprofitability of the indicator. For example, with the >2.65rule, although the signal only occurs every couple of years, ifthe holding period is reduced from one year to two monthsor less, the returns are some 100 times greater than a buy andhold strategy. Kirkpatrick suggest the difficulty in establishingthese rules for the TRIN comes in applying short term indi-cators to long (one year) holding periods.
Other signalsAccording to other literature there are other signals that theTRIN can generate. As Richard Arms explains, “Apart fromthe well known use of the index moving averages, I haveworked a great deal with moving average crossovers. Thebest, I think, is the 21-day to 55-day. The 55 becomes thebaseline and the 21 indicates the extremes. Another simplestrategy is two consecutive days of the index over 2.0 whichhas a very good record of calling important bottoms.”
Richard ARMS’ new book, “Stop and Make Money: How to Profitin the Stock Market Using Volume and Stop Orders” has recentlybeen published by Wiley.
*The Encyclopaedia of Technical Market Indicators(McGraw Hill) by Robert Colby **Technical Analysis (FT Press) by Charles Kirkpatrick andJulie Dahlquist
“THE INDEX ACTS AS AVOLUME WEIGHTED
RATIO OF RISING AND
FALLING STOCKS”

Double Top and Double Bottom pat-terns are part of classic technical analy-sis. Double Top/Bottom patterns arevery common and form in all time-frames and in all instruments. Thesepatterns form when prices fail to makenew highs/new lows at significant pre-vious levels. Double Top and Bottompatterns are relatively reliable and easyto trade. When Double Bottoms/Topsfail, they may be signaling potentialTriple Top or Triple Bottoms patterns.Double Top/Bottom patterns have sev-eral variants and these variations involvedifferent trading rules and different pat-tern recognition methods.
Formation of Double Top/Bottom patternsIn active markets, Double Top/Bottompatterns are found as the market worksup rapidly in a peak or trough accompa-
nied by high volume in the first stage.Without any warning signs the marketreverses and retraces to a key supportlevel/resistance and stagnates for fewbars before rising/falling to the previ-ous peak/trough with lesser volume inthe second stage. These two sharpmoves create the Double Top/Bottompatterns and signal a potential reversalof prior trends. In most Double Top orDouble Bottom patterns the two swingpeaks or troughs need not be equal andthe first or second peak or trough canbe higher/lower.
The preceding movement prior to theDouble Top/Bottom pattern forma-tion signals whether the pattern is acontinuation or reversal pattern. If thepreceding movement is a long contin-ued up/down trend prior to the firstpeak/trough, the pattern may be signal-ing a reversal while if the preceding
movement is a short trend, it may besignaling a continuation pattern.Markets making new highs/lows (atleast 40-bar) in the first peak/troughmay signal reversal patterns.
The “size” of the pattern or durationof the interval between the twopeaks/troughs measures the success ofthe pattern. A long duration betweenthe two peaks/troughs signals a highpossibility of reversal. The “size” ofthe retracement (at least 15% from thefirst swing) between the twopeaks/troughs also indicates the likeli-hood of pattern success. High volumeduring the first peak/trough and lightervolume in the second peak/trough fol-lowed again by higher volume duringthe breakout/breakdown signalsgreater probability of pattern success.
Double Top Trading RulesDouble Top patterns are recognized bythe two peaks with an intermediatereaction swing low. After completion ofthe second peak, prices trade below thereaction low to signal a potential trade.
Trading RulesTrade: A Double top pattern confirma-tion occurs at the breakdown level ofthe swing low at the neckline. Enter ashort trade below the previous swinglow at the neckline (see Figure 3).Target: The Double Top offers a
Chart patterns like Double Tops and Head-and-Shoulders essentially convey thesame signal – that of a trend reversal at the end of the pattern. Given the poten-tially important long-term Double Tops forming in the FTSE and S&P (seeFigures 1 and 2), we ask Suri Duddella to discuss the many variants of DoubleTops and Double Bottoms and to highlight some of their different trading rules.
Figure 1. Figure 2.
Trading Variations in DoubleTops and Double Bottoms By Suri Duddella
→
32 THE TECHNICAL ANALYST June 2008
Techniques

good risk/reward ratio. Measure thedistance between the top of the patternto the neckline for potential target rangefrom the trade entry (see Figure 4).
Stop: Double tops also fail and formtriple or multiple top patterns. Usuallythe failure occurs when prices reverseand trade at the middle of the Doubletop pattern range. Enter a stop order atthe middle of the pattern range to pro-tect the trade.
Double Bottom Trading RulesThe Double Bottom pattern is a mirrorimage of the Double Top. An extendeddown trend results in new lows fol-lowed by a moderate rally from the firstbottom. After a brief rally the pricesattempt to test the first bottom again.Failure to trade below the first-bottomresults in a second-bottom as pricesrally and reverse the prior trend. Theintermediate swing-high between thetwo bottoms is called the ‘reactionswing-high’. When price trades abovethis ‘reaction swing-high’, it signals apotential long trade.
Trading RulesTrade: A Double Bottom can only betraded after confirmation of the patternbreakout. Confirmation of the patternoccurs when prices close above theneckline. Enter a long trade above thehigh of the breakout bar from the neck-line (see Figure 5).Target: The Double Bottom pattern
also has a good risk/reward ratio. Thefirst target would be 100% of the swingrange of the pattern. The second targetwould be 127% to 162% of the depthof the “double bottom” pattern (seeFigure 6).
Stop: Double Bottom patterns do fail.This pattern failure occurs if the pricecloses below the middle of the patternfor multiple bars. Trading below thebottom of the pattern could signal atriple bottom. Place a stop order belowthe middle of the pattern to protect thetrade.
Variations of Double Top/Bottom patternsKnowledge of the variations and theirtrading rules dramatically increases the
chance of trading Double Tops andBottoms successfully. Most patternshave some variation of their basicstructure (simple or complex) with dif-ferent trading rules to their cousins inthe same group, but have the samerequirements as to volume action, pricemovement and timing. Some examplesof Double Top and Bottom variantsare: Dragon Patterns, Trader Vics’ 2BTop/2B Bottom, and Adam and Evepatterns, which I briefly review here.
Dragon Pattern (Figure 7)Dragon patterns usually form at marketbottoms. Dragon patterns work in alltime-frames and in all market instru-ments. Like most Double bottom pat-terns, Dragon patterns present excellenttrading opportunities with low risk toreward ratios. The Dragon pattern issimilar to the “W” pattern and theInverse Dragon pattern is similar to the“M” pattern, albeit with different trad-ing rules.
The Dragon pattern starts with a“Head” formation and price declinesfrom the head level to form two legs ofthe Dragon. These two legs in aDragon pattern usually form within 5%to 10% of the price difference. The sec-ond leg gives a strong indication ofimminent reversal when it posts a key
reversal bar or a divergence in any oscil-lator indicators. The price rise in thesecond leg is usually followed by a spikein the volume. A trend line is drawn
Figure 3. Figure 4.
Figure 5. Figure 6.
→
June 2008 THE TECHNICAL ANALYST 33
Techniques
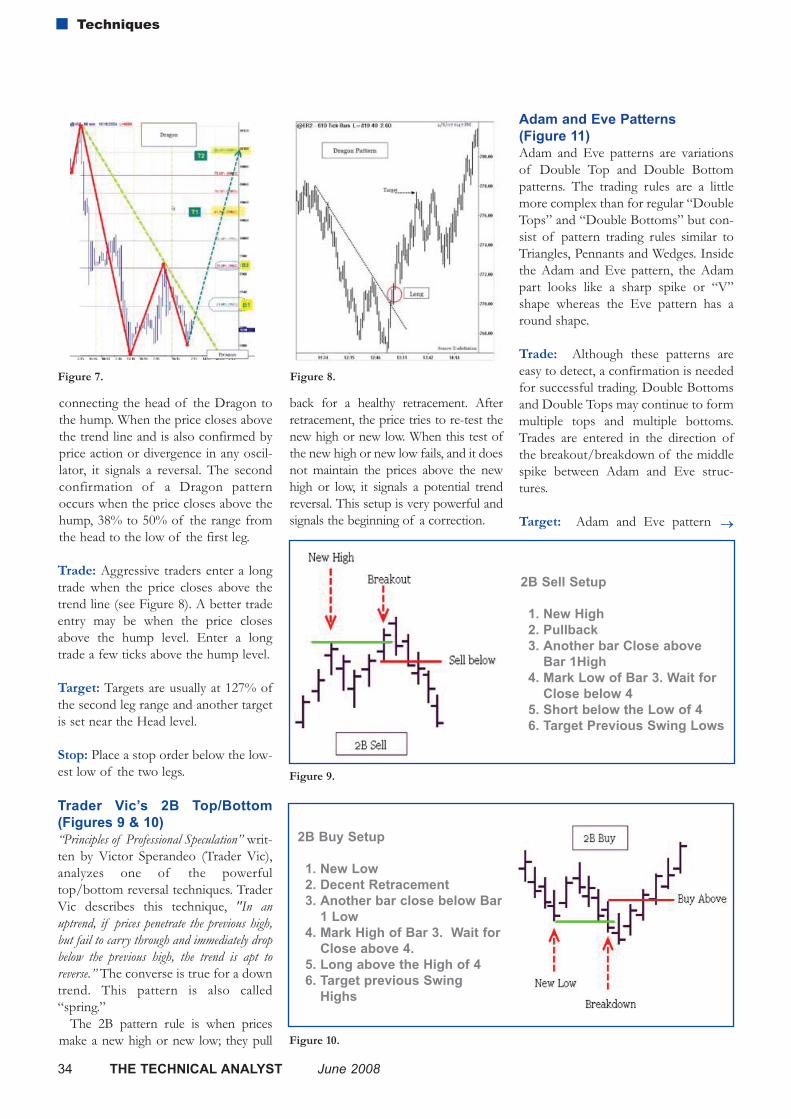
connecting the head of the Dragon tothe hump. When the price closes abovethe trend line and is also confirmed byprice action or divergence in any oscil-lator, it signals a reversal. The secondconfirmation of a Dragon patternoccurs when the price closes above thehump, 38% to 50% of the range fromthe head to the low of the first leg.
Trade: Aggressive traders enter a longtrade when the price closes above thetrend line (see Figure 8). A better tradeentry may be when the price closesabove the hump level. Enter a longtrade a few ticks above the hump level.
Target: Targets are usually at 127% ofthe second leg range and another targetis set near the Head level.
Stop: Place a stop order below the low-est low of the two legs.
Trader Vic’s 2B Top/Bottom(Figures 9 & 10)“Principles of Professional Speculation” writ-ten by Victor Sperandeo (Trader Vic),analyzes one of the powerfultop/bottom reversal techniques. TraderVic describes this technique, "In anuptrend, if prices penetrate the previous high,but fail to carry through and immediately dropbelow the previous high, the trend is apt toreverse.” The converse is true for a downtrend. This pattern is also called“spring.”
The 2B pattern rule is when pricesmake a new high or new low; they pull
back for a healthy retracement. Afterretracement, the price tries to re-test thenew high or new low. When this test ofthe new high or new low fails, and it doesnot maintain the prices above the newhigh or low, it signals a potential trendreversal. This setup is very powerful andsignals the beginning of a correction.
Adam and Eve Patterns (Figure 11)Adam and Eve patterns are variationsof Double Top and Double Bottompatterns. The trading rules are a littlemore complex than for regular “DoubleTops” and “Double Bottoms” but con-sist of pattern trading rules similar toTriangles, Pennants and Wedges. Insidethe Adam and Eve pattern, the Adampart looks like a sharp spike or “V”shape whereas the Eve pattern has around shape.
Trade: Although these patterns areeasy to detect, a confirmation is neededfor successful trading. Double Bottomsand Double Tops may continue to formmultiple tops and multiple bottoms.Trades are entered in the direction ofthe breakout/breakdown of the middlespike between Adam and Eve struc-tures.
Target: Adam and Eve pattern
Figure 7. Figure 8.
Figure 9.
2B Sell Setup
1. New High2. Pullback 3. Another bar Close above
Bar 1High4. Mark Low of Bar 3. Wait for
Close below 45. Short below the Low of 46. Target Previous Swing Lows
Figure 10.
2B Buy Setup
1. New Low2. Decent Retracement3. Another bar close below Bar
1 Low4. Mark High of Bar 3. Wait for
Close above 4.5. Long above the High of 46. Target previous Swing
Highs
→
34 THE TECHNICAL ANALYST June 2008
Techniques

formations are very profitable. The tar-gets can be set at the previous swinghigh/swing low of the first swing in theDouble Top or Double Bottom.”Subsequent targets would be set at thenext “higher swing high” or the next“lower swing low.”
Stop: Adam and Eve patterns also fail.Protect trades using the pattern high forshort trades and the pattern low forlong trades.
ConclusionMost chart patterns have natural varia-tions that require slightly different pat-tern detection methods and differenttrading rules. Knowing these variationsand their trading rules greatly improvesany traders’ success when recognizingthe development of a pattern.
Figure 11.
Suri Duddella is the author of “Trade Chart Patterns like the Pros.” Suri hasbeen trading Futures and Equities markets full-time for over 13 years.Contact [email protected] / www.suriNotes.com
June 2008 THE TECHNICAL ANALYST 35
Techniques

36 THE TECHNICAL ANALYST June 2008
Interview

INTE
RVIE
WInterview
June 2008 THE TECHNICAL ANALYST 37
Julian McCree is a trader atErste Bank in London with 15years experience in the interestrate, FX and commodity mar-kets. He talks to the TechnicalAnalyst about his trading styleand approach to risk manage-ment.
TA: How is the current turmoil in the markets affectingyour trading performance?
JM: I have had a good year. Any trader needs to have some-thing going on either in terms of volatility or strongly trend-ing markets. To be honest, it helps to have a “crisis” in somemarkets because to us this represents an opportunity to makemoney.
TA: You have spoken often on the oil market. Have youmanaged to exploit the recent rally?
JM: I have missed out on some of the very recent rally. Therise in oil prices fits the pattern of other commodity marketswith the oil being in an acceleration phase now and the finalstages of the current bull market. With volatility being sohigh it makes short and medium term trading difficult as therisks and rewards have become too balanced to justify takinga position. I think there are a number of people who didn’tforesee what is happening with oil prices now given the shortcovering the market is seeing.

Interview
38 THE TECHNICAL ANALYST June 2008
TA: What is the basic philosophy behind your tradingstrategies?
I prefer to trade with the trend. As regards the basic philoso-phy, I use the quote by William Eckhardt that appeared in hissection in Schwager’s “Market Wizards”. He said one of themost important facts about trading; that is, even if a tradergets a trade wrong but has good risk management, they’ll beok. This is because eventually they’ll hit a home run and makemoney. The crucial thing is not to miss the big moves. A trad-er can miss one or two but if he or she consistently missesthe big trends then they are finished as a trader.
TA: Generally speaking, how do you come to a decisionwhen to trade? To what extent is it based on technical orfundamental factors?
JM: My process, which is similar to that of Jake Bernstein, is:Set-up, Timing and Management. What I call the “set-up” isusually a combination of technical and fundamental indica-tors. Timing is then used to place a trade and finally, proba-bly the most important part of the trade, management interms of trade and money management.
TA: Which markets do you trade? Are you free to trademore or less any market you wish?
JM: I’m a global macro trader and as long as it has a futuresmarket, I can trade pretty much what I want to as long as I amactive in the most liquid markets. This includes FX, commodi-ties, interest rates and equity indices. I’m also beginning tolook at ETFs because of the sectoral diversity that they offer.
TA: Are there any particular markets that stand out asoffering good potential in the months ahead?
JM: Well, let’s look at the equity markets. They have enjoyeda good couple of months although they have started to turndown again recently. This may be a good buying opportunity.I attach a great deal of importance to sentiment in my trad-ing so it’s difficult to see how the stock markets can fall muchfurther from here when everybody I speak to is so negativeabout the market. This means they must either be flat or closeto it.
The stock markets that have the option of devaluing such asthe sterling and dollar markets are going to outperform thosethat don’t. Consequently, I can see the FTSE and US equitymarkets outperforming the DAX.
TA: You have discussed the Commitment of Tradersreport in several talks that you have recently given. Howdo you use this in making trading decisions?
JM: I look at what the commercials are doing because this ismost important. Then I analyse sentiment and where themarket stands from the long term point of view. My belief isthat markets are established for the benefit of the commer-cials and not the speculators. For example, in the wheat mar-ket this year, huge price movements created margin calls forthe commercials. These calls would have been financed by thebanks previously but with the onset of the credit crunch, theynow have to be covered by the commercials themselves ifthey want to carry on doing business. The commercials wentto the CFTC and complained that something had to be doneabout the impact that speculators were having on the market.As a result, the CFTC doubled the margin call on the marketand wheat prices fell sharply soon after.
This illustrates that the commercials are far more importantthan the liquidity providers, i.e. the speculators. Looking atthe commercial positions gives you an idea of what the guyswho matter are thinking. I have some software that reads theCOT report for me and charts it so I can more easily seewhere things are. This helps form part of my set-up.
TA: You have placed great emphasis on trade manage-ment and money management. Can you enlarge on yourapproach?
JM: Trade management and money management are twoseparate things. Trade management is about, do I add to myposition? If so, how much do I add considering what I see asthe overall market picture? This is based on what the chartsare telling me, how my positions are performing, do I pyra-mid my position, and where to place stop losses.
In my opinion, most traders tend to put their stop losses
“MY BELIEF IS THATMARKETS ARE
ESTABLISHED FORTHE BENEFIT OF THE
COMMERCIALS, NOT THE
SPECULATORS”
→

June 2008 THE TECHNICAL ANALYST 39
Interview

too close. This tends to happen because they are over-geared.If you are so highly geared that you are using a quarter of adays range as a stop then you are probably going to losemoney. If you use the average true range of the last five daysmultiplied by three and then add that to the low of today,then this is more sensible. For most people this gives themsuch a small position size that it’s unattractive. Most tradersaren’t interested in gains of 10% in the short to medium termbut are looking at 30% plus which is often unrealistic.
The incentive is always there to over-gear because there areplenty of stories out there of how someone has converted$1000 into $10,000 in six months. The fact is that a six monthtrack record doesn’t mean much and doesn’t prove that youare a good trader and will make money in the future. For me,trading success is probably 60% money management and40% strategy. The latter comprises the entry and exit criteriaalthough I think the exit criteria are ultimately more impor-tant. In a trending market it is possible to make money bybuying the close everyday with a day’s range as a stop. This isan entry strategy that is very simple. When to stop buying theclose and when to exit the position are much more difficultdecisions to make
TA: How do you determine what stop losses to use?
JM: I tend to use wider stop losses as it suits my trading style.As a measure of volatility I use the 5 day average true range.I can then use twice or three times that depending on marketconditions and other factors. The big advantage of havingwider stops is that it forces you to take a less geared position.It also makes you pickier about your trades so you don’t over-trade which is always a good thing.
Although setting the right stop losses is vital, I would stressthat of equal importance is how much capital is being usedeach trade and the exit strategy. As I have said, too muchemphasis is placed on the entry. It is curious that in the exten-sive literature on trading available, money management andthe exit are topics which are rarely discussed despite thembeing the most important ingredients of successful trading.
TA: What technical indicators do you think are mostvaluable?
JM: I especially like divergence because it’s an indicator ofsentiment and I’m very sentiment focused. Jake Berstein andLarry Williams have both done a lot of research into this areaand I pay a lot of attention to their forecasts and marketanalysis. I also like the Welles Wilder Volatility Stop as it’s anindicator of trend.
I think it’s important to recognize the best measures of mar-ket sentiment and then combine these with technical indica-tors. Without a sentiment overlay one could fall into the trapof using technical indicators that are inappropriate for cur-rent market conditions.
TA: To what extent do you backtest your strategies?
JM: I consider backtesting to be very important and havedone a lot of work on various set ups involving patternrecognition. However, I have two caveats when it comes totesting: firstly, I believe it is important to avoid the temptationto optimize. Just because a strategy has worked in the pastdoesn’t guarantee it will be effective in the future. Secondly,has the nature of the market changed from the backtest peri-od? For example, the advent of 24 hour markets has removeda lot of the emotion that used to happen on the open andclose of a market. There would be heavy volumes at thebeginning and end of the day and the middle would be quitequiet. These spikes in volume have been reduced by 24 hourtrading so the focus on the opening and closing prices has beenreduced. This means there are not as many gaps in price andthose that do exist are not as great as they used to be.
TA: Ultimately, does technical trading come down toknowing when to use, and not to use, an indicator?
JM: Yes because with any indicator there are judgment calls.Actually, I suspect that using technical analysis alone will notprovide sufficient information to trade and make money.Nevertheless, give a good trader only an average indicator andthat individual should be able to make money from it. Butdon’t place too much emphasis on technical indicators;remember, don‘t over-gear the position, keep stop losseswide and have a philosophical basis behind all trading deci-sions. This paves the way for the trader to make money andbe successful.
Interview
40 THE TECHNICAL ANALYST June 2008
“EVEN IF YOU GET A TRADE WRONG BUTYOU HAVE GOOD RISK MANAGEMENT,
YOU’LL BE OK”

TA in Asia
Moving averages are at their most effec-tive when forecasting what will happen inthe next ten days, according to CamilloLento of Lakehead University in Canada,who – in one of his three papers men-tioned in this section - has been examin-ing the ability of simple moving averagesto forecast security returns. Five moving
average variants were used to develop aforecasting model using OLS regressionfor the DJIA, NASDAQ, TSX and CAD-US exchange rate. The forecasting modelwas compared to the random-walk modelwithout a drift and tested out-of-sample.The results suggested that moving aver-ages have no predictive ability on any of
the four indices with a lag of 1 day.However, moving averages explainapproximately 45% to 48% of the varia-tion in the returns in the following 10days and clearly outperform the random-walk model. Most of the forecasting abil-ity was derived from the MA (5, 150).
Lento, Camillo, “Forecasting Security Returnswith Simple Moving Averages”, (2008).
Ten Day Horizon for SMA
Technical trading rules work for theAsian-Pacific equity markets. This is theconclusion of Camillo Lento who hascarried out tests on nine technical tradingstrategies in eight Asian-Pacific equitymarkets for periods ranging from January1987 to November 2005. The rules test-ed were moving average crossovers, filterrules (momentum strategies) and tradingrange break-out rules. His results showthat 56 out of the 72 (78%) trading rulevariants tested on all the data sets wereprofitable after accounting for transac-
tion costs. The moving averagecrossovers performed the best in generaland the MAC (1, 50) performed best inparticular generating annualised excessreturns of 1.8 to 32.6 percent. Subperiodanalysis, however, showed that many ofthe rules were not robust and includedsignificant risk.
Lento, Camillo, "Tests of Technical TradingRules in the Asian-Pacific Equity Markets: ABootstrap Approach", (2008).
Complex rules are more profitable thansimple ones. This is the conclusion ofPo-Hsuan Hsu and Chung-Ming Kuanwho looked at what they describe as amore complete universe of tradingstrategies. They tested the profitability ofthese rules and strategies with four mainindices and found that significantly prof-itable simple rules and complex tradingstrategies do exist in relatively “young”markets (NASDAQ composite andRussell 2000) but not in the data fromrelatively “mature” markets (DJIA andS&P500). Moreover, after taking transac-
tion costs into account, they found thatthe best rules for NASDAQ Compositeand Russell 2000 outperform the buy-and-hold strategy in most in- and out-of-sample periods. They also found thatcomplex trading strategies are able toimprove on the profits of simple rulesand may even generate significant profitsfrom unprofitable simple rules.
Hsu, Po-Hsuan and Kuan, Chung-Ming,"Reexamining the Profitability of TechnicalAnalysis with Data Snooping Checks”, Journalof Financial Econometrics, Vol. 3, No. 4, pp.606-628, 2005.
Another paper that looks at combiningsignals focuses its attention on the com-modity futures markets. According to anAnglo-French team of researchers fromCity University and EDHEC, momentumsignals and term structure signals generateexcess returns of 10.1% and 12.7%respectively when implemented individu-ally. Staggeringly, when combined into a“double-sort commodity-based tacticaltrading strategy” they produce a return of21.0% which the authors calculate wouldstill be profitable net of transaction costs.In terms of the rules, the momentumstrategies were based on 1, 3, 6 or 12month ranking periods, whereby the port-folio goes long the highest quintile andshort the lowest quintile. The term struc-ture strategies were based on going longfutures that are in a backwardated marketand short futures that are in a contangoedmarket, whereby the strategy goes longthe quintile with the highest positive roll-returns and short the quintile with themost negative roll-returns.
Fuertes, Ana-Maria, Miffre, Joelle and Rallis,Georgios, "Tactical Allocation in CommodityFutures Markets: Combining Momentum andTerm Structure Signals", (April 2008).
Academic studies of technical analysis areoften criticised for their simplisticapproach, tending to test one strategy at atime rather than testing a strategy basedon a combination of studies and tools, asis usually done in practice. The sameCamillo Lento has recognised this weak-ness and in another of his papers looks ata “combined signal approach to technicalanalysis on the S&P500”. Over a 59 yearperiod – from 1950 to 2008 – he con-
cludes that only the moving averagecrossover and a few other trading rulesare able to outperform a buy-and-holdstrategy by themselves. However, he man-aged to generate excess returns byemploying a Combined Signal Approach(CSA) which was statistically confirmedthrough bootstrap simulations andproven as robust through sub-periodanalysis. The Combined Signal Approachcomprises three trading strategies: mov-ing average crossovers; filter rules andtrading range break-out rules, whereby a
long (short) position is taken if two ormore of the total of 9 trading rules sug-gest a long (short) position. When ‘x’equalled 2 or 4 (i.e. 2/9 or 4/9), the CSAperformed the best in terms of returnsafter transaction costs. The CSA 2/9 wasparticularly able to earn excess returns inall three sub-periods with a relatively sta-ble Sharpe Ratio.
Lento, Camillo, “A Combined Signal Approachto Technical Analysis on the S&P500”,(2008).
DOUBLING UP
COMPLEX RULES
TESTING COMBINATIONS
Research Update
June 2008 THE TECHNICAL ANALYST 41

Stock Moves in World CupIt’s well documented that during WorldCup football competitions, the stress ofthe fans of a losing country leads toextreme phenomena, e.g. an increase inheart attack rates, changes in workersproductivity, and so on. Two researchersfrom Bar Ilan University and the HebrewUniversity of Jerusalem show that along-side the local effect, the World Cup is alsoassociated with a long lasting global effectin financial markets, i.e. with substantial
low returns in the US stock market.Investigating eleven World Cup eventsduring a period of 41 years, reveals thatthe average return on the US market overthe World Cup's global effect period (i.e.about 40 trading days during and after thegames) is -6.25% (-46.6% annually!) rela-tive to +1.27% (10.6% annually) corre-sponding to the all-days average returnfor the same period length. These resultsare statistically highly significant and sta-
ble under rigorous robustness checks.Kaplanski and Levy suggest an invest-ment strategy to exploit this effect, inwhich one reduces equity exposure tozero over the World Cup’s global effectperiod.
Kaplanski, Guy and Levy, Haim, "The GlobalEffect of the FIFA World Cup on the StockMarket", (November 2007).
IRRATIONALDIVERSIFICATIONManagers have a tendency to excludechoice alternatives that are unattractivewhen held in isolation, despite theirattractive diversification benefits,according to a portfolio constructionexperiment. Moreover, the tworesearchers from Erasmus University inthe Netherlands found that there is atendency to divide available fundsequally between the remaining alterna-tives. This strategy is applied even if itleads to allocations that are dominatedby first-order stochastic dominance.Framing the decision problem toemphasize potential diversification ben-efits leads to significantly improved allo-cations.
Baltussen, Guido and Post, Thierry,"Irrational Diversification: An ExperimentalExamination of Portfolio Construction",(December 2007).
Highs and Lows Trading volumes rise on price highs andlows in a predictable manner, accordingto two US-based researchers fromRutgers University. Mizrach and Weertshave established a positive relationshipbetween abnormal turnover and theevent of breaching n-day highs and lows.The research, based on NASDAQ andNYSE data, found that even after con-trolling for news about earnings, divi-dends, and analyst recommendations,turnover rises on n-day highs and lows,and is an increasing function of the timeframe n. Moreover, turnover persistsafter the event day for at least two weeks,positively for the highs and negatively forthe lows. As such, the researchers suggestignoring the trend when n-day highs are
achieved (because of continuingturnover/momentum effects) and beingcontrarian on n-day lows. New lows pro-vide abnormal returns for up to 6 tradingdays.
Mizrach, Bruce and Weerts, Susan, "Highs andLows: A Behavioral and Technical Analysis",(November 2007).
PAIRS TRADING Is it possible to improve on the PairsTrading strategy by introducing greatercomplexity? In a paper entitled “M of aKind”, Marcelo Perlin of the ICMACentre, University of Reading, suggests amultivariate version of pairs trading,which tries to create an artificial pair for aparticular stock based on the informationof m assets, instead of just one. The per-formance of three different versions ofthe multivariate approach was assessedfor the Brazilian financial market using
daily data from 2000 to 2006 for 57assets. After taking into account transac-tion costs, performance was assessedbased on raw and excessive returns, betaand alpha calculations, and the use ofbootstrap methods for comparing per-formance indicators against portfoliosbuilt with random trading signals. Themain conclusion of the paper is that theproposed version was able to beat bench-mark returns and random portfolios forthe majority of the parameters. The per-
formance was also found superior to theclassic version of the strategy. Volatility isquite high, however, but this is compen-sated for by high positive returns, and assuch the results are supported by positiveannualized sharpe ratios.
Perlin, Marcelo Scherer, "M of a Kind: AMultivariate Approach at Pairs Trading"(December 2007).
All papers are available from the Social Science ResearchNetwork, SSRN, www.ssrn.com
Research Update
42 THE TECHNICAL ANALYST June 2008
There are relatively few books available on candlestick charting which is perhaps surpris-ing given the popularity of the technique. By far the most famous author on the sub-ject is Steve Nison with his famous book “Japanese Candlestick Charting Techniques”
(Prentice Hall) which is perhaps the definitive book on the subject. However, whenever a sin-gle volume tends to dominate a subject, there is often much to be gained from a fresh perspec-tive.
Thomas Bulkowski is a US based trader who now runs a consultancy specialising in patternrecognition research. His last book was the mammoth “Encyclopaedia of Chart Patterns”(Wiley) which broke new ground in its exhaustive description and study of most of the wellknow (and many lesser know) price patterns. This new book, focusing exclusively on candle-stick formations, is in a similar vain.
Candlestick charting is really a subject in itself because a trader using this technique is for allintents and purposes self sufficient from a TA perspective. Because there exists a candlestickpattern for every market condition and situation, he or she has little need to adopt additionaltechnical analysis strategies, except perhaps for the odd moving average overlay. It is for thisreason that more research has been needed into the effectiveness (and profitability) of thenumerous candlestick patterns that exist.
Bulkowski’s book contains in-depth coverage of around 100 candlestick patterns or signals.Each chapter covers a single pattern and offers a detailed description, market examples, guide-lines to identification and suggested trading techniques. These may include such analysis as towhether a pattern works best as a continuation or reversal, how they perform when used withmoving averages, and if they provide effective signals prior to breakouts. For example, the Dojiis one of the best know candlestick formations. Bulkowski lists more then eight versions ofthe Doji along with performance statistics, best trading conditions and even statistics on vari-ations of the pattern, i.e Dojis with long upper shadow or short lower shadow. The publica-tion of candlestick analysis to this extent is, to my knowledge, unique.
After having analysed almost 5 million candlesticks, Bulkowski also ranks the top 15 per-forming candlestick patterns in each of several different scenarios including best overall per-formance, bull market reversals, bull market continuation etc. Also included at the end of thebook is a very useful visual index of every candlestick pattern discussed in the main text.
Some readers may take issue with some of the authors testing statistical methods for eachpattern. While each pattern is backtested, it is done in fairly simplistic terms and doesn’t gointo details of trade set-ups so excludes such statistics as the number of winning trades, P&Land drawdowns from trading a particular pattern. Furthermore, he doesn’t establish confidencelimits for his tests and look to establish if his results could have occurred by chance.
Despite these drawbacks, Bulkowski’s book is undoubtedly a valuable addition to the limit-ed literature available on candlestick charting and should become essential reading for any trad-er who uses candles on a regular basis.
June 2008 THE TECHNICAL ANALYST 43
Book Review
By Thomas N. BulkowskiPublished by Wiley 227 pages ISBN 0470182016 £80.00
THE ENCYCLOPEDIA OF CANDLESTICK CHARTS

7 Chart Patterns thatConsistently Make Money Ed Downs Published by Traders LibraryISBN: 1883272610
TOP TEN BOOKS
Technical Analysis of theFinancial Markets John MurphyPublished by NYIF ISBN: 0735200653
Come into My TradingRoom: A Complete Guideto TradingAlexander ElderPublished by Wiley ISBN: 0471225347
Martin Pring’sIntroduction to TechnicalAnalysisMartin Pring Published by McGraw HillISBN: 0070329338
The UK Trader’s Bible:The Complete Guide toTrading the UK StockMarketDominic Connolly Published by HarrimanHouseISBN: 1897597398
Swing Trading Mark Rivalland
Published by HarrimanHouse
ISBN: 1897597193
The Definitive Guide toPoint and Figure Jeremy du Plessis
Published by HarrimanHouse
ISBN: 1897597630
The Complete Guide toPoint and Figure Charting Heinrich Weber and Kermit
Zieg Published by Harriman
House ISBN: 1897597282
Ichimoku Charts Nicole Elliott
Published by HarrimanHouse
ISBN: 1897597843
Investor’s Guide toCharting
Alistair BlairPublished by FT Prentice
HallISBN: 0273662031
Source: Global-Investor.com. All of the above books are available from the Global Investor bookshop at a discount. Pleasecall +44 (0)1730 233870 and quote "The Technical Analyst magazine".
Book Review
44 THE TECHNICAL ANALYST June 2008

OVERVIEW OF TODAY’S ALGORITHMS:ADVANCED STRATEGIES FOR A COMPLEX MARKETPLACEBy Harrell Smith
To help clients operate in this new trad-ing environment, brokers and inde-pendent technology vendors haverolled out increasingly sophisticatedtrading tools. Among these are a grow-ing number of algorithmic tradingstrategies, ranging from basic algo-rithms such as VWAP and implementa-tion shortfall to advanced strategiesthat address more specific tradingrequirements (i.e. sourcing liquidityfrom crossing networks and dark pools,automating share buybacks, etc.).Virtually all leading broker dealers,agency brokers and trading technologyvendors offer a full complement ofalgorithms from which clients canchoose.
Unfortunately, the sheer number ofstrategies out there can lead to confu-sion among end-users. Furthermore,the names that brokers have bestowedon their more advanced algorithmsmay sound impressive, but in mostcases they have nothing to do with thealgorithms themselves. (If you havenever used EdgeTrade’s “Sumo” algo-rithm, Credit Suisse’s “Guerilla” orGoldman’s “Port-X,” you would behard pressed to explain exactly whatthey do based on their names.) As
such, it is useful to examine the mar-ket’s current crop of algorithms anddraw some distinctions based on theircomplexity and type of problem theyseek to address.
Basic execution strategiesOnly a few years ago, most brokers hadno more than three or four algorithms.Among these were relatively standard-ized strategies that sought to returnexecutions tied to industry benchmarksor provided simple “slicing and dicing”services – linear algorithms whosevalue lay in automating simple but fair-ly repetitive tasks. • VWAP. The most well known algo-
rithm in the market today. VWAP(Volume Weighted Average Price)attempts to execute an order alongthe historical volume curve of theselected security. The typical equityvolume curve for liquid securities iscalled a “smile” as the most volumetends to trade near the open andclose, and the least volume is tradedmidday. VWAP strategies aredesigned to trade to the end of a setperiod, so they have to manage theinventory of the order to ensure thatthere is always a suitable amount left
to trade (based on historic trends).Because of this constraint, VWAP isnot an appropriate strategy for secu-rities with unpredictable volumecurves, or during periods of unusu-ally high volatility.
• TWAP. TWAP (Time WeightedAverage Price) executes an orderevenly over a user defined time peri-od. Like VWAP, this strategy man-ages the inventory of the orderthrough to the end of the userdefined period. Unlike VWAP,scheduling is done on an even basisduring the chosen period, ratherthan trying to anticipate the volumecurve of the period as VWAP does.TWAP gives an even exposure to achosen period, but runs higher risksof market impact as it makes noallowance for predicted volumecurve as VWAP does.
• Inline/participate/percentage ofvolume. Inline algorithms are alsofairly straightforward. They seek toexecute an order in line with themarket as a percentage of currentorder book volume (as defined bythe user).
• Implementation shortfall. Animplementation shortfall algo-
Over the past several years, structural, economic, technological and regula-tory forces have fundamentally reshaped the global equity markets. In theUS and Europe, competition has increased, new types of execution ven-ues have materialized, order sizes have plummeted and volumes havesurged. As a result, firms today face a global marketplace that is frac-tured, technology-driven and complex.
→
June 2008 THE TECHNICAL ANALYST 45

46 THE TECHNICAL ANALYST June 2008
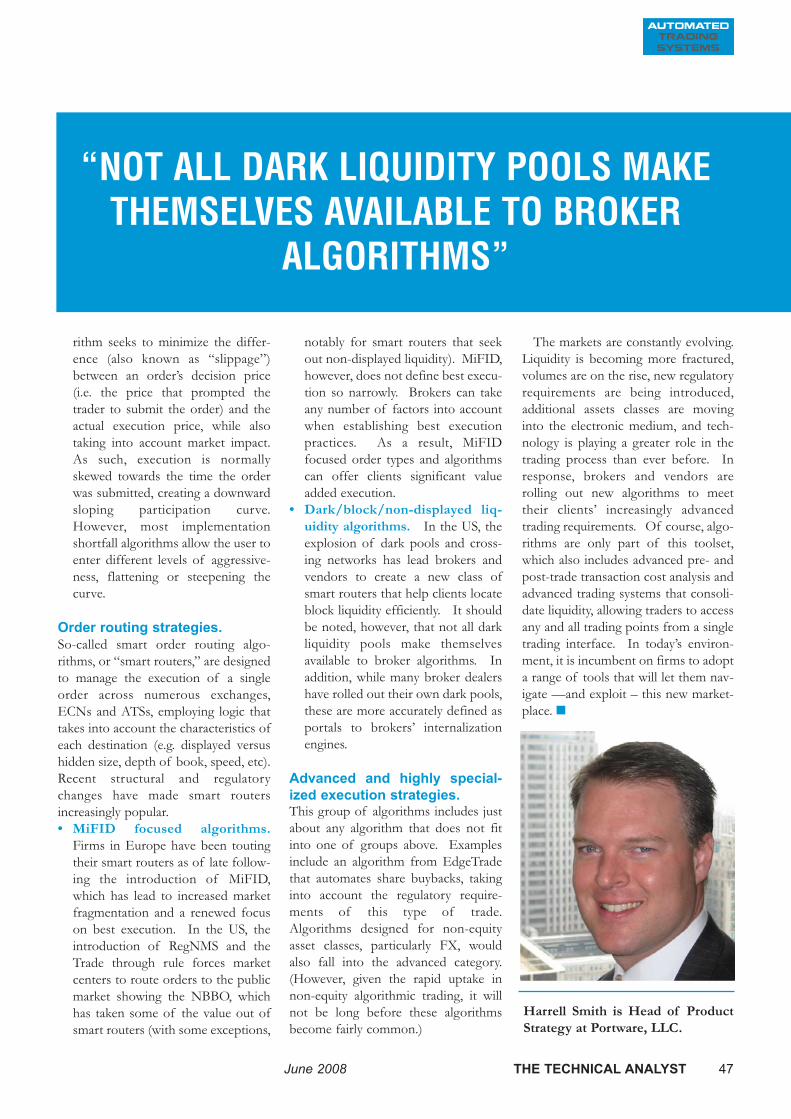
June 2008 THE TECHNICAL ANALYST 47
rithm seeks to minimize the differ-ence (also known as “slippage”)between an order’s decision price(i.e. the price that prompted thetrader to submit the order) and theactual execution price, while alsotaking into account market impact.As such, execution is normallyskewed towards the time the orderwas submitted, creating a downwardsloping participation curve.However, most implementationshortfall algorithms allow the user toenter different levels of aggressive-ness, flattening or steepening thecurve.
Order routing strategies.So-called smart order routing algo-rithms, or “smart routers,” are designedto manage the execution of a singleorder across numerous exchanges,ECNs and ATSs, employing logic thattakes into account the characteristics ofeach destination (e.g. displayed versushidden size, depth of book, speed, etc).Recent structural and regulatorychanges have made smart routersincreasingly popular. • MiFID focused algorithms.
Firms in Europe have been toutingtheir smart routers as of late follow-ing the introduction of MiFID,which has lead to increased marketfragmentation and a renewed focuson best execution. In the US, theintroduction of RegNMS and theTrade through rule forces marketcenters to route orders to the publicmarket showing the NBBO, whichhas taken some of the value out ofsmart routers (with some exceptions,
notably for smart routers that seekout non-displayed liquidity). MiFID,however, does not define best execu-tion so narrowly. Brokers can takeany number of factors into accountwhen establishing best executionpractices. As a result, MiFIDfocused order types and algorithmscan offer clients significant valueadded execution.
• Dark/block/non-displayed liq-uidity algorithms. In the US, theexplosion of dark pools and cross-ing networks has lead brokers andvendors to create a new class ofsmart routers that help clients locateblock liquidity efficiently. It shouldbe noted, however, that not all darkliquidity pools make themselvesavailable to broker algorithms. Inaddition, while many broker dealershave rolled out their own dark pools,these are more accurately defined asportals to brokers’ internalizationengines.
Advanced and highly special-ized execution strategies. This group of algorithms includes justabout any algorithm that does not fitinto one of groups above. Examplesinclude an algorithm from EdgeTradethat automates share buybacks, takinginto account the regulatory require-ments of this type of trade.Algorithms designed for non-equityasset classes, particularly FX, wouldalso fall into the advanced category.(However, given the rapid uptake innon-equity algorithmic trading, it willnot be long before these algorithmsbecome fairly common.)
The markets are constantly evolving.Liquidity is becoming more fractured,volumes are on the rise, new regulatoryrequirements are being introduced,additional assets classes are movinginto the electronic medium, and tech-nology is playing a greater role in thetrading process than ever before. Inresponse, brokers and vendors arerolling out new algorithms to meettheir clients’ increasingly advancedtrading requirements. Of course, algo-rithms are only part of this toolset,which also includes advanced pre- andpost-trade transaction cost analysis andadvanced trading systems that consoli-date liquidity, allowing traders to accessany and all trading points from a singletrading interface. In today’s environ-ment, it is incumbent on firms to adopta range of tools that will let them nav-igate —and exploit – this new market-place.
Harrell Smith is Head of ProductStrategy at Portware, LLC.
“NOT ALL DARK LIQUIDITY POOLS MAKETHEMSELVES AVAILABLE TO BROKER
ALGORITHMS”

Principal Trainer
Trevor Neil
Trevor Neil became a commodities trader at Merrill Lynch in the mid 1970’s before going on to work at LIFFE giving technical
analysis support to floor traders.
In 2000 he became head of technical analysis at Bloomberg where he was responsible for training and technical analysis software development.
Full course details can be found at: www.technicalanalyst.co.uk/training
For further information email: [email protected]
Register online at: www.technicalanalyst.co.uk or call: +44 (0) 207 833 1441
Course Details
Duration:
Courses are run from 9am to 5pm and include lunch and refreshments.
Who Should Attend:
Traders, fund managers, hedge funds, risk managers, analysts and brokers
The essential technical analysis course providing a thorough grounding in TA techniques for traders and investment managers new to the subject.
This highly regarded 2-day course provides in-depth training in the most effective technical trading strategies for more experienced market professionals.
Recognising that portfolio managers and analysts do not need the kind of technical analysis used by day-traders and dealers, this course concentrates on market timing from a longer-term point of view. This course is designed to give a timing overlay for fundamental decisions.
Training Courses
Training with The Technical Analyst
The Technical Analyst offers a range of exciting training courses for traders and investment managers. We also offer specialist in-house training on request.
ADVANCED TECHNICAL ANALYSIS (2 DAYS)
TA FOR THE PORTFOLIO MANAGER
INTRODUCTION TO TECHNICAL ANALYSIS
21/22 August Johannesburg28/29 August Sydney24/25 September London20/21 November Hong Kong
20 August Johannesburg27 August Sydney23 September London19 November Hong Kong
PAIRS TRADING
FURTHER COURSES
1 October London
DEMARK INDICATORS 13 November London
CERTIFIED TRADING SYSTEM DEVELOPER Qualification & training in systems development (see website for details)
AUTOMATED TRADING WORKSHOP12 November London
25/56 November London
Our very popular course for all market professionals looks at a variety of trading techniques for developing an effective short term trading strategy.
SHORT TERM TRADING WORKSHOP (2 DAYS)
22/23 October London

GET QUALIFIED IN TECHNICAL ANALYSIS
For more information on how to join and what is involved in passing
the STA Diploma exam, visit our website at: www.sta-uk.org or call
us on +44 7000 710207
The Society of Technical Analysts (STA) represents and accreditsprofessional and private Technical Analysts operating in the UK
Originally established in the 1960s, the STA provides its members:• Education Monthly lectures and regular teaching courses in technical analysis
• Research The STA Journal publishes research papers on TA techniques and approaches
• Meetings Provide members the opportunity to discuss technical approaches and markets
• Representation The STA lobbies on behalf of analysts with data vendors, exchanges and regulators.
The STA represents the UK at the International Federation of Technical Analysts (IFTA)
• Accreditation The STA Diploma Exam is internationally recognised as a professional level qualification
in Technical Analysis

To find out more type: UPTA<GO>Download your Free Trial now at: www.updata.co.ukFor a CD, Trial or Demonstration: +44 (0)20 8874 4747
Or just Contact Updata by email: [email protected]
• A wealth of additional technicalanalysis tools and customindicator libraries
• Program and backtest anytechnical strategy, optimise trade entry and exit
• Report Writer and highlyconfigurable charts with yourlogos and notes
• Price targets and risk rewardratios on any chart
• Unlimited charts and analysis on multiple virtual screens
• Charts using familiar Bloomberg codes for fast tickerentry including your CIXs
• Hi speed scanning of largedata universes on any technicalcriteria with real time alerting
• Chart your own 3rd party dataincluding Excel sheets on the fly
Market Professionals in over 20 countries rely on Updatafor the power it adds to their Bloomberg Terminal
Updata Technical Analyst is a
groundbreaking application
that unleashes the power of
your Bloomberg.
For a low monthly fee and
no additional exchange fees
you have state of the art
analysis, scanning and alerting.
Updata is a registered Bloomberg 3rd Party Application type REG<GO> All trademarks are the property of their respective owners
The ultimate ‘add on’foryour Bloomberg
0