issues and analysis of prospective frequency allocations ...osgug.ucaiug.org/utilicomm/shared...
TRANSCRIPT

Issues and Analysis of Prospective Frequency Allocations for Smart Grid Applications
Jerry Armes, PEMicronet Communications, Inc.
Klaus Bender, PEUtilities Telecom Council
October 27, 2010
1
Table of ContentsIntroduction....................................................................................................3Background....................................................................................................3Current Occupancy of 1800 – 1830 MHz...........................................................4Assessment of the 1800 - 1830 MHz Band for Backhaul Operation ....................5Assessment of 1800 - 1830 MHz for Area Broadband Operation.........................8Alternative Frequency Bands..........................................................................11
The 700 MHz D Block................................................................................11Background...........................................................................................11Implications for Smart Grid Use..............................................................12
The 14,000 – 14,500 MHz Band.................................................................12Potential Smart Grid Use Of The 14-14.5 GHz Band ....................................13
Use of the 14-14.5 GHz Band For Smart Grid Backhaul............................13Use of the 14-14.5 GHz Band for Smart Grid Area Coverage Systems........15
Case A: Broadband Base Station Interference From a Full Sized Satellite Earth Station such as a Network Hub Station.......................................17Case B: Interference From a Typical VSAT ..........................................18
Summary......................................................................................................21700 MHz D Block.......................................................................................211800 MHz.................................................................................................2114000 – 14500 MHz..................................................................................22
2
Introduction
In an earlier paper entitled Analysis of the 1800 MHz Band for Smart Grid, the potential use of the 1800 - 1830 MHz band was explored for possible Smart Grid applications. The options considered in that band were sharing with current occupants or transitioning current occupants to another band in order to establish a greenfield environment.
Comments from Open SG, suggesting an expansion of the usage scenarios in this band, and an examination of other bands, such as the 700 MHz D block, were received as well and are addressed in this paper.
Other comments were received on ways of clarifying the text of the initial paper, and those have been addressed here as well.
For the sake of continuity, most of the original material has been kept intact, with clarifications added as needed, or with minimal changes in context.
Background
The system requirements for utilization of wireless spectrum are being developed at this time by the SG-Networks Working Group as a key element of the Open SG Users Group activity. A number of network clouds have been considered in that work, including the following to date:
• AMI Network• Distribution Field Area Network• Distribution SCADA Network• Distribution Substation Network• Internet/Extranets• Transmission Field Area Network• Transmission SCADA Network• Transmission Substation Network• Wide Area Networks
Within SG-Networks, there have also been suggestions that the Wide Area Network should perhaps be broken down into smaller elements to expose more functional subsystems, in particular the backhaul element.
This has merit considering that ultimately, the Smart Grid will consist of numerous specialized network clouds, and a series of backhaul networks to tie each cloud to an operations center function.
3

A simplified view of that structure is provided here.
In this view, the concept of an Operations Network is added. Backhaul is shown to and from the Automated Metering Infrastructure (AMI) network, Substation Networks, and Field Area Networks. Each of these are shown as representative clouds with backhaul requirements. All operate through a Wide Area Network (WAN).
Current Occupancy of 1800 – 1830 MHz
UTC originally recommended this band because it is used in Canada “for the operations, maintenance and management of the electricity supply, and to update the technical requirements applicable to systems throughout these bands “.1
Industry Canada indicates in the reference document that point-to-point applications will be considered in the 1800-1830 MHz band if the applicant shows a lack of alternatives in nearby bands. In addition, other rules are to be written for this band.
1 Gazette Notice SMSE-008-08, Department of Industry Radiocommunication ActDecision on Consultation SMSE-008-08 — Proposed Revisions to the Technical Requirements for Fixed Service in the Bands 1700-1710 MHz and 1780-1850 MHz, December 12, 2008
4

In the United States, the 1800 - 1830 MHz band is currently being utilized by the Federal Government for Point-to-Point Microwave. The details of government use are classified, but facilities are thought to exist along the Texas-Mexico border, along with unclassified facilities in nearby bands.
Since both Canada and the USA are using the band currently for Fixed Point to Point operations, that is the primary option considered in this analysis.
Assessment of the 1800 - 1830 MHz Band for Backhaul Operation
A total of 30 MHz can be utilized in a variety of ways. For the sake of comparison, 30 MHz defines a single channel in the 6 GHz band used for long haul point-to-point microwave applications.
The need to identify multiple channels in order to serve a variety of utilities means that for point-to-point microwave backhaul applications, each channel will necessarily be substantially smaller than 30 MHz. However, as modulation methodology is continually improving such that 256 QAM is routinely used for short microwave paths today, use of smaller channels has the potential to satisfy more utilities and organizations use of the spectrum to satisfy the Smart Grid backhaul and other spectrum requirements.
For the current exploration purposes, a band plan is assumed that reserves a block of slightly less than 2 MHz in the center of the band, and minimal guard bands at the edges of the frequency allocation, making roughly 14 MHz available for transmit operation and another 14 MHz for receive operations if new point-to-point applications are considered. To gain insights into how to define channels, it helps to first examine the modulation formats available in modern microwave equipment. On a continuum from BPSK to 256 QAM, the following chart shows how much theoretical bandwidth is required, assuming no coding for three representative bit rates. Small alpha Nyquist filtering achieving 80% of theoretical channel capacity is assumed. It was pointed out by George Kizer2 that the no filtering assumption from the initial paper was not the best, and the graphs were revised to reflect the more realistic bandwidth requirements.
2 Digital Microwave Communication: Engineering Point-to-Point Microwave Systems, George Kizer (Publication Pending), http://www.amazon.com/Digital-Microwave-Communication-Point-Point/dp/0470125349/ref=sr_1_5?ie=UTF8&s=books&qid=1287774762&sr=8-5
5

Notice that the T1 bit rate of 1.544 Mbps can be carried in about 240 KHz using 256 QAM.
Looking at this same data in another way, one could ask “How many channels could be established in the plan as defined, if data rates were set at 1.544 Mbps, 5 Mbps, or 10 Mbps?
That graph is shown here.
6
0.00
2.00
4.00
6.00
8.00
10.00
12.00
14.00
Ban
dwid
th R
equi
red
(MH
z)
BPSK QPSK 8PSK 16QAM 32QAM 64QAM 128 PSK 256 QAM
Bandwidth Analysis
Data Rate = 1.544 Mbps Data Rate = 5 Mbps Data Rate = 10 Mbps

If adaptive modulation were permitted on new point-to-point microwave facilities, it would be possible to utilize the higher order modulation formats on longer paths, since they would automatically revert to lower order formats during severe fades. This is especially the case in a band where long propagation paths of 45-50 miles are routinely possible.
Note that with 256 QAM, it is possible to carry approximately 56 channels in the available 14 MHz channel space if a Data Rate of 1.544 Mbps is carried on 256 QAM. This translates to a theoretical channel bandwidth of approximately 200 KHz. Subsequent to the initial publication of this analysis, the referenced NTIA report 3 surfaced indicating that operational bandwidths in this band already run from 10 MHz down to 500 KHz. Considering the advances in modulation technology since the report was published, the smaller 240 KHz channels are quite consistent with the way the band is used now.
On this basis, a logical recommendation is to define the basic channel unit to be 240 KHz in 14 MHz, and allow aggregation of multiple channels for those needing higher throughput.
3 NTIA Report TR-00-378, Spectrum Usage for the Fixed Services, March 2000, Robert J. Matheson, Section 2.10 Usage in the 1850-1990 MHz Band, Page 36
7
0
10
20
30
40
50
60N
umbe
r of
Ava
ilabl
e C
hann
els
BPSK QPSK 8PSK 16QAM 32QAM 64QAM 128 PSK 256 QAM
1800 - 1830 MHz Channel Plan Analysis
Data Rate = 1.544 Mbps Data Rate = 5 Mbps Data Rate = 10 Mbps

The use of narrow channels has another benefit. While the channel plans of the current Federal microwave systems remain classified, it is anticipated that standard frequency coordination procedures can be utilized to allow for the implementation of Smart Grid backhaul networks, while coexisting with the Federal microwave already in place. For those situations where frequency sharing simply is not possible, those narrowband channels that overlap the Federal channel in that region could be blocked from use by new Smart Grid licensees.
Assessment of 1800 - 1830 MHz for Area Broadband OperationIn the introduction , a number of Field Area Network and Substation Network clouds were identified. Since the electrical grid circuitry is made up of numerous components, sometimes spread over wide areas, establishing wireless communication with all of these will require a point-to-multipoint area coverage format.
In the State of Texas as an example, the total number of electrical substations has been estimated to be around 5000.
It is realized that substation placement is not in reality uniform across Texas and is driven by the electrical grid design and operation needs. This translates into some areas where greater substation to substation separation exists, but the need to provide wireless coverage to endpoints still exists, while in other areas the separation will be closer. Naturally closer separations will increase the RF noise floors within the wireless coverage areas around each substation.
However, for a parametric analysis of this nature, the uniform substation placement example is a convenient construct.
The following calculations provide potential service areas of base stations co-located with substations, if they were uniformly spread across the state.
Texas Population 20,851,820 Land Area 261,797 Average of Estimated Number Substations 5000Average Area Coverage of Each Substation (Sq. Miles) 52 Radius in Miles of Each Substation Area 4
Essentially, this simple calculation indicates that at any point in the State of Texas, there could be an electrical substation within roughly four miles of that point. This includes the points where the Federal microwave towers are currently operational.
This matters because the implementation of wide area transmitters & receivers are routinely located on facilities owned or controlled by the utilities.
8

Substations are ideal locations for the base stations to support substation networks, field area networks, and in many cases for AMI networks.
If a base station is constructed within four miles of a current microwave tower, the level of potential interference is shown in the calculation of the next table.
As a starting point, the EIRP density level of one watt/MHz is the same as that set for broadband operations by the FCC in the 3650-3700 MHz band.4
• The calculation starts with the base station EIRP, so the transmit antenna is included.
• Free space loss5 yields a worst case path loss.
• A base station channel bandwidth of 5 MHz has been assumed as this would allow five separate channels with guard bands to minimize interference among base stations.
• For Smart Grid use of this band, a long term interference objective of -154 dbw/4 KHz (commercial grade operation) is assumed for point-to-point microwave receivers.
Broadband Interference LevelsBase Station EIRP Density (watts/MHz) 1Channel Bandwidth (MHz) 5Effective Transmit Power in one channel (dbm) 36.99Frequency (MHz) 1820
Separation Distance (miles) 4Separation Distance (Km) 6.4Free Space Loss 113.8
Assumed RX Antenna Gain (db) 30Received Interference Carrier Level (dbm) -76.8Received Interference Carrier Level (dbm/4KHz)) -107.8Objective Interference Level (dbm/4KHz) -124.0Margin -46.2
4 In the Matter of Wireless Operations in the 3650-3700 MHz Band, Rules for Wireless Broadband Services in the 3650-3700 MHz Band, Additional Spectrum for Unlicensed Devices
Below 900 MHz and in the 3 GHz Band, Amendment of the Commission’s Rules WithRegard to the 3650-3700 MHz Government Transfer Band, Report and Order,
Memorandum and Order, FCC 05-56, ET Docket No. 04-1515 U.S. Department of Commerce, National Technical Information Service, AD-687 820,
Transmission Loss Predictions For Tropospheric Communication Circuits, Volume I, P.L. Rice, et al, January 1967, Equation 2.16, p. 2-7
9

Typical Unfaded Microwave Signal Receive Level (dbm) -35Typical Fade Margin for 1.4 GHz Band (NTIA Report 05-432 , Table 4-1) (See footnotes) 33
Typical T/I for 256 QAM Digital Radio (TIA TSB 10-F Table B-1) 38.6Objective Interference Level (dbm) (Calculated) -106.6Margin -29.8
One comment observed that the -46.2 db margin was based on an overly conservative general interference objective. An alternative calculation was added based on TSB-10F6 and NTIA7 sources, that applies to digital microwave radios only. The result was still a negative margin, but only -29.8 db rather than -46.2 db, and the conclusions are unchanged.
As a consequence, if a broadband technology such as WIMAX or LTE were introduced into this band, the current Federal microwave systems would most likely have to be moved into another frequency band.
It was noted that the Base Station EIRP of 1 watt, comparable to that allowed in the 3650 MHz band might be inadequate. From a performance standpoint, this may be true, although considering the 6 db lower propagation loss at 1800 MHz as opposed to 3650 MHz, the 1 watt at 1.8 GHz is equivalent to four watts at 3650 MHz. But if a 1 watt base station EIRP cannot coexist in a shared band with existing Federal Microwave, it is a foregone conclusion that higher powers also cannot coexist.
The question has been raised as to whether this analysis should be extended to other metropolitan areas. For example, the number of substations per unit area will likely be different in places other than Texas. This is true, but may not be relevant.
Since a negative interference margin of 29.8 db was established based on a PMP base station to Microwave Receiver proximity of 4 miles, the truly relevant calculation is the proximity distance that could overcome the 29.8 db.
Assuming free space loss as a worst case, this works out to roughly 100 miles, so there are few metropolitan areas in which even a marginally powered base station can share spectrum with the current Federal microwave facilities.
It should be noted that in the discussion of broadband systems interfering into Federal microwave systems, remote transceivers are ignored.
6 TIA/EIA Telecommunications Systems Bulletin, Interference Criteria for Microwave Systems, TSB-10F, Telecommunications industry Association, June 1994, Annex B Table B-1
7 NTIA Report 05-432, INTERFERENCE PROTECTION CRITERIA, Phase 1 - Compilation from Existing Sources, October 2005
10
Alternative Frequency BandsThere are a number of candidate frequency bands with potential for Smart Grid applications. One candidate that is sometimes considered is the WCS band at 2.3 GHz. However, that is addressed adequately by Recommendation 5.8.1 in the National Broadband Plan8, and is not considered in this analysis.
Two considered here are the 700 MHz D Block and the Ku Band satellite uplink band from 14,000 – 14,500 MHz proposed by UTC. Clearly the propagation characteristics of these two bands are substantially different, and will have different applications and constraints. Each is considered individually within this section of the discussion.
The 700 MHz D Block
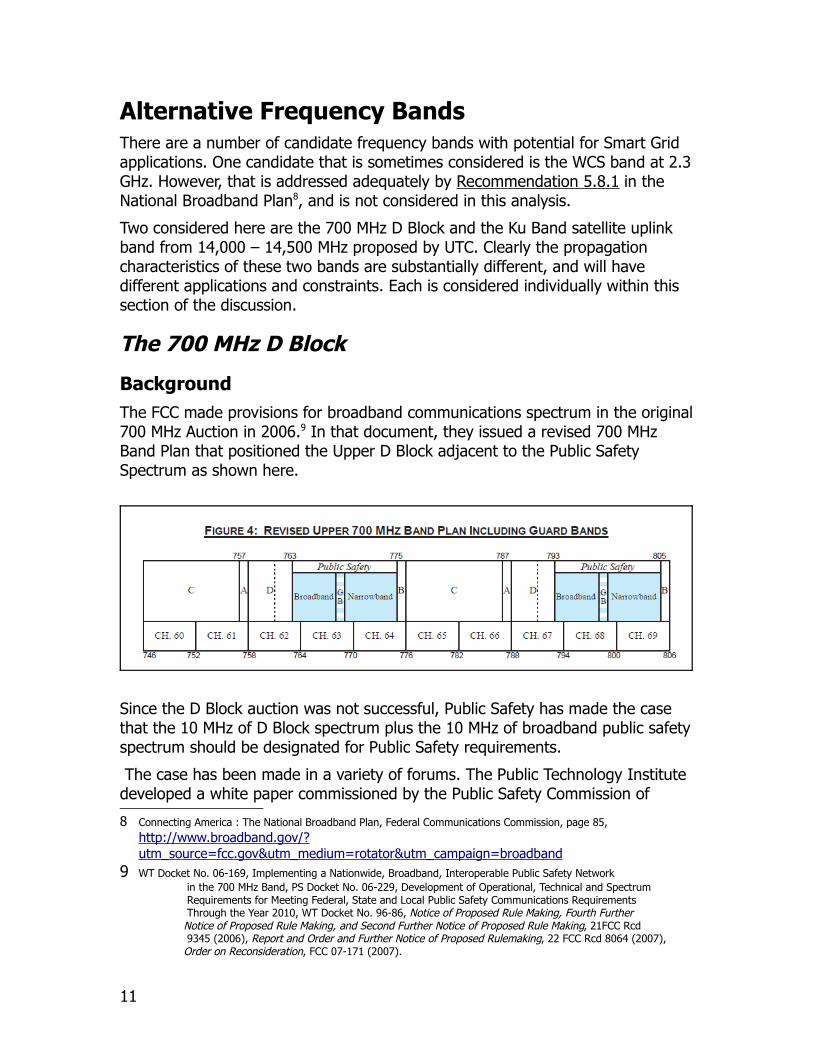
BackgroundThe FCC made provisions for broadband communications spectrum in the original 700 MHz Auction in 2006.9 In that document, they issued a revised 700 MHz Band Plan that positioned the Upper D Block adjacent to the Public Safety Spectrum as shown here.
Since the D Block auction was not successful, Public Safety has made the case that the 10 MHz of D Block spectrum plus the 10 MHz of broadband public safety spectrum should be designated for Public Safety requirements.
The case has been made in a variety of forums. The Public Technology Institute developed a white paper commissioned by the Public Safety Commission of
8 Connecting America : The National Broadband Plan, Federal Communications Commission, page 85, http://www.broadband.gov/?utm_source=fcc.gov&utm_medium=rotator&utm_campaign=broadband
9 WT Docket No. 06-169, Implementing a Nationwide, Broadband, Interoperable Public Safety Network in the 700 MHz Band, PS Docket No. 06-229, Development of Operational, Technical and Spectrum Requirements for Meeting Federal, State and Local Public Safety Communications Requirements Through the Year 2010, WT Docket No. 96-86, Notice of Proposed Rule Making, Fourth Further Notice of Proposed Rule Making, and Second Further Notice of Proposed Rule Making, 21FCC Rcd 9345 (2006), Report and Order and Further Notice of Proposed Rulemaking, 22 FCC Rcd 8064 (2007), Order on Reconsideration, FCC 07-171 (2007).
11

America.10 Another working paper was issued by multiple agencies within the Public Safety community.11
There has been some push-back by the FCC through a white paper arguing that the number of public safety users per MHz is far lower than corresponding commercial users per MHz, and a better solution is to allow Public Safety to take control of a portion of the D Block only in emergency situations. 12 This white paper further argues that in a catastrophic event, even 20 MHz would probably not be enough. Consequently the argument is that the FCC should allow Public Safety to roam across the entire 700 MHz band in such catastrophic event situations.
Implications for Smart Grid UseSince the 700 MHz D Block spectrum is almost certain to be at least partially preemptible, any Smart Grid traffic carried on it must by necessity be low reliability, high latency, or data of secondary importance.
Secondly, the Long Term Evolution (LTE) broadband standard has been endorsed 13 by the Public Safety community, so any user of the commercial 700 MHz D Block will by necessity use LTE as well. This rules out WIMAX in any form.
Considering the secondary nature of the role of this band, and the protocol limitations, access to the 700 MHz D Block should not be pursued to the detriment of more open and available alternative spectrum possibilities.
The 14,000 – 14,500 MHz BandThis band has been in use by the satellite community, as the Ku Band, since the 1980 time frame when SBS-1 was launched 14. The primary use is for earth station uplinks to the satellites.
Unlike C Band, where all transponders were 36 MHz wide, Ku Band satellites have transponder bandwidths of 36 MHz, 54 MHz, 72 MHz and potentially higher.
A key ground rule in this band is acceptance of any interference posed by satellite uplink stations as the satellite service is primary.
10 700 MHz “D” Block Public Safety Application Needs Assessment, January 2010, Commissioned by the Public Safety Foundation of America
11 PUBLIC SAFETY NEEDS THE 700 MHz D BLOCK FOR AN EFFECTIVE NATIONWIDE PUBLIC SAFETY WIRELESS BROADBAND NETWORK, dtd 5January2010, Association of Public-Safety Communications Officials-International (APCO), International Association of Chiefs of Police (IACP), International Association of Fire Chiefs (IAFC), Major Cities Chiefs Association (MCC), Major County Sheriffs’ Association (MCSA) Metropolitan Fire Chiefs Association (Metro Chiefs), National Emergency Management Association (NEMA) National Emergency Number Association (NENA), National Sheriffs’ Association (NSA)
12 The Public Safety Nationwide Interoperable Broadband Network: A New Model for Capacity, Performance and Cost, Federal Communications Commission, DOC-298799A1, June 201013 Public-safety groups support LTE at 700 MHz, Jun 11, 2009, By Donny Jackson, Urgent Communications, IWCE
http://urgentcomm.com/networks_and_systems/news/700-mhz-lte-support-20090611/14 The Satellite Encyclopedia, SBS-1, http://www.tbs-satellite.com/tse/online/sat_sbs_1.html
12

In addition, in the very top of this band, from 14.47 – 14.5 GHz, there are Federal Fixed (microwave) and Mobile applications. Areas around the following radioastronomy sites are restricted for fixed and/or mobile frequency assignments.15
By restricting potential Smart Grid applications to the range of 14 – 14.47 GHz, the primary obstacle is the necessity for sharing with the satellite uplink facilities. This is not a trivial issue, as there are thousands of Ku band very small aperture (VSAT) antennas in place, under blanket licenses, meaning their locations are unknown to the FCC.
Potential Smart Grid Use Of The 14-14.5 GHz Band This band has potential for point-to-point backhaul microwave use, but also has enough bandwidth to support multiple broadband channels (e.g. 30 MHz or higher) in a point-to-multipoint application. In the following sections, the case is presented for each of these applications, and supporting analysis is provided as a basis for the conclusions reached.
Use of the 14-14.5 GHz Band For Smart Grid BackhaulTraditionally, the frequency bands available for microwave backhaul are Upper 6 GHz, Lower 6 GHz, 11 GHz, 18 GHz and 23 GHz. There is a 10 GHz band that is lightly used, but it only supports 5 MHz channels, and cannot be considered for significant broadband backhaul. Of these bands, Micronet has observed significant levels of congestion in the major metropolitan areas in all of them except 23 GHz. However, 23 GHz is shared with the Federal Government, and has both low power channels and high power channels.
There are only six low power channels where the licensing carries conditional authorization (meaning the transmitter can be turned on immediately when the FCC application is filed). The high power channels require NTIA clearance, which can be a lengthy process on occasion.
15 FCC ONLINE TABLE OF FREQUENCY ALLOCATIONS, 47 C.F.R. § 2.106, Revised on July 26, 2010, Note US 203, p.134
13

While the 6 GHz bands have experienced high congestion levels for years, the other bands are being widely used in the ongoing 4G network build-out by the telecoms carriers. This process can be expected to continue for some time, making the build-out of dedicated Smart Grid networks ever more challenging without new backhaul spectrum.
From one perspective, 14 GHz is in a sweet spot that is only slightly higher in frequency than the 11 GHz band. Like 11 GHz, it is vulnerable to rain fades. In order to gain some insight into the use of the band for point-to-point links, two scenarios are explored using rain losses from the current ITU rain model.16
The reason for the ITU model is simply (1) it is current, (2) the latest Crane model shares the same frequency coefficients and is much closer to the ITU model, and (3) the version of the Crane model in TSB-10F 17is very much out of date.
Both Heavy Rain and Light Rain Scenarios are presented in the following spreadsheet, simply to show the impact of rain outage on maximum path length and antenna sizes that will generally apply to this band.
In practice, each designer will start with a desired Operational Availability for a desired path, which includes rain effects, then size the antenna diameters to see if that level of performance is even possible in this band.
Heavy Rain Impaired Case(Path Lengths of 1-3 miles)
Effective Transmit Power in one channel (dbm) 37.00 37.00 37.00
Frequency (MHz) 14500 14500 14500
Antenna Diameter (Feet) 4 6 10
Antenna Diameter (Meters) 1.22 1.83 3.05
Efficiency (ratio) 0.7 0.7 0.7
Transmit Antenna Gain (db) 43.8 47.3 51.8
Receive Antenna Gain (db) 43.8 47.3 51.8
Separation Distance (miles) 1 2 3
Separation Distance (Km) 1.6 3.2 4.8
Rain Loss (db/Km) for Heavy Rain (200 mm/hr) 20 20 20
Rain Loss Allocation (db) 32.2 64.4 96.6
Free Space Loss 119.8 125.8 129.4
Received Carrier Level (dbm) -27.4 -58.6 -85.4
Typical Broadband Threshold Values (dbm) -68 -68 -68
16 ITU-R P.838-317 TIA/EIA Telecommunications Systems Bulletin, Interference Criteria for Microwave Systems,
TSB-10F, Telecommunications industry Association, June 1994
14

Fade Margin (db) 40.6 9.4 -17.4
Light Rain Impaired Case
(Path Lengths of 10-30 miles)
Effective Transmit Power in one channel (dbm) 37.00 37.00 37.00
Frequency (MHz) 14500 14500 14500
Antenna Diameter (Feet) 4 6 10
Antenna Diameter (Meters) 1.22 1.83 3.05
Efficiency (ratio) 0.7 0.7 0.7
Transmit Antenna Gain (db) 43.8 47.3 51.8
Receive Antenna Gain (db) 43.8 47.3 51.8
Separation Distance (miles) 10 20 30
Separation Distance (Km) 16.1 32.2 48.3
Rain Loss (db/Km) for Light Rain (10 mm/hr) 1 1 1
Rain Loss Allocation (db) 16.1 32.2 48.3
Free Space Loss 139.8 145.8 149.4
Received Carrier Level (dbm) -31.3 -44.5 -54.1
Typical Broadband Threshold Values (dbm) -68 -68 -68
Fade Margin (db) 36.7 23.5 13.9
As these calculations show, long paths are possible in this band, but paths longer than about two miles in length will take rain outages in heavy downpours.
Use of the 14-14.5 GHz Band for Smart Grid Area Coverage Systems
15

While the interference environment in this band for either Point to Point (PTP) microwave or Point to Multipoint (PMP) area coverage systems is hostile, the PTP community works with narrow beam antennas and a variety of interference mitigation techniques are available for the microwave planner. In the case of the wideband PMP systems, using wide beam width antennas, interference is more problematic. In this analysis a transmitting earth station is shown interfering with a base station antenna, under the assumption that the interference enters the main beam at the receiving base station.
The FCC has mandated that an earth station operating between 1 GHz and 15 GHz shall not exceed a transmit power density of 55 dbw or 85 dbm in any 4 KHz band, at an elevation of five degrees above the horizon.18
For propagation modeling, since classic models such as Okumura, Hata, etc. do not cover the 14 GHz band, the Longley Rice model was utilized based on four representative points around the USA in order to get a very rough estimate of applicable propagation losses. These are graphed along with a trend line.
The trend line is described as Y(db) = 2.25 X (Miles) + 149.375, (e.g. Y = A*X + B) and this model is used in the following analysis of the band.
18 FCC Rules, 47CFR25.204 Power Limits (a), Subpart C_Technical Standards
16
Sample Longley Rice Propagation Loss Data at 14 GHz
0
50
100
150
200
250
300
0 5 10 15 20 25
Miles
Prop
agat
ion
Loss
(db)

The calculations of this section show that when an earth station is close to the base station, and transmitting maximum power toward the horizon, it will most likely not be possible for the base station to operate without experiencing interference. A similar statement could be applied in the 6 GHz C-Band where earth stations and microwave facilities have shared spectrum for years.
Case A: Broadband Base Station Interference From a Full Sized Satellite Earth Station such as a Network Hub Station
Maximum Power Density from Satellite Earth Station Interference Into Base Station
Earth Station Transmit Power Density (dbw/4KHz) 55
Typical Satellite Transponder Bandwidth (MHz) 36
Worst Case Satellite Interference Power Transmission (dbw) 94.5
Frequency (MHz) 14500
Separation Distance (miles) 5.0
Separation Distance (Km) 8.0
17

Propagation Loss (db) 160.6
Antenna Diameter (Feet) 4
Antenna Diameter (Meters) 1.22
Efficiency (ratio) 0.7
Receive Antenna Main Beam Gain (db) 43.8
Receive Interference Power Density at Base Station (dbw/4KHz) -61.8
Assumed Broadband Channel Bandwidth (MHz) 30
Receive Interference Power (dbw) -23.1
Receive Interference Power (dbm) 6.9
Nominal RX Threshold (dbm) -90
Margin Relative to Threshold (db) -96.9
At first glance this appears impossible, but it is not necessarily. Consider that satellite earth stations often are mounted at ground level, where more effective terrain and building shielding is likely to exist along any potential interference path. The band is 500 MHz wide and the transponders are typically 36 MHz, 54 MHz or 72 MHz wide. This situation leaves ample opportunities for sharing in other channels by a broadband service. Finally, the kinds of power levels shown here would normally be confined to a network hub site, rather than the very small aperture earth station terminals (VSATS) that typically exist by the hundreds or thousands for every high powered hub site. Considering the low density of hub sites, this is not considered a major obstacle to sharing this band.
Case B: Interference From a Typical VSAT
The VSAT will typically run low power levels (e.g. 5 watts in the power amplifier) and antenna diameters of one meter or less. While the outbound traffic tends to be carried by a single carrier using a protocol such as DVB-S219 where MPEG encapsulated IP packets are received by all VSATs .
Each VSAT typically responds in very short bursts in the 10-30 ms range, perhaps using the DVB-RCS20 protocol.
In the following modeling exercise, the VSAT has a diameter of 1 meter, and transmits a 2 MBPS carrier. The elevation angle is assumed to be five degrees above the horizon for comparison with the calculations done in the prior section relative to a larger satellite terminal. The side lobe pattern is taken as the FCC gain default of 29 – 25 * LOG ( Q ) 21 , where Q is the elevation angle from
19 A Companion Guide to DVB-S2, www.arctekhd.com/news/stories/DVBS-2_guide.pdf 20 DVB-RCS, http://www.dvb.org/technology/dvbrcs/index.xml21 47CFR25.209 Antenna performance standards
18

horizontal in degrees. The Longley-Rice empirical propagation modeling, as developed in the last section, is used here as well.
Typical VSAT Interference Into Broadband Base Station
Earth Station Transmit Power (Watts) 5 5 5 5 5 5
Earth Station Transmit Power (dbw) 7.0 7.0 7.0 7.0 7.0 7.0
Typical Carrier Data Rate (MBPS) 2 2 2 2 2 2
Modulation Bits/HZ for QPSK 4.0 4.0 4.0 4.0 4.0 4.0
Transmitted Carrier Bandwidth (KHz) Assuming No Coding or FEC Overhead
500 500 500 500 500 500
Antenna Elevation Angle Above Horizon (deg) 5 5 5 5 5 5
VSAT Transmit Antenna Gain (db) 11.53 11.53 11.53 11.53 11.53 11.53
Effective Isotropic Radiated Power (EIRP) in dbw transmitted toward horizon
18.5 18.5 18.5 18.5 18.5 18.5
Frequency (MHz) 14500 14500 14500 14500 14500 14500
Separation Distance (miles) 5.0 10.0 20.0 30.0 40.0 50.0
Separation Distance (Km) 8.0 16.1 32.2 48.3 64.4 80.5
Propagation Loss (db) 160.6 171.9 194.4 216.9 239.4 261.9
Antenna Diameter (Feet) 4 4 4 4 4 4
Antenna Diameter (Meters) 1.22 1.22 1.22 1.22 1.22 1.22
Efficiency (ratio) 0.7 0.7 0.7 0.7 0.7 0.7
Receive Base Station Antenna Main Beam Gain (db) 43.8 43.8 43.8 43.8 43.8 43.8
Receive Interference Power (dbw) -98.3 -109.6 -132.1 -154.6 -177.1 -199.6
Receive Interference Power (dbm) -68.3 -79.6 -102.1 -124.6 -147.1 -169.6
Nominal RX Threshold (dbm) -90 -90 -90 -90 -90 -90
Margin Above Threshold (db) -21.7 -10.4 12.1 34.6 57.1 79.6
This data is summarized graphically as follows:
19

From this graph, when the VSAT and Base Station are separated by 30 miles or so, the interference margins at the Base Station become relatively comfortable. Yet, it remains necessary to establish that the base station can remain functional in relatively close proximity to the VSAT terminals, because unlike the hub sites, the locations of the VSAT terminals are not available on an FCC license.
The bursty nature of VSAT traffic is a benefit. The fact that enough spectrum is available in this band for several channels is another benefit. If the base station operates multiple traffic channels that can be dynamically assigned, in effect using frequency hopping, and/or adding a listen-before-transmit protocol, the levels of interference calculated here should not be major problems as channel selection will be done to minimize the effects of nearby interference sources.
Considering the bandwidth available in this band, it would not be unreasonable to have multiple channels operational and allow channel hopping to avoid local VSAT interference. Whether that channel definition is based on frequencies, codes, time slots or a combination is not addressed here.
20
VSAT Interference into Broadband Base Station
-40.0
-20.0
0.0
20.0
40.0
60.0
80.0
100.0
5.0 10.0 20.0 30.0 40.0 50.0
Separation Distance (miles)
Inte
rfer
ence
Mar
gin
(db)

SummaryThis white paper has extended prior work in the 1800 – 1830 MHz band and added considerations of the 700 MHz D Block and the Ku Band Satellite Uplink band as well.
700 MHz D BlockThe arguments for the pursuit of 700 MHz band by the utilities for Smart Grid use are not persuasive.
1800 MHzThe arguments relative to the 1800 – 1830 MHz band summarize as follows:
• Point to Point backhaul operations can likely be implemented for Smart Grid applications on a sharing basis with existing Federal facilities
• For point to point fixed microwave operations, a minimum channel bandwidth of 200 KHz is realistic
• For broadband applications whereby LTE or WIMAX were utilized, it will not be possible for these facilities to operate co-channel with terrestrial point to point microwave facilities, and existing operations would necessarily have to be relocated to another band.
Considering the classified nature of the Federal microwave facilities, some of the assumptions regarding those facilities may not be accurate, and will need revision in future work. To support that work, Micronet has established a hypothetical test network of microwave facilities along a section of the Texas-Mexico border in an adjacent band for technical evaluation of interference levels under various network implementation scenarios. As additional information on existing facilities can be made available, studies of specific interference situations created by proposed new Smart Grid facilities, can be quickly evaluated against this network.
These hypothetical sites are shown here on Google Earth.
21

14000 – 14500 MHzThe calculations for the Ku Band satellite uplink band (14.0 GHz – 14.5 GHz) show significant promise for Smart Grid Use for both Point-to-Point backhaul applications as well as Broadband area coverage.
The calculations made for this band show furthermore that base station planning and frequency coordination around satellite hub sites will likely be necessary, although these are often already in the FCC licenses. The fact that VSAT antennas are blanket licensed, and their exact locations are generally unknown does not necessarily pose a major threat to broadband Smart Grid stations.
It is also likely that a frequency coordination regime for the placement of Smart Grid point-to-point links would be necessary in this band. This could mitigate any need to change the ways the satellite operators use the band.
22