issues elicitation and analysis of cmmi based process...
TRANSCRIPT
(IJACSA) International Journal of Advanced Computer Science and Applications,
Vol. 7, No. 2, 2016
492 | P a g e
www.ijacsa.thesai.org
Issues Elicitation and Analysis of CMMI Based
Process Improvement in Developing Countries
Theory and Practice A Case of Pakistan
Shahbaz Ahmed Khan Ghayyur
Department of Computer Sciences,
Preston University,
Islamabad Kohat Campus, Pakistan
Ahmed Noman Latif
System Analyst at South Taranaki District Council, Taranaki,
Wanganui & Manawatu,
New Zealand
Muhammad Daud Awan
Department of Computer Sciences,
Preston University,
Islamabad Kohat Campus, Pakistan
Malik Sikandar Hayat Khiyal
Department of Computer Sciences,
Preston University,
Islamabad Kohat Campus, Pakistan
Abstract—Researchers have tried to find out the pattern of
rising and fall of Pakistani software industry and also the reasons
for what is going exactly wrong with this industry. Different
studies have witnessed that in Pakistan, the software industry is
not following the international standards. Another surprising
fact, being observed in the past analysis, is the companies which
have initiated CMMI-based SPI program have not even achieved
the higher levels of CMMI from past three years, which is an
alarming sign of the declining attitude of the industry. Therefore,
it has become mandatory to look for the weak points or critical
barriers or issues which are actually, the reason for this slow
progress of CMMI-based SPI in Pakistan software industry. This
study has identified that the issues for CMMI based SPI in
Pakistan are much different than what it reported in the
literature. Giving proper attention to the root of the problem can
help solve many of the problems in this regard.
Keywords—CMMI-based SPI; process improvement;
inefficiency; Pakistani software industry
I. INTRODUCTION
Pakistan software industry is relatively new in the region, and its roots are not very deep. Therefore, the level of maturity is not yet attained. Lack of effort at government level and lack of presence of central controlling authorities or organization has caused slow growth for this industry. In 1995, it was felt by the Government of Pakistan that to guide and nourish the development of the software industry, ministries, departments and government agencies in the country, an organization needs to be created as no such existing department was providing the said services.
The formation of PSEB is also to make sure that it assists the software market of Pakistan regarding process improvement with the help of coping with the CMMI levels, human resource development, international marketing, making an effective strategy and promoting research providing innovation and enhancing technologies.
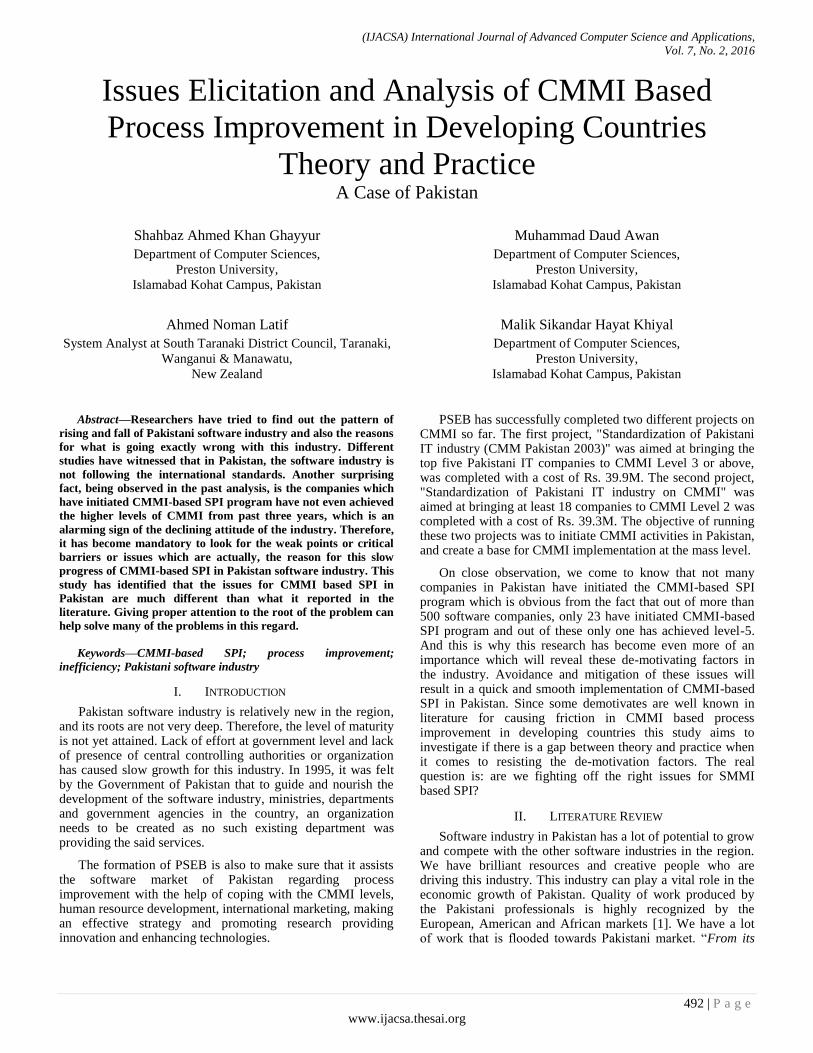
PSEB has successfully completed two different projects on CMMI so far. The first project, "Standardization of Pakistani IT industry (CMM Pakistan 2003)" was aimed at bringing the top five Pakistani IT companies to CMMI Level 3 or above, was completed with a cost of Rs. 39.9M. The second project, "Standardization of Pakistani IT industry on CMMI" was aimed at bringing at least 18 companies to CMMI Level 2 was completed with a cost of Rs. 39.3M. The objective of running these two projects was to initiate CMMI activities in Pakistan, and create a base for CMMI implementation at the mass level.
On close observation, we come to know that not many companies in Pakistan have initiated the CMMI-based SPI program which is obvious from the fact that out of more than 500 software companies, only 23 have initiated CMMI-based SPI program and out of these only one has achieved level-5. And this is why this research has become even more of an importance which will reveal these de-motivating factors in the industry. Avoidance and mitigation of these issues will result in a quick and smooth implementation of CMMI-based SPI in Pakistan. Since some demotivates are well known in literature for causing friction in CMMI based process improvement in developing countries this study aims to investigate if there is a gap between theory and practice when it comes to resisting the de-motivation factors. The real question is: are we fighting off the right issues for SMMI based SPI?
II. LITERATURE REVIEW
Software industry in Pakistan has a lot of potential to grow and compete with the other software industries in the region. We have brilliant resources and creative people who are driving this industry. This industry can play a vital role in the economic growth of Pakistan. Quality of work produced by the Pakistani professionals is highly recognized by the European, American and African markets [1]. We have a lot of work that is flooded towards Pakistani market. “From its

(IJACSA) International Journal of Advanced Computer Science and Applications,
Vol. 7, No. 2, 2016
493 | P a g e
www.ijacsa.thesai.org
nascent beginnings in the late 1980s, the industry has successfully arrived to a point where its value proposition has been validated over and over again. The largest members are grossing 15-25 million dollars in revenues, and receiving 100 million dollar valuations. Most tech companies are growing in excess of 30% a year annually. The industry as a whole is doing over 2 billion dollars a year in revenue, up from less than a billion dollars a few years ago” [1]. But over the years it has been noticed that the productivity of Pakistani software industry is not stable. There could be multiple factors that are causing such inconsistency. The most important factor that is hearting our industry very badly is poor process adoption. “Remember that Pakistan is a country, which has only recently recognized the importance of ISO certification; although ISO has been around for much longer than CMM” [2]. “One of the most prominent human aspects is that software practitioners are de-motivated to deal with SPI initiative in their organizations [3]. Despite having such huge potential and manpower, we are unable to produce even a single” organization like WIPRO, TATA and GOOGLE of the world. “The famous Indian firm named TATA Consultancy has thirteen centers in India - it has 12 CMM Level-5 and 1 CMM Level-4 certifications to its credit; WIPRO has three Level-5 certifications to its credit” [2].
Lack of adoption of software process improvement programs- like CMMI, is causing frequent closures or losses of software companies. ”Recent times have seen many Pakistani companies go bellies up - although I am not implying that lack of CMM initiative is the reason for their debacle- but this definitely was a contributing factor” [2]. Processes are not adopted in their true spirits. Management is not aware of software improvement processes. In General, management of these companies wants ROI without spending money on the stability and continuation of the adopted processes. “There are two challenges that a software development firm faces. First, to come up with reliable, efficient and pragmatic Official processes. Second, to make these processes a part of the company's culture i.e. to make the Official process the same as the Actual Process” [2]
The adoption of software process improvement program has proved its value. Countries, where software industry have adopted such kind of standards, are in the fore front. Their software industry is contributing huge revenue segment. “The Actual Process is what you do, with all its omission, mistakes, and oversights. The Official Process is what books say you are supposed to do" [4].
The MPS.BR project in Brazil was initiated in December 2003. This program was to propose the software process improvement model for the small to medium software companies according to Brazilian software industry needs. “The MPS Model is a software process improvement and assessment model, mainly oriented to the small and medium-size enterprises (SMEs). This model aims at: i) to fulfill the „business need‟ of these firms; ii) to be recognized, locally and internationally, as an applicable model to organizations which develop or acquire software” [5].
Through survey in different times, issues of software process improvement adoption, in general, and CMMI
adoption, in particular, have also been identified. Through multiple reports published by PSEB, P@SHA, and other agencies that out of 500 software companies only 33 are CMMI certified for the different levels of CMMI. Most of the lot are at CMMI Level-3 or below. Reports are evident that most haunting factors out of the lot, which have been proved as issues are Time, Cost and ROI of CMMI.
Keeping in view the above discussion this study aims to find the difference between theory and practice when it comes to issues of CMMI-based SPI in Pakistan. Hypothesizing that this difference can be the vital factor that is causing the main hindrance in growth and process improvement of companies adopting CMMI and not reaping its fruits.
III. RESEARCH METHOD DETAILS
Considering the limitations of this research and the differences in the survey methods, Personal Method in Interviews and Mail Method in Questionnaire have been selected for this research.
Questionnaire Design The questionnaire designed for final or comprehensive
survey has three sections out of which:
Section 1: Includes Company‟s information
Section 2: Includes Respondent‟s information
Section 3: Includes issues of CMMI-based SPI.
Data Collection Techniques and Methodologies Questionnaires were floated via email and on personal
contacts in different CMMI initiating organizations. It was made sure that the questionnaire reaches the maximum number of organizations with a pass-on strategy which suggests that while receiving the questionnaire the SPI practitioners were asked to forward it to other CMMI initiating companies if they have any personal contact with that particular organization. A total of 35 software companies were visited. A total of 33 companies were chosen to provide the research project with a cross-section of company maturity levels, company types, and sizes.
Sample Whole population (all 33 companies SPI involved)
employees were the sample size for this study. Since sample size was limited, a regular follow-up with the respondents was set up via emails, telephone calls and meeting them in personal. Some incentives were also introduced to get the maximum number of responses such as providing them with free discount coupons and scratch cards.
Identification of SPI Practitioners In this survey, it is ensured that not just SPI Practitioners
but software practitioners also responded to the questionnaire. For this purpose, some companies were visited personally, and respondents were contacted via phone and emails. It was ensured that this survey includes the whole sample of SPI practitioners and related persons.
Identification of SPI practitioners is achieved using the following criteria:
(IJACSA) International Journal of Advanced Computer Science and Applications,
Vol. 7, No. 2, 2016
494 | P a g e
www.ijacsa.thesai.org
1) SPI practitioner is currently working/has already
worked in a CMMI initiating organization.
2) SPI practitioner is currently working/has already
worked in an organization where SPI is achieved using the
model, which is similar to CMMI e.g., ISO standards etc.
3) SPI practitioner‟s willingness of being available for the
interview.
Compilation of Issues Once the feedback was received from the respondents, it
was compiled into a spread sheet using SPSS and Excel categories-wise. When the data was successfully compiled, a list of issues was extracted based on agreed responses of the respondents.
Interviews to resolve open issues Interviews had been conducted to resolve some of the open
issues which couldn‟t be addressed in the questionnaire. A total of four unstructured interviews with four SPI professionals regarding the extracted issues had been conducted. The opinions are included in conclusion.
Identification of Renowned SPI Practitioners Selection of renowned SPI practitioners had been done on
the following criteria:
1) At least five years of SPI related experience OR
2) Worked in CMMI implemented organization for more
than two years OR
3) Taken or conducted CMMI training in past five years
OR
4) Achieved SEI/CMMI or related certifications.
Compilation of Data (Interviews & Survey Results) A total of 33 software companies were visited.
Participating companies were selected from a larger sample of companies who responded to the final questionnaire giving information about the problems they are facing regarding SPI intuitive in their organizations. The companies were chosen to provide the research project with a cross-section of company maturity levels, company types, and sizes. Since the questionnaires used for this research had both open and closed ended questions, therefore, the analysis of this research can be categorized in to qualitative and quantitative.
Type of Analysis used There are two major types of analysis in survey research
namely Quantitative Analysis and Qualitative Analysis. In this research, both of these analysis techniques were used out of which the quantitative analysis was focused more.
Quantitative Analysis Quantitative research is best to be opted in a scenario
which requires the numeric figure to be estimated from the questionnaire or in which numbers answer the questions rather than the answers to the questions. Usually, this type of research require a large amount of data which cannot be estimated or analyzed by qualitative research or a very time-
consuming activity, the quantitative research can draw a meaningful result from this. “The main beneficial aspect is that it provides the means to separate out the large number of confounding factors that often obscure the main qualitative findings. Quantitative analytical approaches also allow the reporting of summary results in numerical terms to be given with a specified degree of confidence.”
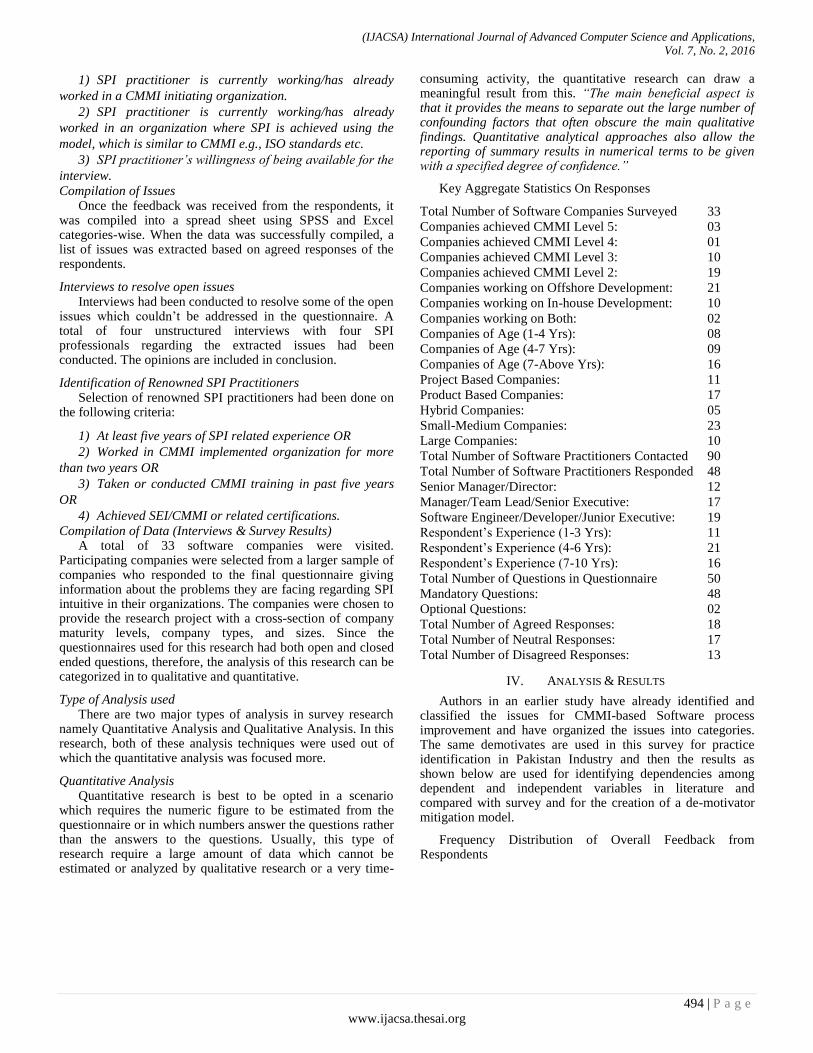
Key Aggregate Statistics On Responses
Total Number of Software Companies Surveyed 33
Companies achieved CMMI Level 5: 03
Companies achieved CMMI Level 4: 01
Companies achieved CMMI Level 3: 10
Companies achieved CMMI Level 2: 19
Companies working on Offshore Development: 21
Companies working on In-house Development: 10
Companies working on Both: 02
Companies of Age (1-4 Yrs): 08
Companies of Age (4-7 Yrs): 09
Companies of Age (7-Above Yrs): 16
Project Based Companies: 11
Product Based Companies: 17
Hybrid Companies: 05
Small-Medium Companies: 23
Large Companies: 10
Total Number of Software Practitioners Contacted 90
Total Number of Software Practitioners Responded 48
Senior Manager/Director: 12
Manager/Team Lead/Senior Executive: 17
Software Engineer/Developer/Junior Executive: 19
Respondent‟s Experience (1-3 Yrs): 11
Respondent‟s Experience (4-6 Yrs): 21
Respondent‟s Experience (7-10 Yrs): 16
Total Number of Questions in Questionnaire 50
Mandatory Questions: 48
Optional Questions: 02
Total Number of Agreed Responses: 18
Total Number of Neutral Responses: 17
Total Number of Disagreed Responses: 13
IV. ANALYSIS & RESULTS
Authors in an earlier study have already identified and classified the issues for CMMI-based Software process improvement and have organized the issues into categories. The same demotivates are used in this survey for practice identification in Pakistan Industry and then the results as shown below are used for identifying dependencies among dependent and independent variables in literature and compared with survey and for the creation of a de-motivator mitigation model.
Frequency Distribution of Overall Feedback from Respondents

(IJACSA) International Journal of Advanced Computer Science and Applications,
Vol. 7, No. 2, 2016
495 | P a g e
www.ijacsa.thesai.org
Fig. 1. Frequency Distribution Chart Overall Response Rate
TABLE I. OVERALL RESPONSE RATE
SN De-Motivator Categories Strongly Agree Agree Neutral Disagree Strongly
Disagree
Not a De-
Motivator
1 Communication Management 0% 39% 36% 21% 3% 0%
2 Cost Management 9% 58% 27% 6% 0% 0%
3 HR Management 0% 12% 45% 30% 12% 0%
4 Integration Management 6% 52% 39% 3% 0% 0%
5 Quality Management 0% 6% 73% 21% 0% 0%
6 Risk Management 0% 33% 48% 15% 3% 0%
7 Scope Management 0% 30% 21% 42% 6% 0%
8 Time Management 0% 48% 48% 3% 0% 0%
A. Issues Frequency Distribution, Trend Agreement-
Disagreement, Severity Measurement
In this section, independent variables are analyzed with the frequency of responses, the trend of agreement and disagreement levels in de-motivator categories corresponding to different independent variables elaborated, and severity levels of the de-motivator categories are also listed.
1) Response Rate vs. CMMI-Levels According to the feedback from all the respondents, it has
been observed that nearly 60% of respondents are associated with the software companies having CMMI-Level 2 which therefore can be considered as the largest population among all the CMMI implemented Organizations.
Statistics show that it is difficult or time taking activity for the organizations to climb to higher levels of CMMI.
Fig. 2. Bar Chart: Response Rate & CMMI-Levels
Fig. 3. Linear Graph: Response & CMMI-Levels
TABLE II. DE-MOTIVATOR CATEGORIES WITH SEVERITY LEVELS
ACCORDING TO COMPANY SIZES
Above figure depicts that companies with CMMI Level-2 are in agreement with the Issues which then reduce to some extent in Level-3 organizations. Organizations with Level-4 have very less disagreements which then increase steeply in the Level-5 Organizations.
Strongly Agree
Agree
Neutral
Disagree
Strongly Disagree
Not a De-Motivator
Agree
Disagree
High Medium Low
Communication Management
Cost Management
Integration Management
Quality Management
Risk Management
Time Management
Scope Management
HR Management
(IJACSA) International Journal of Advanced Computer Science and Applications,
Vol. 7, No. 2, 2016
496 | P a g e
www.ijacsa.thesai.org
So it can be concluded that there is a mixed trend of agreements and disagreements for different De-motivator categories in comparison with CMMI-Levels.
Likert Scale i.e., “Agree-Neutral-Disagree” has been translated to “High-Medium-Low” according to our understanding for measuring the severity of De-motivator categories.
As per above mentioned criteria, following De-motivator categories have been listed according to their severity levels measured in the table 2.
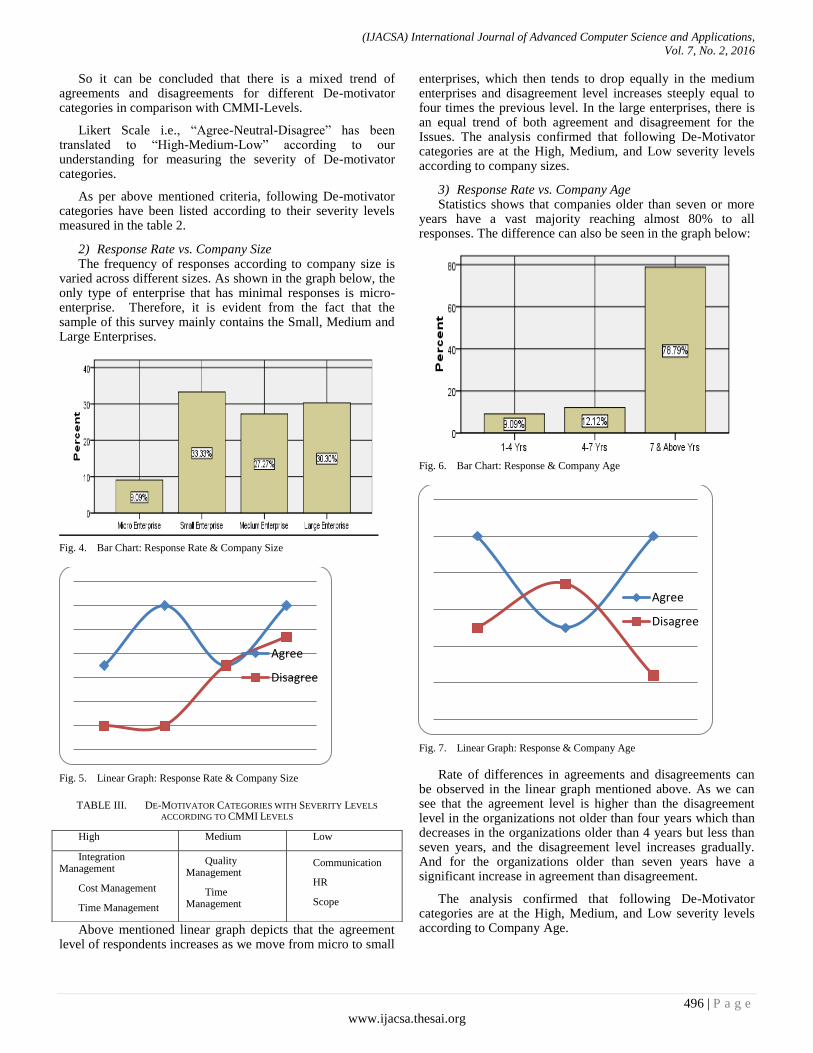
2) Response Rate vs. Company Size The frequency of responses according to company size is
varied across different sizes. As shown in the graph below, the only type of enterprise that has minimal responses is micro-enterprise. Therefore, it is evident from the fact that the sample of this survey mainly contains the Small, Medium and Large Enterprises.
Fig. 4. Bar Chart: Response Rate & Company Size
Fig. 5. Linear Graph: Response Rate & Company Size
TABLE III. DE-MOTIVATOR CATEGORIES WITH SEVERITY LEVELS
ACCORDING TO CMMI LEVELS
Above mentioned linear graph depicts that the agreement level of respondents increases as we move from micro to small
enterprises, which then tends to drop equally in the medium enterprises and disagreement level increases steeply equal to four times the previous level. In the large enterprises, there is an equal trend of both agreement and disagreement for the Issues. The analysis confirmed that following De-Motivator categories are at the High, Medium, and Low severity levels according to company sizes.
3) Response Rate vs. Company Age Statistics shows that companies older than seven or more
years have a vast majority reaching almost 80% to all responses. The difference can also be seen in the graph below:
Fig. 6. Bar Chart: Response & Company Age
Fig. 7. Linear Graph: Response & Company Age
Rate of differences in agreements and disagreements can be observed in the linear graph mentioned above. As we can see that the agreement level is higher than the disagreement level in the organizations not older than four years which than decreases in the organizations older than 4 years but less than seven years, and the disagreement level increases gradually. And for the organizations older than seven years have a significant increase in agreement than disagreement.
The analysis confirmed that following De-Motivator categories are at the High, Medium, and Low severity levels according to Company Age.
Agree
Disagree
Agree
Disagree
High Medium Low
Integration Management
Cost Management
Time Management
Quality Management
Time Management
Communication
HR
Scope

(IJACSA) International Journal of Advanced Computer Science and Applications,
Vol. 7, No. 2, 2016
497 | P a g e
www.ijacsa.thesai.org
4) Response Rate vs. company Type Statistics have confirmed that Companies with Hybrid
(Project & Product based) type are in the majority in the sample equals 42 % of total population. It is also evident that Product Based Companies are not very far behind Hybrid Type equaling almost 40 % of total population. So it can be said that the sample size of this survey contains mainly Product- Based and Hybrid Type Companies.
Fig. 8. Bar Chart: Response & Company Type
Fig. 9. Linear Graph: Response & Company Type
TABLE IV. DE-MOTIVATOR CATEGORIES WITH SEVERITY LEVELS
ACCORDING TO COMPANY AGE
The linear graph mentioned above states that the level of agreement is more or less constant in all type of companies except Project Based in which it reaches to forty percent agreement. On the other end, the disagreement level gets high in Project Based and Hybrid Type Companies.
The analysis confirmed that following De-Motivator categories are at the High, Medium, and Low severity levels according to Company Type.
5) Response Rate vs. Company‟s Type of Business Our statistics have confirmed that Companies involved in
Offshore Development are higher population rate than the rest
of the companies equaling almost fifty percent of total population.
Fig. 10. Bar Chart: Response & Type of Business
Fig. 11. Linear Graph: Response & Type of Business
TABLE V. DE-MOTIVATOR CATEGORIES WITH SEVERITY LEVELS
ACCORDING TO COMPANY TYPE
The above-mentioned linear graph displays that there is a constant increase in agreement level among both Offshore and In-house Company types. There is a sudden decrease in the agreement level and steep increase in the disagreement level in the companies having both types of businesses.
The analysis confirmed that following De-Motivator categories are at the High, Medium, and Low severity levels according to Company Types
6) Response Rate vs. Respondent‟s Experience Statistics have confirmed that majority of the respondents
population in this survey is of the software practitioners having experience more than four years and less than six years equaling almost fifty percent of total population. Practitioners having experience more than seven years are on the second number in the list having a population of almost thirty-three percent.
Agree
Disagree
Agree
Disagree
High Medium Low
1. Communication Management
2. Cost Management
3. Integration Management
4. Time Management
1. Quality Management
2. Risk Management
1. Scope Management
2. HR Management
High Medium Low
1. Communication Management
2. Cost Management
3. Integration Management
1. Quality Management
2. Risk Management
3. Time Management
1. Scope Management
2. HR Management
(IJACSA) International Journal of Advanced Computer Science and Applications,
Vol. 7, No. 2, 2016
498 | P a g e
www.ijacsa.thesai.org
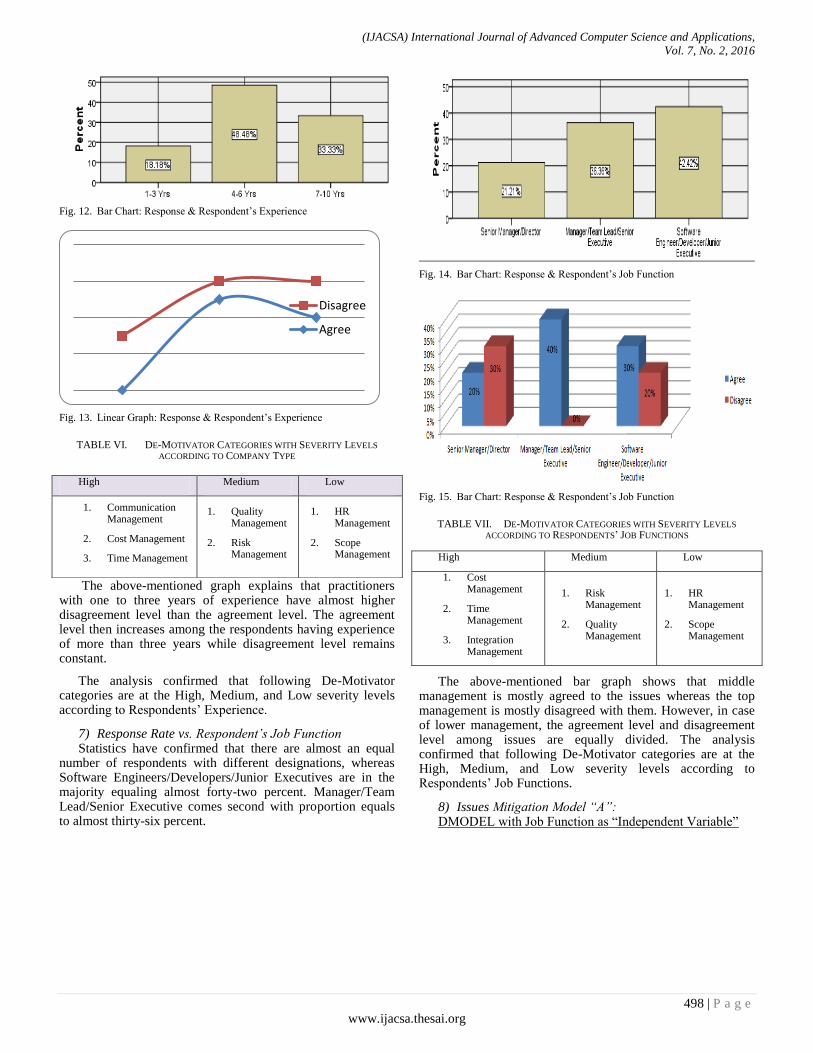
Fig. 12. Bar Chart: Response & Respondent‟s Experience
Fig. 13. Linear Graph: Response & Respondent‟s Experience
TABLE VI. DE-MOTIVATOR CATEGORIES WITH SEVERITY LEVELS
ACCORDING TO COMPANY TYPE
The above-mentioned graph explains that practitioners with one to three years of experience have almost higher disagreement level than the agreement level. The agreement level then increases among the respondents having experience of more than three years while disagreement level remains constant.
The analysis confirmed that following De-Motivator categories are at the High, Medium, and Low severity levels according to Respondents‟ Experience.
7) Response Rate vs. Respondent‟s Job Function Statistics have confirmed that there are almost an equal
number of respondents with different designations, whereas Software Engineers/Developers/Junior Executives are in the majority equaling almost forty-two percent. Manager/Team Lead/Senior Executive comes second with proportion equals to almost thirty-six percent.
Fig. 14. Bar Chart: Response & Respondent‟s Job Function
Fig. 15. Bar Chart: Response & Respondent‟s Job Function
TABLE VII. DE-MOTIVATOR CATEGORIES WITH SEVERITY LEVELS
ACCORDING TO RESPONDENTS‟ JOB FUNCTIONS
The above-mentioned bar graph shows that middle management is mostly agreed to the issues whereas the top management is mostly disagreed with them. However, in case of lower management, the agreement level and disagreement level among issues are equally divided. The analysis confirmed that following De-Motivator categories are at the High, Medium, and Low severity levels according to Respondents‟ Job Functions.
8) Issues Mitigation Model “A”: DMODEL with Job Function as “Independent Variable”
Disagree
Agree
High Medium Low
1. Communication Management
2. Cost Management
3. Time Management
1. Quality Management
2. Risk Management
1. HR Management
2. Scope Management High Medium Low
1. Cost Management
2. Time Management
3. Integration Management
1. Risk Management
2. Quality Management
1. HR Management
2. Scope Management

(IJACSA) International Journal of Advanced Computer Science and Applications,
Vol. 7, No. 2, 2016
499 | P a g e
www.ijacsa.thesai.org
Fig. 16. Issues Mitigation Model-A
Regression Weights
Regression Weights
TABLE VIII. MODEL “A” RELIABILITY TEST
Model Dependencies Cronbach‟s Alpha
Job Function Communication
Management .811
Job Function Cost Management .864
Job Function Integration Management
.917
Job Function Time Management .949
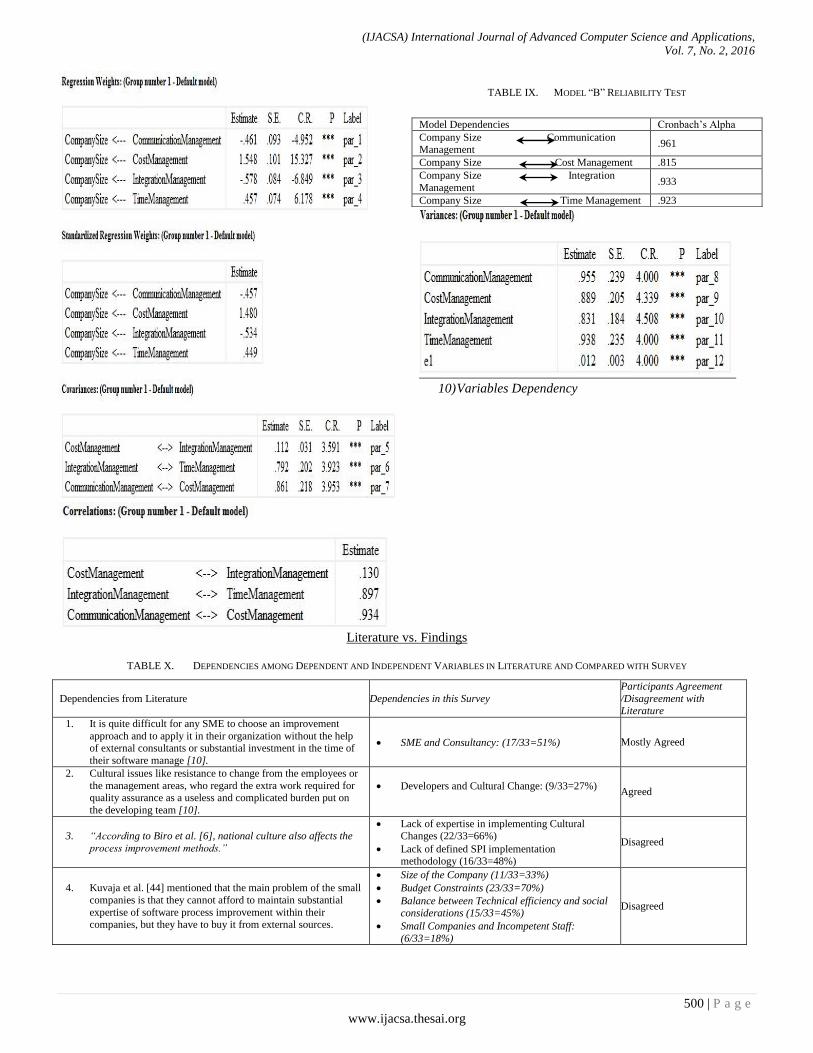
9) Issues Mitigation Model “B” Model with Company Size as “Independent Variable”
Fig. 17. Issues Mitigation Model-B
(IJACSA) International Journal of Advanced Computer Science and Applications,
Vol. 7, No. 2, 2016
500 | P a g e
www.ijacsa.thesai.org
TABLE IX. MODEL “B” RELIABILITY TEST
10) Variables Dependency
Literature vs. Findings
TABLE X. DEPENDENCIES AMONG DEPENDENT AND INDEPENDENT VARIABLES IN LITERATURE AND COMPARED WITH SURVEY
Dependencies from Literature Dependencies in this Survey
Participants Agreement
/Disagreement with Literature
1. It is quite difficult for any SME to choose an improvement
approach and to apply it in their organization without the help of external consultants or substantial investment in the time of
their software manage [10].
SME and Consultancy: (17/33=51%) Mostly Agreed
2. Cultural issues like resistance to change from the employees or
the management areas, who regard the extra work required for quality assurance as a useless and complicated burden put on
the developing team [10].
Developers and Cultural Change: (9/33=27%)
Agreed
3. “According to Biro et al. [6], national culture also affects the
process improvement methods.”
Lack of expertise in implementing Cultural Changes (22/33=66%)
Lack of defined SPI implementation methodology (16/33=48%)
Disagreed
4. Kuvaja et al. [44] mentioned that the main problem of the small
companies is that they cannot afford to maintain substantial
expertise of software process improvement within their companies, but they have to buy it from external sources.
Size of the Company (11/33=33%)
Budget Constraints (23/33=70%)
Balance between Technical efficiency and social considerations (15/33=45%)
Small Companies and Incompetent Staff:
(6/33=18%)
Disagreed
Model Dependencies Cronbach‟s Alpha
Company Size Communication Management
.961
Company Size Cost Management .815
Company Size Integration
Management .933
Company Size Time Management .923

(IJACSA) International Journal of Advanced Computer Science and Applications,
Vol. 7, No. 2, 2016
501 | P a g e
www.ijacsa.thesai.org
Small Companies and Budget Constraints: (8/33=24%)
5. Due to budget constraints, the services of a consultant
organization to improve the software quality are not possible
[10].
Consultancy (new factor)(21/33=63%)
Budget Constraints (23/33=70%) Mostly Agreed
6. People issues come under the umbrella of the „„organizational‟‟
class and incorporate problems relating to[9]:
a. Responsibilities, roles, rewards, expectations, blame; b. Staff turnover, retention, recruitment;
c. Lack of expertise in implementing cultural challenges
d. Balance between technical efficiency and social considerations
e. Politics
Rewards (7/33=21%)
Job Security (26/33=78%)
Lack of expertise in implementing cultural challenges (22/33=66%)
Balance between technical efficiency and social considerations (15/33=45%)
Politics (10/33=30%)
Mostly Agreed
7. The „„tools and technology‟‟ category is recognized as a „„project‟‟ problem and is the second most mentioned problem
for developers and project managers. It includes issues such as
[9]: a. implementation of new technologies and
tools(including SPI generally and the CMM
specifically), productivity, volume of work and pressures that inhibit the use of new tools
Balance between technical efficiency and social considerations (15/33=45%)
Lack of resources (new factor)(11/33=33%)
Tools and technologies with
Developers:3/33=10%
Tools and technologies with Managers:
6/33=18%
Partially Agreed
8. Documentation is also high on the list of developer problems.
Project Managers are also concerned with documentation and
state that CMM involves „„too much paperwork. It is not as automated as it should be‟‟ [9].
Documentation and Developers: (8/33=25%)
Documentation and PM: (6/33=18%) Partially Agreed
9. Differences in practitioner group problems. Senior managers
have below average concern for project issues such as documentation and tools and technology issues, as they
concentrate on problems relating to people and communication.
They have above average concern for requirements issues in terms of problem ranking (equal 2nd), but an average concern
in terms of percentage of problems. Indeed, further examination
of Table 2 reveals that developers devote a higher percentage of overall problems to requirements than senior managers do with
11% and 10% respectively [9].
Documentation and Senior Managers: (3/33=10%)
Tools & Technologies and Senior Managers:
(2/33=6%)
People Issues and Senior Managers: (2/33=6%)
Communication and Senior Managers: (2/33=6%)
Requirements and Senior Managers: (9/33=27%)
Requirements and Developers: (4/33=12%)
Mostly Disagreed
10. With experienced staff less rework of the documentation items
is required, issues can be resolved quickly, and chances of
destruction are reduced (Kautz and Nielsen, 2000; Moitra,
1998).
Practitioner‟s Experience and Documentation:
(6/33=18%) Disagreed
11. Analysis of the responses based on the company size of the respondents shows that the practitioners working for small-
medium size companies are highly motivated to support SPI
initiatives by factors such as cost beneficial, job satisfaction, knowledgeable team leaders, and maintainable/easy
processes.[Motivators of SPI: An Analysis of Vietnamese
Practitioners]
Small-medium companies and budget constraints: (14/33=42%)
Small-medium companies and cumbersome processes: (5/33=15%)
Small-medium companies and job security: (19/33=57%)
Mostly Agreed
12. “The large companies‟ practitioners are more motivated to
support SPI initiatives by factors such as career prospects, cost
beneficial, eliminate bureaucracy, feedback, job satisfaction, maintainable/easy processes, rewards schemes, shared best
practices, task force, top-down commitment, training, and
visible success” [7].
Large companies and job security: (7/33=21%)
Large companies and lack of feedback:
(5/33=15%)
Large companies and cumbersome processes:
(3/33=10%)
Large companies and rewards: (2/33=6%)
Large companies and commitment: (3/33=10%)
Large companies and training: (6/33=20%)
Mostly Disagreed
13. “The larger size or hierarchy of a company, the more time
needed to get a commitment from all levels of the organization” [8].
Large companies and commitment: (3/33=10%) Disagreed
14. “Participation, commitment and reasonable expectations are
the end result which should be manifested by the organizational
staff, if they are willing to contribute to the SPI project” [8].
Direction/Commitment/Requirement: (13/33=40%)
Incompetent Staff: (13/33=40%)
Agreed
15. “Several respondents mentioned that the SPI project
implementation result is also defectively affected if SPI
schedule mix up with the ongoing software development project in their companies. The respondents are suggesting that proper
and synchronized planning should be done to ensure that the
SPI implementation schedule can be carried out harmoniously
SPI gets in the way of real work: (19/33=57%)
o Agreed

(IJACSA) International Journal of Advanced Computer Science and Applications,
Vol. 7, No. 2, 2016
502 | P a g e
www.ijacsa.thesai.org
with the ongoing software development project” [8].
16. “RESULTS – We have identified 6 „high‟ perceived value SPI
stimuli that are generally considered critical for successfully
implementing SPI initiatives. These stimuli are: cost beneficial, job satisfaction, knowledgeable team leaders,
maintainable/easy processes, shared best practices, and top-
down commitment. Our results show that developers are highly motivated by: career prospects, communication, cost beneficial,
empowerment, knowledgeable team leaders, maintainable/easy
processes, resources, shared best practices, top-down commitment, and visible success; Managers are motivated by:
job satisfaction, knowledgeable team leaders,
maintainable/easy processes, meeting targets, shared best practices, and top-down commitment. Our results also show
that practitioners of small and medium sized companies are
highly motivated by: cost beneficial, job satisfaction, knowledgeable team leaders, and maintainable/easy processes;
practitioners of large companies are highly motivated by: cost
beneficial, reward schemes, shared best practices and top-down commitment” [7].
Developers and job security: (9/33=27%)
Developers and Communication: (6/33=18%)
Developers and Budget Constraints: (11/33=33%)
Developers and Cumbersome Processes: (6/33=18%)
Managers and Job Security: (11/33=33%)
Managers and Cumbersome Processes:
(2/33=6%)
Managers and Commitment: (6/33=18%)
SMEs and Budget Constraints: (15/33=45%)
SMEs and Job Security: (19/33=57%)
Large companies and Budget Constraints: (9/33=27%)
Large Companies and Rewards: (1/33=5%)
Large Companies and Commitment: (3/33=10%)
Partially Agreed
17. There was also a clear link between the amount of
Documentation carried out and the size and growth stage of the company; the smaller the company the greater the hostility
towards documentation [11].
Small Companies and Documentation:
(6/33=18%)
Large Companies and Documentation:
(8/33=24%)
Disagreed
18. However, even in the larger organizations, Documentation was
regarded as a „necessary evil‟ [11]. Large Companies and Documentation:
(8/33=24%) Partially Agreed
19. In the course of the study interviews, few of the managers concerned expressed any enthusiasm about process or process
improvement models. A far greater emphasis was placed on
product, with process often believed to be a „brake‟ on product development. The managers believed process to have a
significant cost which, in their respective companies, they
attempted to keep to a minimum. What the managers perceived as the Cost of Process centred on a number of factors and these
are represented as a network diagram in Figure 1 [11].
Managers and Inadequate Matrices: (1/33=5%)
Product Based Companies and Cumbersome
Processes: (2/33=6%)
Disagreed
20. The interview extracts above demonstrate that many of the
managers, far from being process converts, believe that many process activities are not essential and require too much time
and resource. One of the process activities that managers
consider can often delay, or hinder, product development, is Documentation [11].
Managers and Time Constraints: (15/33=45%) Agreed
21. Smaller companies, especially, feared having to allocate
people, either to write the Documentation in the first place, or to manage it on an ongoing basis [11].
Small Companies and Documentation: (6/33=18%)
Disagreed
22. Significantly, the resources required to implement SPI are
proportionately much greater in smaller companies, and those smaller companies intent on, firstly, survival and then stability,
have many competing and higher priorities than SPI [11].
Small Companies and Tools & Technologies:
(3/33=10%) Disagreed
23. As all of the study companies, at time of interview, fell into the
EU-defined SME category, it is therefore perhaps not surprising that they would reflect greater hostility to SPI models that
required them to divert resources from what they would
perceive as more deserving activities. For many of the interviewees, SPI creates an additional burden or weight to
their development efforts resulting in increased Documentation
and Bureaucracy [11].
SME and Incompetent Staff (16/33=50%)
SME and Simultaneous Focus on Many
Improvement Areas (10/33=30%)
Agreed
24. Small software companies, in the first instance, focus
exclusively on survival. This, in part, explains the success of
agile methodologies whose „light‟, non-bureaucratic techniques support companies in survival mode attempting to establish
good, fundamental software development practices [11].
Small Companies and Lack of defined SPI Implementation Methodology: (6/33=18%)
Small Companies and Inadequate Matrices: (2/33=6%)
Disagreed
11) Common Critical Issues in Literature and this Survey:

(IJACSA) International Journal of Advanced Computer Science and Applications,
Vol. 7, No. 2, 2016
503 | P a g e
www.ijacsa.thesai.org
Fig. 18. Common Issues
12) SPI Practitioners perspective on Mitigating Issues In order to know the perspective of SPI Practitioners on
mitigating issues, three-step approach is adopted as follow:
a) Identification of renowned SPI practitioners
b) Conducting interviews of renowned SPI practitioners
c) Compiling and listing interview results
13) Selecting Renowned SPI Practitioners in Pakistan
Software Industry To achieve this, a thorough inspection was performed on
Pakistan Software Industry. As a result, total of five renowned SPI practitioners are approached for the interviews according to the criteria already mentioned above. These practitioners are working or have already worked in the organizations i.e, Pakistan Telecommunication Company Limited (PTCL), Siemens, National Database and Registration Authority (NADRA), Teradata and NCR.
14) Conducting interviews Interviews of the SPI practitioners were conducted with
the help of an interview questionnaire attached at Annexure D. The questionnaire is divided in two sections: 1.It contains all the issues which were exposed in the literature and which were confirmed in the initial and comprehensive survey questionnaires. 2. Open ended questions which will reveal the proposed strategy to mitigate these issues.
V. CONCLUSION & FUTURE WORK
This survey is conducted on thirty three software companies of Pakistan who have implemented CMMI. There are a total of 48 software practitioners and 4 SPI professional who have participated in this research. The survey has extended the empirical research and case studies conducted on SPI Issues in other parts of the world. It has revealed more Issues which were missing in past articles. The analysis has
revealed that Issues such as Time & Budget Constraints and Cultural Issues are on the top priority among all respondents. Whereas, there have been differences in responses among respondents with different job functions as the top management is mostly disagreed to all Issues. Surprisingly, most of the respondents with Middle and Lower Management agree with the existence of these Issues in the IT Industry and feel the need to mitigate them in order to successfully implement SPI initiative in their organizations.
A Model to tackle with these Issues has also been proposed after analyzing the results of the data gathered from the survey. The model has been tested regarding its reliability using SPSS‟s AMOS showing Cronbach‟s Alpha value above 0.7 which is required to keep the reliability intact among the elements in the Model. This Model can assist software practitioners to implement CMMI-based SPI not only in the Pakistan software industry but also in other under-developed countries.
The future work of this research is an implementation of the Model proposed, and the extension of this work i.e., Issues of SPI focusing CMMI Model only in other parts of the world. The differences between this research and the future research will in fact serve as the improvements in the Model and will lead it to perfection.
REFERENCES
[1] “Annual Review of Pakistan‟s Software/BPO Industry 2007: Executive Summary”.
[2] Kashif Manzoor: The Challenge of Implementing Capability Maturity Model (CMM) in Pakistan- Feb 2002
[3] Nathan Baddoo, Tracy Hall : “Issues for SPI: A Practitioners‟ View”. University of Hertfordshire, UK. 2002
[4] Watts Humphrey Introduction to the Personal Software Process Addison-Wesley 1997 ISBN 352-762-875-3
[5] Gleison Santos, Marcos Kalinowski,Ana Regina Rocha, Guilherme Horta Travassos, Kival Chaves Weber, José Antonio Antonioni :
Issues Issues
“Common” “Survey”
Budget Constraints
Inadequate Communication
Time Constraints
Cultural Issues
Tools and Technologies
Issues
“Literature”
Tools & Technologies -Budget Constraints
Excessive Documentation -Communication
Inadequate Communication -Time Constraints
Commitment/Requirements
Budget Constraints
Lack of Training

(IJACSA) International Journal of Advanced Computer Science and Applications,
Vol. 7, No. 2, 2016
504 | P a g e
www.ijacsa.thesai.org
MPS.BR: A Tale of Software Process Improvement and Performance Results in the Brazilian Software Industry - © 2010 IEEE
[6] Bernard Wong, Sazzad Hasan, May 10, 2008, “Cultural Influences and Differences in Software Process Improvement Programs”. Leipzig, Germany.
[7] Mahmood Niazi, Muhammad Ali Babar, 2007, “Motivators of Software Process Improvement: An Analysis of Vietnamese Practitioners‟ Views”. Keele University UK, 11th International Conference on EASE, Springerlink.
[8] Mohd Hairul Nizam Md Nasir, Rodina Ahmad, Noor Hafizah Hassan,
2008, “Resistance Factors in Implementation of Software Process Improvement Project in Malaysia”, ISSN 1549-3636, IEEE.
[9] Sarah Beecham, Tracy Hall & Austen Rainer, Software process improvement problems in Twelve Software Companies: An empirical Analysis, SCB/Problem paper, University of Hertfrodshire,UK.
[10] Deepti Mishra and Alok Mishra, “Software Process Improvement in SMEs: A Comparative View”, Atillim University, Ankara, Turkey.
[11] Rory V O‟Conner, Gerry Coleman, “An Investigation of Barriers to the Adoption of Software Process Best Practice Models”, Australasian Conference on Information Systems, Ireland.