issues facing rural schools in wisconsin - home ... facing rural schools in wisconsin most kids...
TRANSCRIPT

Issues Facing Rural Schools
in Wisconsin

Most Kids Attend Public School…
829,320
29,298
8,412
6,964
26,509
93,500
Public Schools(Home District)
Charter Schools
Independent (2r)Charters
VirtualCharter Schools
Voucher Schools
Private Schools(Tuition-Paying)
0 500,000 1,000,000
Overall Enrollment
(2013-14)
Public Schools:
875,000
Private Schools:
120,000
Source: Department of Public Instruction. Public School
Enrollment Data http://lbstat.dpi.wi.gov/lbstat_pubdata3
Private School Enrollment Data
http://lbstat.dpi.wi.gov/lbstat_privdata

Poverty is Growing in WI… Change in Free & Reduced Lunch (2001-2012)
Source: Wisconsin Department of
Public Instruction. School Finance
Maps. http://dpi.wi.gov/sfs/maps.html
In many rural
districts, more
than half the
students are
eligible for
free-and-
reduced lunch.
Wisconsin
FRL Rate
Doubles
2001: 21%
2012: 43%

And so are the # of Homeless Kids…
Source: Wisconsin Department of Public Instruction. Homeless Children and Youth data: http://homeless.dpi.wi.gov/hmls_data
5,3
54
6,3
84
7,8
64
8,0
69
9,3
24
10
,94
9
12
,02
7
13
,36
4
15
,50
4
16
,70
9
-
2,000
4,000
6,000
8,000
10,000
12,000
14,000
16,000
18,000
20,000
Homeless Children & Youth In Wisconsin Schools
Half of Wisconsin’s
homeless kids can be found
in just 10 school districts.
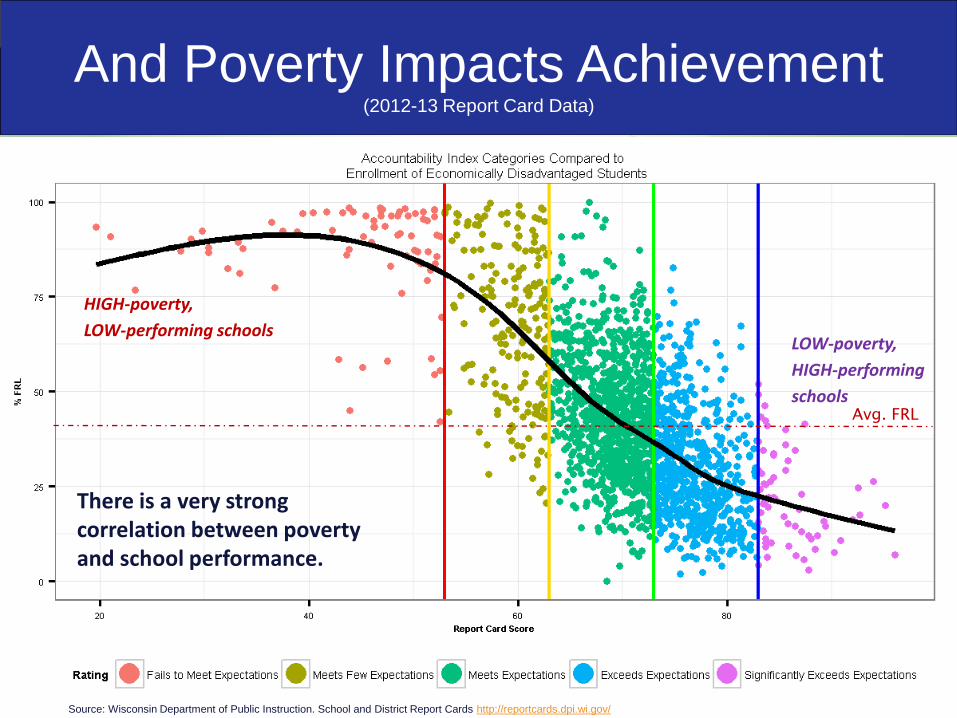
And Poverty Impacts Achievement (2012-13 Report Card Data)
There is a very strong correlation between poverty and school performance.
Avg. FRL
HIGH-poverty,
LOW-performing schools LOW-poverty,
HIGH-performing
schools
Source: Wisconsin Department of Public Instruction. School and District Report Cards http://reportcards.dpi.wi.gov/

Students are in Fewer Districts Change Student Membership (2001-2012)
In 2001, 1/3rd of districts were in declining
enrollment.
By 2012, over 2/3rds districts were in
declining enrollment.
Today, 75% of our students are located in
just 30% of our districts.
Wisconsin
FRL Rate
Doubles
2001: 21%
2012: 43% Cumulative
Enrollment Percentile # of
Districts % of
Districts
209,535 25% 8 2%
419,387 50% 41 11%
626,834 75% 114 30%
871,551 100% 424 100%
Source: Wisconsin Department of Public Instruction. School Finance Maps. http://dpi.wi.gov/sfs/maps.html
District Enrollment % of Districts
Under 1,000 55%
Under 3,000 83%
Under 10,000 98%

Which Means Rural Districts Have
Fewer Kids & Greater Poverty
Wisconsin
FRL Rate
Doubles
2001: 21%
2012: 43%
Source: Wisconsin Department of Public Instruction. School Finance Maps. http://dpi.wi.gov/sfs/maps.html
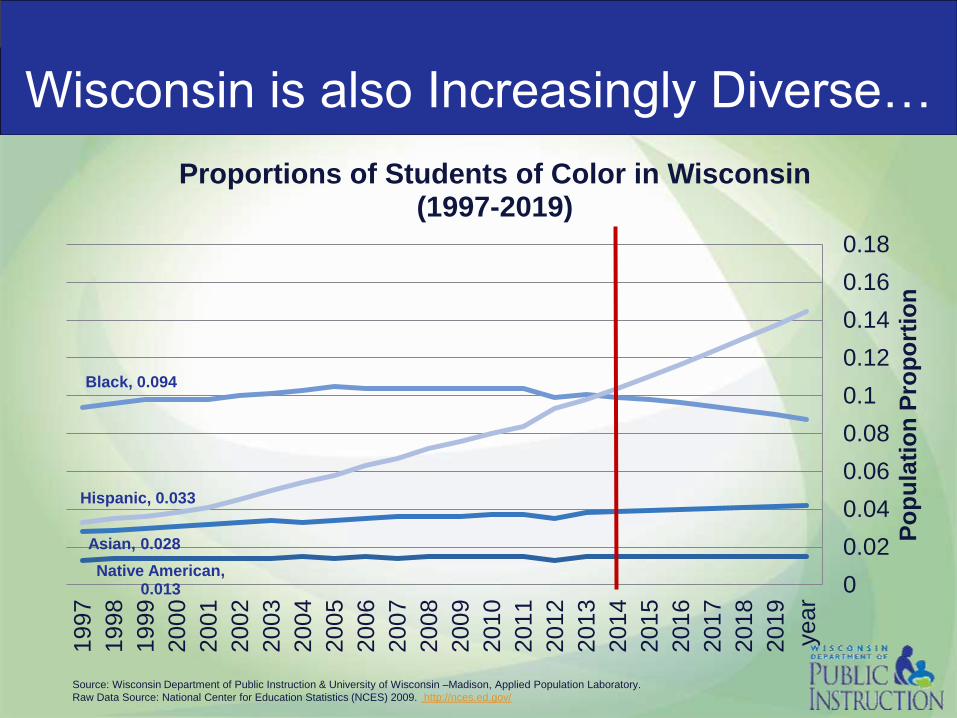
Wisconsin is also Increasingly Diverse…
Source: Wisconsin Department of Public Instruction & University of Wisconsin –Madison, Applied Population Laboratory.
Raw Data Source: National Center for Education Statistics (NCES) 2009. http://nces.ed.gov/
Native American, 0.013
Asian, 0.028
Black, 0.094
Hispanic, 0.033
0
0.02
0.04
0.06
0.08
0.1
0.12
0.14
0.16
0.18
yea
r
2019
2018
2017
20
16
2015
2014
2013
2012
2011
2010
2009
2008
2007
2006
2005
2004
2003
2002
2001
2000
1999
1998
1997
Po
pu
lati
on
Pro
po
rtio
n
Proportions of Students of Color in Wisconsin (1997-2019)
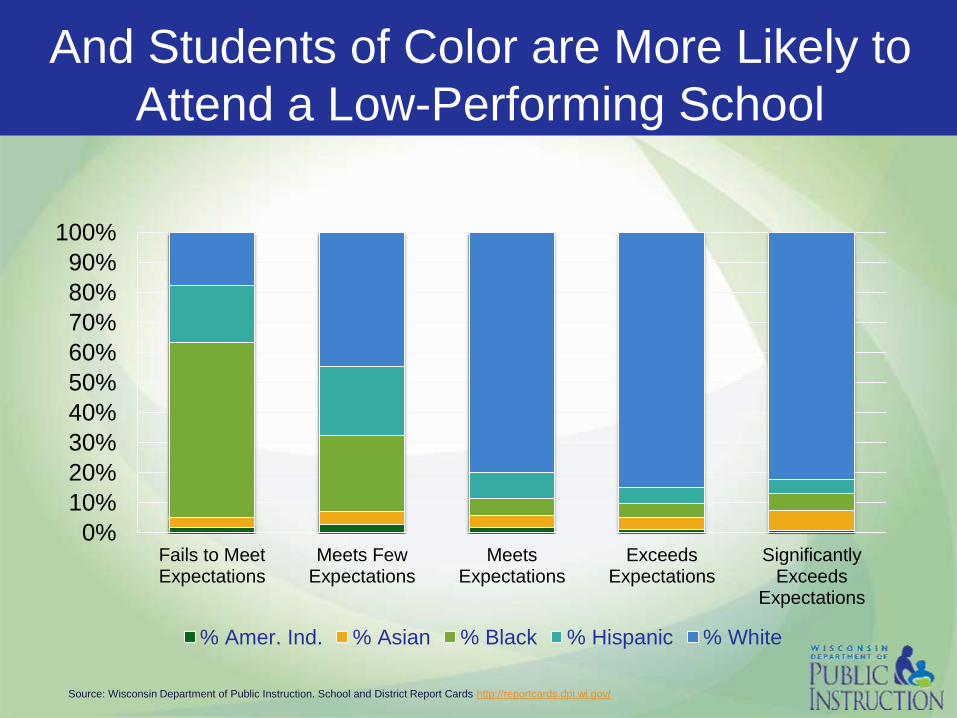
And Students of Color are More Likely to
Attend a Low-Performing School
0%
10%
20%
30%
40%
50%
60%
70%
80%
90%
100%
Fails to MeetExpectations
Meets FewExpectations
MeetsExpectations
ExceedsExpectations
SignificantlyExceeds
Expectations
% Amer. Ind. % Asian % Black % Hispanic % White
Source: Wisconsin Department of Public Instruction. School and District Report Cards http://reportcards.dpi.wi.gov/

…And Rural Schools Face
Specific Challenges
Declining enrollment;
Growing poverty;
Staff shortages;
Insufficient broadband
infrastructure;
Higher transportation costs; and
Increasing numbers of
English Language Learners (ELL).
Small schools have less economy of scale, making technology and
infrastructure investments more expensive (fewer students to absorb costs).
Rural districts generally have fewer support staff and administrators (the
superintendent often is a principal and business administrator), meaning there
fewer staff to implement state and federal initiatives.
Rural educators often receive lower compensation and wear many hats,
requiring high levels of certification and commitment.
SCHOOL FINANCE
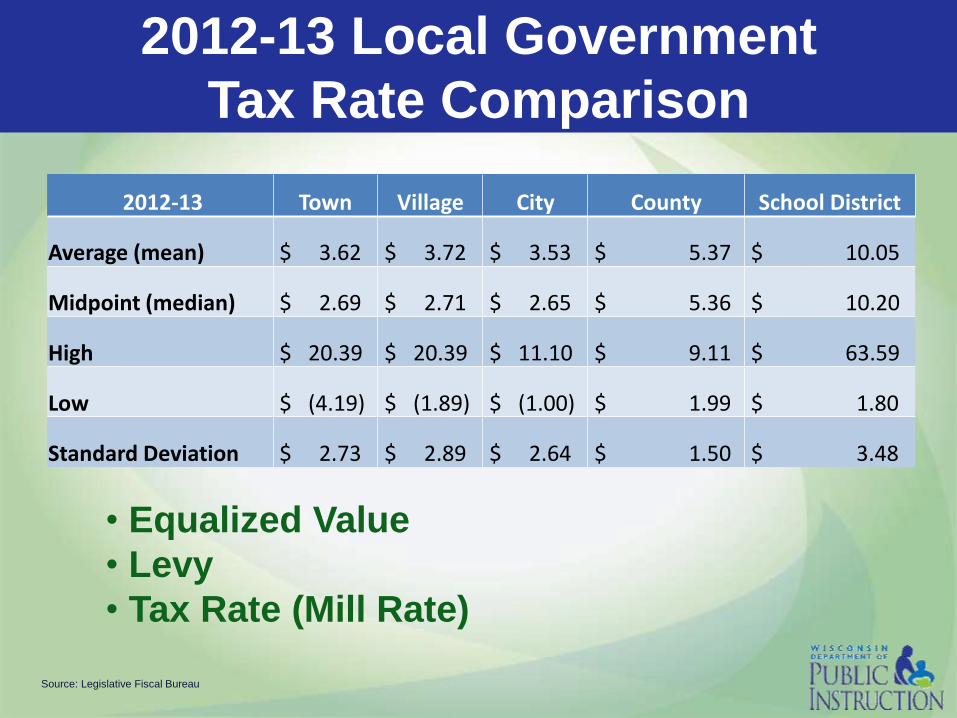
2012-13 Local Government
Tax Rate Comparison
Source: Legislative Fiscal Bureau
2012-13 Town Village City County School District
Average (mean) $ 3.62 $ 3.72 $ 3.53 $ 5.37 $ 10.05
Midpoint (median) $ 2.69 $ 2.71 $ 2.65 $ 5.36 $ 10.20
High $ 20.39 $ 20.39 $ 11.10 $ 9.11 $ 63.59
Low $ (4.19) $ (1.89) $ (1.00) $ 1.99 $ 1.80
Standard Deviation $ 2.73 $ 2.89 $ 2.64 $ 1.50 $ 3.48
• Equalized Value
• Levy
• Tax Rate (Mill Rate)

Referenda Overview
Source: Legislative Fiscal Bureau
Overall
Passed 1,423 52%
Failed 1,328 48%
Total 2,751
Debt
Passed 955 54%
Failed 800 46%
Total 1,755
Non- recurring
Passed 314 56%
Failed 242 44%
Total 556
Recurring
Passed 154 35%
Failed 286 65%
Total 440
2,751 school
district
referenda
have been
conducted
since 1992

Category % of State Budget
1. K-12 General and Categorical School Aids ($5.2 billion) 32.4%
2. Medical Assistance 15.1%
3. University of Wisconsin System Operations 7.0%
4. State Correctional Operations 6.4%
5. School Levy/First Dollar Tax Credits ($897.4 million) 5.6%
6. Shared Revenue Payments (Aid to Municipalities) 5.3%
7. Technical College System Aids 3.2%
8. Appropriation Obligation Bonds 2.5%
9. Local Community/Juvenile Correctional Services 1.9%
10. State Judicial/Legal Services 1.6%
Everything else (agency operations, choice programs, etc.) 19%
Ten Largest State Programs (General Fund)
Source: Legislative Fiscal Bureau
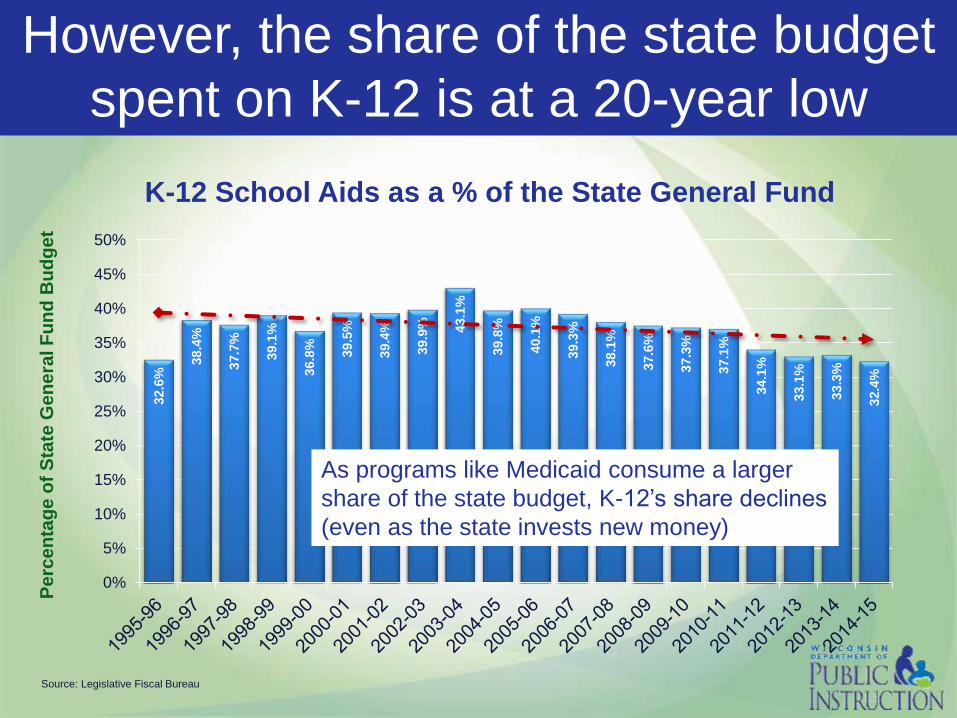
However, the share of the state budget
spent on K-12 is at a 20-year low 32.6
% 3
8.4
%
37.7
%
39.1
%
36.8
%
39.5
%
39.4
%
39.9
%
43.1
%
39.8
%
40.1
%
39.3
%
38.1
%
37.6
%
37.3
%
37.1
%
34.1
%
33.1
%
33.3
%
32.4
%
0%
5%
10%
15%
20%
25%
30%
35%
40%
45%
50%
Pe
rce
nta
ge
of
Sta
te G
en
era
l F
un
d B
ud
ge
t
K-12 School Aids as a % of the State General Fund
Source: Legislative Fiscal Bureau
As programs like Medicaid consume a larger
share of the state budget, K-12’s share declines
(even as the state invests new money)

2012-13 Wisconsin School Revenue
Local (Property
Tax) $4.6 Billion
43%
State $4.8 Billion
45%
Federal $0.8 Billion
8%
Other Revenue
$0.4 Billion 4%
Revenue $10.7 Billion
• 88% of schools’
funds come from
state and local
sources.
• State and local
funding efforts
are roughly split
50-50.
Source: Wisconsin Department of Public Instruction. School District Revenue Limits http://sfs.dpi.wi.gov/sfs_revlim
2013-15 State Budget. http://news.dpi.wi.gov/news_2013-15-state-budget-information
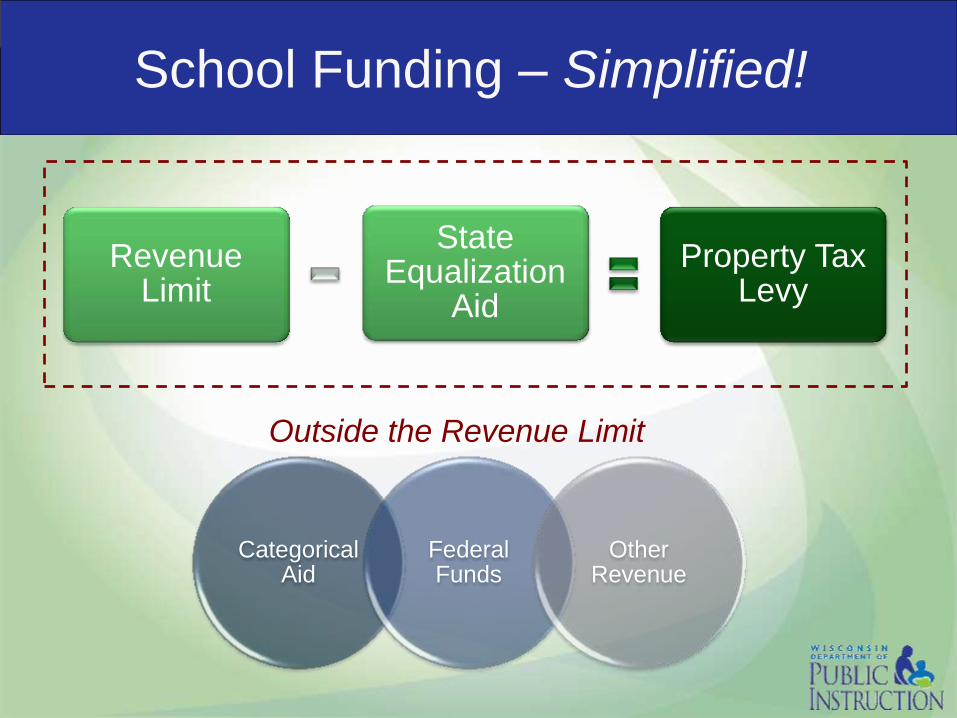
School Funding – Simplified!
Property Tax Levy
State Equalization
Aid
Revenue Limit
Categorical Aid
Federal Funds
Other Revenue
Outside the Revenue Limit

During the Great Recession,
Revenue Limits Were Cut …
$(600)
$(500)
$(400)
$(300)
$(200)
$(100)
$-
$100
$200
$300
$400
Change in Per-Pupil Revenue Over Time
Pep-Pupil Aid Revenue Limit Change
Source: Department of Public Instruction. 2011-13 State Budget. http://pb.dpi.wi.gov/pb_11-13_budget
2013-15 State Budget. http://news.dpi.wi.gov/news_2013-15-state-budget-information
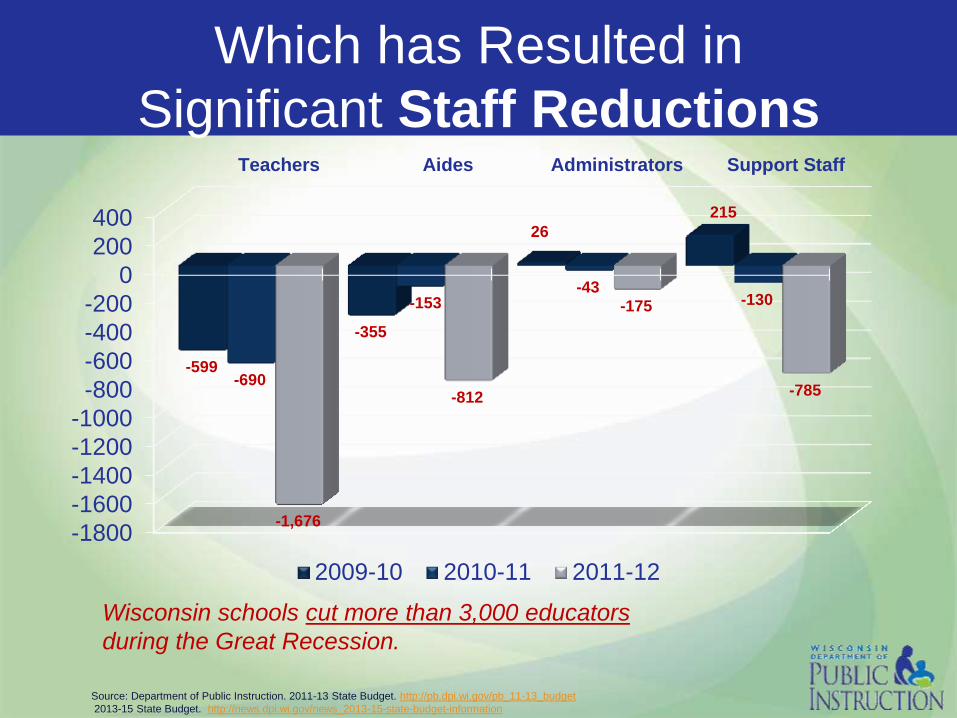
Which has Resulted in
Significant Staff Reductions
-1800
-1600
-1400
-1200
-1000
-800
-600
-400
-200
0
200
400
Teachers Aides Administrators Support Staff
-599
-355
26
215
-690
-153 -43
-130
-1,676
-812
-175
-785
2009-10 2010-11 2011-12
Wisconsin schools cut more than 3,000 educators
during the Great Recession.
Source: Department of Public Instruction. 2011-13 State Budget. http://pb.dpi.wi.gov/pb_11-13_budget
2013-15 State Budget. http://news.dpi.wi.gov/news_2013-15-state-budget-information
STATEWIDE VOUCHERS
EXPANSION
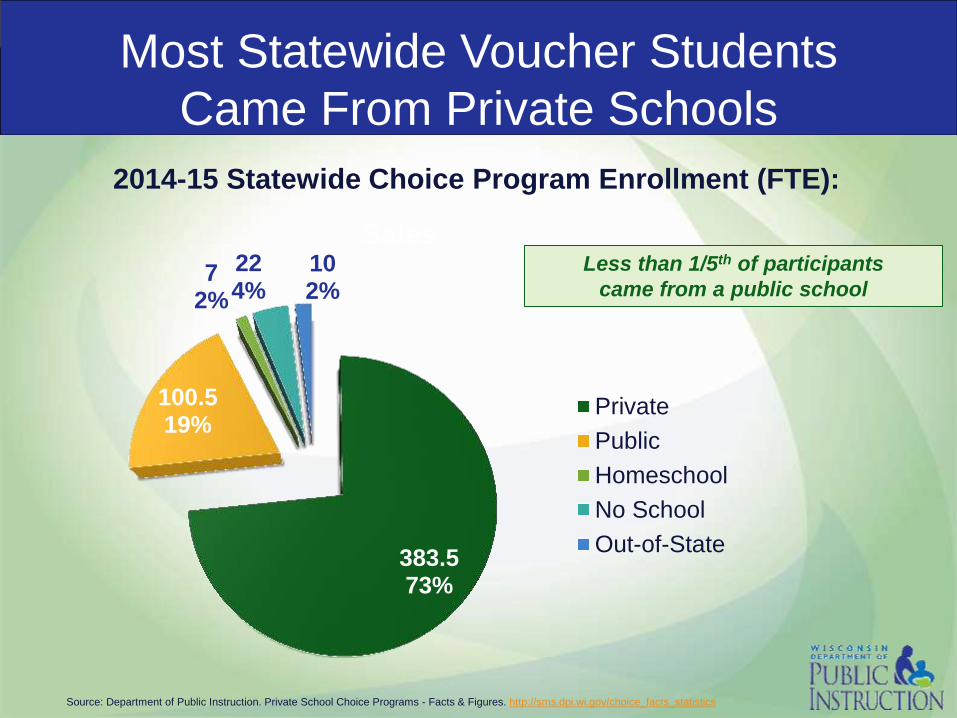
Most Statewide Voucher Students
Came From Private Schools
383.5 73%
100.5 19%
7 2%
22 4%
10 2%
Sales
Private
Public
Homeschool
No School
Out-of-State
2014-15 Statewide Choice Program Enrollment (FTE):
Less than 1/5th of participants
came from a public school
Source: Department of Public Instruction. Private School Choice Programs - Facts & Figures. http://sms.dpi.wi.gov/choice_facts_statistics
0%
10%
20%
30%
40%
50%
60%
70%
80%
90%
100%
1 3 5 7 9
11
13
15
17
19
21
23
25
27
29
31
33
35
37
39
41
43
45
47
49
51
53
55
57
59
61
63
65
67
69
71
73
75
77
79
81
83
85
87
89
91
93
95
97
99
101
103
105
107
109
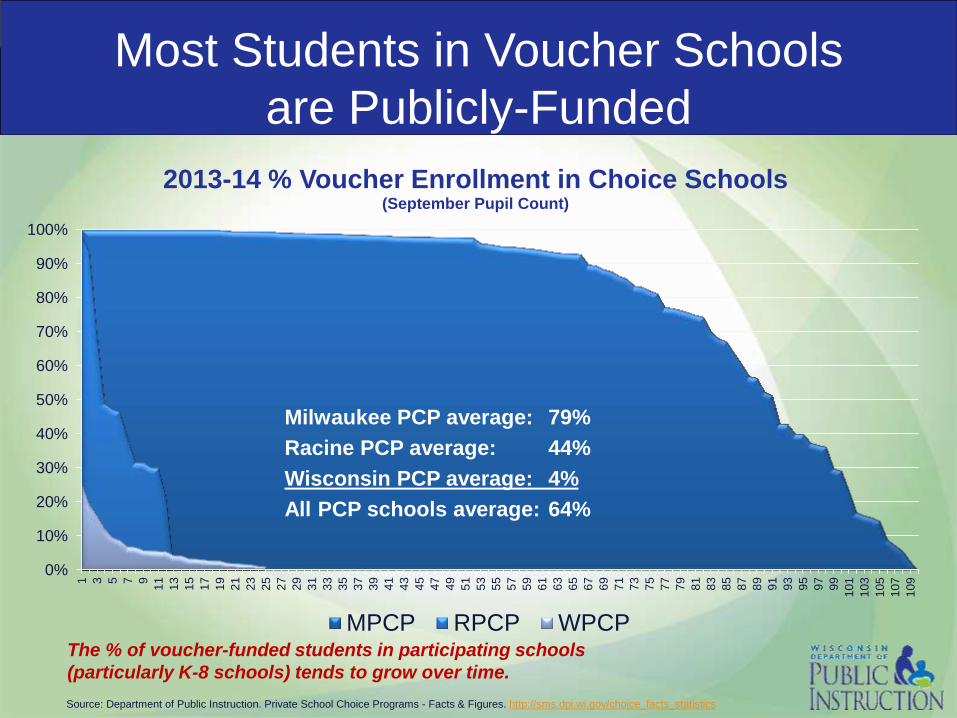
2013-14 % Voucher Enrollment in Choice Schools (September Pupil Count)
MPCP RPCP WPCP
Most Students in Voucher Schools
are Publicly-Funded
Milwaukee PCP average: 79%
Racine PCP average: 44%
Wisconsin PCP average: 4%
All PCP schools average: 64%
The % of voucher-funded students in participating schools
(particularly K-8 schools) tends to grow over time.
Source: Department of Public Instruction. Private School Choice Programs - Facts & Figures. http://sms.dpi.wi.gov/choice_facts_statistics
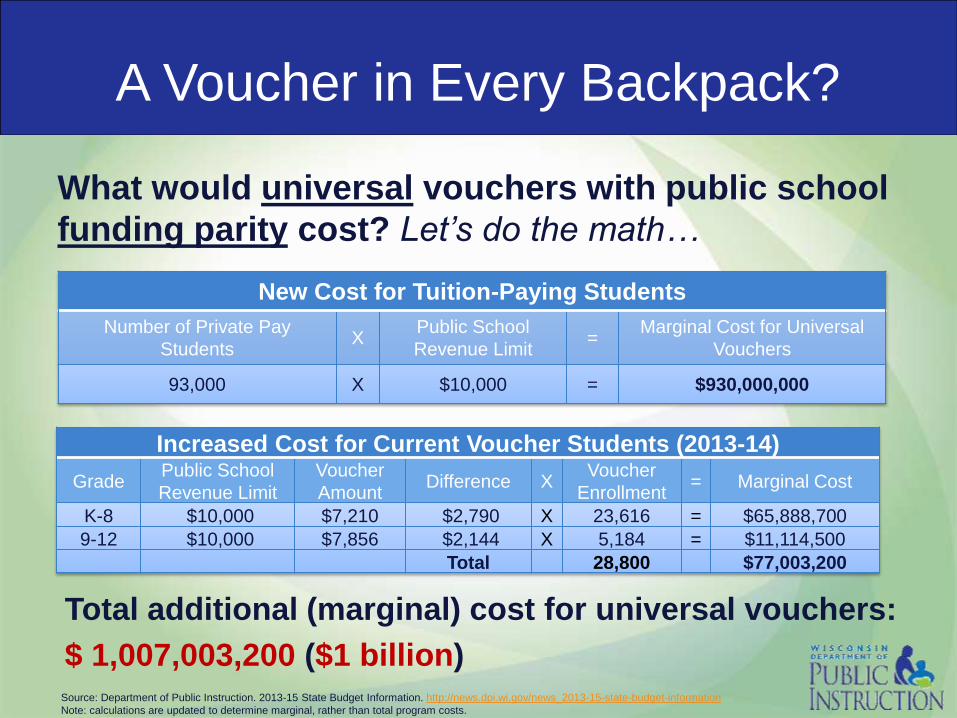
A Voucher in Every Backpack?
What would universal vouchers with public school
funding parity cost? Let’s do the math…
New Cost for Tuition-Paying Students
Number of Private Pay
Students X
Public School
Revenue Limit =
Marginal Cost for Universal
Vouchers
93,000 X $10,000 = $930,000,000
Increased Cost for Current Voucher Students (2013-14)
Grade Public School
Revenue Limit
Voucher
Amount Difference X
Voucher
Enrollment = Marginal Cost
K-8 $10,000 $7,210 $2,790 X 23,616 = $65,888,700
9-12 $10,000 $7,856 $2,144 X 5,184 = $11,114,500
Total 28,800 $77,003,200
Total additional (marginal) cost for universal vouchers:
$ 1,007,003,200 ($1 billion)
Source: Department of Public Instruction. 2013-15 State Budget Information. http://news.dpi.wi.gov/news_2013-15-state-budget-information
Note: calculations are updated to determine marginal, rather than total program costs.

IS THERE A BETTER WAY
FORWARD FOR ALL KIDS?

Agenda 2017: Every Child a Graduate
College & Career Ready
Standards & Instruction
– What and how should kids learn?
• Common Core State Standards
Assessments and Data Systems
– How do we know if they learned it?
• Next Generation Assessments
Accountability
– How do we support improvement?
• Personalized learning, RtI & PBIS
• New educator effectiveness system
• Accountability system reform
School Finance
– How should we pay for schools?
• Fair Funding for our Future
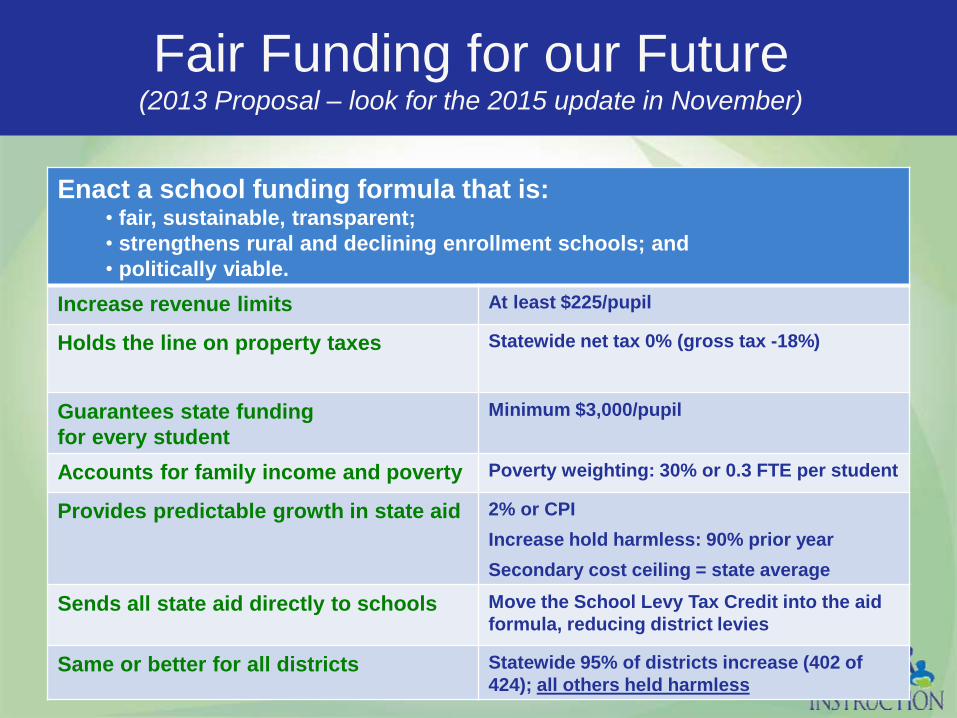
Fair Funding for our Future (2013 Proposal – look for the 2015 update in November)
Enact a school funding formula that is: • fair, sustainable, transparent;
• strengthens rural and declining enrollment schools; and
• politically viable.
Increase revenue limits At least $225/pupil
Holds the line on property taxes
Statewide net tax 0% (gross tax -18%)
Guarantees state funding
for every student
Minimum $3,000/pupil
Accounts for family income and poverty Poverty weighting: 30% or 0.3 FTE per student
Provides predictable growth in state aid 2% or CPI
Increase hold harmless: 90% prior year
Secondary cost ceiling = state average
Sends all state aid directly to schools
Move the School Levy Tax Credit into the aid
formula, reducing district levies
Same or better for all districts Statewide 95% of districts increase (402 of
424); all others held harmless
Legislative Efforts
Recent legislative proposals:
• Fair Funding School Finance Proposal (Evers’ 2013-15 State Budget proposal)
• Voucher School Report Cards (Passed) (2013 SB 286 – Sen. Olsen, Rep. Kestell)
• Increasing Special Education &
Sparsity Reimbursement Rates (2013 AB 772 – Rep. Mason; 2013 AB 834 Rep. Clark)
• Pre-Accreditation for Voucher Schools
(Passed) (2013 SB 584 – Sen. Vukmir)
• Rural Teacher Loan Forgiveness (2013 AB 817 – Rep. Wright)
• Restoring 2/3rds State Funding (2009 AB 919 – Reps. Davis, Strachota, Brooks,
Honadel, Kestell, Kleefisch, Knodl, LeMahieu, Lothian,
Townsend and Vos)