issues in the measurement of well-being economics and psychology masters course andrew e. clark...
TRANSCRIPT
Issues in the Measurement of Well-being
Economics and Psychology Masters Course
Andrew E. Clark (Paris School of Economics and IZA)http://www.parisschoolofeconomics.com/clark-andrew/

2
Three concepts of well-being• Objective list – decided from “up above”
– Meet material, social and psychological needs
– Rights, economic resources, health, political freedom, freedom of thought, etc
• Preference satisfaction / desire fulfilment– Individuals get what they want (role of resources)
• Mental state– Hedonistic accounts; evaluative accounts
– ‘Subjective’ well-being
– Experienced utility
3
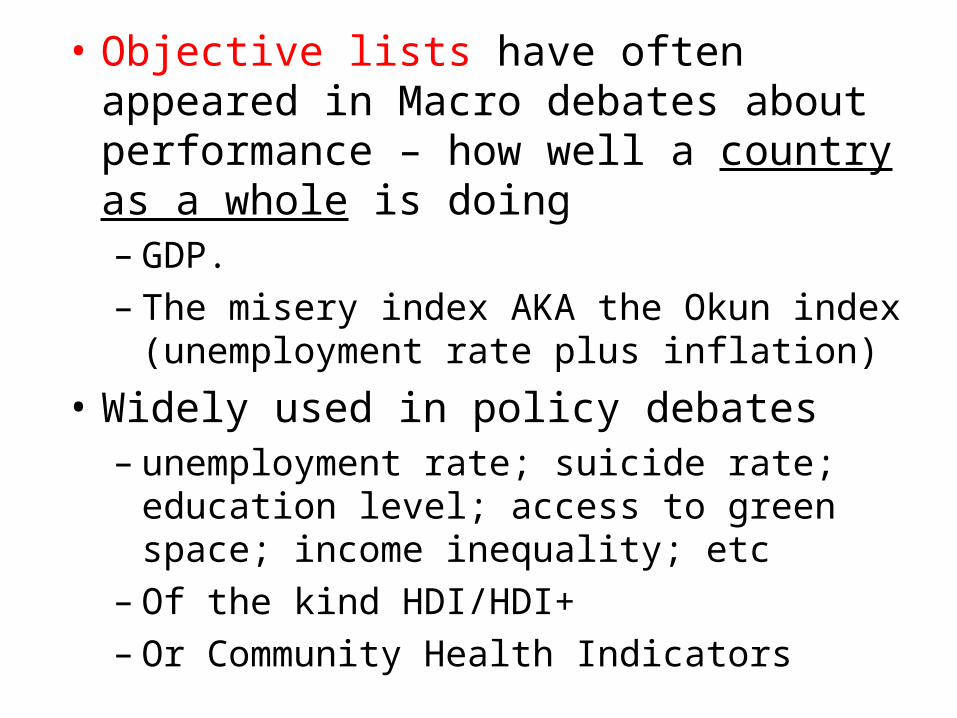
• Objective lists have often appeared in Macro debates about performance – how well a country as a whole is doing– GDP.– The misery index AKA the Okun index
(unemployment rate plus inflation)
• Widely used in policy debates– unemployment rate; suicide rate; education level;
access to green space; income inequality; etc– Of the kind HDI/HDI+– Or Community Health Indicators

4
• Which is not to say that there are no concerns about such nice “list” measures:– What should be on the list?– How can the items be compared?– Are the weights the same for everyone?– Paternalism: who decides?

Capabilities as a list
• Amartya Sen’s “capability approach”
• A challenge to consequentialist utilitarianism, and the Pareto criterion
• Start from a conception of what makes a good human life: people, not goods
• Capability Approach: – what people are free to do as well as what they actually do. – opportunities result from ‘capabilities’ – what you can do. – these are distinct from ‘functionings’ – what you do.

Nussbaum’s list of capabilities 1. Life: not dying prematurely2. Bodily health: good health; adequately nourished; shelter3. Bodily integrity; mobility; free from violence; choice in sex
and reproduction4. Senses, imagination, and thought: education, religion, art5. Emotions: attachments, love6. Practical reason: form conception of the good, planning of life7. Affiliation: social interaction; respect and dignity8. Other species: concern and relation to animals, plants, nature9. Play: laugh, play, enjoy recreational activities10. Control over one’s environment: political participation;
property, employment.

Human Development Index (HDI)
• Based on Sen’s idea of capabilities, added to Macro measures of performance
• Rationale: GDP per capita gives an incomplete picture of development and well-being– can be supplemented by information on the
opportunities people have
• UNDP has published the HDR every year since 1990; this includes the HDI by country.

United Nations Development Report 1990
• “Human development is a process of enlarging peoples choices. The most critical of these wide ranging choices are to live a long and healthy life, to be educated and to have access to resources needed for a decent standard of living.”
• “No one can guarantee human happiness, and the choices people make are their own concern. But the process of development should at least create a conducive environment for people, individually and collectively, to develop their full potential and to have a reasonable chance of leading productive and creative lives in accordance with their needs and interests”
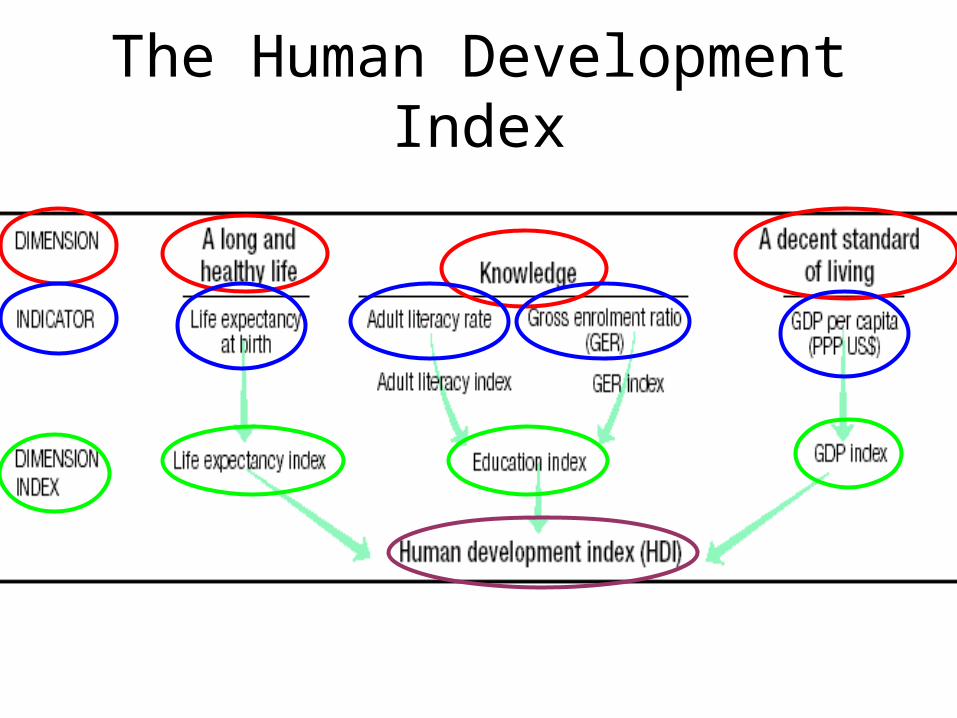
The Human Development Index

To calculate each dimension index …

Each indicator index …

HDI data from UNDR

• The last column shows that the ranking of countries by GDP per capita is not the same as that by HDI
• Some countries do better than their GDP would imply (the Scandinavians, Madagascar)
• Others do worse• The HDI adds new information to answer the
question of how well a country is doing• Despite their relatively high incomes, none of the
oil-producing countries has a high HDI


Gender-related Development Index: HDR 1995
• UNDP acknowledges key role for gender equality• development per se may not contribute to gender
equality • HDI measures average achievement• GDI adjusts to reflect male/female inequalities • Calculate dimension indices by gender• Use inequality-sensitive aggregation• Then combine into GDI.

Contruction of the GDI

Gender specific values …

“Inequality-sensitive” aggregation
• average well-being of men and women: Dm, Df
• proportion of men and women : pm, pf
• aggregate population well-being: W
• equity-neutral aggregation:
W1 = pmDm + pfDf
• equity-sensitive aggregation:
W2 = [ pmDm-r + pfDf
-r ] -1/r
• if r = -1, then W1 = W2, and thus equity neutral• if r > -1, then inequality aversion; GDI uses r = 1.

GDI data from UNDR

GDI Map
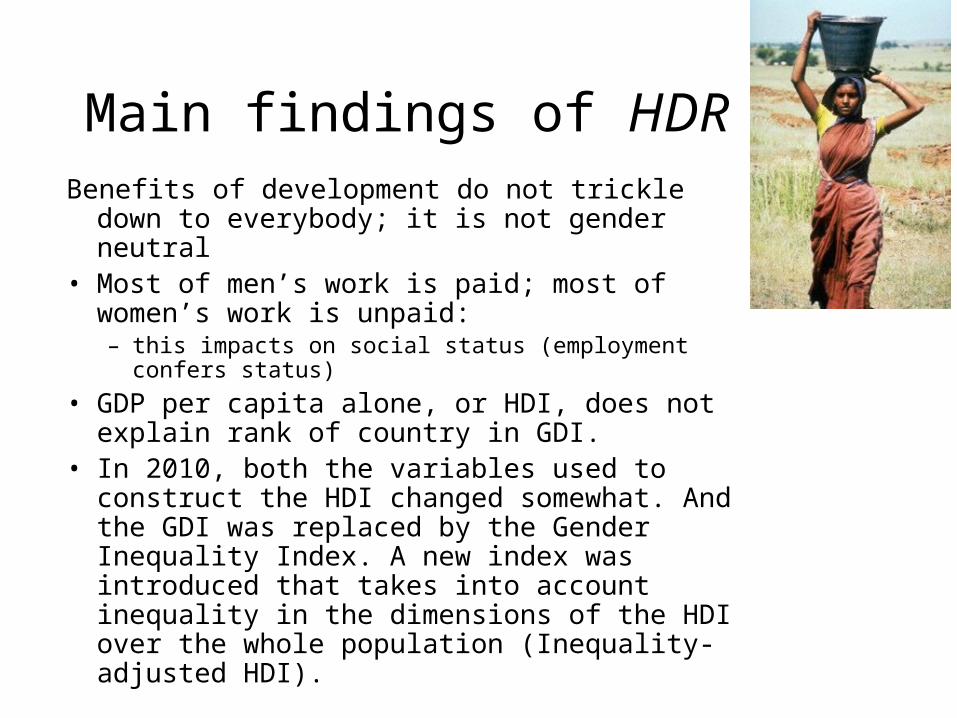
Main findings of HDR 95Benefits of development do not trickle down to
everybody; it is not gender neutral• Most of men’s work is paid; most of women’s
work is unpaid: – this impacts on social status (employment confers
status)
• GDP per capita alone, or HDI, does not explain rank of country in GDI.
• In 2010, both the variables used to construct the HDI changed somewhat. And the GDI was replaced by the Gender Inequality Index. A new index was introduced that takes into account inequality in the dimensions of the HDI over the whole population (Inequality-adjusted HDI).

22
United Nations Millennium Development Goals
http://www.undp.org/
23

24
Preference satisfaction accounts
• Well-being – the more you satisfy your preferences and fulfil your
desires the higher your well-being is considered to be.
• In line with utility theory– preferences inferred from the choices people make
• Concerns:– Do people want/know what is good for them?– What to do about “anti-social” preferences?
25
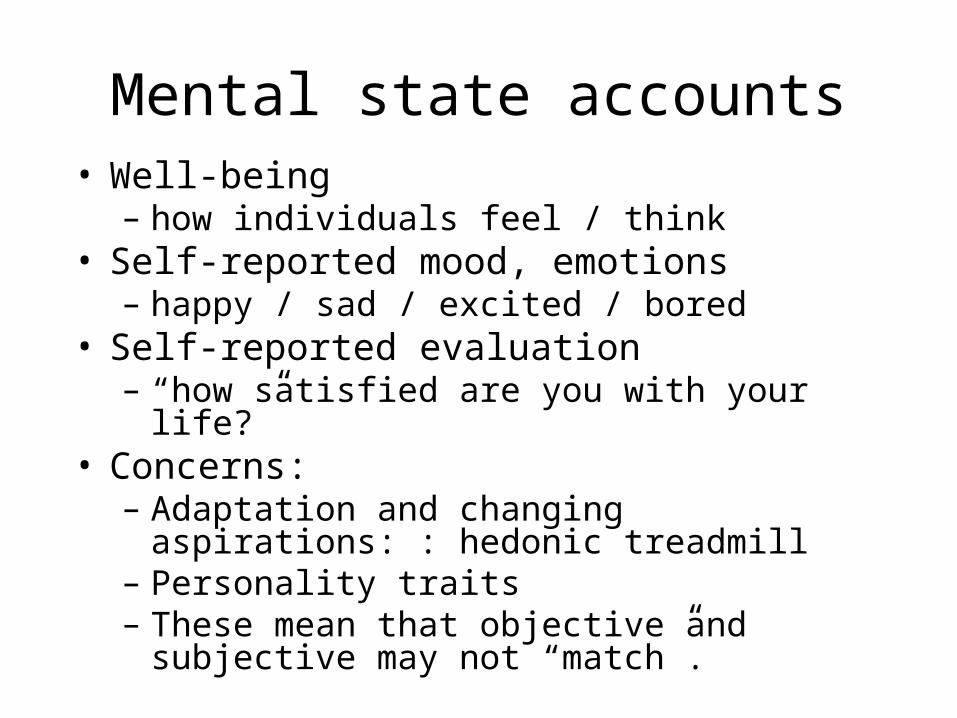
Mental state accounts• Well-being
– how individuals feel / think• Self-reported mood, emotions
– happy / sad / excited / bored• Self-reported evaluation
– “how satisfied are you with your life?”• Concerns:
– Adaptation and changing aspirations: : hedonic treadmill
– Personality traits– These mean that objective and subjective may not
“match”.
26
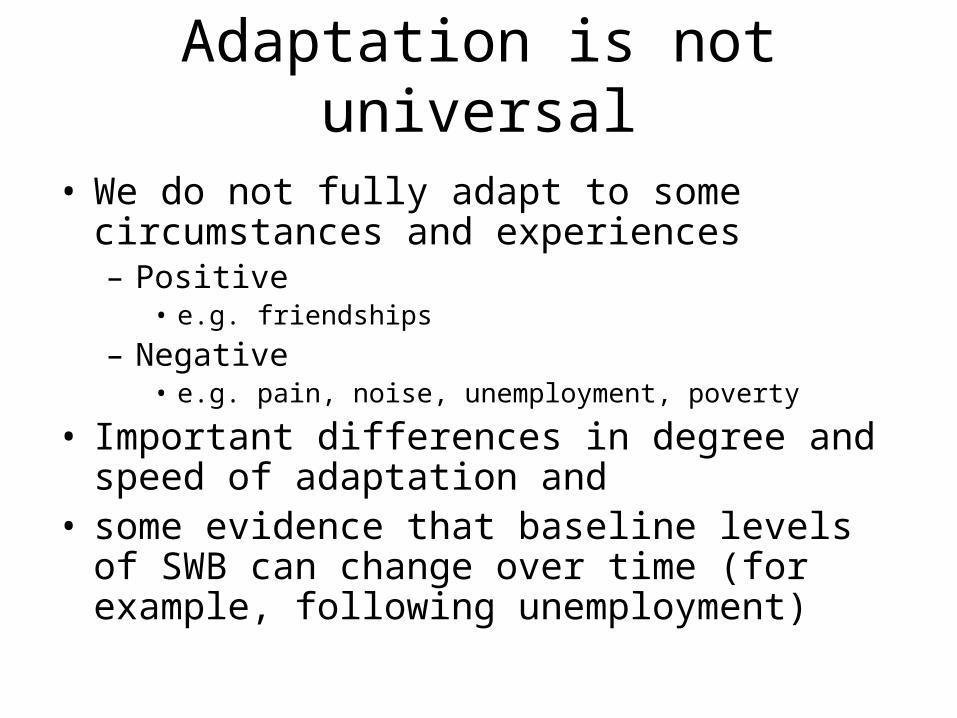
Adaptation is not universal• We do not fully adapt to some circumstances and
experiences– Positive
• e.g. friendships
– Negative • e.g. pain, noise, unemployment, poverty
• Important differences in degree and speed of adaptation and
• some evidence that baseline levels of SWB can change over time (for example, following unemployment)

27
BHPS Well-being questionsThe British Household Panel Survey (BHPS). • See <http://www.iser.essex.ac.uk/ulsc/bhps/>• Annual panel (longitudinal) survey since 1991. • Wave 18 in September 2008• Wide range of variables from same individuals
and households each year. • E.g. in Wave 12 (2002):
– N = 17,339, aged 18-85

The General Health Questionnaire 12 (GHQ-12)
Have you recently:
1. been able to concentrate
2. lost much sleep over worry
3. felt that you were playing a useful part in things
4. felt capable of making decisions
5. Felt constantly under strain
6. felt you could not overcome difficulties
7. been able to enjoy normal activities
8. been able to face up to problems
9. Been feeling unhappy and depressed
10. been Losing confidence
11. been thinking of yourself as worthless
12. been feeling reasonably happy28

Satisfaction Questions
Here are some questions about how you feel about your life. Please tick the number which you feel best describes how dissatisfied or satisfied you are with the following aspects of your current situation.
Your life overall
[ 1 ] [ 2 ] [ 3 ] [ 4 ] [ 5 ] [ 6 ] [ 7 ]not satisfied at all completely satisfied
This question is also asked about domains of life:
e.g. health, income, house, partner ...
29
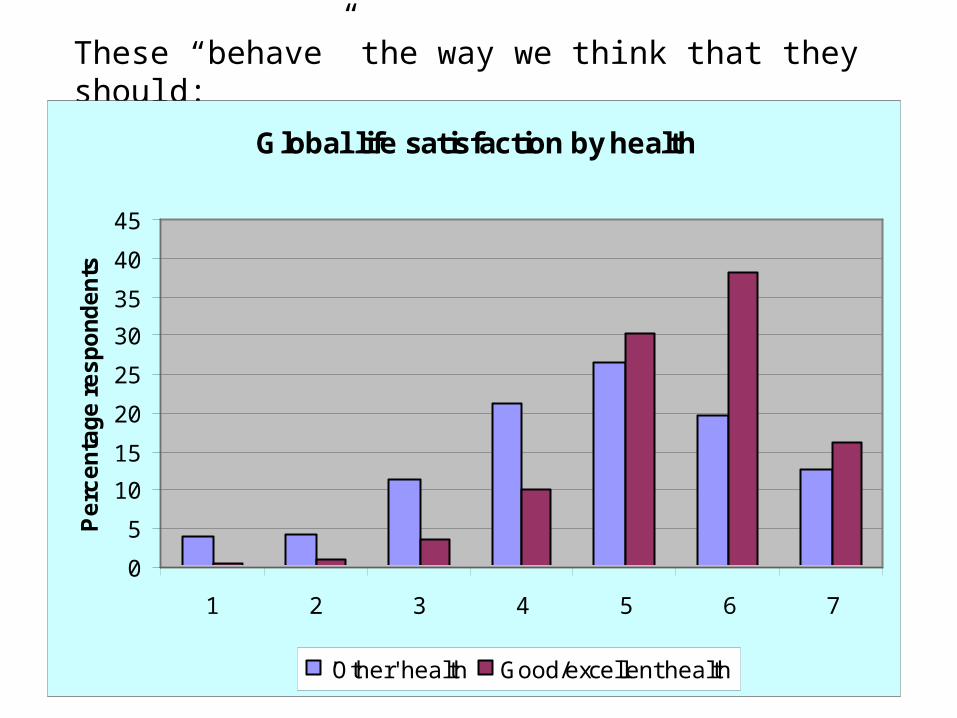
These “behave” the way we think that they should:
Global life satisfaction by health
0
5
10
15
20
25
30
35
40
45
1 2 3 4 5 6 7
Pe
rce
nta
ge
re
sp
on
de
nts
'Other' health Good/excellent health

ONS Happiness Survey Questions Revealed After becoming Conservative leader in 2005, David Cameron said gauging people's feelings was one of the "central political issues of our time"."It's time we admitted that there's more to life than money and it's time we focused not just on GDP but on GWB - general well-being," he said.
The ONS will add the subjective questions to its next annual Integrated Household SurveyThe questions will include:
Overall, how satisfied are you with your life nowadays?Overall, how happy did you feel yesterday?Overall, how anxious did you feel yesterday?Overall, to what extent do you feel the things you do in your life are worthwhile?www.bbc.co.uk/news/uk-12566965www.bbc.co.uk/news/uk-12566965
32
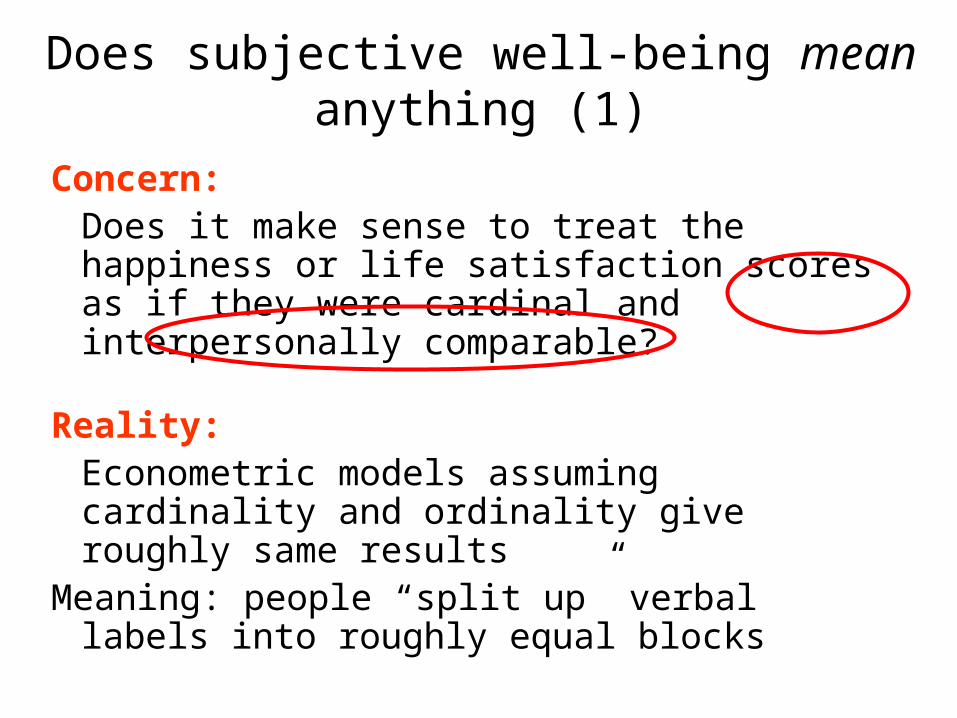
Does subjective well-being mean anything (1)
Concern:Does it make sense to treat the happiness or life satisfaction scores as if they were cardinal and interpersonally comparable?
Reality: Econometric models assuming cardinality and ordinality give roughly same results
Meaning: people “split up” verbal labels into roughly equal blocks

33
Does subjective well-being mean anything (2)Concern:
Are the life satisfaction or happiness questions reliable? Are they valid? Can people recall?
Reality:• Sensitive to wording, and question ordering.• Can be experimentally manipulated (Schwarz’s dime
on the photocopier)• But correlate well with proxies of well-being.• People are not good at recalling their own
experiences.

34
Does subjective well-being mean anything (3)
Concern:
If happiness and life satisfaction became the policy maximand, one effective intervention might be to dampen peoples’ expectations; or give out happiness pills.
Reality:
People care about the causes and processes of higher/lower life satisfaction.

35
What is “experienced utility”?• “Experienced utility”: an economists’ interpretation
of life satisfaction and happiness – a mental state account
– the level of utility that is actually felt
• cf. “decision utility” (preference satisfaction)– the level of utility that people think they will feel
– utility inferred from observed choices
• People often mis-want, or get it wrong.
• So that satisfying preferences won’t bring well-being

36
Why people mis-want
• Impact bias: overestimate impact– Focalism (too much attention to the central event)– Immune neglect (rationalise bad events)
• Projection bias: different arousal states (don’t shop when hungry)
• Distinction bias: joint/single evaluations • Memory bias: peak-end rule• Duration neglect

37
Measuring experienced utility (1-1)Experience sampling method (ESM)
• Participants carry palm top instrument.• Random selection of times of day as participant
goes about daily life.• Rating of various feelings such as “happy” or
“frustrated/annoyed”.• Record what they are doing.• Aggregate each ‘moment’ to obtain time profile
of affect.

38
Measuring experienced utility (1-2)
Advantages of ESM
• Real, experienced utility, as life events are lived.
• No bias and distortion due to recall
Disadvantages of ESM
• Costly
• Possibly disruptive (eg. while driving)

39
Measuring experienced utility (2-1)Day reconstruction method (DRM)
• Reconstruct previous day into a series of episodes
• Where, doing what, with whom• Rating of various feelings such as “happy” or
“frustrated/annoyed”.• U-index: proportion of time in negative
emotion.

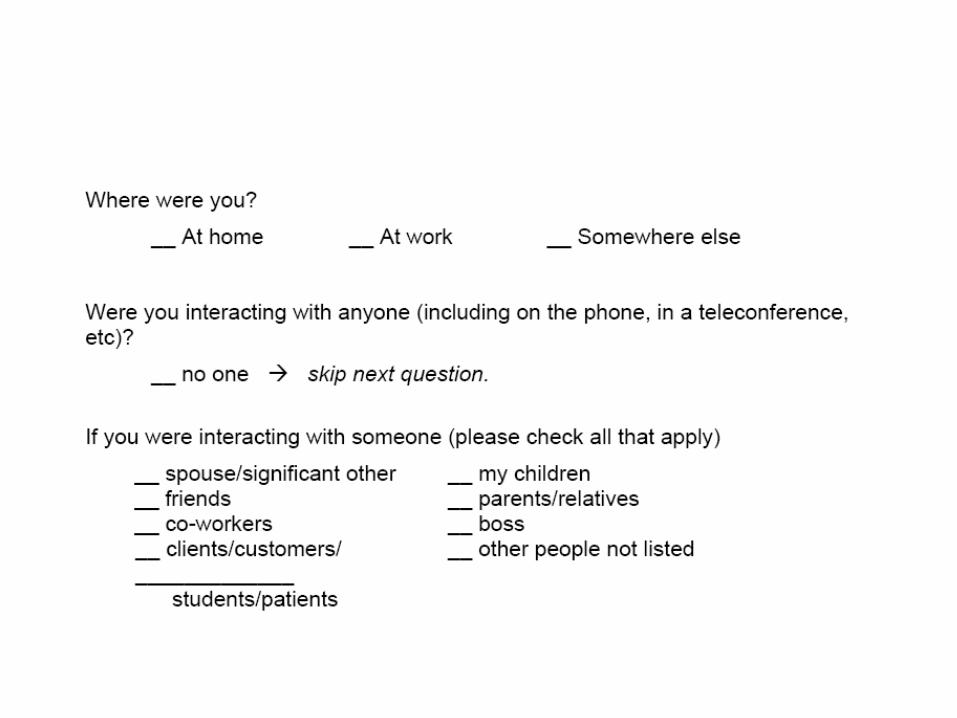
Measuring Well-being: The Day Reconstruction Method
Respondents reconstruct the previous day: like a retrospective TIME USE DIARY
Day is split into a sequence of episodes.Respondents report the key features of each
episode, including (1) When the episode began and ended(2) What they were doing(3) Where they were(4) Whom they were interacting with, and (5) how they felt on multiple affect dimensions

For each of the episodes that individuals identify during the day, they are asked the following questions:


44
Measuring experienced utility (2-2)
Advantages of DRM
• Less costly than ESM
• Does not rely on participant self perception of life domain
Disadvantages of DRM
• Element of recall: possible bias– ie. it’s not how people felt then and there
45
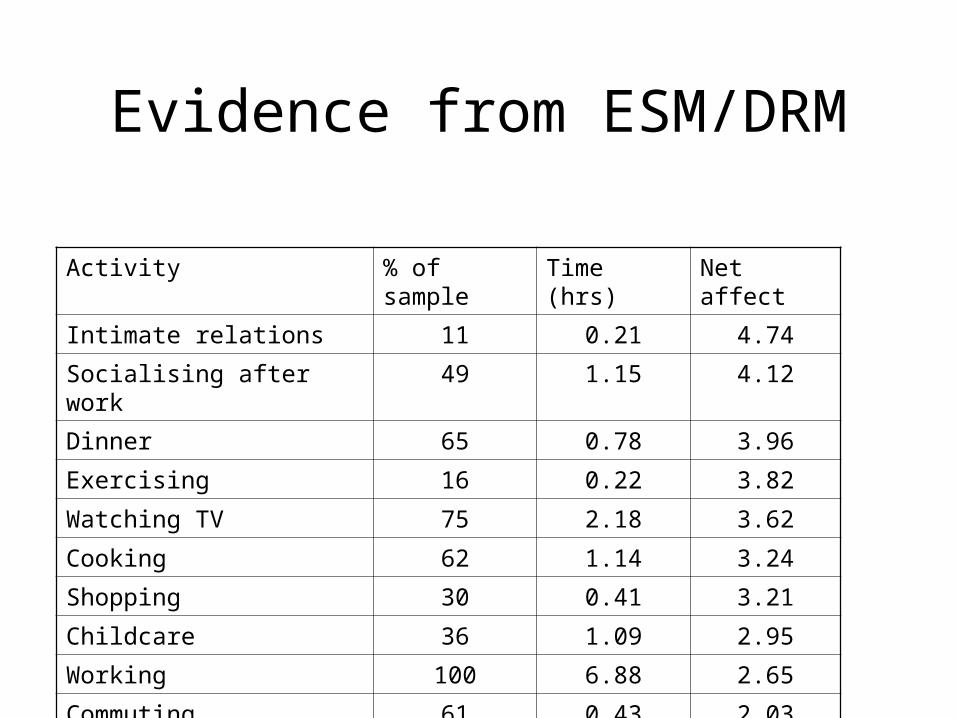
Evidence from ESM/DRM
Activity % of sample Time (hrs) Net affect
Intimate relations 11 0.21 4.74
Socialising after work 49 1.15 4.12
Dinner 65 0.78 3.96
Exercising 16 0.22 3.82
Watching TV 75 2.18 3.62
Cooking 62 1.14 3.24
Shopping 30 0.41 3.21
Childcare 36 1.09 2.95
Working 100 6.88 2.65
Commuting 61 0.43 2.03
46
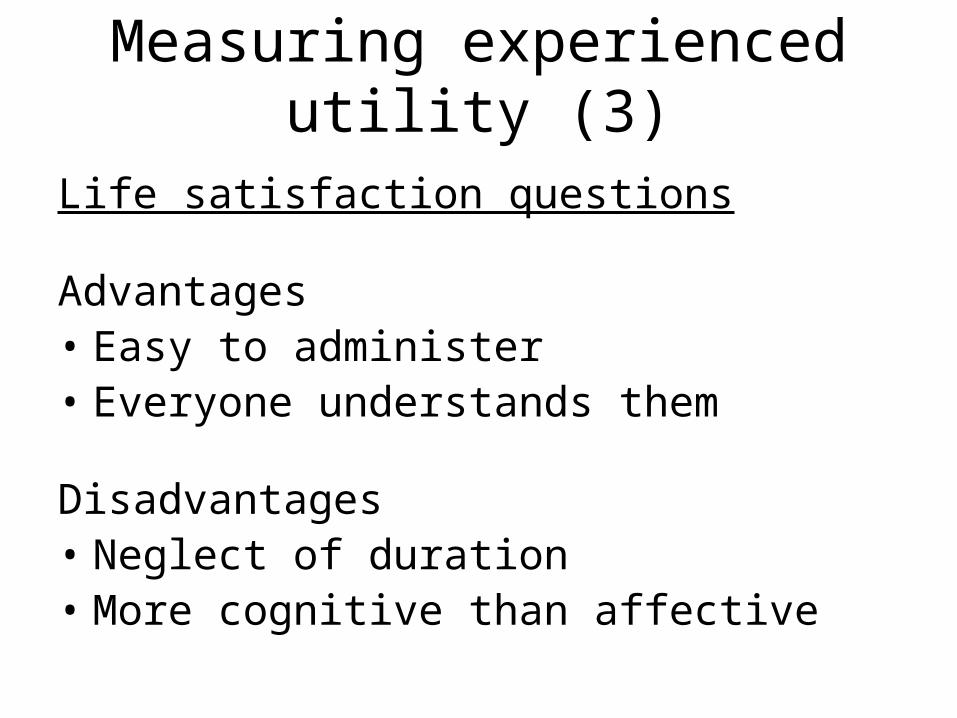
Measuring experienced utility (3)Life satisfaction questions
Advantages• Easy to administer• Everyone understands them
Disadvantages• Neglect of duration• More cognitive than affective

47
Issues with Measuring SatisfactionSocial Desirability
Possible bias if we ask individuals sensitive questions: they want to look good in front of the interviewer.
“computer-assisted self-interviewing (CASI) and self-completion (SC) paper questionnaires are generally preferred to face-to-face interviewing as a way of assuring a greater degree of confidentiality and inducing more truthful responses”
This is why the GHQ questions discussed above are a drop-off questionnaire. Self-reporting means that individuals are more likely to report their true response to questions like
“have you recently been thinking of yourself as worthless”

48
Some BHPS results, from Conti, G., and Pudney, S. (2011). "Survey design and the analysis of satisfaction". Review of Economics and Statistics, 93, 1087-1093.
• Oral interviews conducted by an interviewer tend to produce more positive reports of satisfaction than private self-completion questionnaires – the “let’s put on a good show for the interviewer” effect.
• When children are present during the interview, adult interviewees tend to give still more positive responses – the “not in front of the children” effect.
• The presence of the interviewee’s partner during the interview tends to depress the level of reported satisfaction – the “don’t show your partner how satisfied you are” effect, which we speculate may have something to do with the desire to maintain a strong bargaining position within the relationship.

49
Issues with Measuring Satisfaction
Which response scale?
Even if the question is a good one, on what scale would we want them to respond?
A satisfaction question can be answered on a three-point scale, a four-point scale, etc.
May want an odd number of response categories in order for there to be a natural neutral

50
We would like a scale to be both reliable and valid
Pretests for the European Social Survey suggested that reliability and validity were higher using an 11-point scale compared to a four-point scale.

51
Labelling categories?A small change can have large effects…Job satisfaction labels in the BHPS changed from Wave 1 to Wave 2
Label for category one changed. In Wave 2 all seven categories were labelled, as opposed to only three of them in Wave 1.

52
Could this have any effect? Compare the JS distributions in Waves 1, 2 and 3.
Huge rise in the use of response six, now that it is labelled. The only three labelled responses in Wave 1 attracted “too many” responses.
This particularly seemed to affect women

Is Happiness Everything?
Do questions about happiness and satisfaction pick up everything that is important about individual lives?
Or could there be “non-happiness” elements that are important too?

54
Maslow’s Hierarchy of Needs

This is relevant in the context of the debate over hedonia vs. eudaimonia.
Eudaimonia refers to the idea of flourishing or developing human potential, as opposed to pleasure, and is designed to capture elements such as mastery, relations with others, self-acceptance and purpose.
Practically, eudaimonic well-being is measured by questions on autonomy, determination, interest and engagement, aspirations and motivation, and a sense of meaning, direction or purpose in life.
Arguably picked up by last of the four ONS questions.

BBC News Website 24 Feb 2011www.bbc.co.uk/news/uk-12566965
ONS Happiness Survey Questions Revealed After becoming Conservative leader in 2005, David Cameron said gauging people's feelings was one of the "central political issues of our time"."It's time we admitted that there's more to life than money and it's time we focused not just on GDP but on GWB - general well-being," he said.
The ONS will add the subjective questions to its next annual Integrated Household SurveyThe questions will include:
Overall, how satisfied are you with your life nowadays?Overall, how happy did you feel yesterday?Overall, how anxious did you feel yesterday?Overall, to what extent do you feel the things you do in your life are worthwhile?
www.bbc.co.uk/news/uk-12566965www.bbc.co.uk/news/uk-12566965

Here is a measure of flourishing, based on Huppert and So (2009).
All of these six questions on the right were asked in Wave 3 of the European Social Survey

The first two of these are defined by Huppert and So as “core features”, in that someone who is flourishing has to agree with these statements. The measure they propose of flourishing is thus agreement with the first two questions, plus agreement with at least three of the next four questions.
Fifty six percent of the ESS sample is flourishing according to this definition.
The second measure we appeal to is based on the New Economics Foundation (2008), and measures i) Vitality, ii) Resilience and Self-Esteem, iii) Positive Functioning, Supportive Relationships, And Trust and Belonging.
Each of these three is constructed as the unweighted sum of the answers to a number of z-score transformed questions (such that each of the questions has a mean of zero and a variance of one).
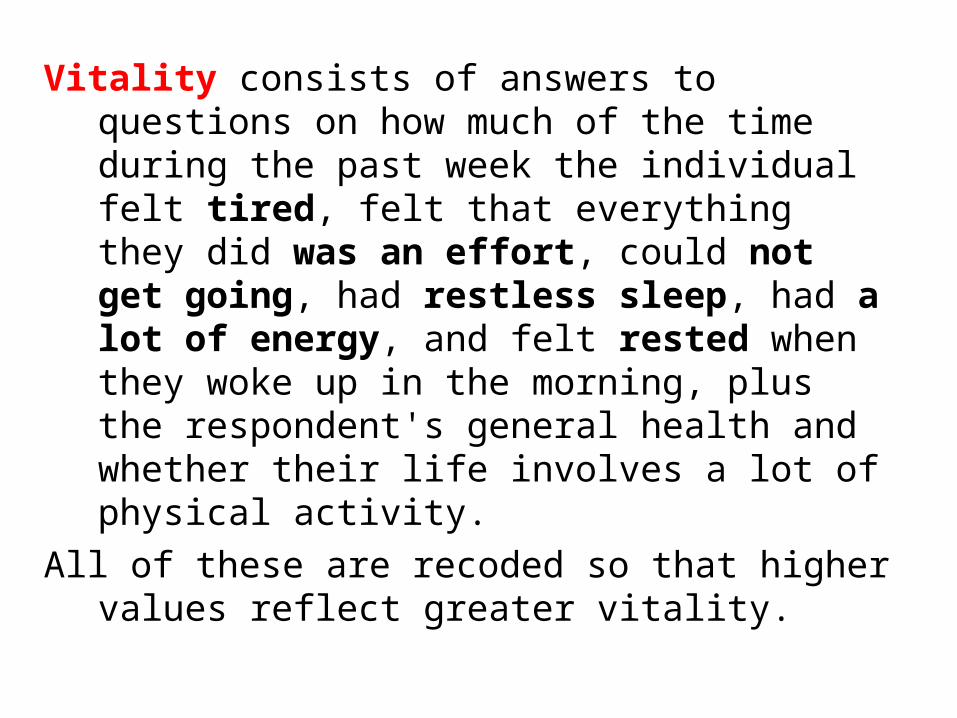
Vitality consists of answers to questions on how much of the time during the past week the individual felt tired, felt that everything they did was an effort, could not get going, had restless sleep, had a lot of energy, and felt rested when they woke up in the morning, plus the respondent's general health and whether their life involves a lot of physical activity.
All of these are recoded so that higher values reflect greater vitality.

Similarly, resilience and self-esteem is given the sum of the answers to the four following z-score transformed questions:
• "In general I feel very positive about myself“• "At times I feel as if I am a failure“• "I’m always optimistic about my future“• "When things go wrong in my life, it generally takes
me a long time to get back to normal".
Again, all of these are recoded so that higher numbers reflect greater resilience.

Last, positive functioning is determined by the answers to the following questions:
• "In my daily life I get very little chance to show how capable I am“
• "Most days I feel a sense of accomplishment from what I do“• "In my daily life, I seldom have time to do the things I really
enjoy“• "I feel I am free to decide how to live my life“• "How much of the time during the past week have you felt
bored?“• "How much of the time during the past week have you been
absorbed in what you were doing“• "To what extent do you get a chance to learn new things?“• "To what extent do you feel that you get the recognition you
deserve for what you do?“• "I generally feel that what I do in my life is valuable and
worthwhile"
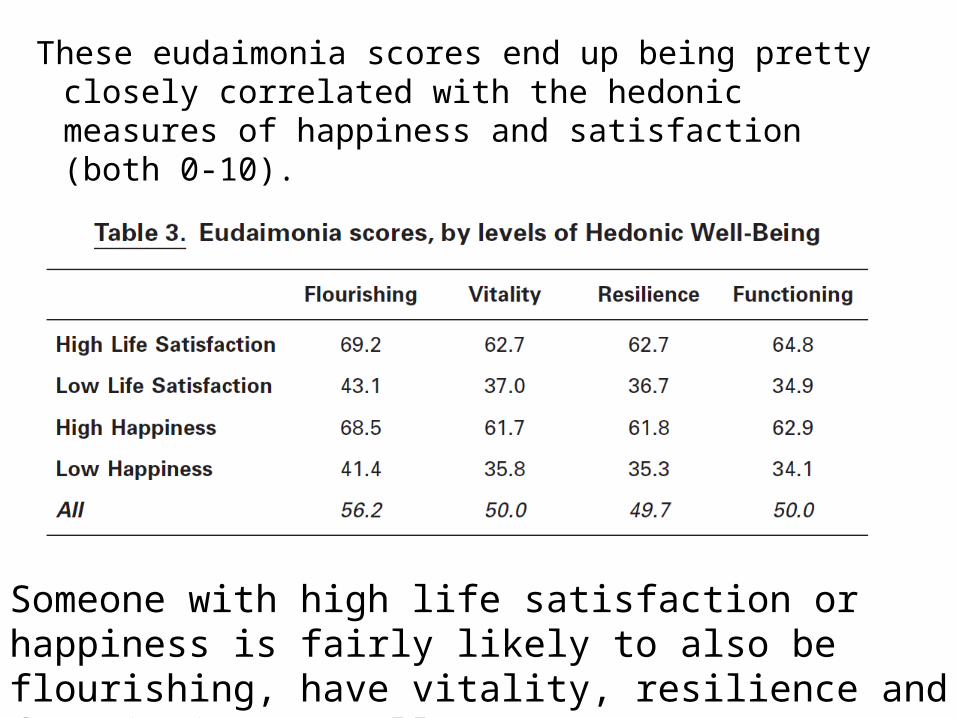
These eudaimonia scores end up being pretty closely correlated with the hedonic measures of happiness and satisfaction (both 0-10).
Someone with high life satisfaction or happiness is fairly likely to also be flourishing, have vitality, resilience and functioning as well.

A second simple way of evaluating the difference, if any, between hedonic and eudaimonic measures of well-being is to carry out a regression analysis using "standard" socio-demographic variables as controls.
Here’s the regression table, just to prove that we did it….
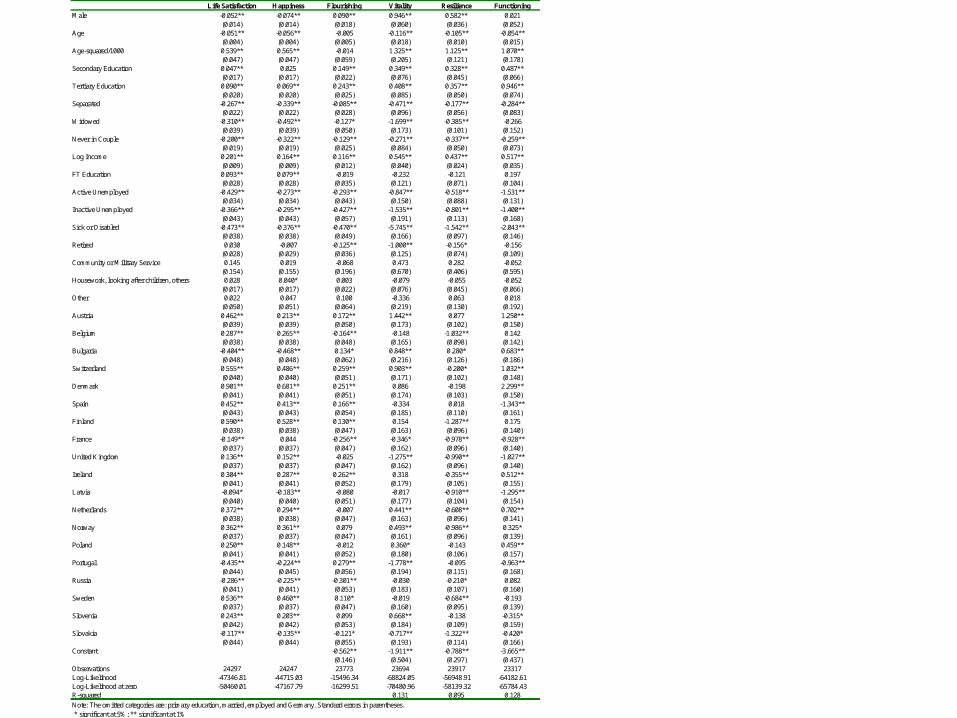
Life Satisfaction Happiness Flourishing Vitality Resilience FunctioningMale -0.052** -0.074** 0.090** 0.946** 0.582** 0.021
(0.014) (0.014) (0.018) (0.060) (0.036) (0.052)Age -0.051** -0.056** -0.005 -0.116** -0.105** -0.054**
(0.004) (0.004) (0.005) (0.018) (0.010) (0.015)Age-squared/1000 0.539** 0.565** -0.014 1.325** 1.125** 1.070**
(0.047) (0.047) (0.059) (0.205) (0.121) (0.178)Secondary Education 0.047** 0.025 0.149** 0.349** 0.328** 0.487**
(0.017) (0.017) (0.022) (0.076) (0.045) (0.066)Tertiary Education 0.090** 0.069** 0.243** 0.408** 0.357** 0.946**
(0.020) (0.020) (0.025) (0.085) (0.050) (0.074)Separated -0.267** -0.339** -0.085** -0.471** -0.177** -0.284**
(0.022) (0.022) (0.028) (0.096) (0.056) (0.083)Widowed -0.310** -0.492** -0.127* -1.699** -0.385** -0.266
(0.039) (0.039) (0.050) (0.173) (0.101) (0.152)Never in Couple -0.200** -0.322** -0.129** -0.271** -0.337** -0.259**
(0.019) (0.019) (0.025) (0.084) (0.050) (0.073)Log Income 0.201** 0.164** 0.116** 0.545** 0.437** 0.517**
(0.009) (0.009) (0.012) (0.040) (0.024) (0.035)FT Education 0.093** 0.079** -0.019 -0.232 -0.121 0.197
(0.028) (0.028) (0.035) (0.121) (0.071) (0.104)Active Unemployed -0.429** -0.273** -0.293** -0.847** -0.518** -1.531**
(0.034) (0.034) (0.043) (0.150) (0.088) (0.131)Inactive Unemployed -0.366** -0.295** -0.427** -1.535** -0.801** -1.400**
(0.043) (0.043) (0.057) (0.191) (0.113) (0.168)Sick or Disabled -0.473** -0.376** -0.470** -5.745** -1.542** -2.043**
(0.038) (0.038) (0.049) (0.166) (0.097) (0.146)Retired 0.030 -0.007 -0.125** -1.000** -0.156* -0.156
(0.028) (0.029) (0.036) (0.125) (0.074) (0.109)Community or Military Service 0.145 0.019 -0.068 0.473 0.282 -0.052
(0.154) (0.155) (0.196) (0.670) (0.406) (0.595)Housework, looking after children, others 0.028 0.040* 0.003 -0.079 -0.055 -0.052
(0.017) (0.017) (0.022) (0.076) (0.045) (0.066)Other 0.022 0.047 0.100 -0.336 0.063 0.018
(0.050) (0.051) (0.064) (0.219) (0.130) (0.192)Austria 0.462** 0.213** 0.172** 1.442** 0.077 1.250**
(0.039) (0.039) (0.050) (0.173) (0.102) (0.150)Belgium 0.287** 0.265** -0.164** -0.148 -1.032** 0.142
(0.038) (0.038) (0.048) (0.165) (0.098) (0.142)Bulgaria -0.404** -0.468** 0.134* 0.848** 0.280* 0.683**
(0.048) (0.048) (0.062) (0.216) (0.126) (0.186)Switzerland 0.555** 0.486** 0.259** 0.903** -0.200* 1.032**
(0.040) (0.040) (0.051) (0.171) (0.102) (0.148)Denmark 0.901** 0.681** 0.251** 0.086 -0.198 2.299**
(0.041) (0.041) (0.051) (0.174) (0.103) (0.150)Spain 0.452** 0.413** 0.166** -0.334 0.018 -1.343**
(0.043) (0.043) (0.054) (0.185) (0.110) (0.161)Finland 0.590** 0.528** 0.130** 0.154 -1.287** 0.175
(0.038) (0.038) (0.047) (0.163) (0.096) (0.140)France -0.149** 0.044 -0.256** -0.346* -0.978** -0.928**
(0.037) (0.037) (0.047) (0.162) (0.096) (0.140)United Kingdom 0.136** 0.152** -0.025 -1.275** -0.990** -1.027**
(0.037) (0.037) (0.047) (0.162) (0.096) (0.140)Ireland 0.304** 0.287** 0.262** 0.318 -0.355** 0.512**
(0.041) (0.041) (0.052) (0.179) (0.105) (0.155)Latvia -0.094* -0.183** -0.080 -0.017 -0.910** -1.295**
(0.040) (0.040) (0.051) (0.177) (0.104) (0.154)Netherlands 0.372** 0.294** -0.007 0.441** -0.608** 0.702**
(0.038) (0.038) (0.047) (0.163) (0.096) (0.141)Norway 0.362** 0.361** 0.079 0.493** -0.986** 0.325*
(0.037) (0.037) (0.047) (0.161) (0.096) (0.139)Poland 0.250** 0.148** -0.012 0.360* -0.143 0.459**
(0.041) (0.041) (0.052) (0.180) (0.106) (0.157)Portugal -0.435** -0.224** 0.279** -1.778** -0.095 -0.963**
(0.044) (0.045) (0.056) (0.194) (0.115) (0.168)Russia -0.286** -0.225** -0.301** -0.030 -0.210* 0.082
(0.041) (0.041) (0.053) (0.183) (0.107) (0.160)Sweden 0.536** 0.460** 0.110* -0.019 -0.684** -0.193
(0.037) (0.037) (0.047) (0.160) (0.095) (0.139)Slovenia 0.243** 0.203** 0.099 0.668** -0.138 -0.315*
(0.042) (0.042) (0.053) (0.184) (0.109) (0.159)Slovakia -0.117** -0.135** -0.121* -0.717** -1.322** -0.420*
(0.044) (0.044) (0.055) (0.193) (0.114) (0.166)Constant -0.562** -1.911** -0.788** -3.665**
(0.146) (0.504) (0.297) (0.437)Observations 24297 24247 23773 23694 23917 23317Log-Likelihood -47346.81 -44715.03 -15496.34 -68824.05 -56948.91 -64182.61Log-Likelihood at zero -50460.01 -47167.79 -16299.51 -70480.96 -58139.32 -65784.43R-squared 0.131 0.095 0.128
Note: The omitted categories are: primary education, married, employed and Germany. Standard errors in parentheses. * significant at 5%; ** significant at 1%

Are the data patterns in these regressions the same?
The measures of happiness and life satisfaction produce extremely similar data shapes. Some say that satisfaction is more cognitive, but we don’t see that here.
The correlation between the hedonic measures and the eudaimonic measures, in terms of how they fit the observable explanatory variables, is reasonably high.
There is, however, one exception, with respect to resilience. This concept does not seem to be particularly closely related to either happiness or satisfaction, which is perhaps a finding that is worthy of future investigation
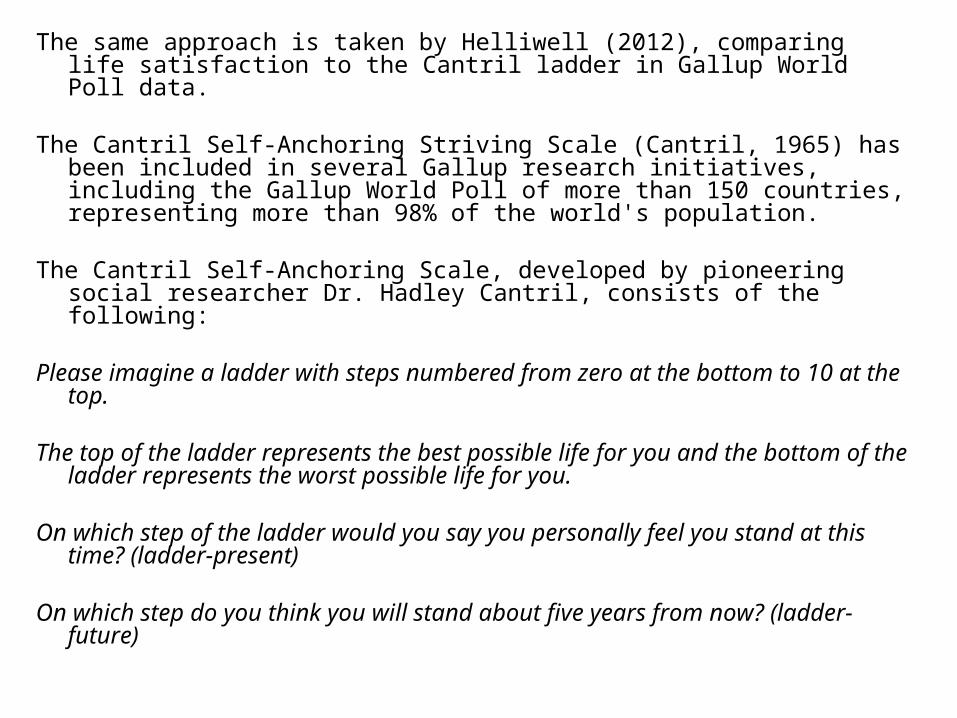
The same approach is taken by Helliwell (2012), comparing life satisfaction to the Cantril ladder in Gallup World Poll data.
The Cantril Self-Anchoring Striving Scale (Cantril, 1965) has been included in several Gallup research initiatives, including the Gallup World Poll of more than 150 countries, representing more than 98% of the world's population.
The Cantril Self-Anchoring Scale, developed by pioneering social researcher Dr.
Hadley Cantril, consists of the following: Please imagine a ladder with steps numbered from zero at the bottom to 10 at the
top. The top of the ladder represents the best possible life for you and the bottom of
the ladder represents the worst possible life for you.
On which step of the ladder would you say you personally feel you stand at this time? (ladder-present)
On which step do you think you will stand about five years from now? (ladder-
future)
The country-by-country rankings for life satisfaction in the Gallup World Poll are very similar to those for the Cantril ladder.
The correlation between the country rankings for life satisfaction and the Gallup ladder responses - asked of the same respondents, and in the same survey - is very high (r=0.935). Analysis of the resulting data show that while there were significant differences in average scores, with the mean of life satisfaction being higher by about 0.5 on the 11-point scale, the two variables are explained by the same factors, including the same effects of income .
We can do something of the same thing in the BHPS, looking at the correlation between life satisfaction and GHQ regressions.
The Pearson correlation between the two sets of estimated regression coefficients (of which there are 48) is 0.775.
In other words, the “same kinds of things” are correlated with both life satisfaction and GHQ.

Equally, in the BHPS, the pattern of adaptation seems to be very similar between life satisfaction and GHQ.

Slight suggestion that children might do more for you in terms of GHQ than in terms of life satisfaction.

Which well-being measure better predicts behaviour?: Benjamin et al. (2012), “What Do You Think Would Make You Happier? What Do You Think You Would Choose?”, American Economic Review.
They consider a series of sequence of hypothetical pairwise-choice scenarios.


Regress hypothetical choice on predicted SWB (how happy you think it will make you) and eleven non-SWB aspects of life:
• Family happiness• Health• Life's level of romance• Social life• Control over your life• Life's level of spirituality• Life's level of fun• Social status• Life's non-boringness• Physical comfort• Sense of purpose

As shown by the R2, 0.38 of the variation in choice is explained by SWB (own happiness) alone.
Regressing choice on both SWB and the eleven non-SWB aspects yields a barely higher R2 of 0.41.
But:“the four scenarios we designed to be representative of typical important decisions facing our college-age Cornell sample…socialize versus sleep, family versus money, education versus social life, and interest versus career… are among the scenarios with the lowest univariate R2 and, correspondingly, the highest incremental R2 from adding non-SWB aspects as regressors”
Eudaimonia may then matter much more in certain real-life situations


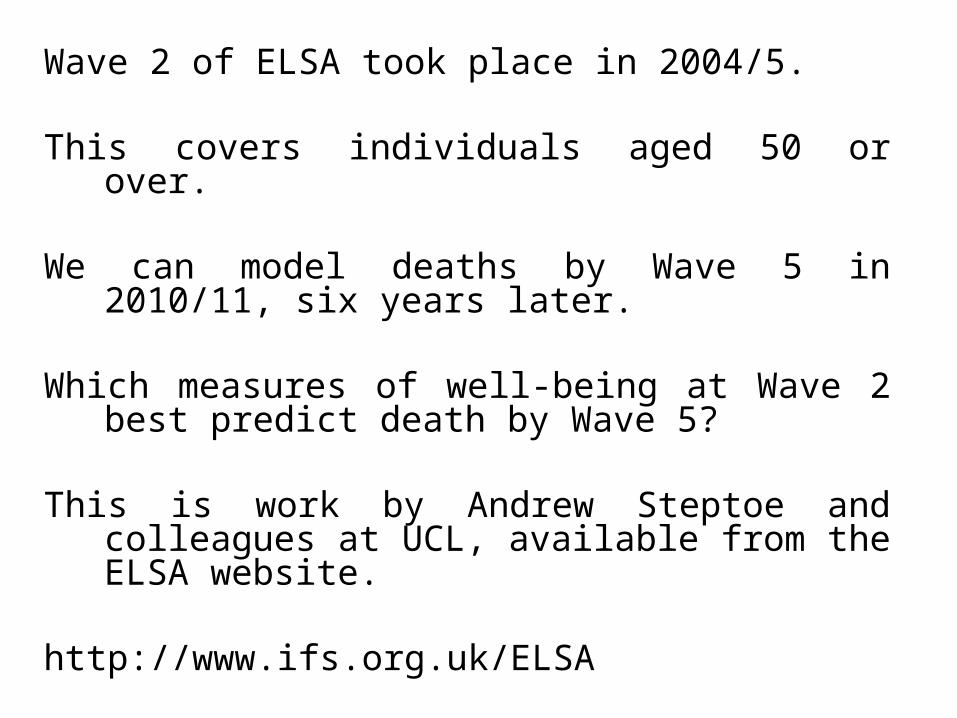
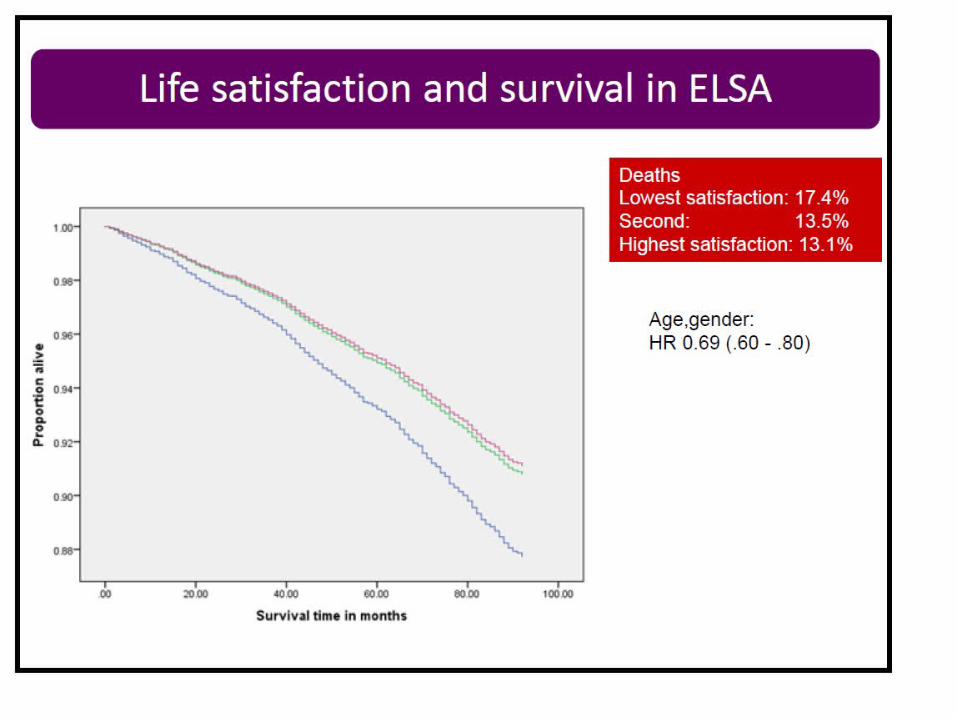
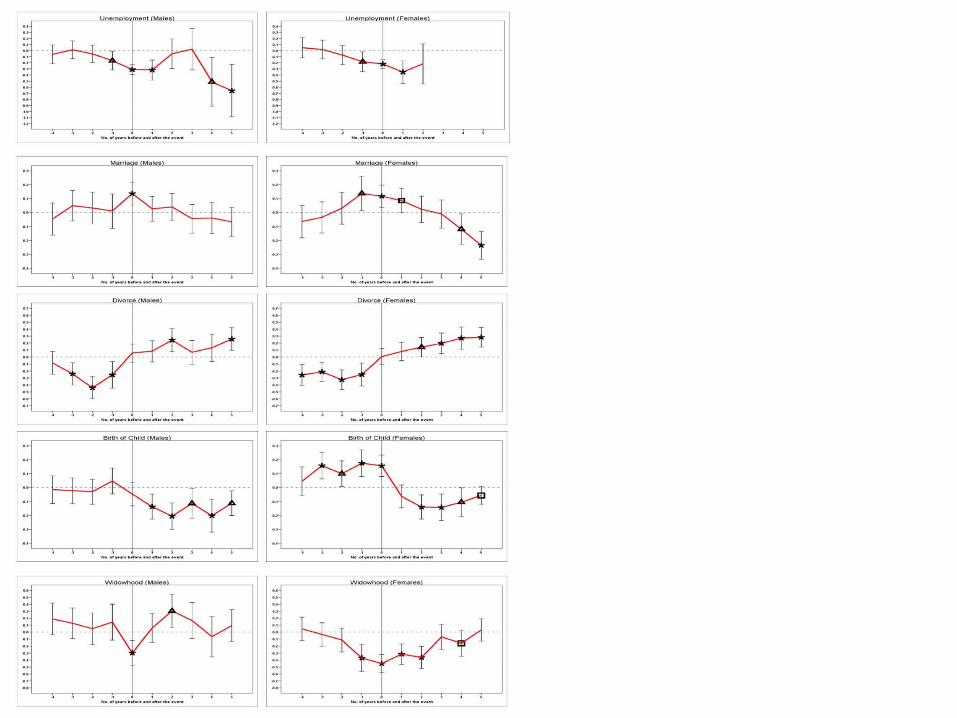
Wave 2 of ELSA took place in 2004/5.
This covers individuals aged 50 or over.
We can model deaths by Wave 5 in 2010/11, six years later.
Which measures of well-being at Wave 2 best predict death by Wave 5?
This is work by Andrew Steptoe and colleagues at UCL, available from the ELSA website.
http://www.ifs.org.uk/ELSA