ist of acronyms abbreviations used in this document … · list of acronyms / abbreviations used in...
TRANSCRIPT

256797 MACCSol FRF-Final Report Figures-R1.0
LIST OF ACRONYMS / ABBREVIATIONS USED IN THIS DOCUMENT Acronym / abbreviation Definition
ACC Air Cooled Condenser
CCGT Combined Cycle Gas Turbine
CFD Computational Fluid Dynamics
CSP Concentrated Solar Power
DNI Direct Normal Irradiance
DoW Description of Work
EC European Commission
GE General Electric
IP Intellectual Property
IPR Intellectual Property Rights
LCA Life Cycle Analysis
LDA Laser Doppler Anemometry
LSV Laser Surface Velocimeter
MACC Modular Air Cooled Condenser
MENA Middle East and North Africa
MS/RA Method Statements and Risk Assessments
PIV Particle Image Velocimetry
PM Person Month
PTC Parabolic Trough Collector
RANS Reynolds Averaged Navier Stokes
SME Small to Medium Enterprise
WP Work Package
WPS Welding Procedure Specification
WT Wind Tunnel

256797 MACCSol FRF-Final Report Figures-R1.0
Figure 1. Schematic of CSP plant steam cycle
Figure 2. Conventional ACC.
Fan,
diameter
typically 9m
Steam
from
steam
turbine
Overall
height
typically 30mAirflow
upwards
through A-
frame

256797 MACCSol FRF-Final Report Figures-R1.0
Figure 3. Left: single MACC module. Right: multiple MACC modules assembled and connected to
a steam distribution duct and a condensate return line.
Figure 4. Sample of candidate condenser tube designs: (a) a multi-row circular finned tube bank;
(b) pictorial view of circular finned tube; (c) a single row of rectangular plate finned tubes and (d)
pictorial view of plate finned tube bundle.
256797 MACCSol FRF-Final Report Figures-R1.0
(a) (b)
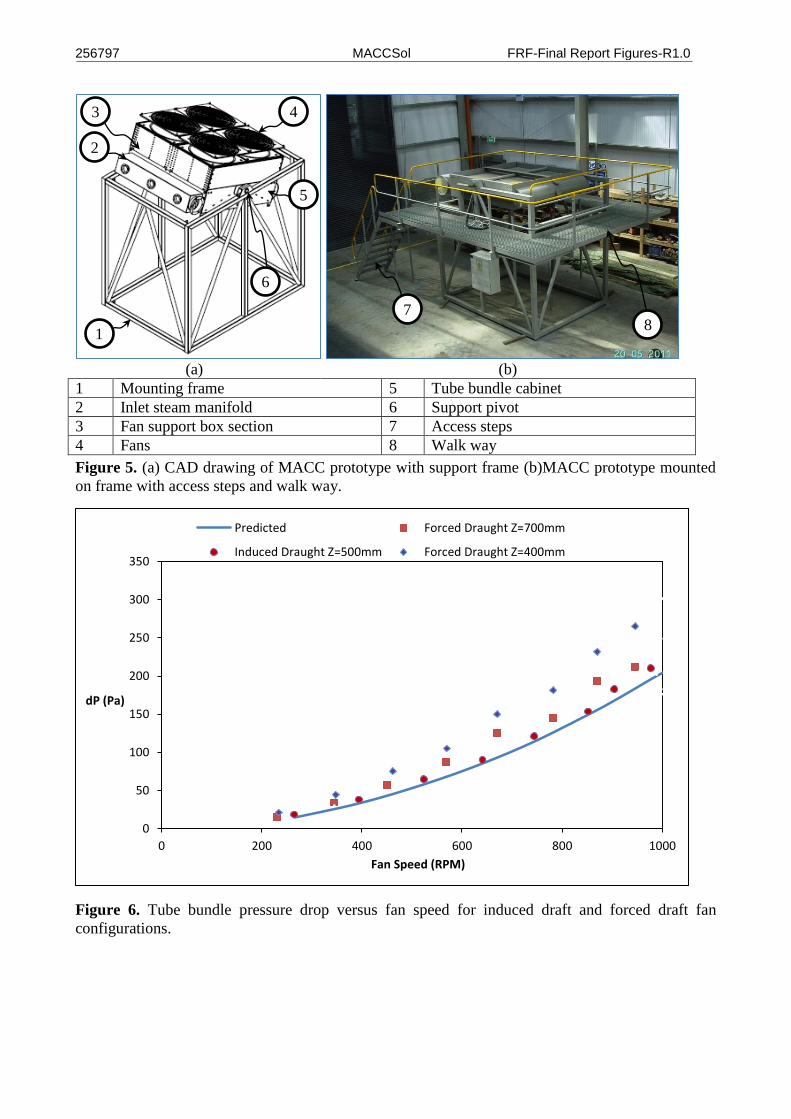
1 Mounting frame 5 Tube bundle cabinet
2 Inlet steam manifold 6 Support pivot
3 Fan support box section 7 Access steps
4 Fans 8 Walk way
Figure 5. (a) CAD drawing of MACC prototype with support frame (b)MACC prototype mounted
on frame with access steps and walk way.
Figure 6. Tube bundle pressure drop versus fan speed for induced draft and forced draft fan
configurations.
0
50
100
150
200
250
300
350
0 200 400 600 800 1000
dP (Pa)
Fan Speed (RPM)
Predicted Forced Draught Z=700mm
Induced Draught Z=500mm Forced Draught Z=400mm
3
1
6
4
5
2
7 8

256797 MACCSol FRF-Final Report Figures-R1.0
Figure 7. Wind tunnel facility for performing measurements on aerodynamic and thermal
performance characteristics of candidate MACC finned tube designs. Also illustrated is the steam
supply used to heat the tubes to perform the thermal measurements.
Figure 8. Dimensionless heat transfer coefficient for a range of finned rube designs versus
Reynolds number from relevant literature correlations and measured data.

256797 MACCSol FRF-Final Report Figures-R1.0
Figure 9: Operational MACC prototype on-site
Figure 10: Labelled schematic of MACC prototype
256797 MACCSol FRF-Final Report Figures-R1.0
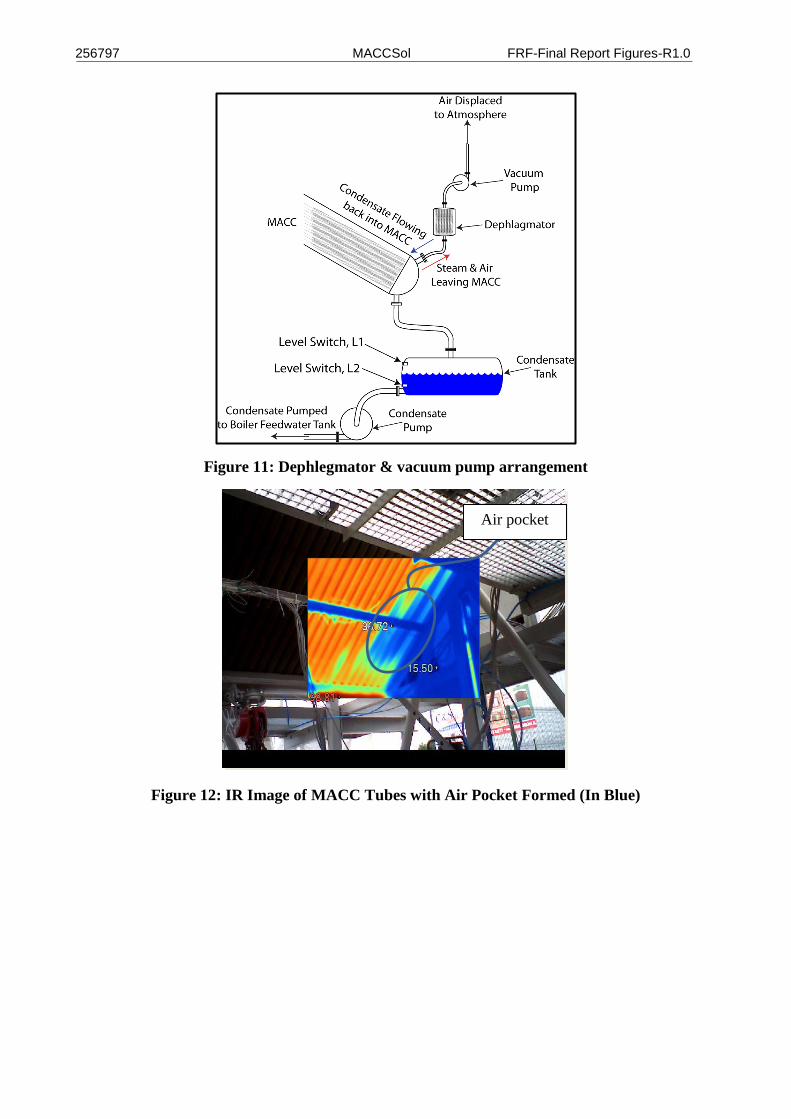
Figure 11: Dephlegmator & vacuum pump arrangement
Figure 12: IR Image of MACC Tubes with Air Pocket Formed (In Blue)
Air pocket
256797 MACCSol FRF-Final Report Figures-R1.0
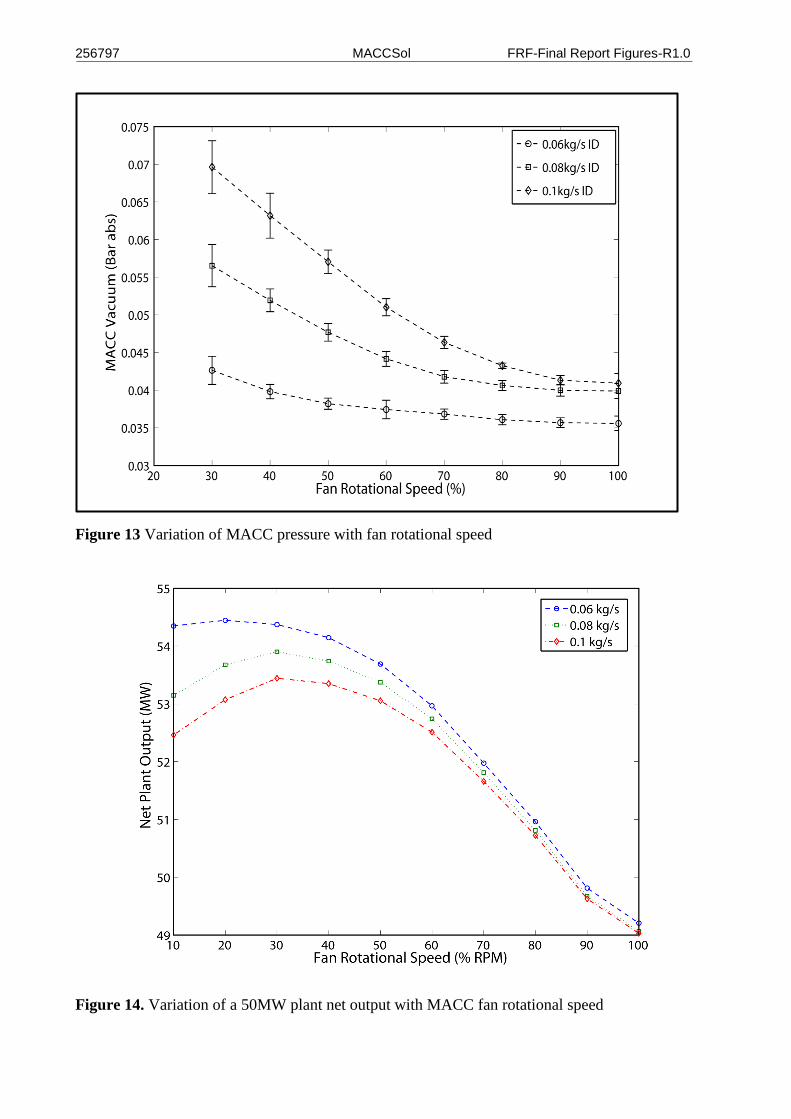
Figure 13 Variation of MACC pressure with fan rotational speed
Figure 14. Variation of a 50MW plant net output with MACC fan rotational speed

256797 MACCSol FRF-Final Report Figures-R1.0
Figure 15. Schematic of lab-scale air-cooled condenser
Figure 16. End-view of thermistor pair arrangement
𝑅𝑡ℎ,𝑖𝑇𝑠,𝑖 − 𝑇𝑤,𝑖
𝑑�̇�𝑖
Equation 1

256797 MACCSol FRF-Final Report Figures-R1.0
Figure 17. Local variation of thermal resistance along the length of condenser tube for a range of
flow rates

256797 MACCSol FRF-Final Report Figures-R1.0
Figure 18. Annual power plant net energy output versus condenser size for geometries A to Q.
Figure 19. Minimum cost of electricity for MACC geometries A to Q.
Figure 20. Fan test rig inside wind tunnel
Ψ =𝑑𝑝𝑠𝑡𝑎𝑡𝑖𝑐
0.5𝜌(𝑛𝐷𝑜/2)2 Equation 2
Φ =�̇�
0.25𝜋2𝑛𝐷𝑎(𝐷𝑜2 − 𝐷𝑖
2) Equation 3
256797 MACCSol FRF-Final Report Figures-R1.0
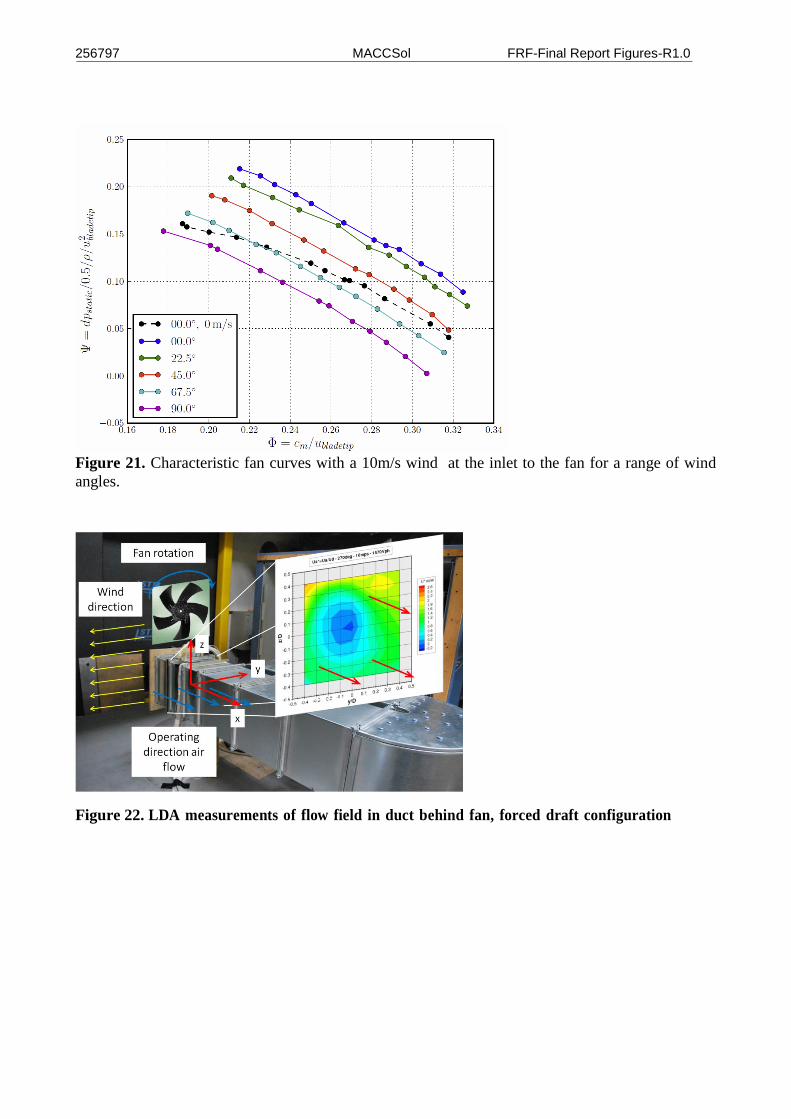
Figure 21. Characteristic fan curves with a 10m/s wind at the inlet to the fan for a range of wind
angles.
Figure 22. LDA measurements of flow field in duct behind fan, forced draft configuration

256797 MACCSol FRF-Final Report Figures-R1.0
Figure 23 - Numerical contour plot of temperature and velocity vector field of a MACC in cross
wind
Figure 24. Thermodynamic model for a thermoelectric power plant
Turbine
building

256797 MACCSol FRF-Final Report Figures-R1.0
Figure 25. Comparison of power plant net power output with a conventional ACC, a water cooling
tower and two different sized MACC condensers, at a range of ambient temperatures.
Table 1. Characteristics of the location considered
Figure 26. Condensers impact variation vs. water stress conditions variation
WCC
WCC
WCC
ACCACC
ACC
MACC MACC MACC
France Spain Arizona
Ove
rall
Imp
act
- 61,9%
- 16,2%- 16%
+113%
+ 18,1%
+18,1%
256797 MACCSol FRF-Final Report Figures-R1.0
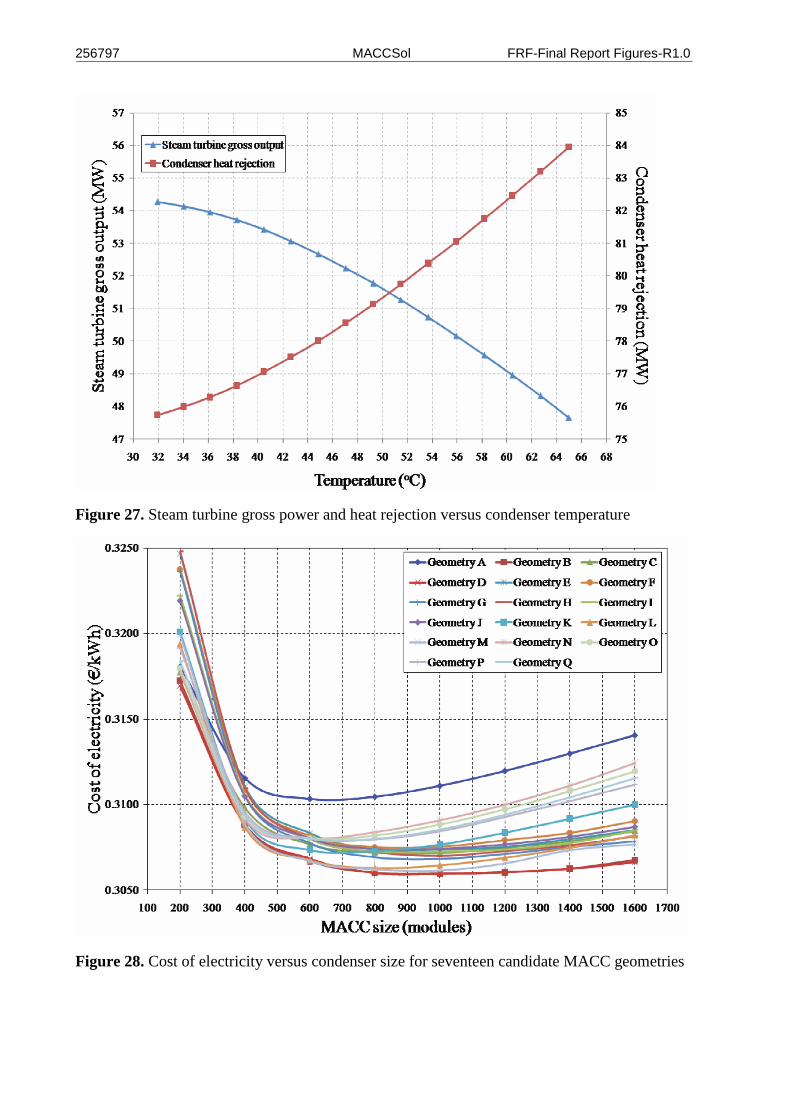
Figure 27. Steam turbine gross power and heat rejection versus condenser temperature
Figure 28. Cost of electricity versus condenser size for seventeen candidate MACC geometries

256797 MACCSol FRF-Final Report Figures-R1.0
Figure 29. Bubble chart comparing each configuration in terms of minim CSP plant electricity unit
cost, corresponding MACC size and capital cost per module (indicated by bubble size.
Figure 30. Left: CAD model of MACC; Right: phot of MACC instalation on Vast Solar CSP plant.
MACC prototype
256797 MACCSol FRF-Final Report Figures-R1.0
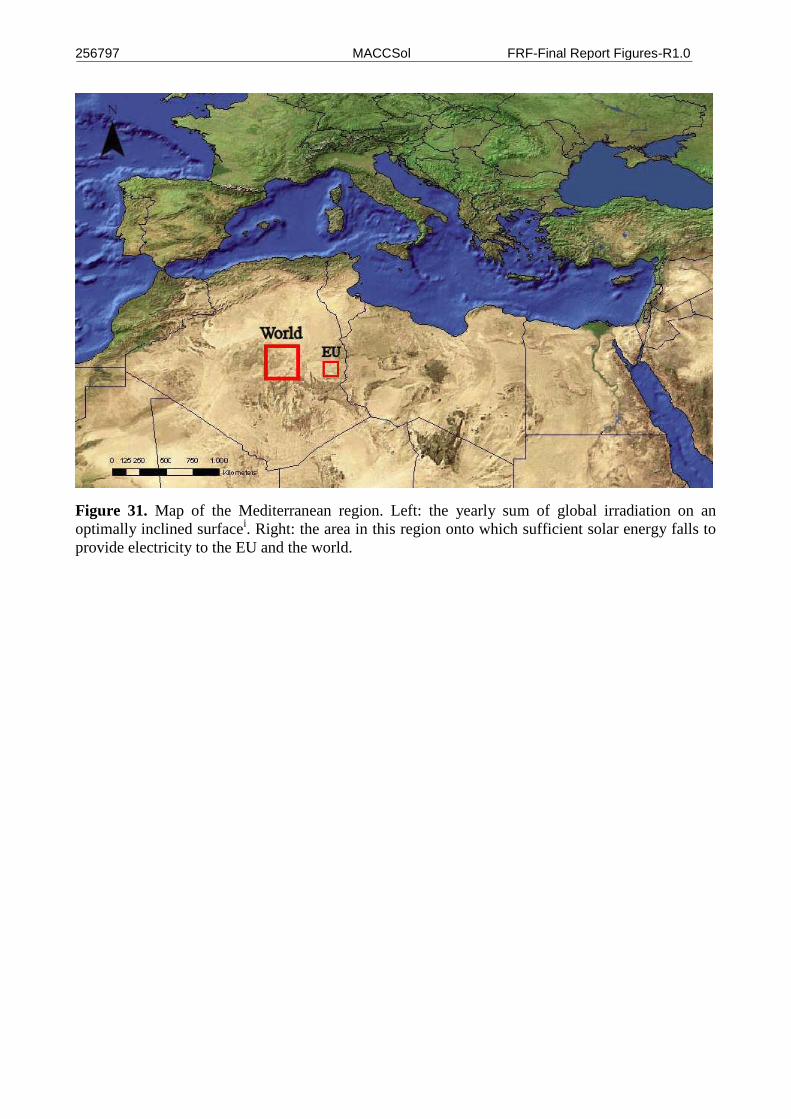
Figure 31. Map of the Mediterranean region. Left: the yearly sum of global irradiation on an
optimally inclined surfacei. Right: the area in this region onto which sufficient solar energy falls to
provide electricity to the EU and the world.

256797 MACCSol FRF-Final Report Figures-R1.0
Figure 32. Schematic of expected technical outputs of MACCSol, commercialisation activities
necessary to launch the MACCSol product and the impacts of this on CSP deployment and
achieving renewable electricity targets.
i http://re.jrc.ec.europa.eu/pvgis/cmaps/eur.htm
Manufacturing standards
0 1 2 3 4 4.5 5 years
Pilot plant installation
MACC technology
Benchmark data
Design specification
Scientific publications
Roadmap
Technical
outputs from
MACCSol
Reliability specification
Updated benchmark
Safety standards
Installation standards
Operating guidelines
•CSP plants operable in desert areas with no cooling water requirement
•Reduced cost of CSP generation (€/kW hr) compared to existing dry cooled technologies
• Increased level of CSP deployment
•CSP will form significant contribution to EU’s target of 20% electricity generation from renewable sources
Product focused
outputs from
commercialisation
phase
Technic
al activity d
efined in §
1.3
• “Debugging” MACCSolprototype
•Commercial grade prototype demonstration
•Reliability characterisation
•Define installation procedures
•Define operating procedures
•Define safety standards
•Define manufacturing standards
Activities involved in
commercialisation
phase
MACCSol project
FP7 funded
Technology commercialisation
Funded through Competitiveness and
Innovation programme, or a national
programme such as Enterprise
Ireland’s Innovation Partnership
programme
Pro
du
ct
lau
nch
ed
on
to m
ark
et
Impact