it-based bridge health monitoring · monitoring as an advanced data collecting technology. 2....
TRANSCRIPT

IT-based Bridge Health Monitoring
Ayaho Miyamoto* *Graduate School of Science & Engineering, Yamaguchi University
2-16-1 Tokiwadai, Ube 755-8611, Japan E-mail: [email protected]
Abstract: Bridge health monitoring using information technology and sensors is capable of providing more accurate knowledge of bridge performance than traditional strategies. This keynote paper introduces not only an IT-based bridge health monitoring system incorporate with the latest information technologies for lifetime management of existing bridges but also a data collecting system designed for bridge health monitoring.
1. Introduction Bridge monitoring system via information technology is capable of providing more accurate knowledge of bridge performance characteristics than traditional strategies[1]. This paper describes not only an integrated internet health monitoring system that consists of a Stand-alone Monitoring System (SMS) and a Web-based Internet Monitoring System (IMS) for bridge maintenance but also its application to para-stressing bridge system as an intelligent structure. IMS, as a web-based system, is capable of addressing the remote monitoring by introducing measuring information derived from SMS into the system through Internet or Intranet connected by either PHS or LAN. Moreover, the key functions of IMS such as data management system, condition assessment and decision-making with the proposed system are also introduced in this paper. Another goal of this paper is to establish the framework of a para-stressing bridge system which is an intelligent bridge by integrating the bridge monitoring information into the system to control the bridge performance automatically. Finally, the CompactRIO & LabVIEW-based data collecting system is described to provide the high accurate information for bridge health monitoring as an advanced data collecting technology.
2. Outline of IT-based Bridge Health Monitoring System
Monitoring is an important technique for evaluating the soundness and diagnosing bridge performance based on the real-time measurements of strain, displacement, vibration and other parameters. The goal should be not only simply to measure the deformations of bridges but also to obtain useful knowledge for bridge management by efficiently recording, processing and using measurement results. Conventional monitoring relied on manual measurement. Increasing the monitoring efficiency requires the realization of unmanned automated real-time measurement and the development of an environment for providing numerous bridge-associated people with access to necessary data from the place where they need the data. The systems built in this study are the Stand-alone Monitoring System (SMS), which is installed mainly in the field to make real-time
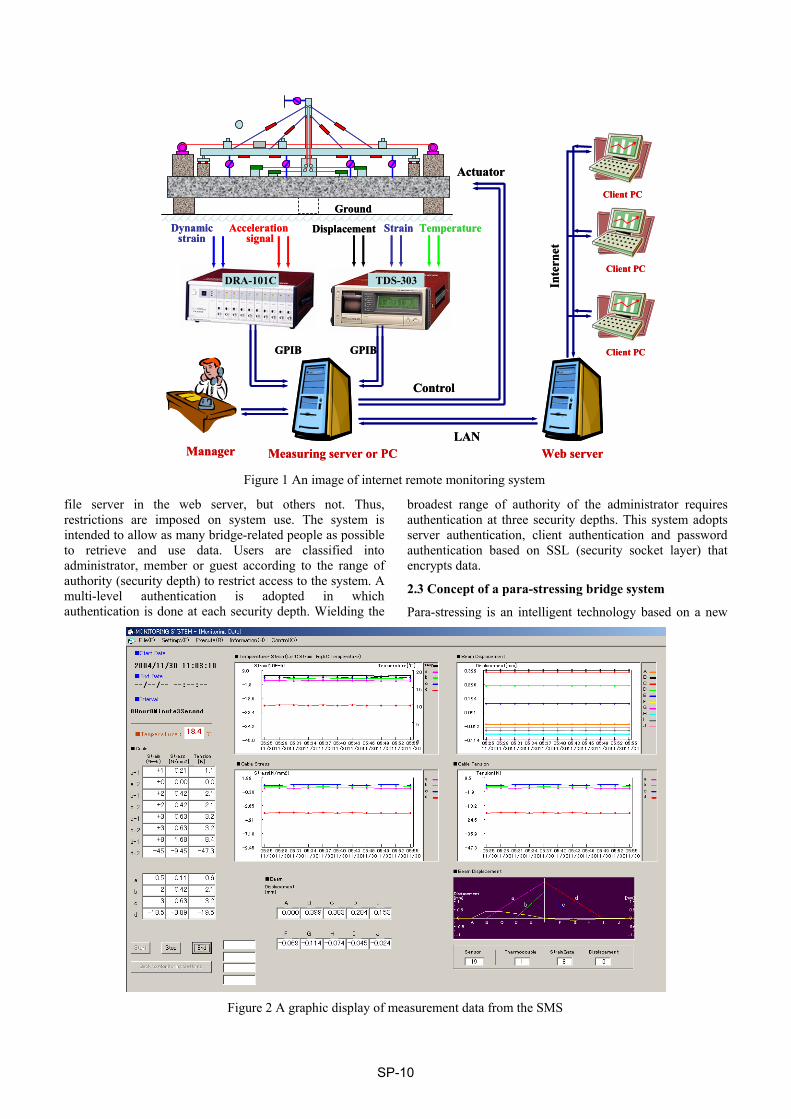
measurement and visualize measurement results, Internet Monitoring System (IMS), which enables remote measurement and data collection via communications networks, and another monitoring system, which integrates the two systems. An outline of the integrated internet remote monitoring system(IRMS) is given in Figure 1[2]. The integrated remote monitoring system is used as a sensing tool for the para-stressing system to identify the present condition of the bridge in terms of deformation, stress and other parameters, and to confirm post-control conditions of the bridge.
2. 1 Stand-alone monitoring system (SMS)
The Stand-alone Monitoring System (SMS) works on a measurement computer installed at the bridge site where field monitoring takes place. SMS measures external forces acting on the bridge and the behavior of the bridge subjected to external forces. SMS periodically measures the stress, displacement, acceleration, etc of bridge members and temperature around the bridge using sensors installed in the bridge, visualizes the collected data in graphs and charts, and stores them in a measurement server.
SMS that monitors a cable stayed bridge model is composed of a measurement instrument (data logger) that monitors the behavior of the model, and a measurement server that sends measurement instructions to the measure-ment instrument and records data (Figure 1). The measure-ment server is equipped with measurement control and data storage programs, and records monitoring data and displays them in graphs. Figure 2 shows a screen output by SMS for a two-span cable-stayed bridge model(see Figure 4).
2. 2 Internet monitoring system (IMS)
To increase measurement and data collection efficiency of SMS at the bridge site, an Internet Monitoring System (IMS) using communications networks was built by incorporating a web server. Using IMS, which is capable of transmitting monitoring data at real-time, enables quick identification of bridge performance and response, and efficient management and use of collected measurement data regardless of time or place. With IMS, early discovery of problems by field monitoring, simultaneous monitoring of multiple bridges, data use for other purposes than bridge management, guarantee of data uniformity and reduction of inspection and other maintenance work also become possible.
For practical IMS implementation, however, preventing illegal attacks of Internet invaders such as system destruction, data manipulation and eavesdropping is very important. In IMS, the range of authority of the user to access the system and data is classified into the manipulation of measurement results, data use or data retrieval. Some users are authorized to access the common
The 23rd International Technical Conference on Circuits/Systems,Computers and Communications (ITC-CSCC 2008)
SP-9
file server in the web server, but others not. Thus, restrictions are imposed on system use. The system is intended to allow as many bridge-related people as possible to retrieve and use data. Users are classified into administrator, member or guest according to the range of authority (security depth) to restrict access to the system. A multi-level authentication is adopted in which authentication is done at each security depth. Wielding the
broadest range of authority of the administrator requires authentication at three security depths. This system adopts server authentication, client authentication and password authentication based on SSL (security socket layer) that encrypts data.
2.3 Concept of a para-stressing bridge system
Para-stressing is an intelligent technology based on a new
Ground
GPIB
Control
GPIB
Dynamicstrain
Acceleration signal
Strain TemperatureDisplacement
DRA-101C TDS-303
Measuring server or PC
Client PC
Client PC
Client PC
LAN
Inte
rnet
Actuator
Web serverManager
Ground
GPIB
Control
GPIB
Dynamicstrain
Acceleration signal
Strain TemperatureDisplacement
DRA-101C TDS-303
Measuring server or PC
Client PC
Client PC
Client PC
LAN
Inte
rnet
Actuator
Web serverManager
Figure 1 An image of internet remote monitoring system
Figure 2 A graphic display of measurement data from the SMS
SP-10

concept of response to external forces acting on structures by controlling structural members including material properties in real-time while regarding the entire structure as a self-organized system[3]. Shown in Figure 3 is a self-organized structure that senses, determines and controls external forces by itself. The system senses the conditions of the bridge based on the measurements obtained by the integrated remote monitoring system, determines the present serviceability and safety condition of the bridge using the measurement server, and sends control instructions to the actuator whenever necessary. A system was constructed for automatically carrying out a series of these jobs.
2.4 Development of para-stressing bridge system(PSBS)
Described below are three functions of the para-stressing bridge system(PSBS) shown in Figures 3 and 4: sensing, decision-making and control/actuation functions. Sensing function The sensing function is intended to accurately identify the conditions of the bridge. The integrated remote monitoring system is used to perform this function. With the para-stressing system, displacements of main girders are controlled by varying the cable tension of the cable stayed bridge model. The sensing function is therefore responsible for accurately grasping cable tension before and after the control measure is taken.
Sensor Measurement instrument GP-IB
Actuator Digital-to-analog conversion board
Motor controller
Measurement function
Control function
(Integrated remote monitoring system)
Bridge to be monitored Measurement server
Decision-making functionSensorSensor Measurement
instrumentMeasurement
instrument GP-IBGP-IB
ActuatorActuator Digital-to-analog conversion board
Motor controllerDigital-to-analog conversion boardDigital-to-analog conversion board
Motor controllerMotor controller
Measurement function
Control function
(Integrated remote monitoring system)
Bridge to be monitored Measurement server
Decision-making function
Figure 3 Configuration of para-stressing bridge system
① ② ③ ④ ⑤ ⑥ ⑦ ⑧ ⑨ ⑩ ⑪ ⑫ ⑬
A B C D E F G H I J
a-1
a-2
b-1
b-2
d-1
d-2
c-1
c-2
① ② ③ ④ ⑤ ⑥ ⑦ ⑧ ⑨ ⑩ ⑪ ⑫ ⑬
A B C D E F G H I J
a-1
a-2
b-1
b-2
d-1
d-2
c-1
c-2
① ② ③ ④ ⑤ ⑥ ⑦ ⑧ ⑨ ⑩ ⑪ ⑫ ⑬
A B C D E F G H I J
a-1
a-2
b-1
b-2
d-1
d-2
c-1
c-2
without Para-stressing
with Para-stressingThermopile
Strain sensor Strain sensor
Displacement sensor Displacement sensor
① ② ③ ④ ⑤ ⑥ ⑦ ⑧ ⑨ ⑩ ⑪ ⑫ ⑬
A B C D E F G H I J
a-1
a-2
b-1
b-2
d-1
d-2
c-1
c-2
① ② ③ ④ ⑤ ⑥ ⑦ ⑧ ⑨ ⑩ ⑪ ⑫ ⑬
A B C D E F G H I J
a-1
a-2
b-1
b-2
d-1
d-2
c-1
c-2
① ② ③ ④ ⑤ ⑥ ⑦ ⑧ ⑨ ⑩ ⑪ ⑫ ⑬
A B C D E F G H I J
a-1
a-2
b-1
b-2
d-1
d-2
c-1
c-2
without Para-stressing
with Para-stressing
① ② ③ ④ ⑤ ⑥ ⑦ ⑧ ⑨ ⑩ ⑪ ⑫ ⑬
A B C D E F G H I J
a-1
a-2
b-1
b-2
d-1
d-2
c-1
c-2
① ② ③ ④ ⑤ ⑥ ⑦ ⑧ ⑨ ⑩ ⑪ ⑫ ⑬
A B C D E F G H I J
a-1
a-2
b-1
b-2
d-1
d-2
c-1
c-2
① ② ③ ④ ⑤ ⑥ ⑦ ⑧ ⑨ ⑩ ⑪ ⑫ ⑬
A B C D E F G H I J
a-1
a-2
b-1
b-2
d-1
d-2
c-1
c-2
without Para-stressing
with Para-stressingThermopile
Strain sensor Strain sensor
Displacement sensor Displacement sensor
Figure 4 Cable-stayed bridge model with an internet remote monitoring system(IRMS) & para-stressing system
SP-11

Decision-making function The decision-making function calculates the tension that should be applied to cables to reduce the main girder displacement or vibration due to large vehicle loads to the level under normal loads (optimal counterforce for controlling displacement). The cable tension measured by the sensing function is compared with the calculated counterforce. Control instructions are continually sent to the control function until the cable tension becomes identical to the optimal counterforce. Control function The control function varies cable tension by stressing or relaxing the tension using the actuator on the bridge to offset additional loads of large vehicles.
3. CompactRIO(cRIO) & LabVIEW based Data Collecting System
3.1 Description of the cRIO & LabVIEW
The cRIO which is a measurement device[4] consists of three parts, control box, I/O modules and chassis with a high-performance Field Programmable Gate Array(FPGA) as shown in Figure 5. The cRIO programmable automation controller is an advanced embedded control and data acquisition system designed for applications that require high performance and reliability. With the system's open, embedded architecture, small size, extreme ruggedness, and flexibility, engineers and embedded developers can use hardware to quickly build custom embedded systems. The cRIO combines an embedded real-time processor, the FPGA, and hot-swappable I/O modules. Each I/O module is connected directly to the FPGA, providing low-level customization of timing and I/O signal processing. The FPGA is connected to the embedded real-time processor via a high-speed PCI bus. This represents a low-cost
architecture with open access to low-level hardware resources. LabVIEW[5] contains built-in data transfer mechanisms to pass data from the I/O modules to the FPGA and also from the FPGA to the embedded processor for real-time analysis, postprocessing, data logging, or communication to a networked host computer.
The cRIO is powered by LabVIEW FPGA and LabVIEW Real-Time technologies, giving engineers the ability to design, program, and customize the cRIO embedded system with easy-to-use graphical programming tools. The LabVIEW software for beginner and experienced programmers in so many different engineering applications and industries can be attributed to the software's intuitive graphical programming language used for automating measurement and control systems. The NI LabVIEW graphical dataflow language and block diagram approach naturally represent the flow of data and intuitively map user interface controls to data, so programmers can easily view and modify data or control inputs.
For novice programmers, LabVIEW Express technology transforms common measurement and automation tasks into much higher-level, intuitive virtual instruments. With Express technology, thousands of nonprogrammers have taken advantage of the LabVIEW platform to build automated systems quickly and easily.
For experienced programmers, LabVIEW delivers the performance, flexibility, and compatibility of a traditional programming language such as C or BASIC. In fact, the full-featured LabVIEW programming language has the same constructs that traditional languages have - variables, data types, objects, looping, and sequencing structures as well as error handling. And, with LabVIEW, programmers can reuse legacy code packaged as DLLs or shared libraries and integrate with other software using ActiveX, TCP, and other standard technologies.
Sensor Location
Data collecting
Central Office/ LaboratoryInternet
設置箇所
CompactRIO
Inside of bridge
CompactRIO
SensingData Graph Display・Analysis
Data acquisition・Communication
Sensor Location
Data collecting
Central Office/ LaboratoryInternet
設置箇所
CompactRIO
Inside of bridge
CompactRIO
SensingData Graph Display・Analysis
Data acquisition・Communication
Figure 5 CompactRIO-based data collecting system
SP-12

3.2 Attachable sensors to cRIO
The connectivity of cRIO(NI cRIO-9140, 9004) to a variety of sensors is compared with the one of three commercial instruments: data logger, memory recorder/analyzer (ex:KYOWA EDX-200A-32), and dynamic stain recorder (ex:TML DC-104R). In this comparison, some sensors such as thermocouple, displacement meter, strain gauge, piezoelectric device, laser displacement meter, accelerometer (piezoelectric type), impact hammer, and accelerometer (strain type) tried to be interfaced with the instruments. Figure 6 shows the results of connectivity to sensors. Thermocouples, displacements, and strain gauges are interfaced with data logger (ex:TML TSD-303). Accelerometers (piezoelectric type), piezoelectric devices, impact hammer, and laser displacement meter are able to connected to memory recorder/analyzer (ex:KYOWA EDX-200A-32). The size of dynamic stain recorder (ex:TML DC-104R) is compact. However, accelerometers (strain type) are only attached to the recorder. Commercial data loggers/recorders are big, heavy, expensive, and/or specialized. In contrast to commercial instruments, the cRIO are compact and flexible. Then, all sensors are able to be attached to the cRIO.
To transfer sensing data from bride site to central office (or laboratory), traditional data collecting systems for structural health monitoring need to consist of some data communication devices. Also, the systems don’t have data communication functions as a web/FTP server. In contrast, the cRIO- based data collecting system is able to integrate these functions for data communication. This is because the cRIO works as a web/FTP server. Then, it is easy to interface the cRIO with data communication devices such as cellphone, ethernet and wireless LAN.
3.3 Data collection system with cRIO & LabVIEW
The purpose of structural health monitoring(SHM) is to collect, document, and make available high-quality quantitative performance data on a given component or complete bridge system. The anticipation is that the system will provide a better understanding of bridge deterioration due to corrosion, fatigue, weather and exposure, and loads.
As mentioned before, the cRIO and LabVIEW are highly versatile. To present the ability, developed are two cRIO-based data collecting systems: temperature and vibration. The temperature data collecting system consists of one thermocouple. The vibration data collecting system consists of one accelerometer and one laser displacement meter. Figure 7 shows the screen display of vibration data collecting system.
The temperature data collecting system has the following functions:
Thermocouple data logging File save Setting of sampling rate Data transfer Monitoring with only cRIO (standalone) Web publishing (Web server, Remote monitoring) FTP server
On the other hand, the vibration data collecting system has the following functions:
Data logging of piezoelectric device, impact hammer, accelerometer, laser displacement meter
Setting of sampling rate Setting of sampling number Real-time sampling
Thermocouple
Accelerometer(Strain type)
Accelerometer(Piezoelectric type)
Piezoelectric device
Impact hammer
Laser displacement meter
Strain gauge
Displacement
CompactRIO
①②
③
⑤
⑦
⑧
④
⑥
ThermocoupleThermocouple
Accelerometer(Strain type)
Accelerometer(Strain type)
Accelerometer(Piezoelectric type)
Accelerometer(Piezoelectric type)
Piezoelectric device
Impact hammerImpact hammer
Laser displacement meterLaser displacement meter
Strain gaugeStrain gauge
DisplacementDisplacement
CompactRIO
①②
③
⑤
⑦
⑧
④
⑥
Figure 6 Attachable sensors to CompactRIO
SP-13

Setting of trigger FFT analysis
4. Concluding Remarks
In this paper, the integrated internet monitoring system in maintenance enables real-time monitoring, a technological component for developing an integrated lifetime management system for bridges. The integrated monitoring system is also composed of not only the Internet but also other types of information technology such as the latest information processing and soft computing technologies, etc.
As a future prospect of this research work, it will be integrated with the “Japanese Bridge Management System (J-BMS)” which has been developing by the author. J-BMS consists of three components: “J-BMS Data Base System”, “Bridge Performance Assessment System” and “Maintenance Plan Optimization System”. The proposed PSBS in this paper will be becoming a key tool for J-BMS in the near future, as the core function. Figure 8 shows a position and role of the “integrated internet health monitoring” in developing the integrated lifetime management system, like J-BMS, for infrastructure systems such as bridge, highway and railway networks, etc.
The major results of this paper are summarized as follows:
1) IT-based bridge health monitoring system becomes a strong tool for not only bridge lifetime management but also establishing the para-stressing bridge system. 2) The system helps bridge administrators to establish the rational maintenance strategies, then it can make the priority of repair/strengthening works of existing bridges based on the accurate information about bridge performance.
References [1] J. Holnicki-Szulc and J. Rodellar,”Smart structures”, NATO Science Series, Kluwer Academic Publishers, Vol. 65, 1998. [2] A. Miyamoto and M. Motoshita, ”An integrated internet monitoring system for bridge maintenance”, Proceedings of the Second
International Workshop on Structural Health Monitoring of Innovative Civil Engineering Structures, ISIS Canada Research Network, Vol.2, pp. 573-584, 2004. [3] S. Montes,”A global concept for 21st century bridge: Para-stressing”, Proceedings of FIP Symposium on Post-tensioned Concrete Structures 1996, Vol.2, pp. 739-744, 1996. [4] NI CompactRIO:http://www.ni.com/compactrio/ (acces-sed on: November 1, 2007). [5] NI LabVIEW: http://www.ni.com/labview/(accessed on: November 1, 2007).
Vibration graph
Power spectrum
Digital representation
Real-time measurement /measurement using trigger
Device name/Input mode/Resolution
Sampling setting Trigger setting System stop button
Vibration graph
Power spectrum
Digital representation
Real-time measurement /measurement using trigger
Device name/Input mode/Resolution
Sampling setting Trigger setting System stop button
Figure 7 Output screen of vibration monitoring by LabVIEW
Sensors
Integrated Internet Integrated Internet Monitoring SystemMonitoring System
Internet Virtual Internet Virtual Reality SystemReality System
Integrated Lifetime Integrated Lifetime Management System for Management System for Infrastructure SystemsInfrastructure Systems
MultiMulti--media Virtual media Virtual Reality Education SystemReality Education System
Environmental Environmental Impact Analysis Impact Analysis
SystemSystem
Natural Disaster Natural Disaster Risk Management Risk Management
SystemSystem
LifeLife--cycle Costs cycle Costs Analysis SystemAnalysis System
Structure Inspection Structure Inspection Support SystemSupport System
Intelligent Sensors Intelligent Sensors
WorldWorld--standard standard DataData--base Systembase System
Database for repair /strengthening
materials
Database for repair /strengthening
materials
Database for repair /strengthening
methods
Database for repair /strengthening
methods
Database of inspection
results
Database of inspection
results
Database of the history on repair/
strengthening works
Database of the history on repair/
strengthening works
Performance evaluation
Performance evaluation
Inventory data for infrastructure
systems
Inventory data for infrastructure
systems
Optimal maintenance planning
Optimal maintenance planning
Figure 8 Technological components for integrated lifetime management system
SP-14