itaú corpbanca institutional investors presentation may
TRANSCRIPT

1Q21
Institutional Presentation
Itaú Corpbanca

Disclaimers
• This presentation is not an offer for sale of securities. This material has been prepared solely for informational purposes and is not to be construed as a solicitation or an offer to buy or sell any securities and should not be treated as giving investment advice. No representation or warranty, either express or implied, is provided in relation to the accuracy, completeness or reliability of the information contained herein. Any opinions expressed in this material are subject to change without notice and neither Itaú Corpbanca (the “Bank”) nor any other person is under obligation to update or keep current the information contained herein. The information contained herein does not purport to be complete and is subject to qualifications and assumptions, and neither the Bank nor any agent can give any representations as to the accuracy thereof. The Bank and its respective affiliates, agents, directors, partners and employees accept no liability whatsoever for any loss or damage of any kind arising out of the use of all or any part of this material
• Certain statements in this presentation may be considered forward-looking statements. Forward-looking information is often, but not always, identified by the use of words such as “anticipate,” “believe,” “expect,” “plan,” “intend,” “forecast,” “target,” “project,” “may,” “will,” “should,” “could,” “estimate,” “predict” or similar words suggesting future outcomes or language suggesting an outlook. These forward-looking statements include, but are not limited to, anticipated future financial and operating performance and results, including estimates for growth, as well as risks and benefits of changes in the laws of the countries we operate
• These statements are based on the current expectations of the Bank’s management. There are risks and uncertainties that could cause actual results to differ materially from the forward-looking statements included in this communication. For example, (1) problems that may arise in successfully integrating the businesses of Banco Itaú Chile and Corpbanca, which may result in the combined company not operating as effectively and efficiently as expected; (2) the combined company may be unable to achieve cost-cutting synergies or it may take longer than expected to achieve those synergies; (3) the credit ratings of the combined company or its subsidiaries may be different from what the Bank or its controlling shareholders expect; (4) the industry may be subject to future regulatory or legislative actions that could adversely affect the Bank; and (5) the Bank may be adversely affected by other economic, business, and/or competitive factors
• Forward-looking statements and information are based on current beliefs as well as assumptions made by and information currently available to the Bank’s management. Although management considers these assumptions to be reasonable based on information currently available to it, they may prove to be incorrect. By their very nature, forward-looking statements involve inherent risks and uncertainties, both general and specific, and risks that predictions, forecasts, projections and other forward-looking statements will not be achieved
• We caution readers not to place undue reliance on these statements as a number of important factors could cause the actual results to differ materially from the beliefs, plans, objectives, expectations and anticipations, estimates and intentions expressed in such forward-looking statements. More information on potential factors that could affect Itaú Corpbanca’s financial results is included from time to time in the “Risk Factors” section of Itaú Corpbanca’s Annual Report on Form 20-F for the fiscal year ended December 31, 2020 filed with the U.S. Securities and Exchange Commission (the “SEC”). Furthermore, any forward-looking statement contained in this presentation speaks only as of the date hereof and Itaú Corpbanca does not undertake any obligation to update publicly or to revise any of the included forward-looking statements, whether as a result of new information, future events or otherwise. The forward-looking statements contained in this presentation are expressly qualified by this cautionary statement
• This presentation may not be reproduced in any manner whatsoever. Any reproduction of this document in whole or in part is unauthorized. Failure to comply with this directive may result in a violation of the U.S. Securities Act of 1933, as amended, or the applicable laws of other jurisdiction
• The information contained herein should not be relied upon by any person. Furthermore, you should consult with own legal, regulatory, tax, business, investment, financial and accounting advisers to the extent that you deem it necessary, and make your own investment, hedging and trading decision based upon your own judgment and advice from such advisers as you deem necessary and not upon any view expressed in this material
• The Bank is an issuer in Chile of securities registered and regulated by the Financial Market Commission, or “CMF”. Shares of our common stock are traded on the Bolsa de Comercio de Santiago—Bolsa de Valores, or the Santiago Stock Exchange and the Bolsa Electrónica de Chile— Bolsa de Valores, or Electronic Stock Exchange, which we jointly refer to as the “Chilean Stock Exchanges,” under the symbol “ITAUCORP.” The Bank’s American Depositary Shares are traded on the New York Stock Exchange under the symbol “ITCB.” Accordingly, we are currently required to file quarterly and annual reports in Spanish and issue hechos esenciales o relevantes (notices of essential or material events) to the CMF and provide copies of such reports and notices to the Chilean Stock Exchanges and the SEC. All such reports are available at www.cmf.cl, www.sec.gov and ir.itau.cl.
2

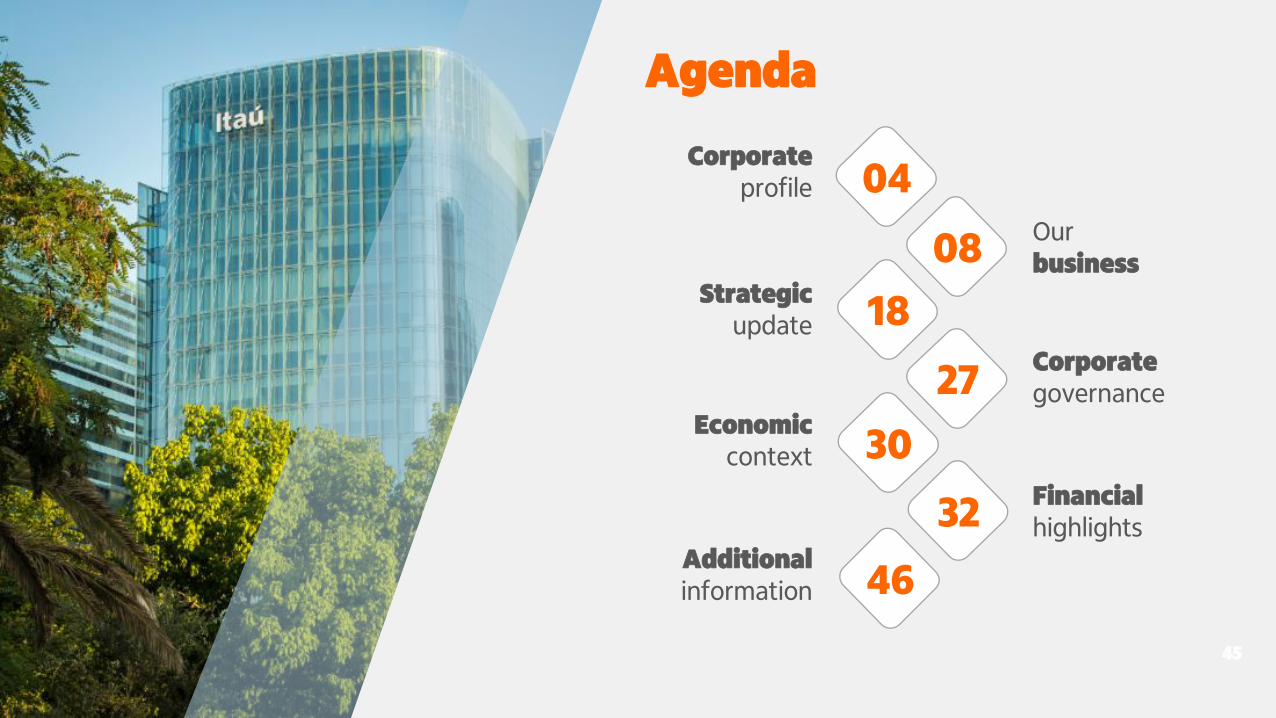
Agenda
Economic context
Ourbusiness
Corporate profile
Corporategovernance
Strategicupdate
04
08
18
27
30
32
46
Financialhighlights
3
Additional information

Universal bank | We are key part of Itaú Unibanco’s internationalization strategy
About us?Corporate profile
4
1− Information as of March 31, 2021; 2− Figures were converted at an exchange rate of 720.19 CLP/USD; 3− Information as of February 28, 2021; 4− Headcount for Chile includes employees of our New York branch and for Colombia includes headcount of Itaú (Panama); 5− Branches for Chile include one branch in New York and for Colombia include one office in Panama; 6− Tangible Equity: Shareholders equity net of goodwill, intangibles from business combination and related deferred tax liabilities; 7– Considering the consolidated loan portfolios of Itaú Unibanco and Itaú Corpbanca reported in their respective 1Q’21 MD&As at a R$ 5.6863 / US$ and a Ch$ 720.19 / US$ foreign exchange rates as of 31.03.2021.
Sources: Itaú Corpbanca, CMF and SFC.
Itaú Corpbanca represents 24% of Itaú Unibanco’s consolidated loan portfolio7
9.8% 3.7%3Market Share
US$ 25.6 bn US$ 5.9 bn Loans US$ 31.5 bn
5,249 3,067Headcount 4 8,316
191 109 Branches 5 300
US$ 39.0 bn US$ 7.7 bnAssets US$ 46.7 bn
US$ 86 mn US$ 17 mn Recurring Net
Income 1Q21 US$ 103 mn
25.4% 9.9% Recurring
RoTAE 1Q21 6 21.5%
Regional footprint & main indicators 1 2

5
How hace we evolved?Corporate profile
Adaptable culture | innovation | transparency in business
1977
Launch of First Nacional Bank of
Boston in Chile
1871
Creation of the Bank under the
name of Banco de Concepción
1997
Banco Concepción
rebranded to Corpbanca
2003
NYSE ListingADR program
2004
Bank of América takes control after merger with Bank of Boston in the USA
2007
Launch of Banco Itaú
Chile
2009
New York Branch
2012
Acquisition in Colombia of Banco
Santander Colombia
2011
Acquisition of MCC, an asset manager and broker dealer
1998
M&A of Consumer Finance Corfinsa and
Financiera Condell
1971
M&A of Banco Francés, Banco
Italiano and Banco Valdivia
1975 1995
INFISA (now known as CORPGROUP) adquired Banco
Concepción
2002
Local IPO
2013
Acquisition in Colombia of Helm Bank
2017
Merger
• Team building, corporate governance, risk management framework and other policies
2019
Construction
• Full focus on client satisfaction
• Completing technological integration and advancing with digital agenda
• Strengthening our culture throughout the organization
Transition
• Migration and client segmentation of retail clients in Chile
• Initial roll out of digital initiatives
• Introduction of Itaú Brand in the Colombian retail Market
2018
Consolidation
• Continue to deepen Itaú’s management model
• Advance in the process of digital transformation
• Start implementation of a transformation plan
2020
Transformation
• Strategic planning to build the banking of the future.
2021
2016
Merge between Banco Itaú Chile and Corpbanca

What are we seeking?Corporate profile
6
Our
Purpose
People mean everything to us
Simple. Always
To change leagues and compare ourselves with the
world’s best companies in client satisfaction.
Our culture
Our Way
Strategic agenda
driving customer satisfaction and
efficiency
Simplification
Customer experienceas a source of
competitive advantage
Clientcentricity
easy andconvenient offer
Digitalexperience
in an agile working model to acceleratedelivery
Talentdevelopment
To deliver a recurring and sustainable result of RoTE of 16% by 2025
Sustainableresults
Ethics are non-negotiable
Passionate about performance
The best argument is the one that matters
We think and act like owners
It´s only good for us if it’s good for the client
Promoting people’s power of transformation
Changing
Our
VisionTo be the leading bank in sustainable
performance and customer satisfaction

Agenda
Economic context
Ourbusiness
Corporate profile
Corporategovernance
Strategicupdate
04
08
18
27
30
32
46
Financialhighlights
7
Additional information

Who are our clients?Our business
8
Individualsby monthly income
(CLP mn)
over $8.0
from $2.5 to $8.0
from $0.6 to $2.5
up to $0.6
Private Bank
Personal Bank
Itaú Branches
Condell
over $100
from $8 to $100
from $1 to $8
from $0.1 to $1
Corporate
Large
Middle
Very Small and Small
Wh
ole
sale
Ba
nk
ing
Re
tail
Ba
nk
ing
Companiesby annual sales(USD mn)
Client profileby segment in Chile
Through our Retail and Wholesale Banking segments we offer a wide range of products and services tailored to each client profile.

Our talent1Our business
By hierarchical level Training and performanceBy gender
By age bracket By region
Employees2
thousand5
in Chile and New York
Approximately Arica y Parinacota
0.2%
3,6 k people30-50 years69.1%
0,7 k peopleup to 30 years12.8%
Men
Women
48%
52%
1 – December 31, 2020; 2 – December 31, 2020.
0.4%1.4%
1.7%
0.7%
1.6%4.9%1.2%
1.8%4.0%
1.3%
1.2%
0.6%
77.7%
0.6%
0.1%
Tarapaca
Antofagasta
Atacama
Coquimbo
Valparaíso
O’higgins
Maule
Bío-Bío
Araucanía
Los ríos
Los lagos
Aysén
Magallanes y Antartica
Metropolitana
Ñuble
0.7%
47%
33%
51%
73%
83%
53%
67%
49%
27%
17%Corporate managers
4.3%Managers and deputy managers
54.4% Professionals
18.1% Technicians
23.0% Administrative staff
0,9 k people> 50 years
18.1%
9
+ 160.000hours of training
92% participation in the Performance Cycle

Retail banking Our business
Our distribution networkis based on segmentation model with well defined identity and value proposition, aimed at optimizing service level, satisfaction and profitability per client
1− Additionally, 34 Personal Bank Corners
DigitalApproach
Multi-Channel
First Call Resolution
ExtendedHours
AccountLoad
10
13% 15% 53% 20%
our distribution network in Chile comprises
SouthSantiagoMidNorth
Branches in Chile191 branches
406 ATMsin Chile
Itaú Personal Bank1 23
brick and mortar branches
Itaú Sucursales 109
Condell (Consumer Finance) 54
New York Branch 1
digital branches
Itaú Personal Bank 2
Itaú Sucursales 2

Growth Our business
Business mix an opportunity for retail growth
11
1− 12-month average gross loans; 2− Interest rate by segments; 3−Where appropriate, data is pro forma with Santander Consumer for 2019; 4−As reported by each bank as of Sep.20, except for Peer-D which number is according to CMF as of the same date.
Loans breakdown by segment¹
11.9
5.9
11.8
5.6
Total
5.7 5.5
4.5 4.7
ItaúCorpbanca
AverageTop 3
Interest Rates2
31,114
Commercial
18,23225,976
Mortgage
34,662
∆ -30 bp-33 bp by mix
Peer-A Peer-B Peer-D
Current rate w/ top 3 mix
Current
Top 3
Top 3 rates w/ current mix
❑ Mix difference explains most of the Yield gap with the Top 3
100% =
57.0%50.4% 50.2%
65.4%
30.0%35.1% 38.0%
25.1%
13.0% 14.5% 11.8%9.6%
191131346329Branches4
Consumer3
Source: CMF; Itaú Corpbanca; Team Analysis.Yield ITCB with mix Peers 5.9%
1
2
3
4
LTM Mar 2021, Ch$ Bn
5.9
5.9
5.6
5.5

Growth Our business
12
7.5%
Commercial
Mortgage
Consumer
8.1%
11.3%
Total Loans
9.8%
31 bp
1 bp
44 bp
22 bp
Share 12-month
Retail growth
690 bpMar'21 vs. Jun'16
Portfolio Mix (%)
Retail: 33.9%
Retail: 35.2%
121 bp
Mar'20
Commercial
66.1%
Mortgage
23.5%
Consumer
10.4%
Commercial
64.8%
Mortgage
26.0%
Consumer
9.2%
Market Share (Mar'21)
Mar'21

Growth Our business
Funding mix an opportunity to increase profitability
13
Total funding breakdown Interest Rates
41,804 27,959
Debt Issued
53,758
Others1
100%35,941
1.0
1.2
1.3
1.5
Total
0.1 0.1
4.5 5.5
Itaú Corpbanca
0.4 0.0
Average Top 3
∆ 25 bp
13 bp by mix
Peer-A Peer-B Peer-D
Top 3 rates w/ current mix
Current rate w/ top 3 mix
❑ Non-interest bearing liabilities are the main reason for the gap when compared to the 3 players
Time Deposits
Source: CMF; Itaú Corpbanca; Team Analysis.
LTM Mar 2021, Ch$ Bn
22.6% 35.8%35.7% 32.4%
21.3%16.5%
18.4% 18.0%
22.3%
22.8%
28.3%36.8%
33.8%25.0%
17.6% 12.8%
Top 3
Current
Checking accountsand deposits
1−Others: Repurchases contracts, financial derivatives, bank obligations, letters of credit, other financial obligations, taxes, differed taxes, provisions, other liabilities; 2−As reported by each bank as of Sep.20, except for Peer-D which number is according to CMF as of the same date.
191131346329Branches2
Yield ITCB with mix Peers 1.4%
1
2
3
4
1.3
1.5
1.4
1.2

COVID-19 | 1Q 2021Our business
14
Vaccination
14.8 mn Vaccine doses
8.1 mn At least with one dose
12.6 mn Sinovac
6.7 mn Both doses
+ 60 years old83%
2.1 mn Pfizer+
<
Strict lockdowns decreasing
74.60 mnIn Latin America
1.09 biIn the World
Chile
14.62 mn
76.47
Colombia
4.82 mn9.27
Total number of vaccination doses administered per 100 people in the total population
Source: Chilean Ministry of Health, as of April 30, 2021 (https://informesdeis.minsal.cl/)
Source: Chilean Ministry of Science, as of April 30, 2021 (https://github.com/MinCiencia/Datos-COVID19/) Source: Official data by Our World in Data, as of April 29, 2021.
1009080706050403020100
28/0
7/20
28/0
4/2
1
28/0
2/21
28/0
1/21
28/0
8/2
0
28/0
9/2
0
28/1
0/2
0
28/1
1/20
28/1
2/20
Quarantine Weekend lockdown Restricted opening Preliminary opening
As of April 29, <73% of the population in lockdown
Nevertheless, short-term pain is expected to pave the way for a significant economic reopening in the coming months as the vaccine rollout remains brisk
28/0
3/21
Chile
Israel
United StatesUnited Kingdom
Brazil
Colombia
Vaccine doses

COVID-19 | Additional Government actionsOur business
15
Itaú
Total (Ch$ mn) 267,798 2,378,374
Accumulated as of April 19, 2021
11.3%
Banking System
% Itaú
FOGAPE COVID-19 Credit Concession | Itaú vs. Banking System
Expansion of Covid fund by US$6.2 billion − 2 % of GDP
▪ enhancing and extending the Family Emergency Income benefit
▪ boosting support to the middle class
▪ improving employment protection programs
▪ enhancing support to SMEs
Ministry of Finance
Central Bank of Chile
Third stage of the Credit Facility Conditional on Increased Lending (FCIC 3) − up to US$10 billion over a six-month period
Congress
Bill approved to expand benefits and uses of the Guarantee Fund for Small and Medium-Sized Firms (FOGAPE) to boost
credit with state guarantees
Legislators approved a third 10% pension withdrawal(a potential outlay of US$10 − 15 billion)
Itaú share in FOGAPE Reactiva is higher than its total loan market share
Total (#) 3,246 71,709

Colombia | 1Q21 Highlights Our business
16
3.9% 1.3% 0.7%
-31.0%
8.2%
About 1Q21
In COP
3.07 thousandemployees
in 1Q21
3.10 3.07
3.31
Dec-20 Mar-21Mar-20
109branches in Colombia in 1Q21
branches closed in Colombia qoq
2 ( 1.8%)
Efficiency ratioQuarterly (%)
(206.4) bn
19.1 tn
1Q21 4Q20
55.0 bn
19.7 tn
Net Income1
Loan portfolio
n.a.
+3.0%
315.0 bn373.9 bnOperating revenues +18.7%
(405.8) bn(83.9) bnCost of credit -79.3%
(224.5) bn(208.5) bnNon-interest expenses -7.1%
employees closed in Colombia qoq
31 ( 1.0%)
In billion COP and %
Recurring net income1 and RoTE evolution
24.3 9.1 5.4
-206.4
55.0
1Q'20 2Q'20 3Q'20 4Q'20 1Q'21
59.4%62.7% 62.6%
68.9%
56.5%
1Q'20 2Q'20 3Q'20 4Q'20 1Q'21
1 – Net Income under IFRS 9 for 4Q20 and 1Q21 are COP (85.4) billion and COP 48.5 billion, respectively.

Agenda
Economic context
Ourbusiness
Corporate profile
Corporategovernance
Strategicupdate
04
08
18
27
30
32
46
Financialhighlights
17
Additional information

Our evolution in the last 12-month periodStrategic update
18
Updating our strategy in three momentum
Crisis management COVID-19
New business modelTransition plan for a transformation agenda
In the first half of 2020 we organized our operation and prepared the bank for the
crisis, focusing on three pillars:
1. Clients2. People3. Our bank
Shortly after, we moved on to change our agenda from crisis management to building
the bank of the future Strategic focus / Disruption
Client Centricity
Simple First & Digital First
Innovative organization model
Sustainable results
Based on 5 pillars:
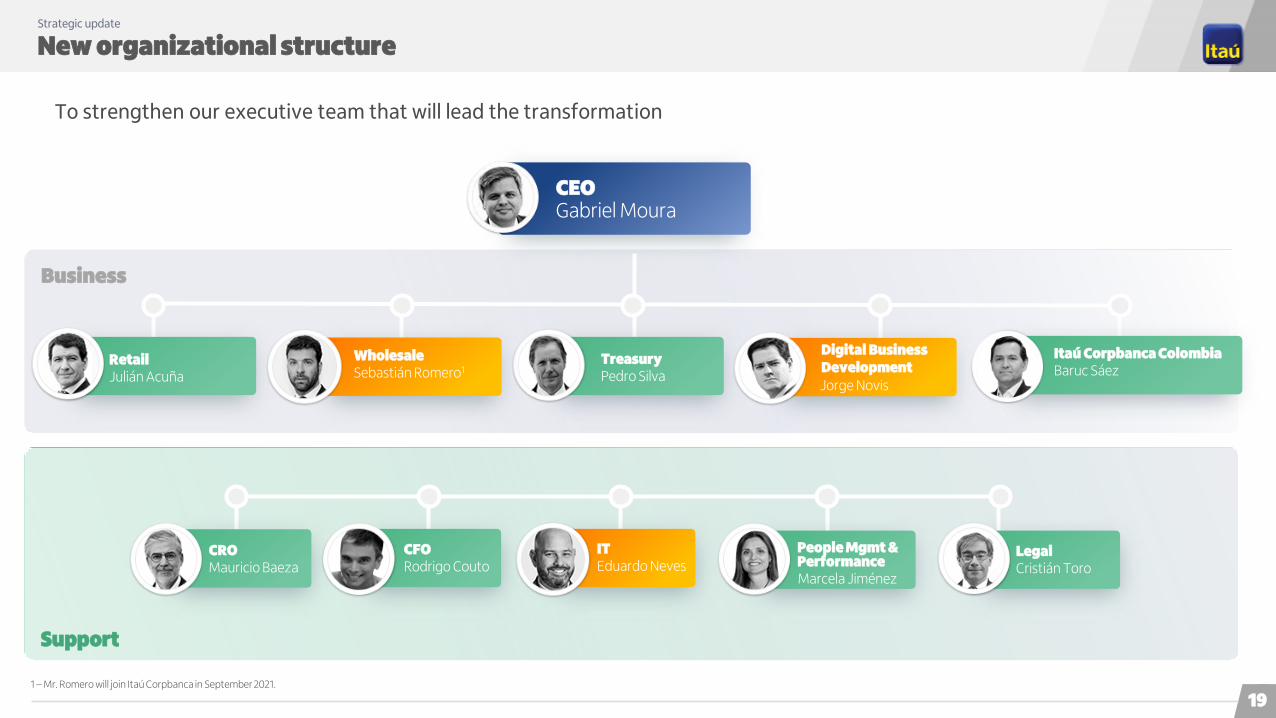
New organizational structureStrategic update
19
Business
Support
CEOGabriel Moura
TreasuryPedro Silva
RetailJulián Acuña
CFORodrigo Couto
ITEduardo Neves
LegalCristián Toro
CROMauricio Baeza
Marcela Jiménez
People Mgmt & Performance
Itaú Corpbanca ColombiaBaruc Sáez
To strengthen our executive team that will lead the transformation
WholesaleSebastián Romero1
Digital Business DevelopmentJorge Novis
1 – Mr. Romero will join Itaú Corpbanca in September 2021.

New members of our executive teamStrategic update
20
Has joined Itaú Corpbanca as head of IT in April 2021 .
Eduardo has more than 25 years of experience in technology, working mainly in the financial and telecommunications sectors.
Previously, he served as Vice President of Cloud Applications and Innovation for Latin America at IBM, from Brazil, where he led large-scale projects since joining in 2013.
He was responsible for the accounts of Bradesco and later Itaú Unibanco, managing most of the IBM Consulting business for Latin America.
Eduardo Neves
Corporate Director of IT
Engineering in Technology and MBA from the Federal University of Rio de Janeiro (UFRJ)
Sebastián Romero
Corporate Director of Wholesale Banking
Will join Itaú Corpbanca as head of Wholesale Banking in September 2021 .
Sebastián has served at Banco Santander globally in different positions since 1998. Currently, he serves as global director of Multinational Corporate Clients based in London, being a member of the Global Executive Committee of Banking & Corporate Finance.
Previously, he served as Global Director of Export & Agency Finance at Santander in Madrid and before, he led the Corporate Banking and Investment Banking unit in Chile.
B.A. in Business and Administration from Universidad Gabriela MistralPost-degree from Universidad Adolfo Ibáñez and Universidad de los Andes
Bringing new skills to complement our team

Organization to support transformation programStrategic update
21
Cross-cutting teams supporting the working fronts
Chief Transformation Officer (CTO)
We have created a transformation office and we are working with a proven methodology
Jorge Novis
Corporate Director of Digital Business Development. Previously served as Corporate Director of Operations between April 2018 and February 2021.
He joined Itaú Corpbanca in May 2017 as Head of Strategic Planning and Quality Service and previously worked at Itaú Unibanco for approximately four years, leading several business transformation programs.
He also worked as a management consultant between 2002 and 2014, working in Latin America, the US, Europe, and Asia.
Civil Engineer from Universidade Federal da Bahia and M.B.A. from Harvard Business School and Master of Science in Finance from Fundação Getulio Vargas
Finance Cell
IT Cell
People and Change Mgmt Cell
CTO
Central Tower
Implementation teams
Individuals value proposition
Companies value proposition
Products
Wholesale Banking
Treasury
Transformation Office (TO)
Working Fronts
…
Core Team
Fronts structure
Technology leader
Sponsor
Initiative owner
Front leader
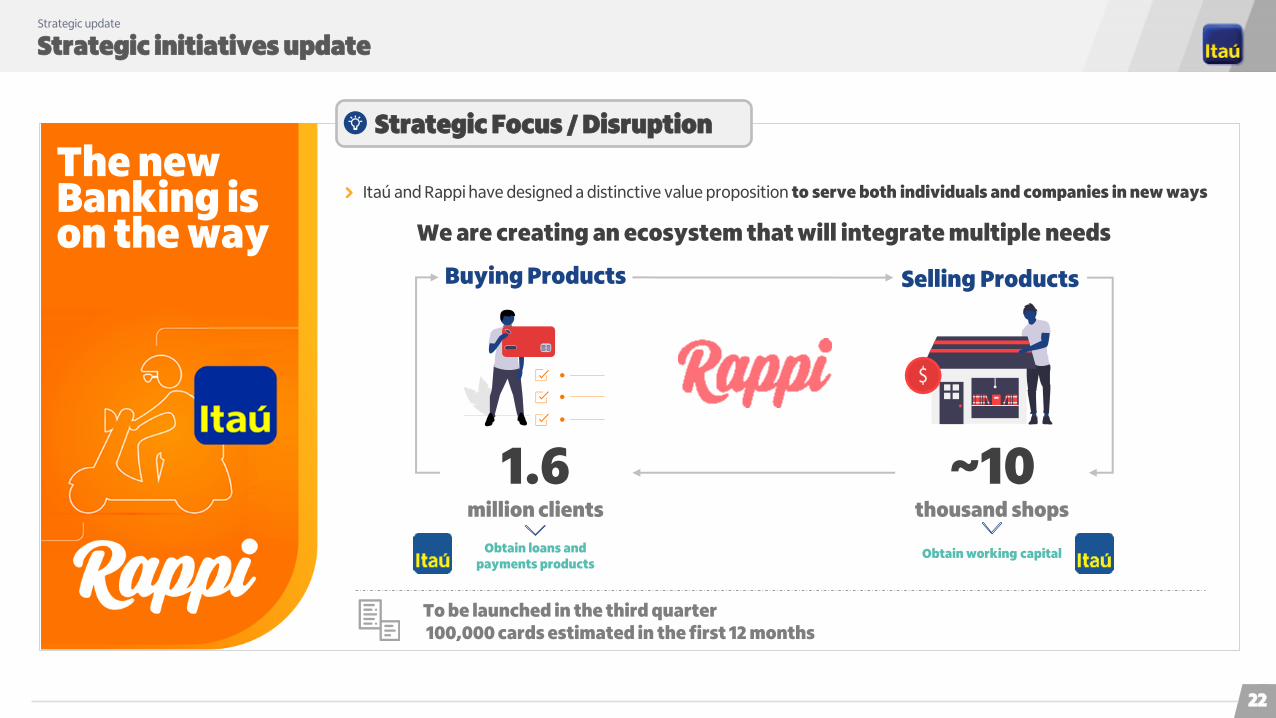
Strategic initiatives updateStrategic update
22
Itaú and Rappi have designed a distinctive value proposition to serve both individuals and companies in new ways
To be launched in the third quarter100,000 cards estimated in the first 12 months
We are creating an ecosystem that will integrate multiple needs
1.6million clients
~10thousand shops
Obtain loans and payments products
Obtain working capital
Selling ProductsBuying Products
Strategic Focus / Disruption
The new Banking is on the way

Strategic initiatives updateStrategic update
23
Retail Banking
Wholesale Banking
Total Bank
27 pp
19 pp
24 pp
Client centricity
NPS 1Q21 vs. 1Q20
NPS 1Q21 vs. 1Q20
NPS 1Q21 vs. 1Q20
Simple First & Digital First
100% Digital
Platform for openarchitecture
Transfers, investments and payments
Easy to use
Perfect for investing
Account without tangibles
Activation without TCO
No credit lines
Cost free for customers
Reduction of # fields
10 minutes maximum for onboarding
E-Sign digital signature
Online client creation
Checking account
INVIERTE+Simplified onboarding
New App
1st 1stNew version
Store rating ranking among peers
Digital Wallet
New version 1st New
version
We have launched the Cuenta Invierte+, a digital proposal designed to increase customer base for investment products
Itaú’s subscriber base as of February 2021.
42%43%
15%
strong yoy increase in NPSacross both retail and wholesale

Strategic initiatives updateStrategic update
24
Innovative organization model
Advancing towards an agile working model at scale, with full integration across all areas
This migration towards an agile operational model simplifies the organizational structure and therefore accelerates decision-making through empowered multidisciplinary teams
Morningstar Awards 2021
Best Asset Management
Fixed Income
IFR Awards 2020
Deal of the Year
Latin America Bond of the Year
Recovery in profitability in 2021, starting with strong first quarter
A transformation plan to achieve long-term RoTE goals
Wrapping up ….
First stage
Second stage
Integrated communities between business and
technology
Organization-wide redesign around Agile
Global Finance Banking 2021
Best Trade Finance Provider

Performance in ESGStrategic update
25
Corporate governance_Among market leaders
Environmental_Supporting responsible investments
How feasible is home office for you?
93%
Social_Digital transformation, remote first
ESG Emerging Stars (CLP)
ESG Global Credits (CLP)
Organizational
Climate (Pulso Survey)
84.6%
of 2020 employee's satisfaction
[at historically higher level][Home office – Bank’s survey results]

Agenda
Economic context
Ourbusiness
Corporate profile
Corporategovernance
Strategicupdate
04
08
18
27
30
32
46
Financialhighlights
26
Additional information

Shareholders & Stock marketCorporate governance
27
US$ 1.8 BnMarket Cap. (May. 13, 2021)
Source: Sell-side reports.
1 –Shareholders equity for Itaú Corpbanca and Bci is net of goodwill and intangibles from business combination.
Buy: 2 Hold: 6 Sell: 2Sell-side rating:
% Total share capital as of April 30, 2021
Average daily traded volumes12- month ended March 31, 2021
(U$ million)
1− Includes 36,000,000 shares owned by Corp Group Banking S.A. that are under custody
Price-to-Book1

Our managementCorporate governance
Board Chile
Wholesale
Gabriel Moura
Treasury IT People Mgmt & Performance
RetailCRO Legal
Baruc Sáez
Treasury
DanielBrasil
CRO
Juan Ignacio Castro
• Credit Risk:Gustavo Copelli
IT
BernardoAlba
Legal & General Secretary
Dolly Murcia
Human Resources
María LucíaOspina
Wholesale
JorgeVilla
Communications & Institutional Relations
Carolina Velasco
Operations
Liliana Suárez
Retail
Hernando Osorio
Chairman
Gabriel Moura
Matrix reporting to CEO Colombia and functional reporting to ITCB
Functional reporting to CEO Colombia and matrix reporting to ITCB for coordination of specific themes
Board Colombia
Board Colombia
Mónica Aparicio Smith
Roberto Brigard Holguín
Cristián Toro Cañas
Juan Echeverría González
Chairman
Gabriel Amado de Moura
Colombia
PedroSilva
MauricioBaeza
BarucSáez
ChristianTauber1
JuliánAcuña
MarcelaJiménez
CristiánToro
Eduardo Neves
Itaú Corpbanca Colombia CEO
Itaú Corpbanca CEO
Board Chile 2 3
Chairman
Jorge Andrés Saieh Guzmán
Ricardo Villela Marino
Milton Maluhy Filho
Rogério Carvalho Braga
Matias Granata
Pedro Samhan Escandar
Fernando Concha Ureta
Jorge Selume Zaror
Fernando Aguad Dagach
Gustavo Arriagada Morales
Bernard Pasquier
1− In September 2021 Mr. Sebastián Romero will replace Mr. Christian Tauber as Head of Wholesale Banking; 2− Itaú Unibanco and CorpGroup appoint the majority of the members of the board of directors; 3 − Pursuant to the Shareholders Agreement, the
Directors appointed by Itaú Unibanco and CorpGroup shall vote together as a single block according to Itaú Unibanco’s recommendation.
Audit Committee
CAE
Emerson Bastián
Franchise, Products & Digital
Ignacio José Giraldo
CFO
Rodrigo Couto
CFO
Juan PabloMichelsen
Digital Business Development
JorgeNovis
28

Agenda
Economic context
Ourbusiness
Corporate profile
Corporategovernance
Strategicupdate
04
08
18
27
30
32
46
Financialhighlights
29
Additional information

Our expectationsEconomic context
30
GDP Growth – % Interest Rates (EOP) – %
Inflation (CPI) – %
Source: Central Bank of Chile, Central Bank of Colombia and Itaú’s projections (updated as of May 7, 2021).
Exchange rates – CLP/USD & CLP/COP
3.7
0.9
-5.8
6.5
3.2 2.63.3
-6.8
5.03.5
2018 2019 2020 2021(e) 2022(e)
Chile Colombia
2.8
1.8
0.5 0.8
1.8
4.3 4.3
1.8 1.8
3.5
2018 2019 2020 2021(e) 2022(e)
Chile Colombia
2.6
3.0 3.0 3.0 3.0 3.2
3.8
1.6
2.8 3.0
2018 2019 2020 2021(e) 2022(e)
Chile Colombia
0.19
0.20
0.21
0.22
0.23
0.24
0.25
0.26
580
630
680
730
780
830
880
CLP/USD CLP/COP

Agenda
Economic context
Ourbusiness
Corporate profile
Corporategovernance
Strategicupdate
04
08
18
27
30
32
46
Financialhighlights
31
Additional information

Financial information Financial highlights
The financial information included in this Management Discussion & Analysis presentation is based on our managerial model which is based on our managerial model
that we adjust for non-recurring events and we apply managerial criteria to disclose our income statements. Starting in the first quarter of 2019, we have been
disclosing our income statement in the same manner as we do internally, incorporating additional P&L reclassifications, fully converging to the format presented by Itaú
Unibanco.
This managerial financial model reflects how we measure, analyze and discuss financial results by segregating: (i) commercial performance; (ii) financial risk
management; (iii) credit risk management; and (iv) costs efficiency.
We believe this form of communicating our results will give you a clearer and better view of how we fare under these different perspectives. Please refer to pages 9 to
12 of our Management Discussion & Analysis Report (“MD&A Report”) for further details, available at ir.itau.cl.
32

1Q21 About the quarter

1Q21 | About our quarterFinancial highlights
34
higherrevenues
lowercost of credit
0.4%
non-interest expenses decreased
mainly driven by higher provisions in 4Q’20 for corporate and SME clients of specific
sectors impacted by the COVID-19 pandemic
Recurring
Net
10.1%
Ch$95.1 billion
Ch$84.0 billion
Consolidated
Chile
48.8 p.p.Consolidated
Chile 53.1 p.p.
21.5 %
25.4 %Income
Recurring
Return onTangible
(qoq in Chile)
(qoq in Chile)
Equity (RoTE)
boosted by financial margin with the market driven by higher gains from
trading desk and ALM
89.3%(qoq in Chile)47.8%
Efficiency ratio improved by 5 p.p.

1Q21 | Loan growthFinancial highlights
35
In Ch$ trillion, end of period
11.86
6.34
4.63
1.71
1Q21 4Q20
11.98
6.49
4.79
1.70
Wholesale lending
Retail lending
Mortgage loans
Consumer loans
1.0%
2.3%
3.4%
-0.6%
18.2018.47Total Loans 1.4%
12.66
6.30
4.42
1.88
1Q20
-5.4%
3.0%
8.4%
-9.7%
18.96 -2.6%
1.4%
2.7%
1.5%
0.8%
0.3% 0.3%
1.3%
ITCB Peer-A Peer-D Peer-E Peer-C Peer-B Banking
System
Loan growth % Comparison QoQ
QoQ loan growth above Banking System average
Growth focused on retail, in line with strategy

1Q21 | Financial margin with clientsFinancial highlights
36
Annualized average rateFinancial margin with clients
Ch$ billion
Change in Financial margin with clients
Assets financial margin Liabilities financial margin Capital financialmargin
146.9152.5
140.8150.1 147.7
1Q'20 2Q'20 3Q'20 4Q'20 1Q'21
-1.6%
0.5% Ch$ billion2.6%
2.5%
2.2%2.5% 2.5%
1.6%
0.5% 0.5% 0.5% 0.5%
1Q'20 2Q'20 3Q'20 4Q'20 1Q'21
Financial margin with clients Average MPR
150.1
(0.2) (1.0)
2.1 0.1 0.5 0.2 0.6
(4.9)
147.7
4Q'20 Portfolio mix Volume Spreads Portfolio mix Volume Spreads Commercial spreads
on derivatives and
FX transactions with
clients
Capital financial
margin
1Q'21
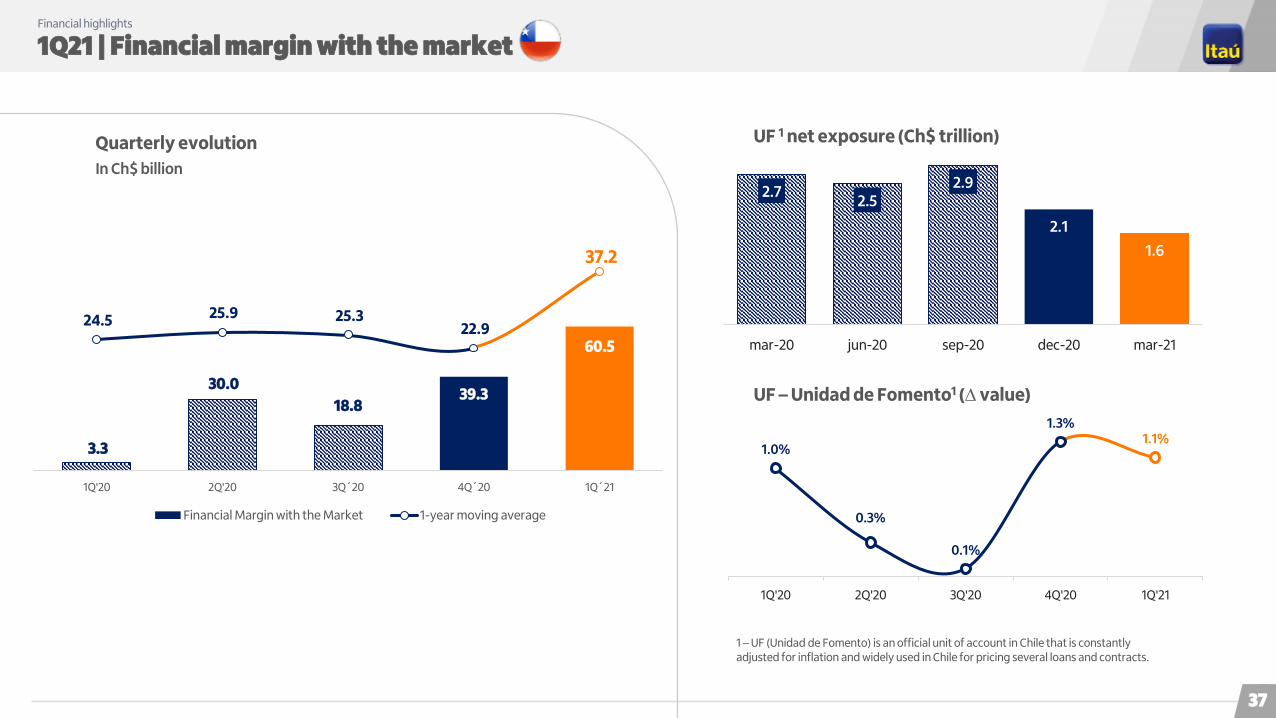
1Q21 | Financial margin with the marketFinancial highlights
37
Quarterly evolution
In Ch$ billion
1 – UF (Unidad de Fomento) is an official unit of account in Chile that is constantly adjusted for inflation and widely used in Chile for pricing several loans and contracts.
UF 1 net exposure (Ch$ trillion)
UF – Unidad de Fomento1 (∆ value)
2.72.5
2.9
2.1
1.6
mar-20 jun-20 sep-20 dec-20 mar-21
1.0%
0.3%
0.1%
1.3%1.1%
1Q'20 2Q'20 3Q'20 4Q'20 1Q'21
3.3
30.0
18.839.3
60.5
24.5 25.9 25.3 22.9
37.2
-
5.0
1 0.0
1 5.0
20.0
25.0
30.0
35.0
4 0.0
-
1 0.0
20.0
30.0
4 0.0
50.0
6 0.0
70.0
8 0.0
9 0.0
1Q'20 2Q'20 3Q´20 4Q´20 1Q´21
Financial Margin with the Market 1-year moving average

128% 131% 136%
113% 115%
150%
177%
218%
177%
2.5% 2.5% 2.5%2.8% 2.9% 3.0%
3.2%
4.1% 4.0%
2.2%
2.7%
3.2%
3.7%
4.2%
4.7%
70%
90%
110%
130%
150%
170%
190%
210%
mar-19 jun-19 sep-19 dec-19 mar-20 jun-20 sep-20 dec-20 mar-21
NPL90 Coverage Provisions / Loans
1Q21 | Cost of credit and credit qualityFinancial highlights
38
Cost of creditIn Ch$ billion
Cost of Credit Risk Cost of Credit Risk / Average Loans
Low cost of credit in 1Q21Good performance of NPLs ‒1.2% and 0.5%, respectively‒ for both consumer and mortgage loans with payment holidays granted in 2020 (100% in repayment)
Non-performing Loans (90+ days -%)
Coverage ratio (90+ days NPL ‒ %)
1
1 – Includes additional provisions.
55.6 73.7 88.9
231.4
24.8
1Q'20 2Q'20 3Q'20 4Q'20 1Q'21
1.2% 1.5% 1.9%
5.0%
0.5%
55.6 24.8
3M20 3M21
1.2%0.5%
1
1.5%1.5%
1.4%
2.3%
2.3%
1.5%
1.7%
1.7%
2.4%
1.8%1.7%
1.6%
1.7%1.6% 1.6%
1.3%1.1%
1.1%
2.0%
1.7%
2.0% 2.2%
2.5%2.6%
1.2%
1.7%
1.8%
1.9%1.9%
1.8%
2.5%2.5%
2.0%
1.8% 1.9%
2.3%
mar-19 jun-19 sep-19 dec-19 mar-20 jun-20 sep-20 dec-20 mar-21
Comm. ex-Students loans Mortgage Consumer Total
NPLs for consumer and mortgage loans with no payment holidays granted are below pre-pandemic levels (1.9% and 1.4%, respectively)
Relief measures appear to have been effective in providing a liquidity cushion to companies and individuals to counter the economic effects of the pandemic

1Q21 | Non-interest expensesFinancial highlights
39
In Ch$ billion
(43.2)
(64.0)
(107.2)
(8.5)
1Q21 4Q20
(48.1)
(58.3)
(106.4)
(8.8)
Personnel
Administrative
Total Personnel and Administrative
Depreciation, Amortization and Impairment
11.3%
-8.9%
-0.8%
3.7%
(115.7)(115.2)Non-Interest Expenses -0.4%
(47.8)
(51.3)
(99.1)
(10.0)
1Q20
0.6%
13.6%
7.4%
-11.8%
(109.1) 5.6%
Efficiency ratioquarterly (%)
58.6%
52.3%
62.3%
52.8%47.8%
1Q'20 2Q'20 3Q'20 4Q'20 1Q'21
EfficiencyExpenses
0.4% 5 p.p.(qoq) (qoq)

1Q21 | Liquidity Financial highlights
40
LCR 1
1 – LCR: Liquidity Coverage Ratio calculated according to BIS III rules. Regulatory LCR ratios are still under construction in Chile. 2 – NSFR: Net Stable Funding Ratio, the methodology used to estimate NSFR consist of liquidity ratio proposed by the “Basel III Committee on Banking Supervision” (“BIS III”) that was adopted by the CMF.Source: Quarterly Liquidity Status Report as of March 31, 2021.
NSFR 2
Strong liquidity positionLCR and NSFR ratios continue to be at historically high levels
80.0%
100.0%
120.0%
140.0%
160.0%
180.0%
200.0%
220.0%
Mar.20 Apr.20 May.20 Jun.20 Jul.20 Aug.20 Sep.20 Oct.20 Nov.20 Dec.20 Jan.21 Feb.21 Mar.21
179.5%
82.0%
87.0%
92.0%
97.0%
102.0%
107.0%
Mar.20 Apr.20 May.20 Jun.20 Jul.20 Aug.20 Sep.20 Oct.20 Nov.20 Dec.20 Jan.21 Feb.21 Mar.21
104.0%

1Q21 | BIS III: Capital ratios estimatesFinancial highlights
41
Fully loaded CET1 ratio
increased 50 bp yoy and
20 bp qoq
Improved capital ratios
6.4%6.5%
7.0%
6.7%
6.9%
Mar.20 Jun.20 Sep.20 Dec.20 Mar.21
CET 1
Estimated Fully Loaded BIS III Capital Evolution
50 bp(yoy)

2021 About the year

2021 Macroeconomic outlookFinancial highlights
43
2018 2019 2020 2021
GDP 1
Inflation 2
Interest Rate 2
1 ‒ Projected GDP for Chile in 2021; 2‒ End of period.
Source: Central Bank of Chile and Itaú’s projections (updated as of May 7, 2021).
2.6%
3.0% 3.0% 3.0%
2.75%
1.75%
0.50% 0.75%
3.7% 0.9%
-5.8%
6.5%

2021 GuidanceFinancial highlights
44
mid single digit
retail 1 segments
range from 1.0% to 1.3%
Loan Growth
Growth focus
Cost of credit Risk 2
Adjusted Non-Interest Expenses
Expected2021 Guidance
below inflation
1 – Retail refers to our retail bank, which serves individuals and SMEs in all their financial services needs; 2 – Net provision for credit & counterparty risks.
Agenda
Economic context
Ourbusiness
Corporate profile
Corporategovernance
Strategicupdate
04
08
18
27
30
32
46
Financialhighlights
45
Additional information

Current international ratings Additional information
Moody's S&P
Financial
Capacity
Rating Scale Rating Scale
LT ST LT ST
Extremely
strongAaa
P-1
AAA
A-1+Very
strong
Aa1 AA+
Aa2 AA
Aa3 AA-
Strong
A1 A+
A-1
A2 A
A3
P-2
A-
A-2
Adequate
Baa1 BBB+
Baa2
P-3
BBB
A-3
Baa3 BBB-
46
A+A+
AA
A+
A
A+
A
A
A-A-
BBB+BBB+
BBB BBB
BBB+
A-
Timeline S&P
A-2
A-3
BBB
A-A-

Average tangible equity breakdownAdditional information
47
All other Assets: Ch$ 34,021
Ch$ 28,212
Ch $5,809
All other Liabilities: Ch$ 32,177
Ch$ 26,890
Ch$ 5,288
Asociado a Intangibles PPA: Ch$ 40
Minority Interest ex GW and PPA Intangibles: Ch$ 72
Assets: 34,597
Liabilities: 32,200
Minority Interest: 72
1Q’21 Average balance (Ch$ Tn)
Managerial Tangible Equity: Ch$ 1,772
Ch$ 1,322
Ch$ 450
Shareholders’ Equity: 2,326
Managerial Tang. Equity:
Recurring Results:
Recurring RoTE:
Ch$ 1,772 Ch$ 1,322 Ch$ 450
Ch$ 95.1 Ch$ 84.0 Ch$ 11.2
÷ ÷ ÷
21.5% 25.4% 9.9%
= = =
Goodwill: Ch$ 493
Ch$ 268
Ch$ 225
Intangibles from PPA: Ch$ 84
Ch$ 84
Ch$ -
Deferred taxes asociated with intangibles from PPA: Ch$ 22
Ch$ 22
Ch$ -
Associated w/ PPA Intangibles: Ch$ -
GW and PPA Intangibles: Ch$ 554
Ch$ 329
Ch$ 225

Transactions in ColombiaAdditional information
Itaú Corpbanca acquired shares of Itaú Corpbanca Colombia from Helm LLC
Structure in Colombia
Itaú Corpbanca
Itaú CorpbancaColombia
(754,806,213 total shares)
▪ On June 16, 2017, Itaú Corpbanca Colombia acquired Itaú BBA Colombia assets and liabilities1
▪ Postponement of the date for Itaú Corpbanca to purchase the 12.36% stake of CorpGroup in Itaú Corpbanca Colombia:
‐ The postponement date to purchase is until January 28, 2022
‐ The purchase price has not changed and will be US$3.5367 per share (US$330 million in total) plus (i) interest from (and including) August 4, 2015 until (but excluding) the payment date at an annual interest rate equal to Libor plus 2.7% minus (ii) the sum of (x) the aggregate amount of dividends paid by Itaú Corpbanca Colombia to CorpGroup since the date of the Transaction Agreement, plus (y) the accrued interest with respect to the amount of such dividends since the date of their payment until the payment date of the purchase price, at an annual interest rate equal to Libor plus 2.7%.
▪ Itaú Corpbanca acquired shares of Itaú Corpbanca Colombia from Helm LLC and Kresge Stock Holding Company
‐ On December 3, 2019, following receipt of regulatory approvals from the banking supervisors in Chile, Colombia and Brazil, Itaú Corpbanca completed its previously announced acquisition of shares of Itaú Corpbanca Colombia from Helm LLC and Kresge Stock Holding Company
‐ Itaú Corpbanca acquired shares representing approximately 20.82% of Itaú Corpbanca Colombia’s outstanding equity for aggregate consideration of approximately US$334 million which implies a valuation multiple of 1.37 times book value as of October 31, 2019. This valuation is consistent with the valuation of Itaú Corpbanca Colombia in Itaú Corpbanca’s financial statements
CorpGroupOther
Minorities
Itaú BBA Colombia (asset and liabilities))
87.10% 12.36% 0.54%
Acquisition in 2017
1 − Itaú Corpbanca Colombia S.A. paid Ch$33,205 million to Itaú BBA Colombia S.A. Corporación Financiera.
48

Global macroeconomic outlookAdditional information
Itaú´s projections updated on May 7, 2021.49
2011 2012 2013 2014 2015 2016 2017 2018 2019 2020 2021F 2022F
GDP Growth (%) - World Economy
World 4.2 3.5 3.5 3.6 3.5 3.3 3.8 3.6 2.8 -3.3 6.3 4.5
USA 1.6 2.2 1.8 2.5 2.9 1.6 2.4 2.9 2.4 -3.5 6.7 4.7
Euro Zone 1.7 -0.8 -0.2 1.4 2.0 1.9 2.7 1.9 1.3 -6.7 4.9 5.2
China 9.5 7.9 7.9 7.4 7.1 6.9 7.0 6.7 6.1 2.3 8.5 5.0
GDP Growth (%) - Latam
Brazil 4.0 1.9 3.0 0.5 -3.5 -3.3 1.3 1.8 1.4 -4.1 4.0 1.8
Chile 6.1 5.3 4.0 1.8 2.3 1.7 1.2 3.7 0.9 -5.8 6.5 3.2
Colombia 7.4 3.9 4.6 4.7 3.0 2.1 1.4 2.6 3.3 -6.8 5.0 3.5
Mexico 4.0 3.6 1.4 2.8 3.3 2.9 2.1 2.2 -0.1 -8.2 6.0 3.4
Peru 6.5 6.0 5.8 2.4 3.3 4.0 2.5 4.0 2.2 -11.1 10.2 4.5
Inflation (eop, %)
Brazil (IPCA) 6.5 5.8 5.9 6.4 10.7 6.3 2.9 3.7 4.3 4.5 5.3 3.6
Chile 4.4 1.5 3.0 4.6 4.4 2.7 2.3 2.6 3.0 3.0 3.0 3.0
Colombia 3.7 2.4 1.9 3.7 6.8 5.8 4.1 3.2 3.8 1.6 2.8 3.0
Mexico 3.8 3.6 4.0 4.1 2.1 3.4 6.8 4.8 2.8 3.2 4.4 3.5
Peru 4.7 2.6 2.9 3.2 4.4 3.2 1.4 2.2 1.9 2.0 2.5 2.3
Monetary Policy Rate (eop, %)
Brazil 11.00 7.25 10.00 11.75 14.25 13.75 7.00 6.50 4.50 2.00 5.50 5.50
Chile 5.25 5.00 4.50 3.00 3.50 3.50 2.50 2.75 1.75 0.50 0.75 1.75
Colombia 4.75 4.25 3.25 4.50 5.75 7.50 4.75 4.25 4.25 1.75 1.75 3.50
Mexico 4.50 4.50 3.50 3.00 3.25 5.75 7.25 8.25 7.25 4.25 4.00 4.00
Peru 4.25 4.25 4.00 3.50 3.75 4.25 3.25 2.75 2.25 0.25 0.25 1.00
Unemployment Rate (avg, %)
Brazil - 7.4 7.1 6.8 8.5 11.5 12.7 12.3 11.9 13.5 13.6 12.8
Chile 7.1 6.4 5.9 6.4 6.2 6.5 7.0 7.4 7.2 10.8 8.7 7.5
Colombia 10.8 10.4 9.6 9.1 8.9 9.2 9.4 9.7 10.5 16.1 14.0 11.0
Mexico 5.2 4.9 4.9 4.8 4.4 3.9 3.4 3.3 3.5 4.4 4.2 4.0
Peru 7.7 7.0 5.9 6.0 6.4 6.7 6.9 6.6 6.6 13.6 9.0 7.0

Macroeconomic outlookAdditional information
GDP Growth ‒ % (YoY) Per Capita GDP ‒ US$ Thousand
Unemployment rate ‒ % Inflation and Policy Rate ‒ %
5.1
3.32.7
3.8
7.06.2
5.75.2
3.5
-1.6
5.8 6.15.3
4.0
1.8 2.31.7
1.2
3.7
0.9
-5.8
6.5
3.2
-8-7-6-5-4-3-2-1012345678
Dec-00 Dec-05 Dec-10 Dec-15 Dec-20 5.1 4.6 4.5 4.86.2
7.6
9.510.510.710.6
12.914.2
15.3 15.614.5
13.314.0
15.115.9
14.4
13.0
15.015.6
0
2
4
6
8
10
12
14
16
18
Dec-00 Dec-05 Dec-10 Dec-15 Dec-20
9.7 9.9 9.89.5
10.0
9.3
8.0
7.0
7.8
10.8
8.3
7.2
6.56.0
6.3 6.36.7
7.07.4 7.2
10.8
8.7
7.5
4
5
6
7
8
9
10
11
12
Dec-00 Dec-05 Dec-10 Dec-15 Dec-20
4.5
2.6 2.8
1.1
2.4
3.7
2.6
7.8 7.1
-1.4
3.0
4.4
1.5
3.0
4.6 4.4
2.72.3 2.6 3.0 3.0 3.0 3.0
-2
0
2
4
6
8
10
Dec-00 Dec-05 Dec-10 Dec-15 Dec-20
Inflation Policy Rate
Itaú´s projections updated on May 7, 2021.
50

International Reserves ‒ % of GDP Current Account Balance ‒ % of GDP
Central Government Fiscal Balance ‒ % of GDP External Debt ‒ % of GDP
19.420.2
21.920.8
16.1
13.812.6
9.8
13.214.2
12.6
17.115.6
14.915.7
16.215.9
13.913.4
14.815.516.516.5
0
5
10
15
20
25
Dec-00 Dec-05 Dec-10 Dec-15 Dec-20
-1.2-1.5
-0.8 -1.1
2.6
1.5
4.64.1
-3.2
1.71.3
-1.7
-3.9 -4.1
-1.7-2.4
-2.0-2.3
-3.9 -3.7
1.4
-0.7
-1.4
-5-4-3-2-1012345
Dec-00 Dec-05 Dec-10 Dec-15 Dec-20
-0.6-0.5
-1.2-0.4
2.1
4.4
7.37.8
3.9
-4.4
-0.5
1.30.6
-0.6-1.6
-2.1 -2.7 -2.8-1.6
-2.8
-7.4
-3.8 -3.3
-11
-9
-7
-5
-3
-1
1
3
5
7
Dec-00 Dec-05 Dec-10 Dec-15 Dec-20
13.0 10.5 8.0 7.4 6.7 6.9 8.0 8.3 9.0 10.4 10.2 12.1 13.3 13.9 16.9 17.421.3 26.6
43.6
33.7
28.825.1 25.4
29.833.3
30.731.9
35.539.5
46.9
53.950.8 47.7 45.0
49.2 55.4
0
10
20
30
40
50
60
70
Dec-03 Dec-09 Dec-15 Dec-21
Private Public
Itaú´s projections updated on May 7, 2021.
51
Macroeconomic outlookAdditional information

GDP Growth ‒ % (YoY) Per Capita GDP ‒ US$ Thousand
Unemployment rate ‒ % Inflation and Policy Rate ‒ %
2.9
1.72.5
3.9
5.34.7
6.8 6.8
3.3
1.2
4.3
7.4
3.94.6 4.7
3.02.1
1.4
2.63.3
-6.8
5.0
3.5
-7-6-5-4-3-2-1012345678
Dec-00 Dec-05 Dec-10 Dec-15 Dec-20 2.5 2.4 2.4 2.32.8
3.43.7
4.75.3 5.2
6.3
7.38.0 8.1 8.0
6.15.8
6.36.7
6.4
5.35.9 6.1
0
1
2
3
4
5
6
7
8
9
Dec-00 Dec-05 Dec-10 Dec-15 Dec-20
13.3
15.015.6
14.113.7
11.812.011.211.3
12.011.8
10.810.4
9.69.1 8.9 9.2 9.4 9.7
10.5
16.1
14.0
11.0
5
7
9
11
13
15
17
Dec-00 Dec-05 Dec-10 Dec-15 Dec-20
8.77.6
7.06.5
5.54.9 4.5
5.7
7.7
2.0
3.2
3.7
2.4 1.9
3.7
6.8
5.8 4.1
3.2 3.8
1.62.8
3.0
0
5
10
15
Dec-00 Dec-05 Dec-10 Dec-15 Dec-20Inflation Policy Rate
Itaú´s projections updated on May 7, 2021.
52
Macroeconomic outlookAdditional information

International Reserves ‒ % of GDP Current Account Balance ‒ % of GDP
Central Government Fiscal Balance ‒ % of GDP External Debt ‒ % of GDP
-5.0-5.5
-5.7
-4.7-4.9
-4.3-3.7
-3.0-2.3
-4.1-3.9
-2.8-2.3-2.3 -2.4
-3.0
-4.0-3.6
-3.1-2.5
-7.8
-8.6
-4.0
-9
-7
-5
-3
-1
Dec-00 Dec-05 Dec-10 Dec-15 Dec-20
10.411.111.511.610.2
9.5 10.110.210.89.9 9.6 10.1
11.412.4
15.916.615.3
14.5
16.5
21.820.2
19.4
02468
10121416182022
Dec-01 Dec-06 Dec-11 Dec-16 Dec-21
0.9
-1.1 -1.3-1.0 -0.7
-1.3-1.8
-2.9 -2.9
-2.0
-3.0 -2.9-3.1-3.3
-5.2
-6.3
-4.3
-3.3-3.8
-4.3-3.3 -3.4
-3.6
-8
-6
-4
-2
0
2
Dec-00 Dec-05 Dec-10 Dec-15 Dec-20
Itaú´s projections updated on May 7, 2021.
53
26.022.0
16.6 16.3 14.0 12.1 15.8 13.8 12.7 12.4 13.7 15.722.5 25.1 23.1 21.9 22.8 23.3
14.2
11.6
9.98.5
7.67.0
7.18.8
9.98.8 10.4
11.0
15.5
17.416.9 17.7
19.9
32.0
-149
14192429343944495459
Dec-03 Dec-09 Dec-15 Dec-21
Private Public
Macroeconomic outlookAdditional information

1Q21
Institutional Presentation
Itaú Corpbanca