itaipu dam and power plant (brazil & paraguay) -...
TRANSCRIPT
133
Itaipu Dam and Power Plant (Brazil & Paraguay)
TEACHER NOTES
GOALSThe following readings and activities on the Itaipu Dam and Power Plant were designed to strengthen students’ ability to draw from historical, geographic, and statistical information to answer geographic questions. Students will understand that hydroelectric power is a major source of electrical power with an ability to supply much of the world’s electricity, but that the construction of dams and power plants has environmental repercussions that must be taken into account. At the end of the unit, students will know factual information about Itaipu and general information about hydroelectric power around the world.
ASSESSMENT EVIDENCESBuild-a-Dam: Students consider a variety of questions as they plan a dam for their hometown. The project may be assigned to groups or individuals. This activity builds on information presented throughout the case study and has students assess the risk and benefits of their course of action.
LEARNING ACTIVITIES• As an Introduction, discuss the various purposes of dams. Ask students for reasons to build a
dam (flood control and river regulation, irrigation, power production, and recreation) and put the list on the board. Explain that this case study focuses on dams that produce power through hydroelectric power plants.
• The Itaipu Dam and Power Plant: History reading includes information on the building of the dam and its power potential. The timeline activity reinforces information from the reading and opens class discussion (see questions).
• In Thinking about Power, the teacher presents basic information on the power potential of Itaipu as it relates to power with which students are familiar (i.e., lightbulb). The class works together to assess how much power Itaipu can provide.
• The Watersheds of the World map shows and discusses the vast number of dams in the world and the worksheet asks students to consider what that means about hydropower. A full-=size map, ideal for using as an overhead transparency, precedes the student handouts.
• How Hydropower Works addresses the process of creating electricity from dams. The class should work together to locate the countries in which the major dams listed on the worksheet are found and then individual students work with data to create a chart on reservoir size of major dams.
• In Energy Supply: Report on Itaipu’s Production, students learn about the gradual build-up of a power plant’s production and how Itaipu is growing.
• Itaipu Power Plant: Brazilian Transmission System helps students to determine how extensive the Brazilian network is. The teacher should decide if students will calculate miles (US measure) or kilometers (Brazilian measure).
• Environmental Effects makes students aware of the environmental effects of dam/power plant construction and has them consider the downside of this energy source.
• Facts about Hydropower assists students to prepare for the final activity.
134
Itaipu Dam and Power Plant (Brazil & Paraguay)
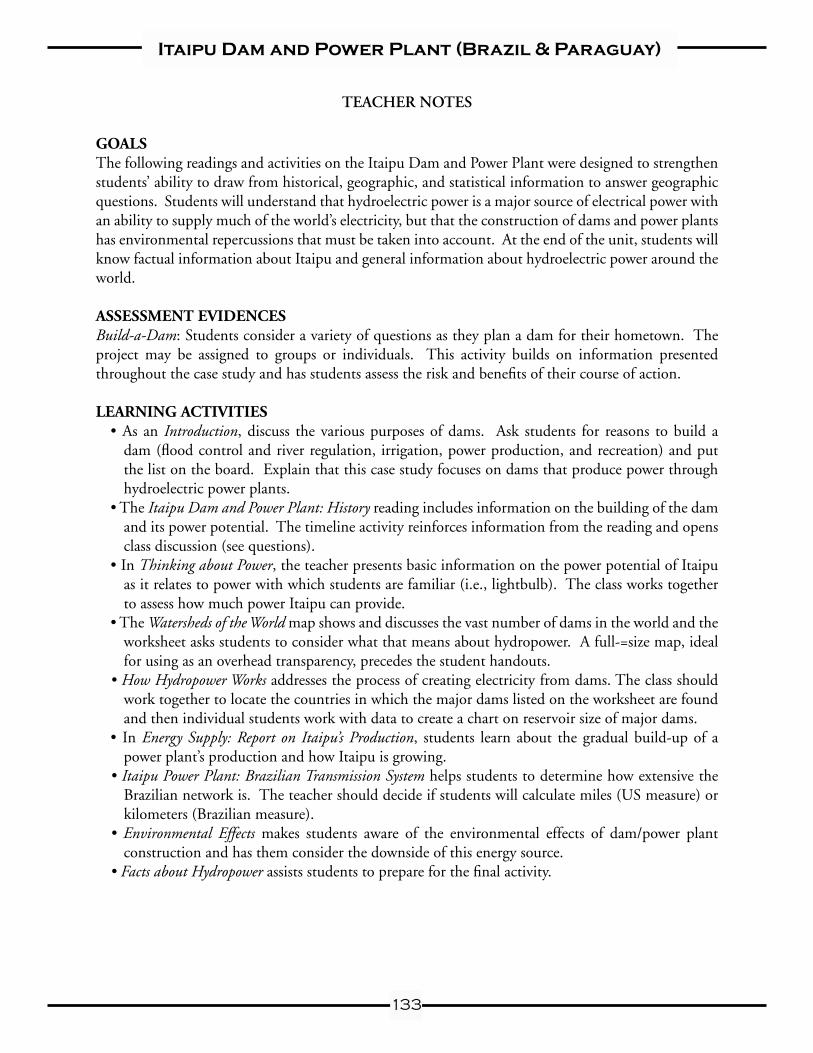
Itaipu Dam and Power Plant: History
The Paraná River, which flows from southern Brazil into Paraguay, is the base for the Itaipu Dam and Power Plant, the world’s largest hydroelectric power plant. The dam is capable of generating 12,6000 megawatts (MW) of electricity, enough to power most of California. The building of the dam took 18 years and US $18 billion to complete, and required engineers to shift the course of the Paraná River, the seventh largest river in the world. Because of the massive amount of planning, concrete, and hard work involved in the project, Itaipu is considered one of the “Seven Wonders of the Modern World.”
It was during the 1960s that talk of a joint power plant first began and Brazil and Paraguay conducted a study of water resources in the region. In 1973, the two countries signed a treaty to develop joint hydroelectric power. In 1975 work began on the dam. For the first three years, builders worked on shifting the Paraná River around the construction site. In October 1978, the 1.3-mile-long, 300-foot-deep, 490-foot-wide diversion channel was completed and as the course of the river was shifted, the original riverbed began to dry out so that builders could construct the dam.
In 1982, construction of the dam was completed and builders created the 125-mile-long reservoir. Itaipu Lake was formed in only two weeks, during which water rose 100 meters to reach the spillway. During the formation of the reservoir, environmentalists with the project traveled through the flooded area in boats to save area animals in an operation called “Mymba Kuera” (“catch-animal” in the Tupi-Guarani language).
In 1984, the first generator of the Itaipu power plant began to operate, with another two units being installed each year. The final unit, for a total of 18 functioning units, began power production in 1991. The plant still can grow however, as the original plan allowed for 20 generators, with the final two being installed when the plant needs to produce more power. In 2000, the presidents of Brazil and Paraguay signed a contract to begin building the final two generators, scheduled to begin operating in 2004. With 20 generators, the plant can generate 14,000 MW of electricity.
135
Itaipu Dam and Power Plant (Brazil & Paraguay)
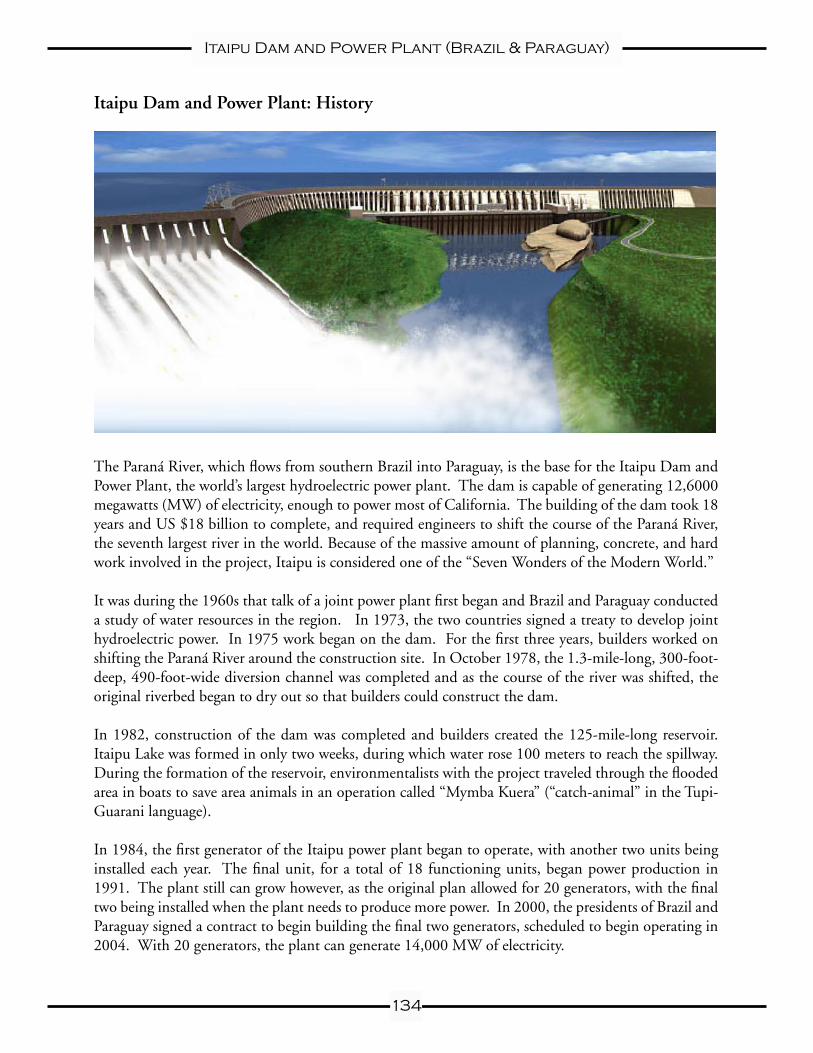
Although Brazil (population: 155 million) is far larger than Paraguay (pop.: 3.5 million), the two countries jointly manage and equally divide the electricity generated by the power plant. Each country has 9 generators to use for its own power. Paraguay can sell any surplus power that is generated, but Brazil has the first right to buy surplus power before Paraguay can sell to other customers. In 2000, the dam provided Paraguay with 95% of its electricity and 25% of Brazil’s electricity. Power sales to Brazil have generated 25-35% of Paraguay’s national budget, totaling approximately US$180 million since 1989.
Timeline Have students create a timeline, either individually or as a class on the board/wall, of the Itaipu project.
Comprehension Exercises for Class Discussion(1) Why would a project like this take so long to complete? What were some of the challenges in the construction?(2) What program did environmentalists launch when the reservoir was formed? Why?(3) Is the dam is more beneficial to Brazil or to Paraguay? Why?
Itaipu Dam and Power Plant (Brazil & Paraguay)

136
Itaipu Dam and Power Plant (Brazil & Paraguay)
Thinking about Power
Can you wrap your head around how much power Itaipu provides? Think about electricity in our homes and one of the simplest pieces of equipment we have: the lightbulb.
About how many lightbulbs are in a typical room of a house? And about how often do they need to be changed?
Most lightbulbs in our houses are between 60-150 watts. A power plant provides electricity in megawatts; a megawatt (MW) is one thousand kilowatts (1,000 kW) or one million watts (1,000,000 w). Few things in the world can keep up the transfer or use of energy on the scale of megawatts, but examples include: lightning strikes, naval aircraft carriers and submarines, engineering hardware, and some scientific research equipment (such as the supercollider and large lasers).
At home, we often use 100-watt lightbulbs to light our rooms. 10,000 100-watt lightbulbs would be needed to provide one megawatt of power. If Itaipu can generate 12,600 megawatts of power, how many household lightbulbs would that be? More than you would own in your lifetime?
Answer: 12,600 x 10,000 = 12,600,000,000 (12 billion, 600 million)
One megawatt is enough energy to power 1,000 average California homes.If Itaipu can generate 12,600 megawatts of electricity, how many California homes could it power?
Answer: 12,6000 x 1,000 = 12,600,000 (12 million, 600 thousand)
How many homes do you think there are in your city? How many cities the size of yours could Itaipu provide electricity for?
Go online to search for dams with hydropower plants near you, or visit the following site:Lower Colorado River Authority, Central Texas: http://www.lcra.org/water/dams.html
Compare the generating capacity of those power plants with Itaipu.
Example:Mansfield Dam (Austin, TX) = 102 megawatts of power = approximately 102,000 California homes. While this is enough power for most of the homes in the city of Austin, it pales in comparison to Itaipu.
Itaipu Dam and Power Plant (Brazil & Paraguay)
137
Itaipu Dam and Power Plant (Brazil & Paraguay)Itaipu Dam and Power Plant (Brazil & Paraguay)
138
Itaipu Dam and Power Plant (Brazil & Paraguay)
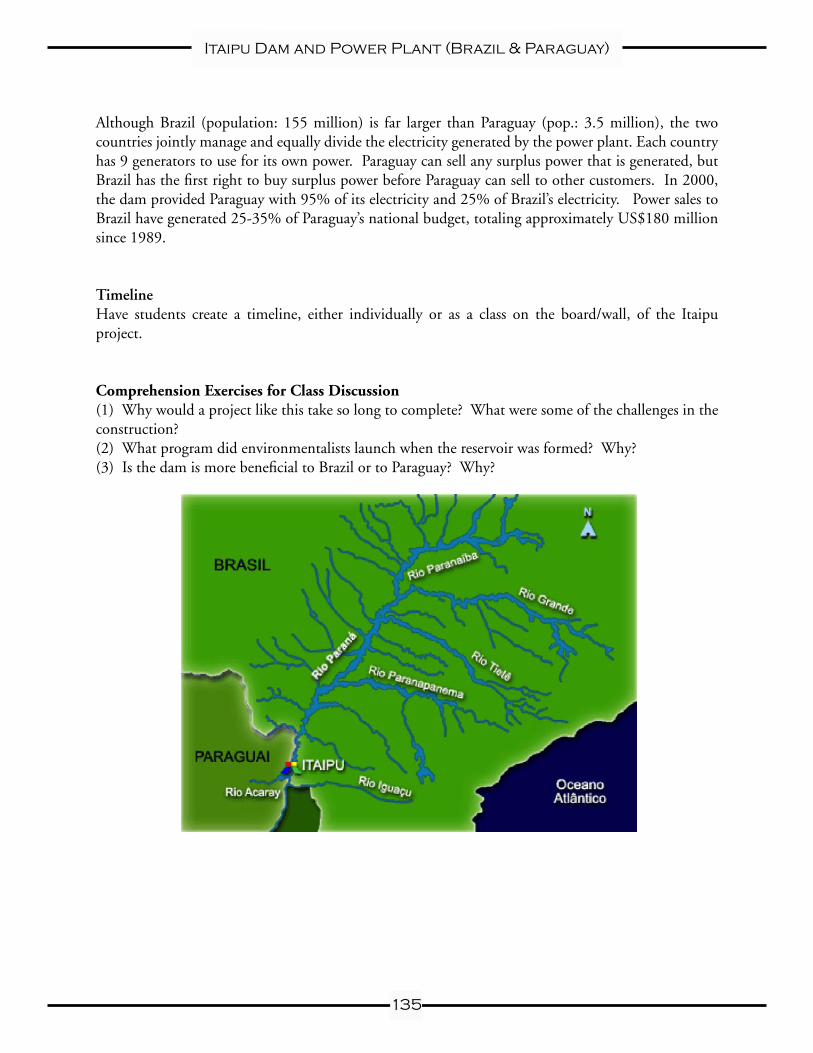
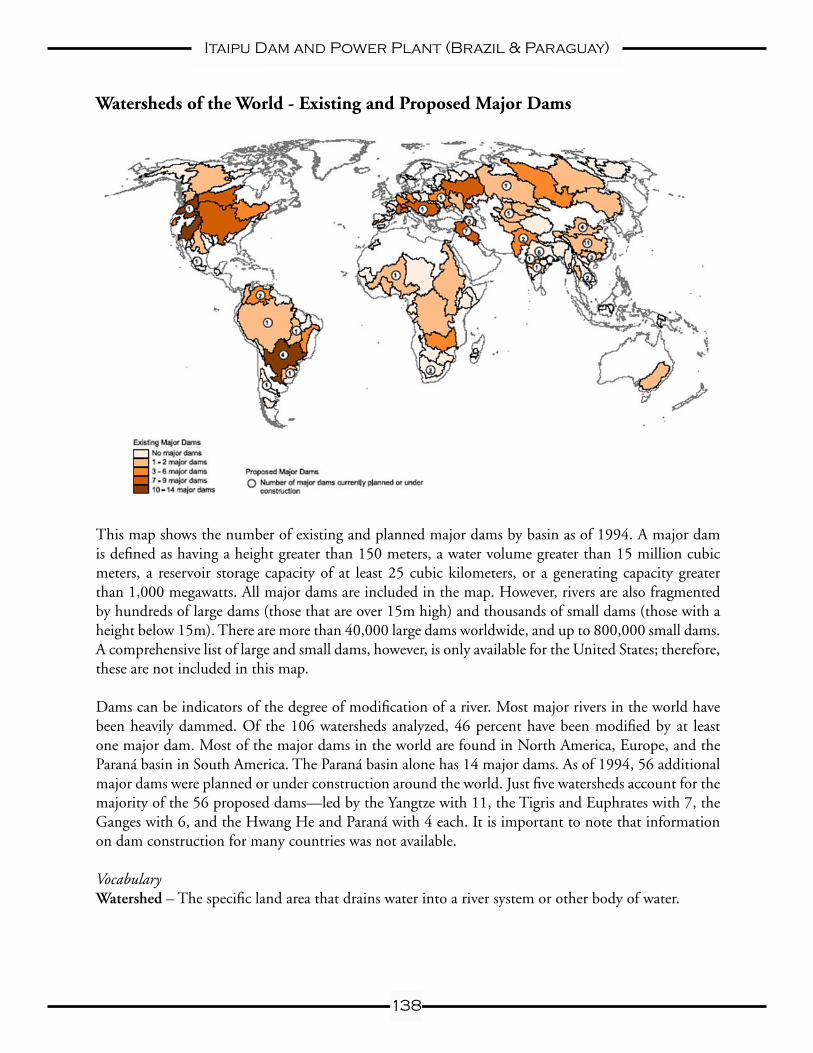
Watersheds of the World - Existing and Proposed Major Dams
This map shows the number of existing and planned major dams by basin as of 1994. A major dam is defined as having a height greater than 150 meters, a water volume greater than 15 million cubic meters, a reservoir storage capacity of at least 25 cubic kilometers, or a generating capacity greater than 1,000 megawatts. All major dams are included in the map. However, rivers are also fragmented by hundreds of large dams (those that are over 15m high) and thousands of small dams (those with a height below 15m). There are more than 40,000 large dams worldwide, and up to 800,000 small dams. A comprehensive list of large and small dams, however, is only available for the United States; therefore, these are not included in this map.
Dams can be indicators of the degree of modification of a river. Most major rivers in the world have been heavily dammed. Of the 106 watersheds analyzed, 46 percent have been modified by at least one major dam. Most of the major dams in the world are found in North America, Europe, and the Paraná basin in South America. The Paraná basin alone has 14 major dams. As of 1994, 56 additional major dams were planned or under construction around the world. Just five watersheds account for the majority of the 56 proposed dams—led by the Yangtze with 11, the Tigris and Euphrates with 7, the Ganges with 6, and the Hwang He and Paraná with 4 each. It is important to note that information on dam construction for many countries was not available.
VocabularyWatershed – The specific land area that drains water into a river system or other body of water.
Itaipu Dam and Power Plant (Brazil & Paraguay)

139
Itaipu Dam and Power Plant (Brazil & Paraguay)
Name:
Watersheds of the WorldComprehension Exercises
(1) Where are the darkest spots, the regions with the most major dams? Which countries or regions appear to have the most dams?
(2) Where are there no major dams?
(3) The circled numbers show where new dam projects are planned. What regions of the world are planning the largest number of new dams?
(4) What is the difference between major, large, and small dams?
(5) Why are the small dams of the world not highlighted on this map?
(6) Are there any new dams planned for the United States? Why do you think this is so?
(7) Based on this map, are dams and hydropower a major power source in the world?
Itaipu Dam and Power Plant (Brazil & Paraguay)
140
Itaipu Dam and Power Plant (Brazil & Paraguay)
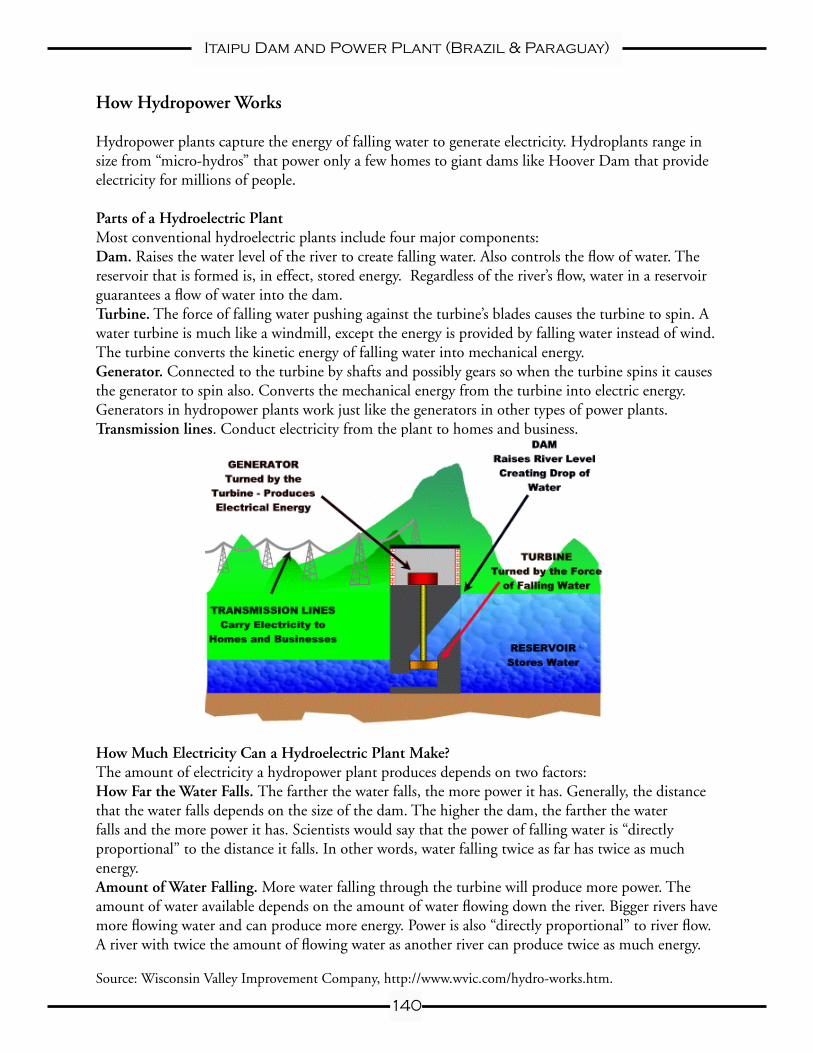
How Hydropower Works
Hydropower plants capture the energy of falling water to generate electricity. Hydroplants range in size from “micro-hydros” that power only a few homes to giant dams like Hoover Dam that provide electricity for millions of people.
Parts of a Hydroelectric Plant Most conventional hydroelectric plants include four major components: Dam. Raises the water level of the river to create falling water. Also controls the flow of water. The reservoir that is formed is, in effect, stored energy. Regardless of the river’s flow, water in a reservoir guarantees a flow of water into the dam.Turbine. The force of falling water pushing against the turbine’s blades causes the turbine to spin. A water turbine is much like a windmill, except the energy is provided by falling water instead of wind. The turbine converts the kinetic energy of falling water into mechanical energy. Generator. Connected to the turbine by shafts and possibly gears so when the turbine spins it causes the generator to spin also. Converts the mechanical energy from the turbine into electric energy. Generators in hydropower plants work just like the generators in other types of power plants. Transmission lines. Conduct electricity from the plant to homes and business.
How Much Electricity Can a Hydroelectric Plant Make?The amount of electricity a hydropower plant produces depends on two factors:How Far the Water Falls. The farther the water falls, the more power it has. Generally, the distance that the water falls depends on the size of the dam. The higher the dam, the farther the water falls and the more power it has. Scientists would say that the power of falling water is “directly proportional” to the distance it falls. In other words, water falling twice as far has twice as much energy. Amount of Water Falling. More water falling through the turbine will produce more power. The amount of water available depends on the amount of water flowing down the river. Bigger rivers have more flowing water and can produce more energy. Power is also “directly proportional” to river flow. A river with twice the amount of flowing water as another river can produce twice as much energy.
Source: Wisconsin Valley Improvement Company, http://www.wvic.com/hydro-works.htm.
Itaipu Dam and Power Plant (Brazil & Paraguay)
141
Itaipu Dam and Power Plant (Brazil & Paraguay)
Name:
How Hydropower WorksComprehension Exercises
(1) The reading states that a reservoir is stored energy. Why?
(2) There are two factors that determine how much power the plant can generate. Which factor does reservoir size affect? Why?
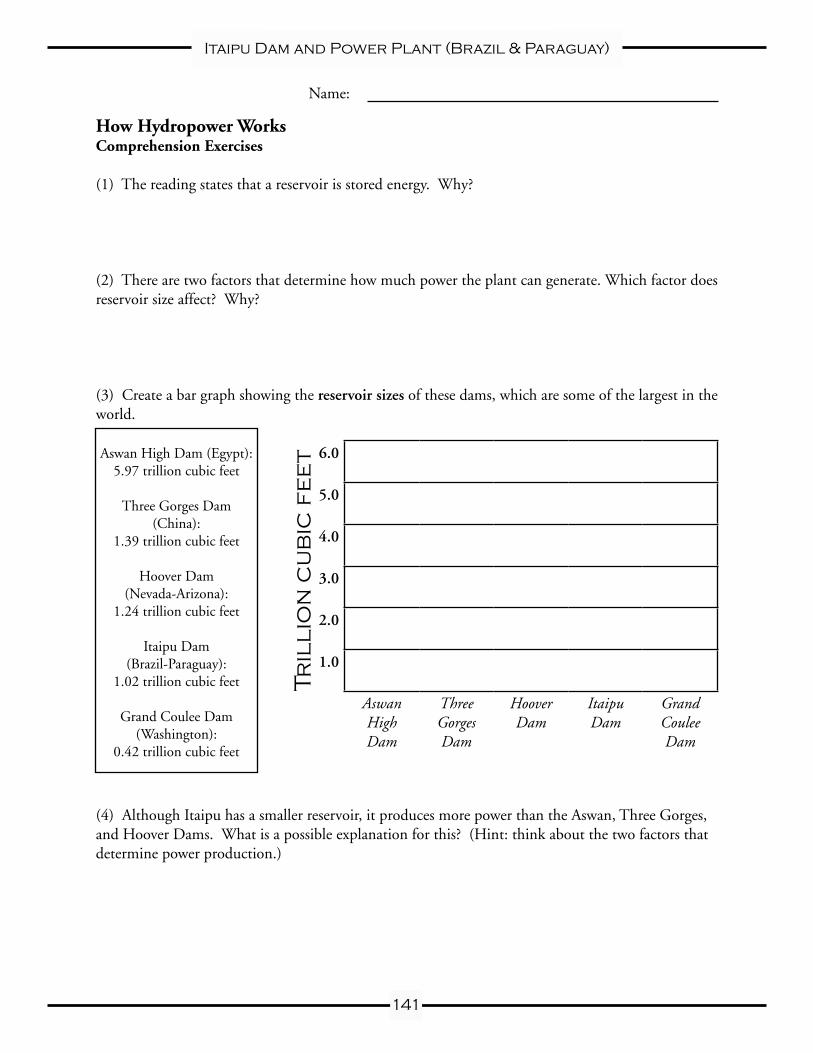
(3) Create a bar graph showing the reservoir sizes of these dams, which are some of the largest in the world.
6.0
5.0
4.0
3.0
2.0
1.0
Aswan High Dam
Three Gorges Dam
Hoover Dam
Itaipu Dam
Grand Coulee Dam
(4) Although Itaipu has a smaller reservoir, it produces more power than the Aswan, Three Gorges, and Hoover Dams. What is a possible explanation for this? (Hint: think about the two factors that determine power production.)
Tr
illi
on
cu
bic
fe
etAswan High Dam (Egypt):
5.97 trillion cubic feet
Three Gorges Dam (China):
1.39 trillion cubic feet
Hoover Dam (Nevada-Arizona):
1.24 trillion cubic feet
Itaipu Dam (Brazil-Paraguay):
1.02 trillion cubic feet
Grand Coulee Dam (Washington):
0.42 trillion cubic feet
Itaipu Dam and Power Plant (Brazil & Paraguay)
142
Itaipu Dam and Power Plant (Brazil & Paraguay)
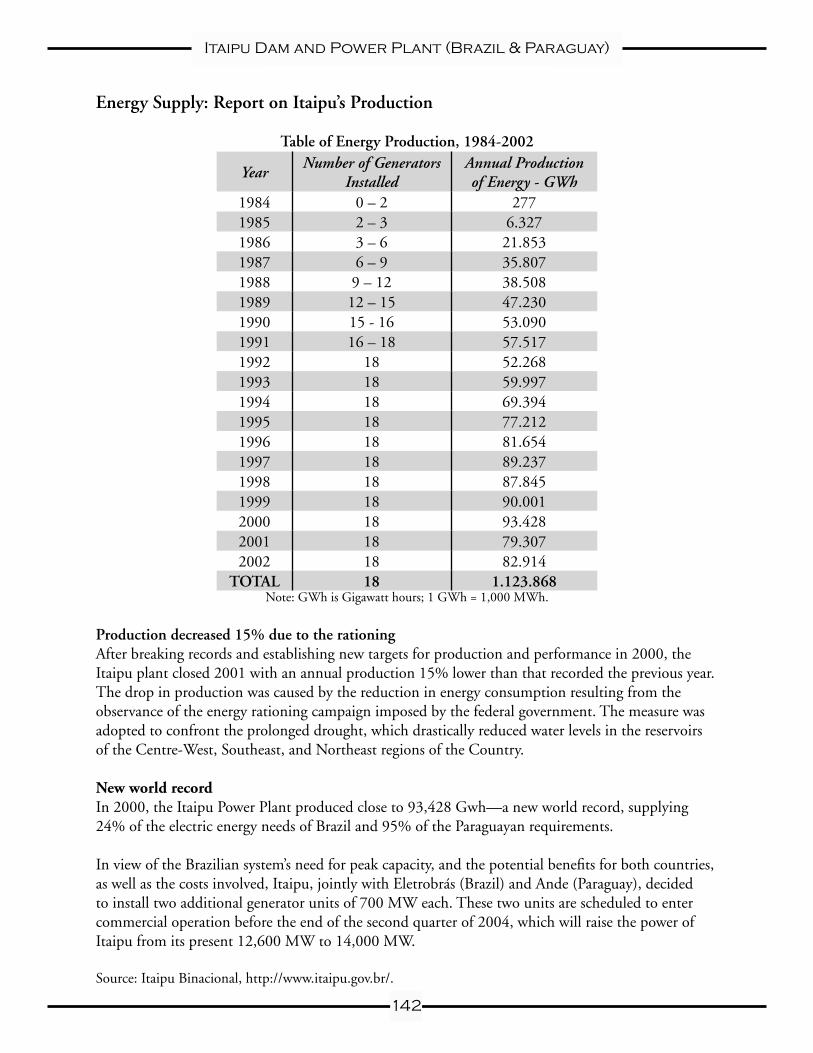
Energy Supply: Report on Itaipu’s Production
Table of Energy Production, 1984-2002
YearNumber of Generators
InstalledAnnual Production of Energy - GWh
1984 0 – 2 2771985 2 – 3 6.3271986 3 – 6 21.8531987 6 – 9 35.8071988 9 – 12 38.5081989 12 – 15 47.2301990 15 - 16 53.0901991 16 – 18 57.5171992 18 52.2681993 18 59.9971994 18 69.3941995 18 77.2121996 18 81.6541997 18 89.2371998 18 87.8451999 18 90.0012000 18 93.4282001 18 79.3072002 18 82.914
TOTAL 18 1.123.868Note: GWh is Gigawatt hours; 1 GWh = 1,000 MWh.
Production decreased 15% due to the rationingAfter breaking records and establishing new targets for production and performance in 2000, the Itaipu plant closed 2001 with an annual production 15% lower than that recorded the previous year.The drop in production was caused by the reduction in energy consumption resulting from the observance of the energy rationing campaign imposed by the federal government. The measure was adopted to confront the prolonged drought, which drastically reduced water levels in the reservoirs of the Centre-West, Southeast, and Northeast regions of the Country.
New world recordIn 2000, the Itaipu Power Plant produced close to 93,428 Gwh—a new world record, supplying 24% of the electric energy needs of Brazil and 95% of the Paraguayan requirements.
In view of the Brazilian system’s need for peak capacity, and the potential benefits for both countries, as well as the costs involved, Itaipu, jointly with Eletrobrás (Brazil) and Ande (Paraguay), decided to install two additional generator units of 700 MW each. These two units are scheduled to enter commercial operation before the end of the second quarter of 2004, which will raise the power of Itaipu from its present 12,600 MW to 14,000 MW.
Source: Itaipu Binacional, http://www.itaipu.gov.br/.
Itaipu Dam and Power Plant (Brazil & Paraguay)
143
Itaipu Dam and Power Plant (Brazil & Paraguay)
Name:
Energy SupplyComprehension Exercises
(1) What year did the power plant begin functioning? How many generators were installed by the end of that year?
(2) How many generators are now at work? How many years did the plant function before the total number of generators were installed and working?
(3) Between what two years was there the largest jump in annual production of energy? What can explain this jump? (Hint: what is the difference in number of generators working in each of those years.)
(4) Once Itaipu was functioning at full capacity (18 generators), power production continued to expand every year. What might explain this?
(5) In what year did the plant reach its greatest annual production of power? In that year, what percentage of power did it supply for Brazil and Paraguay? And what did the governments decide to do at that time?
(6) What happened to production between 2000 and 2001? What caused it to happen?
Itaipu Dam and Power Plant (Brazil & Paraguay)
144
Itaipu Dam and Power Plant (Brazil & Paraguay)
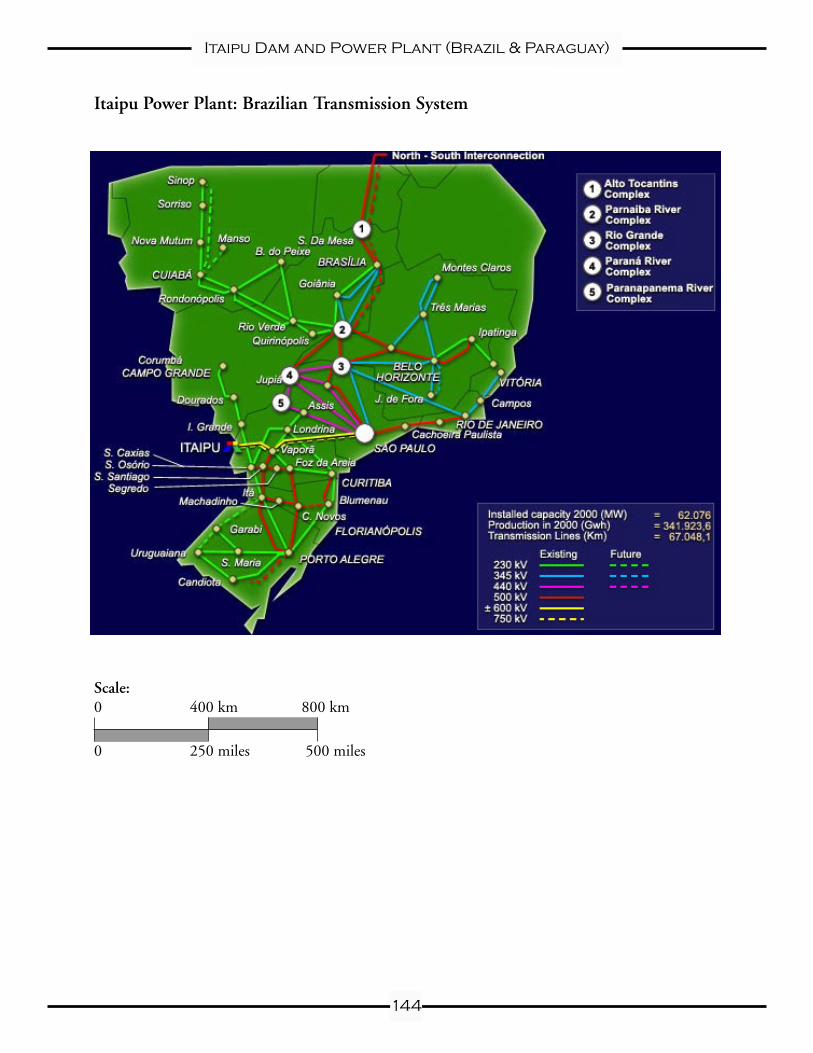
Itaipu Power Plant: Brazilian Transmission System
Scale:0 400 km 800 km
0 250 miles 500 miles
Itaipu Dam and Power Plant (Brazil & Paraguay)

145
Itaipu Dam and Power Plant (Brazil & Paraguay)
Name:
Brazilian Transmission System
Calculate the distances between the following places. First, calculate distance “as the crow flies” (i.e., straight line from point to point). Then, calculate distance using the network of transmission lines.
ITAIPU to Rio de Janeiro: ______________ ______________
ITAIPU to Brasília ______________ ______________
ITAIPU to Campo Grande ______________ ______________
Sinop to São Paulo ______________ ______________
Candiota to Brasília –––––––––––––– ––––––––––––––
(1) Brazil is almost equal to the size of the continental United States and the map shows all but the extreme north of the country. Is the area served by Itaipu extensive?
(2) What parts of Brazil are not served by Itaipu?
(3) According to the map, how many kilometers of transmission lines are there in Brazil?
(4) What is the northernmost city currently served by Itaipu at this point?
(5) What is the southernmost city?
(6) Given what you know about the history of Itaipu and the size of the area that the power plant serves, can you think of any reasons (financial, environmental, logistical, etc.) why a country would not want to build a dam and power plant like Itaipu?
Itaipu Dam and Power Plant (Brazil & Paraguay)
146
Itaipu Dam and Power Plant (Brazil & Paraguay)
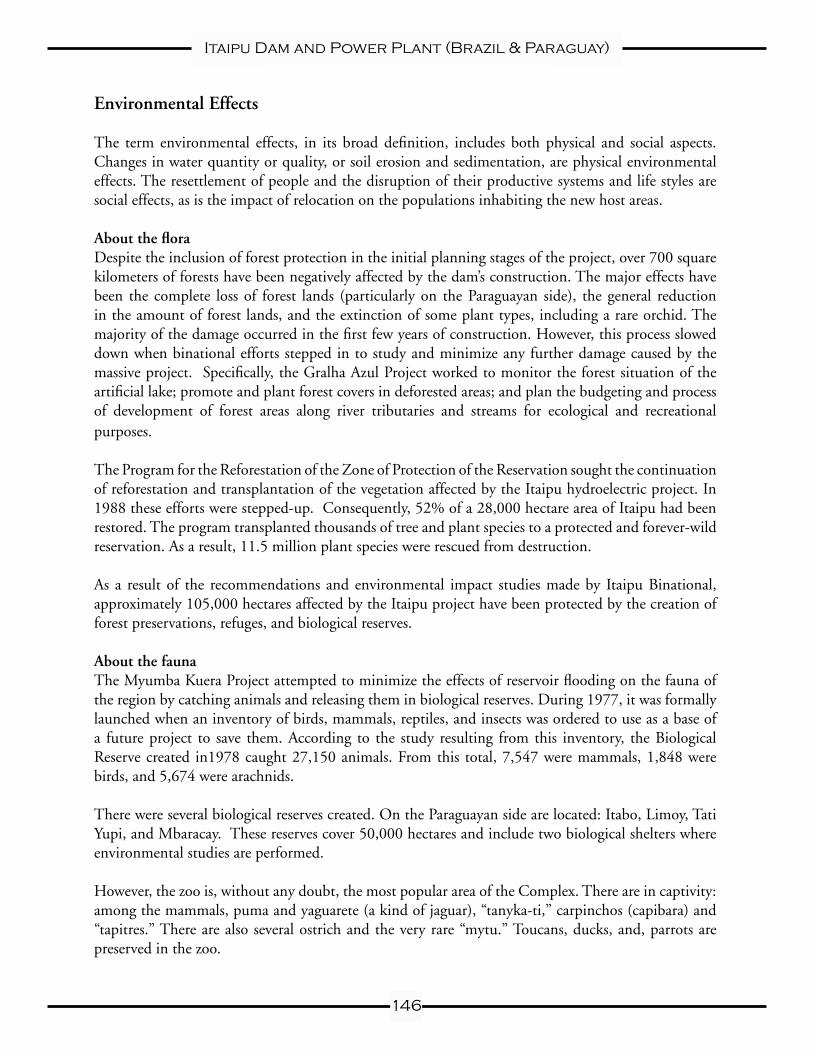
Environmental Effects
The term environmental effects, in its broad definition, includes both physical and social aspects. Changes in water quantity or quality, or soil erosion and sedimentation, are physical environmental effects. The resettlement of people and the disruption of their productive systems and life styles are social effects, as is the impact of relocation on the populations inhabiting the new host areas.
About the floraDespite the inclusion of forest protection in the initial planning stages of the project, over 700 square kilometers of forests have been negatively affected by the dam’s construction. The major effects have been the complete loss of forest lands (particularly on the Paraguayan side), the general reduction in the amount of forest lands, and the extinction of some plant types, including a rare orchid. The majority of the damage occurred in the first few years of construction. However, this process slowed down when binational efforts stepped in to study and minimize any further damage caused by the massive project. Specifically, the Gralha Azul Project worked to monitor the forest situation of the artificial lake; promote and plant forest covers in deforested areas; and plan the budgeting and process of development of forest areas along river tributaries and streams for ecological and recreational purposes.
The Program for the Reforestation of the Zone of Protection of the Reservation sought the continuation of reforestation and transplantation of the vegetation affected by the Itaipu hydroelectric project. In 1988 these efforts were stepped-up. Consequently, 52% of a 28,000 hectare area of Itaipu had been restored. The program transplanted thousands of tree and plant species to a protected and forever-wild reservation. As a result, 11.5 million plant species were rescued from destruction.
As a result of the recommendations and environmental impact studies made by Itaipu Binational, approximately 105,000 hectares affected by the Itaipu project have been protected by the creation of forest preservations, refuges, and biological reserves.
About the faunaThe Myumba Kuera Project attempted to minimize the effects of reservoir flooding on the fauna of the region by catching animals and releasing them in biological reserves. During 1977, it was formally launched when an inventory of birds, mammals, reptiles, and insects was ordered to use as a base of a future project to save them. According to the study resulting from this inventory, the Biological Reserve created in1978 caught 27,150 animals. From this total, 7,547 were mammals, 1,848 were birds, and 5,674 were arachnids.
There were several biological reserves created. On the Paraguayan side are located: Itabo, Limoy, Tati Yupi, and Mbaracay. These reserves cover 50,000 hectares and include two biological shelters where environmental studies are performed.
However, the zoo is, without any doubt, the most popular area of the Complex. There are in captivity: among the mammals, puma and yaguarete (a kind of jaguar), “tanyka-ti,” carpinchos (capibara) and “tapitres.” There are also several ostrich and the very rare “mytu.” Toucans, ducks, and, parrots are preserved in the zoo.
Itaipu Dam and Power Plant (Brazil & Paraguay)
147
Itaipu Dam and Power Plant (Brazil & Paraguay)
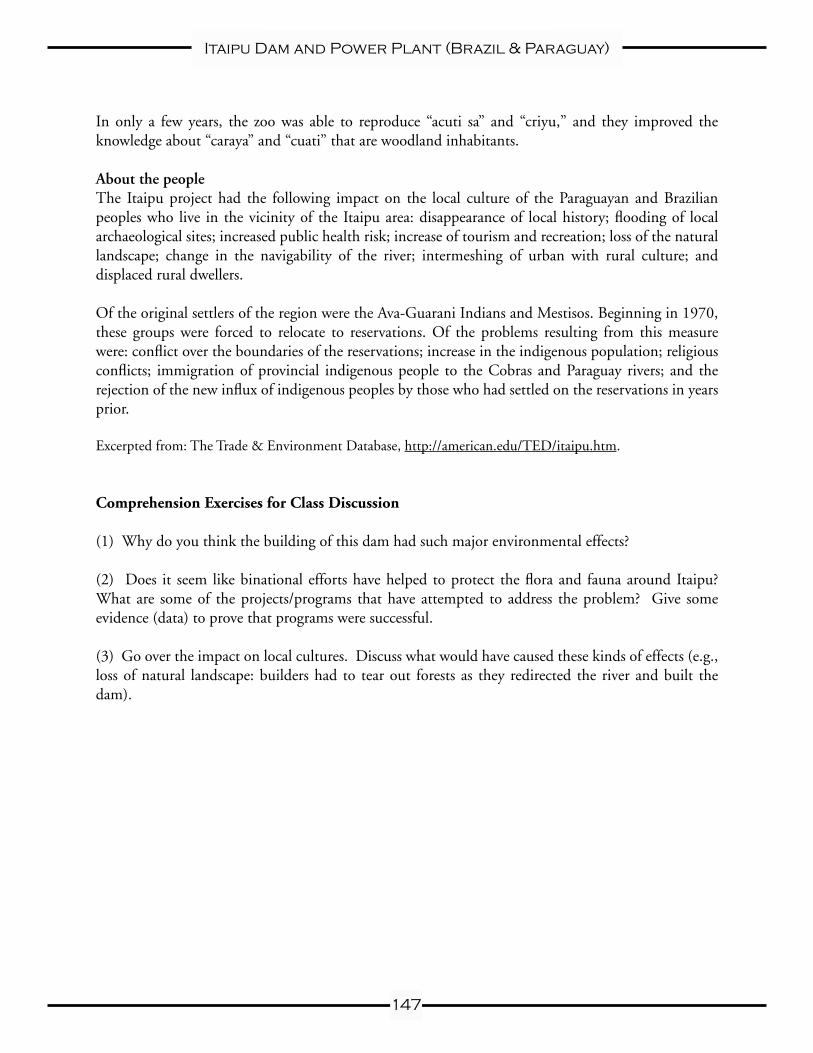
In only a few years, the zoo was able to reproduce “acuti sa” and “criyu,” and they improved the knowledge about “caraya” and “cuati” that are woodland inhabitants.
About the peopleThe Itaipu project had the following impact on the local culture of the Paraguayan and Brazilian peoples who live in the vicinity of the Itaipu area: disappearance of local history; flooding of local archaeological sites; increased public health risk; increase of tourism and recreation; loss of the natural landscape; change in the navigability of the river; intermeshing of urban with rural culture; and displaced rural dwellers.
Of the original settlers of the region were the Ava-Guarani Indians and Mestisos. Beginning in 1970, these groups were forced to relocate to reservations. Of the problems resulting from this measure were: conflict over the boundaries of the reservations; increase in the indigenous population; religious conflicts; immigration of provincial indigenous people to the Cobras and Paraguay rivers; and the rejection of the new influx of indigenous peoples by those who had settled on the reservations in years prior.
Excerpted from: The Trade & Environment Database, http://american.edu/TED/itaipu.htm.
Comprehension Exercises for Class Discussion
(1) Why do you think the building of this dam had such major environmental effects?
(2) Does it seem like binational efforts have helped to protect the flora and fauna around Itaipu? What are some of the projects/programs that have attempted to address the problem? Give some evidence (data) to prove that programs were successful.
(3) Go over the impact on local cultures. Discuss what would have caused these kinds of effects (e.g., loss of natural landscape: builders had to tear out forests as they redirected the river and built the dam).
Itaipu Dam and Power Plant (Brazil & Paraguay)
148
Itaipu Dam and Power Plant (Brazil & Paraguay)
Facts about Hydropower
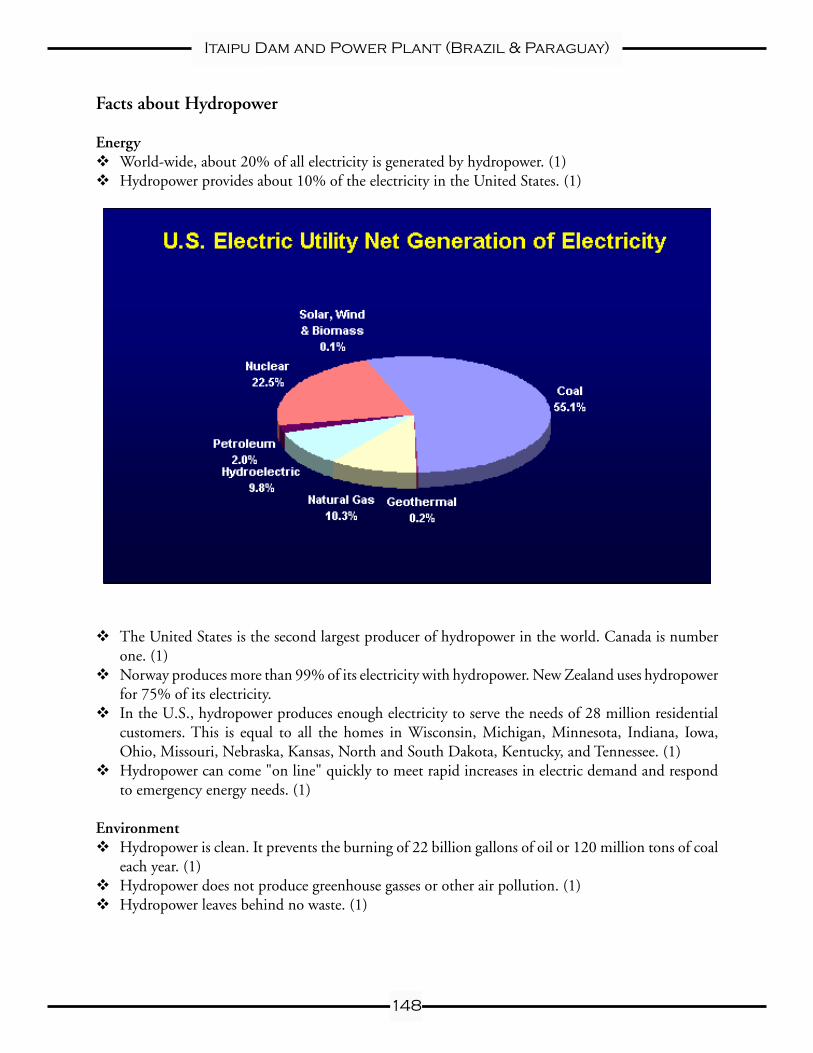
Energy World-wide, about 20% of all electricity is generated by hydropower. (1) Hydropower provides about 10% of the electricity in the United States. (1)
The United States is the second largest producer of hydropower in the world. Canada is number one. (1)
Norway produces more than 99% of its electricity with hydropower. New Zealand uses hydropower for 75% of its electricity.
In the U.S., hydropower produces enough electricity to serve the needs of 28 million residential customers. This is equal to all the homes in Wisconsin, Michigan, Minnesota, Indiana, Iowa, Ohio, Missouri, Nebraska, Kansas, North and South Dakota, Kentucky, and Tennessee. (1)
Hydropower can come "on line" quickly to meet rapid increases in electric demand and respond to emergency energy needs. (1)
Environment Hydropower is clean. It prevents the burning of 22 billion gallons of oil or 120 million tons of coal
each year. (1) Hydropower does not produce greenhouse gasses or other air pollution. (1) Hydropower leaves behind no waste. (1)
Itaipu Dam and Power Plant (Brazil & Paraguay)
149
Itaipu Dam and Power Plant (Brazil & Paraguay)
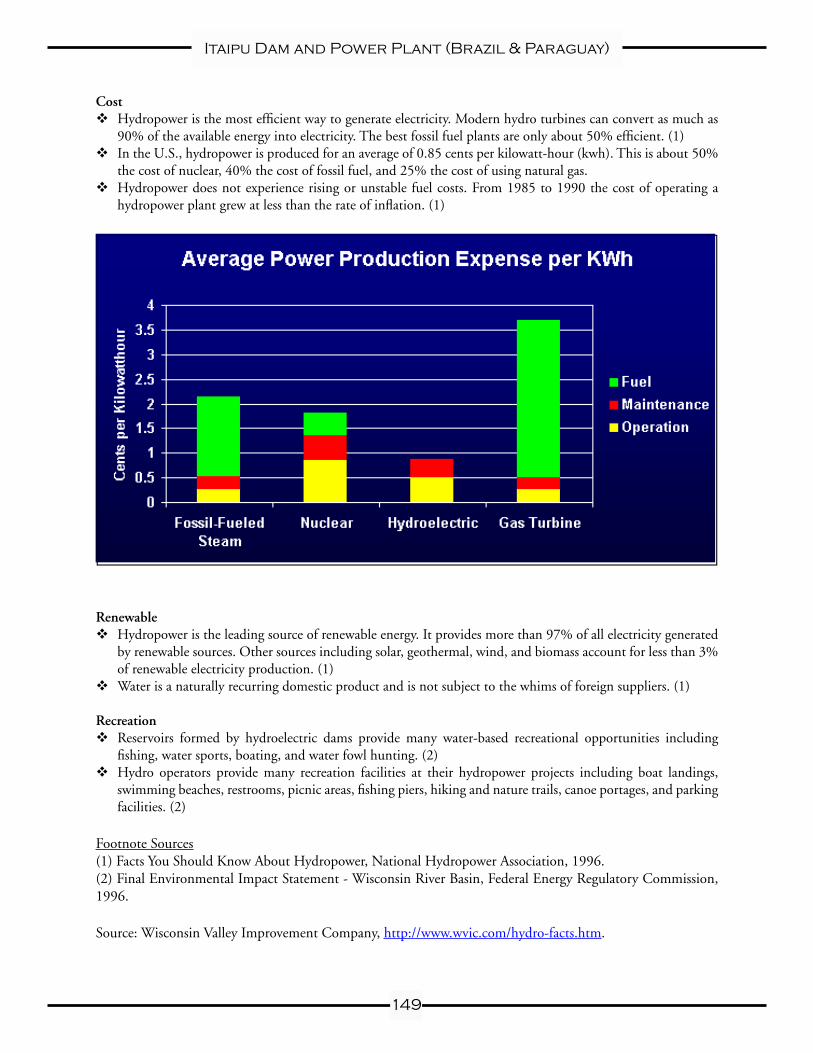
Cost Hydropower is the most efficient way to generate electricity. Modern hydro turbines can convert as much as
90% of the available energy into electricity. The best fossil fuel plants are only about 50% efficient. (1) In the U.S., hydropower is produced for an average of 0.85 cents per kilowatt-hour (kwh). This is about 50%
the cost of nuclear, 40% the cost of fossil fuel, and 25% the cost of using natural gas. Hydropower does not experience rising or unstable fuel costs. From 1985 to 1990 the cost of operating a
hydropower plant grew at less than the rate of inflation. (1)
Renewable Hydropower is the leading source of renewable energy. It provides more than 97% of all electricity generated
by renewable sources. Other sources including solar, geothermal, wind, and biomass account for less than 3% of renewable electricity production. (1)
Water is a naturally recurring domestic product and is not subject to the whims of foreign suppliers. (1)
Recreation Reservoirs formed by hydroelectric dams provide many water-based recreational opportunities including
fishing, water sports, boating, and water fowl hunting. (2) Hydro operators provide many recreation facilities at their hydropower projects including boat landings,
swimming beaches, restrooms, picnic areas, fishing piers, hiking and nature trails, canoe portages, and parking facilities. (2)
Footnote Sources(1) Facts You Should Know About Hydropower, National Hydropower Association, 1996.(2) Final Environmental Impact Statement - Wisconsin River Basin, Federal Energy Regulatory Commission, 1996. Source: Wisconsin Valley Improvement Company, http://www.wvic.com/hydro-facts.htm.
150
Itaipu Dam and Power Plant (Brazil & Paraguay)
Build-a-Dam
Imagine that you are planning to build a dam and hydroelectric power plant in your hometown (or in the nearest town with a river). You must write a proposal to be considered by the city council.
Your proposal must include the following pieces of information:
(1) Name of Proposed Dam and Power Plant
(2) Reasons to Build a Dam: Why should your town use hydroelectric power (consider environment, costs, efficiency, and other benefits)?
(3) Description of Hydroelectric Power Plant: include a list of the parts of the power plant and how they work together.
(4) Energy Production of the Power Plant: How many homes do you want to power (determine power plant output)? Do you want to sell power to other towns to make money?
(5) Environmental Impact: Where will the dam and plant be located (where is the closest river)? What kinds of considerations should you make about the environment (physical and social)? Will animals need to be saved? Will people have to move?
(6) Summary: Why the dam is important? Why it will benefit your hometown?
Itaipu Dam and Power Plant (Brazil & Paraguay)