itc. itc focus data analysts corporate positioning statement "enduring value. for the nation....
TRANSCRIPT
I T C
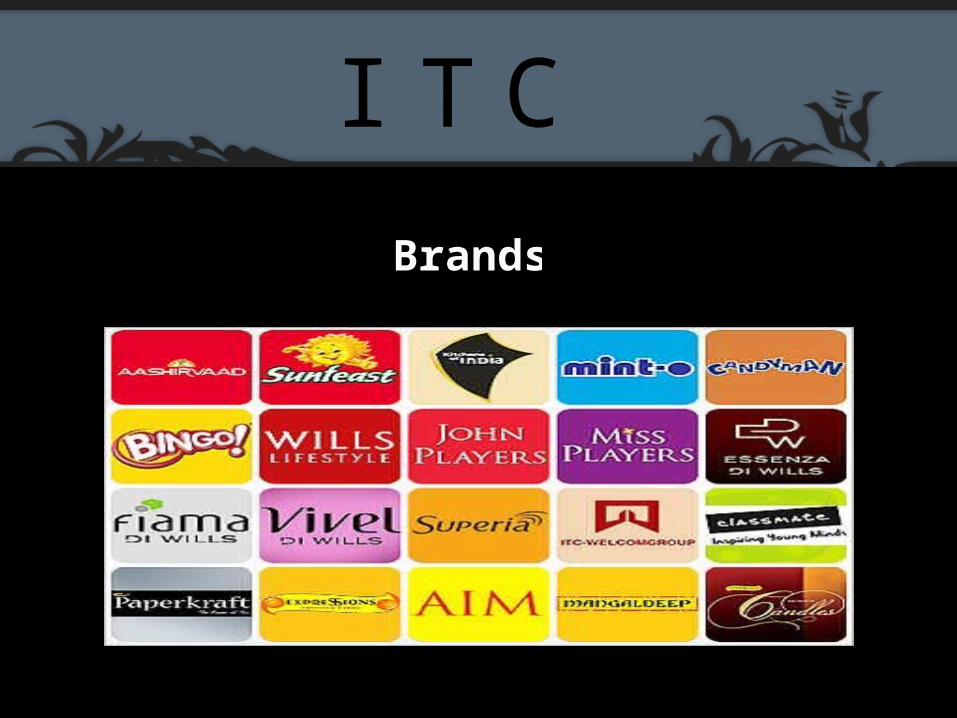
Brands
I T C

FOCUS

Data Analysts
Divanshu Kapoor (91017) Radhika Gupta (91041)
Madhusudhan Partani (91029)
Anika Gupta (91005) Manish TN Singh (91053)

corporate positioning statement
"Enduring Value. For the nation. For the Shareholder."
GLIMPSE
market capitalization of nearly US $ 19 billion
Asia's 'Fab 50'
turnover of over US $ 5 billion
Ranks among India's `10 Most Valuable (Company) Brands'
Asia's 50 best performing companies -Business Week.
Employs over 26,000 people
60 locations across India
more than 3, 41,000 shareholders

Financial Position
Debt/Equity
The debt-to-equity ratio has been hovering around 0.02:1 since the past 7 years. This
shows that investment is not risky in this firm as the company is not depends on debt
financing. But is also implies that the firm has not leveraged at all.
Equity in the form of
The firm has Equity in form of Retained Earnings. The Shares comprise of Equity shares of
Re 1 each. Total No. of shares as on 31st of March 2009 were Approx 377.44 Crores. And
the Retained earnings comprises of Rs. 13650.72 Crs. Also the Company issues ESOPs
(Employee Stock Option Plans) Regularly.
Financial Position
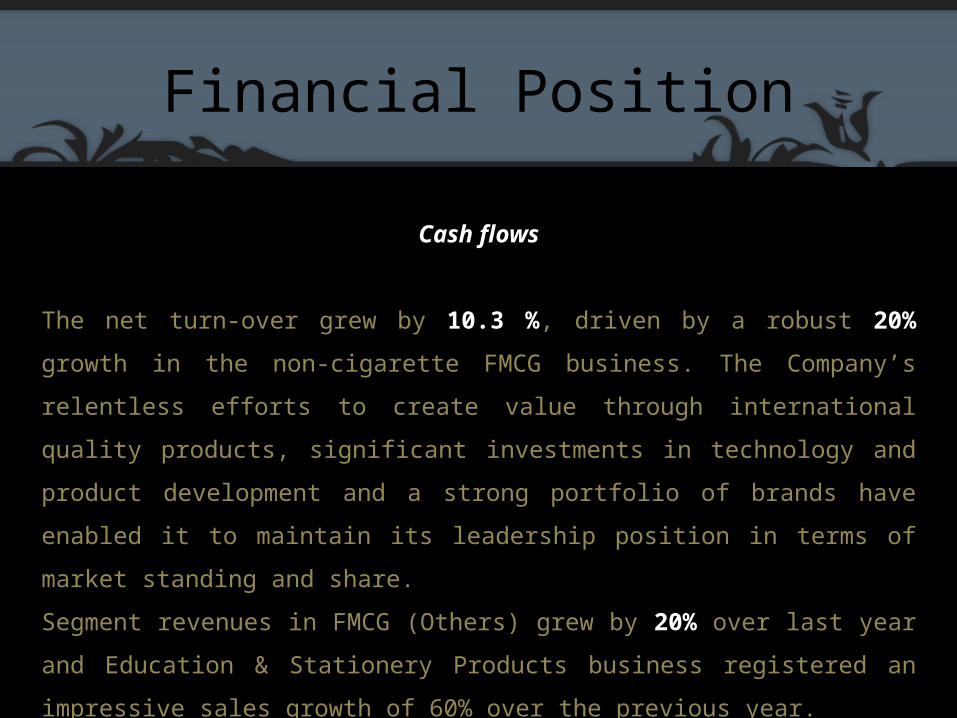
Cash flows
The net turn-over grew by 10.3 %, driven by a robust 20% growth in the non-cigarette
FMCG business. The Company’s relentless efforts to create value through international
quality products, significant investments in technology and product development and a
strong portfolio of brands have enabled it to maintain its leadership position in terms of
market standing and share.
Segment revenues in FMCG (Others) grew by 20% over last year and Education &
Stationery Products business registered an impressive sales growth of 60% over the
previous year.
Financial Position
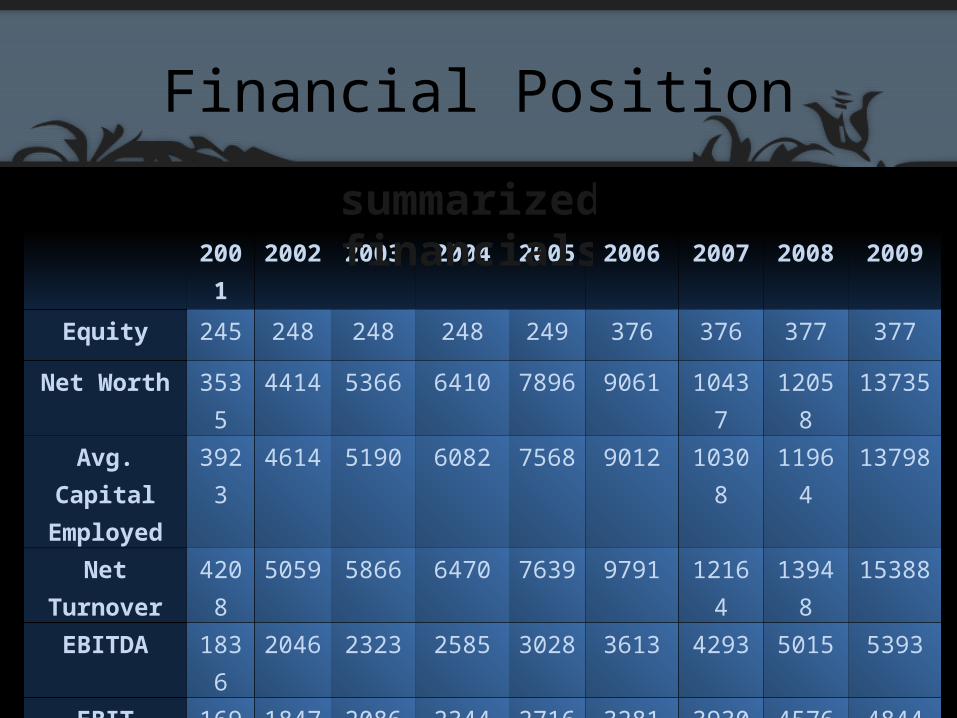
2001 2002 2003 2004 2005 2006 2007 2008 2009
Equity 245 248 248 248 249 376 376 377 377
Net Worth 3535 4414 5366 6410 7896 9061 10437 12058 13735
Avg. Capital Employed
3923 4614 5190 6082 7568 9012 10308 11964 13798
Net Turnover 4208 5059 5866 6470 7639 9791 12164 13948 15388
EBITDA 1836 2046 2323 2585 3028 3613 4293 5015 5393
EBIT 1696 1847 2086 2344 2716 3281 3930 4576 4844
PAT 1006 1190 1371 1593 1837 2280 2700 3120 3264
summarized financials

Financial Position
2001 2002 2003 2004 2005 2006 2007 2008 2009
Net Worth Per Share(Rs.)
9.60 11.99 14.45 17.15 21.10 24.13 27.74 32.00 36.39
Debt Equity Ratio 0.24:1
0.06:1 0.02:1 0.02:1 0.03:1 0.01:1 0.02:1 0.02:1 0.01:1
Return on Equity (%)
31.77 29.94 28.05 27.05 25.68 26.90 27.69 27.74 25.31
EV/EBITDA 11.33 8.51 6.26 9.16 10.12 19.30 12.53 15.05 12.44
PE Ratio 19.86 14.49 11.36 16.19 18.22 32.06 20.92 24.89 21.34
EPS (Rs.) 2.73 3.20 3.69 4.29 4.91 6.08 7.19 8.29 8.66
Cash Earnings per Share (Rs.)
3.11 3.96 4.14 5.00 5.83 6.82 8.54 9.63 10.96
key ratios

Cost of Debt
Long Term Debt = 46.365
Secured Loans
Term Loans = 18.04
Other Loans = 0.81
Cost of Debt
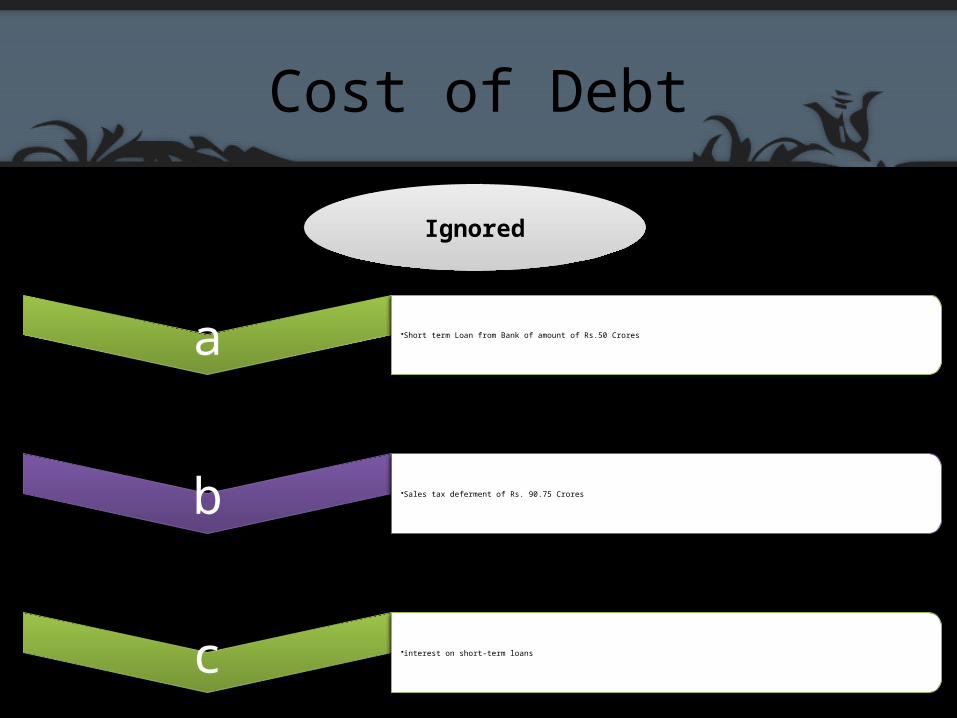
Ignored
a •Short term Loan from Bank of amount of Rs.50 Crores
b •Sales tax deferment of Rs. 90.75 Crores
c •interest on short-term loans
Cost of Debt
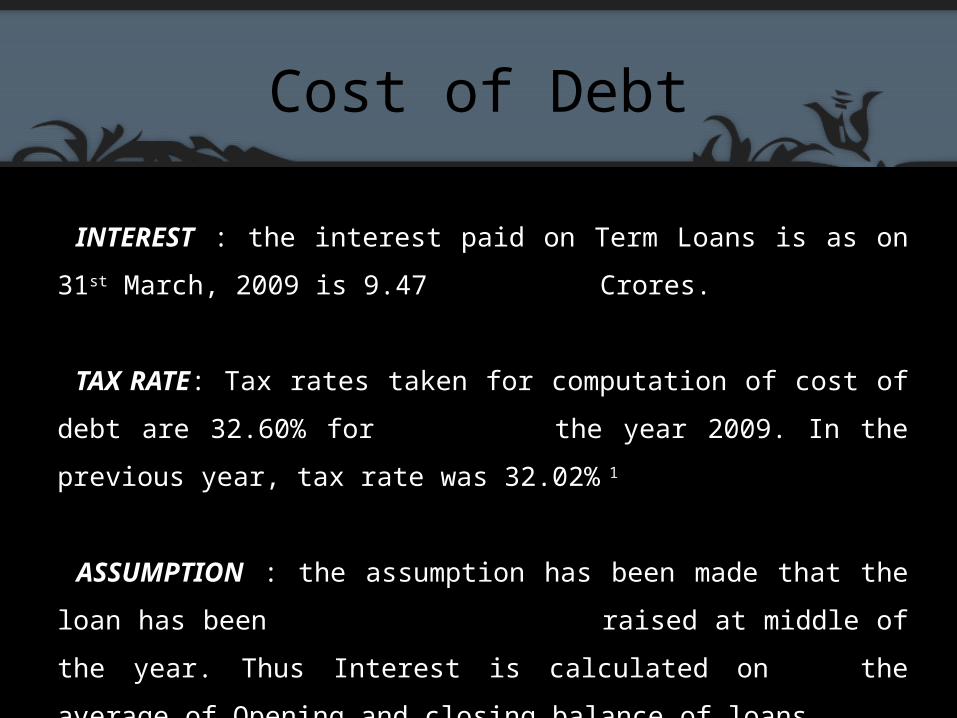
INTEREST : the interest paid on Term Loans is as on 31st March, 2009 is 9.47
Crores.
TAX RATE: Tax rates taken for computation of cost of debt are 32.60% for
the year 2009. In the previous year, tax rate was 32.02% 1
ASSUMPTION : the assumption has been made that the loan has been
raised at middle of the year. Thus Interest is calculated on
the average of Opening and closing balance of loans.

Cost of Debt
Computati on of Cost of Debt
Kd = Long Term Interest / Long Term Debt
Kd = 9.47/46.365 = 20.42%
20.42 X (1 – t)
= 20.42 X (1 – 0.32)
= 13.89 %

Cost of Equity
BSE SensexAlpha 0.000349752Beta 0.652006636R Square 0.296757148Adjusted R Square 0.296440515
Regression Equation
Y= 0.000349752 + 0.652006636X
Cost of Equity
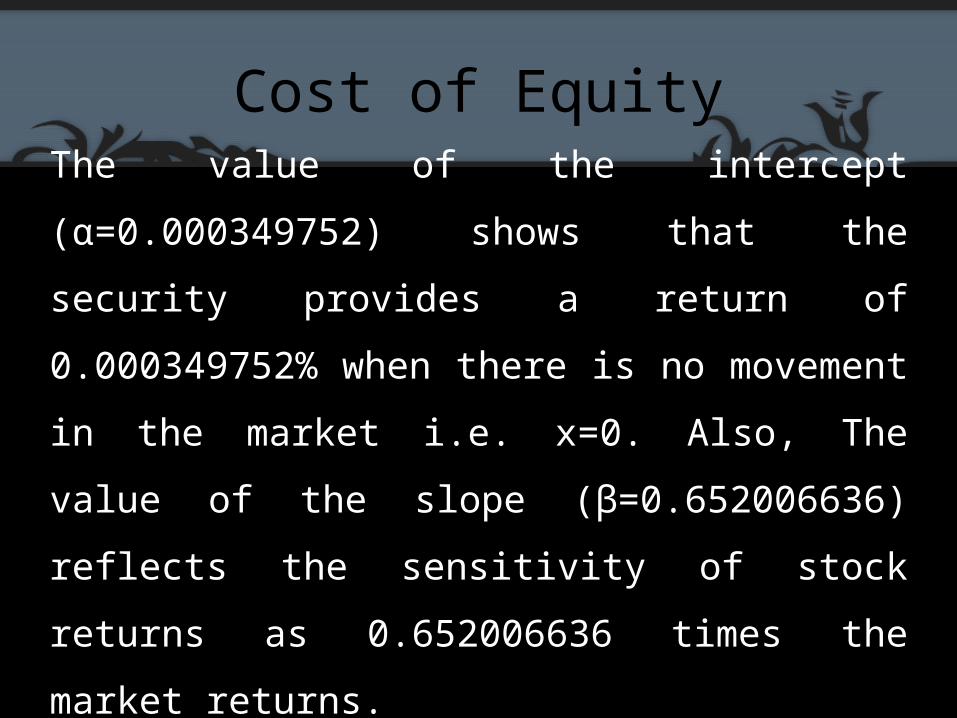
The value of the intercept (α=0.000349752) shows that
the security provides a return of 0.000349752% when
there is no movement in the market i.e. x=0. Also, The
value of the slope (β=0.652006636) reflects the
sensitivity of stock returns as 0.652006636 times the
market returns.

Why Use It ???
ITC is engaged in multiple businesses (ITC has 4+SBU)
Each business has different risks and operates in different environments
A Firm has:
•Business Risk ( Due to market conditions\External environments )•Financial Risks ( Due to its capital structure )
So we neutralize the financial risk and only take the business risk of the Proxy firm into consideration
Pure Play Approach
β Calculations
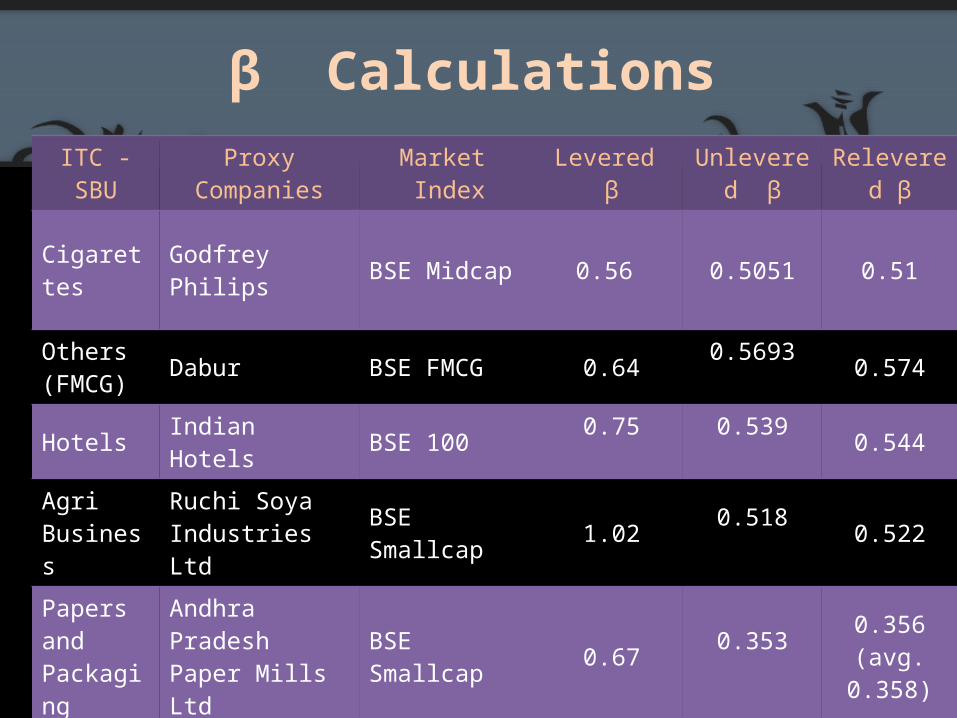
ITC -SBU Proxy Companies
Market Index
Levered β
Unlevered β
Relevered β
Cigarettes Godfrey Philips BSE Midcap 0.56 0.5051 0.51
Others (FMCG) Dabur BSE FMCG 0.64 0.5693 0.574
Hotels Indian Hotels BSE 100 0.75 0.539 0.544
Agri Business
Ruchi Soya Industries Ltd BSE Smallcap 1.02 0.518 0.522
Papers and Packaging
Andhra PradeshPaper Mills Ltd BSE Smallcap 0.67 0.353 0.356 (avg.
0.358)
West Coast Paper Mills Ltd BSE Smallcap 0.85 0.357 0.361 (avg.
0.358)
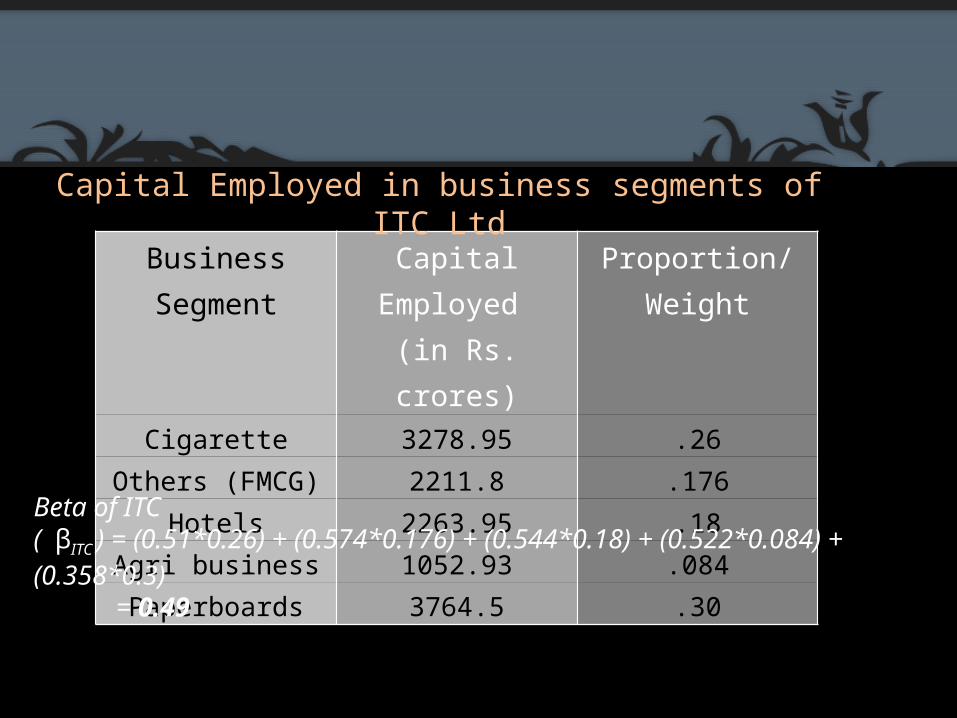
Business Segment Capital Employed (in Rs. crores)
Proportion/Weight
Cigarette 3278.95 .26Others (FMCG) 2211.8 .176
Hotels 2263.95 .18Agri business 1052.93 .084Paperboards 3764.5 .30
Beta of ITC ( βITC ) = (0.51*0.26) + (0.574*0.176) + (0.544*0.18) + (0.522*0.084) + (0.358*0.3) = 0.49
Capital Employed in business segments of ITC Ltd

Cost of Equity
Cost of equity = Rf + (Rm - Rf)*βL
Pure play Approach CAPM
7.4 + (21.25 – 7.4) * 0.483 = 7.4 + (21.25 – 7.4) * 0.652 =
Cost of equity (Ke ) 14.09% 16.43%
Risk Free Rate of Return Rf
7.4% Return on Treasury Bills issued by Indian Government for 10 years
Market Rate of Return Rm
21.25% Average market returns of Sensex on Daily basis * 250
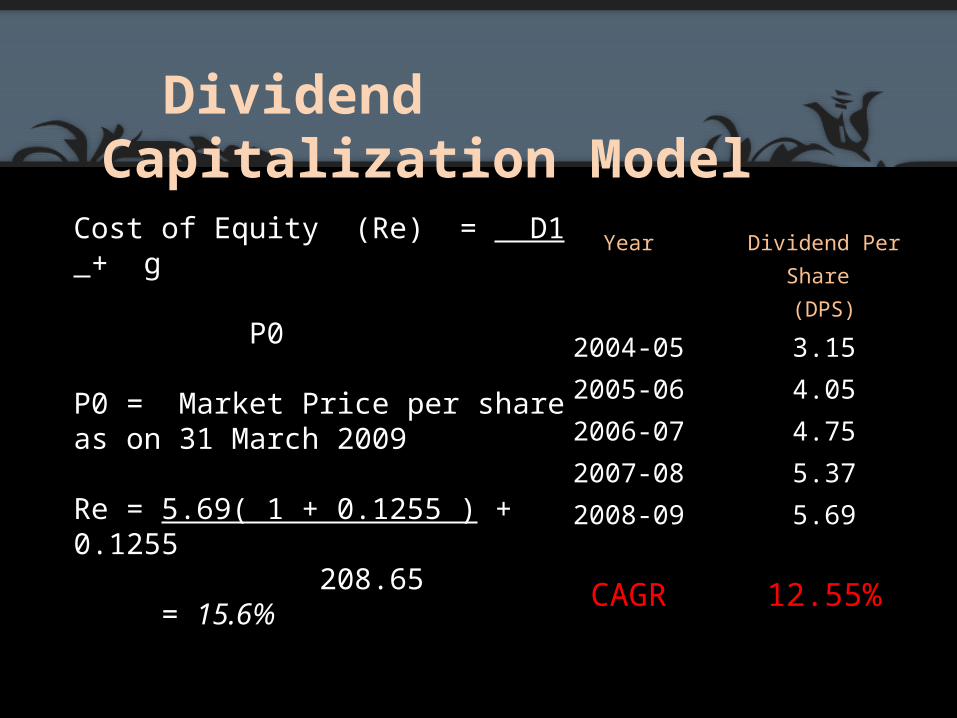
Dividend Capitalization Model
Year Dividend Per Share (DPS)
2004-05 3.152005-06 4.052006-07 4.752007-08 5.372008-09 5.69
CAGR 12.55%
Cost of Equity (Re) = D1 + g P0
P0 = Market Price per share as on 31 March 2009
Re = 5.69( 1 + 0.1255 ) + 0.1255 208.65 = 15.6%
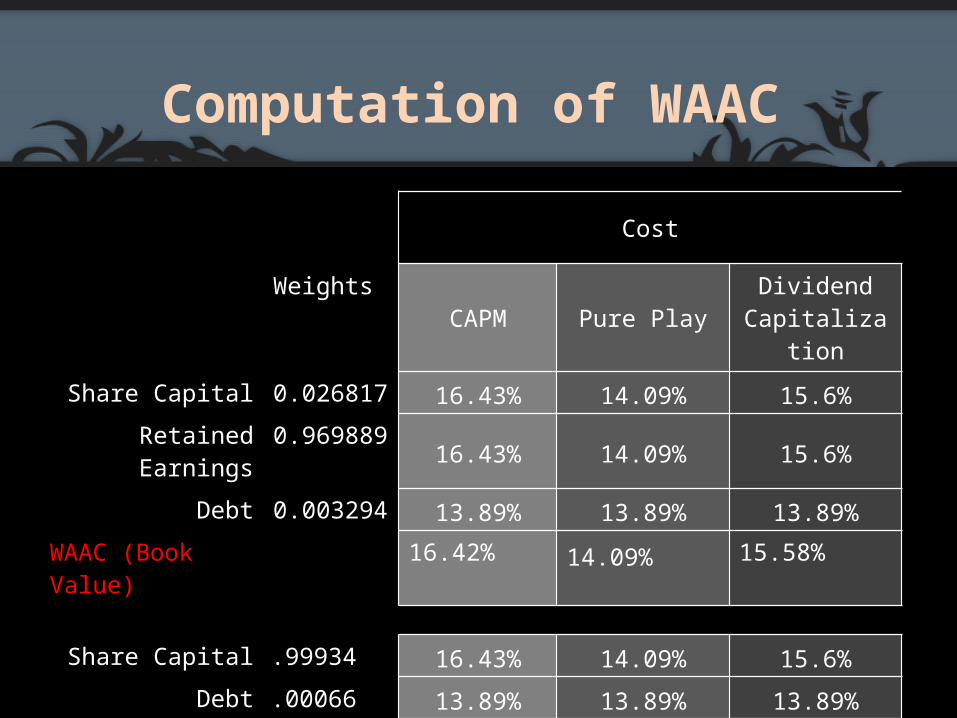
Computation of WAAC
Cost
WeightsCAPM Pure Play Dividend
Capitalization
Share Capital 0.026817 16.43% 14.09% 15.6%Retained Earnings 0.969889 16.43% 14.09% 15.6%
Debt 0.003294 13.89% 13.89% 13.89%WAAC (Book Value) 16.42% 14.09% 15.58%
Share Capital .99934 16.43% 14.09% 15.6%Debt .00066 13.89% 13.89% 13.89%
WAAC (Mkt. Value) 16.42% 14.08% 15.59%
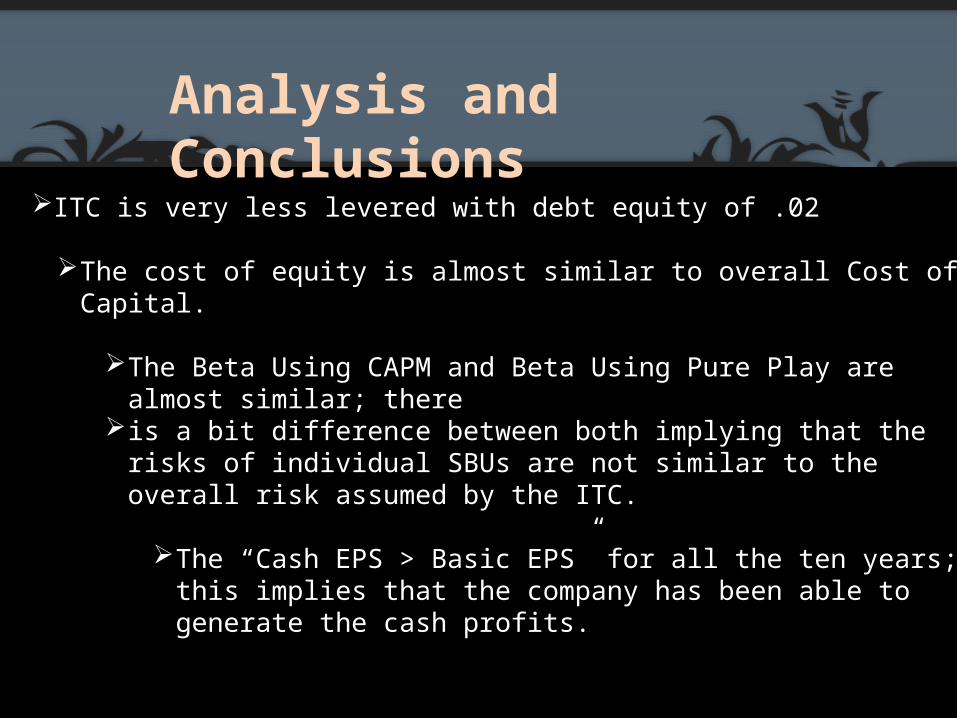
ITC is very less levered with debt equity of .02
The cost of equity is almost similar to overall Cost of Capital.
The Beta Using CAPM and Beta Using Pure Play are almost similar; there
is a bit difference between both implying that the risks of individual SBUs are not similar to the overall risk assumed by the ITC.
The “Cash EPS > Basic EPS” for all the ten years; this implies that the company has been able to generate the cash profits.
Analysis and Conclusions

Also the EPS has been consistently increasing depicting the +ve performance of the firm over the years.
The Cost of Capital tends to be lower i.e... In the range of 14% - 16%, this implies that the companies have a very low cut off point for any new and existing project.
Low cost also adds value to the firm.

THANK–YOU !!!!!!!